 Haiwen Liu
 Yuanze Xu
- 1City University of Macau, Macau, China
- 2Beijing Jiaotong University, Beijing, China
Amidst growing environmental challenges linked to coal dependence, fostering green innovation in new energy enterprises is vital for sustainable development in China. Although there have been studies on green innovation of new energy enterprises in recent years, few studies have been conducted from the perspective of ESG, whether informal environmental regulation represented by ESG can stimulate the green innovation of new energy enterprises is of great significance to China’s construction of a low-carbon and secure energy system. In this paper, from the perspective of informal environmental regulation, based on the ESG ratings of SynTao Green Finance’s first public new energy listed companies as an exogenous shock, and taking A-share new energy listed companies as a sample from 2010 to 2021, we empirically verified the effect and mechanism of ESG ratings on the green innovation of new energy companies in terms of the quantity and quality of green innovations by utilizing the Staggered Difference-in-difference (DID) model. The findings demonstrate that new energy enterprises’ green patent numbers and quality are greatly enhanced by ESG grading. However, there is clear heterogeneity in this green innovation effect, which is particularly visible in new energy firms with state-owned enterprise and greater enterprise scales and a higher level of digitization. The Mechanistic findings suggest that ESG ratings drive green innovation by alleviating financial constraints, reducing agency risk, and boosting R&D, thus providing empirical evidence for the development of a green innovation ecosystem in the new energy industry.
1 Introduction
In recent years, environmental problems have gotten increasingly severe, economic threats from climate change have intensified, and energy transition and carbon emission reduction have established a global consensus (Abid, 2017). The energy transition is an important step in addressing these challenges (Zou et al., 2016). The new energy sector is widely considered the future development trend, with many countries and regions actively pursuing its development to obtain a competitive advantage (Caineng et al., 2021). China is actively engaged in promoting the optimization of its new energy structure, attaining significant headway in both the scale and velocity of its development (Jiang et al., 2020). However, China is still facing increasingly serious environmental pollution, and the ongoing expansion of its energy use results in an increasing dependence on fossil energy imports and new challenges to energy security (Wang and Liu, 2017). Energy resources rely mainly on fossil fuels such as coal, which has a great impact on the environment and ecology (Zhao et al., 2022). Therefore, energetically expanding new energy firms is the key to building a clean and low-carbon energy system in China. To ensure the long-term success of China’s new energy companies, the level of green innovation must be consistently improved (Shao and Chen, 2022). Only autonomous green innovation within firms can accelerate and lower the cost of China’s green economic transition, and alleviate the acute resource and environmental crises. Green innovation has the potential to lower production costs and ease production-related environmental pressures. And it can also lower resource consumption and directly lower pollution emissions (Xu et al., 2023). Therefore, one of the keys to promoting the development of new energy enterprises is to improve the level of green innovation in enterprises, and it is very important to study the ways of mechanisms to promote green innovation.
In light of this, building a secure, equitable, and ecologically sustainable energy system is crucial (Song et al., 2022). Drawing on international experience, to lessen environmental pollution, the Chinese government has put in place many environmental regulation measures (Li et al., 2022) and promote sustainable growth (Lee et al., 2017; Li et al., 2023). Currently, China mainly relies on “top-down” environmental regulatory tools. For example,, China has implemented low-carbon city pilot programs and carbon emissions market pilot programs (Karmaker et al., 2021; Zhang et al., 2022). To ensure compliance, some enterprises will increase their green investment (Liu et al., 2020). However, some scholars have pointed out the need to recognize its limitations (Chang et al., 2023). Owing to differences in planning for economic development between the central and local governments, it is difficult to implement specific policies, either insufficiently or “one-size-fits-all” over-execution, which is costly and inefficient, and it is difficult to accomplish the anticipated governance effects (Ming et al., 2014). Excessive environmental laws imposed by the government have been demonstrated to raise production expenses for companies (Murty and Kumar, 2003), decrease their overall factor productivity (Ming et al., 2014), and lower the international competitiveness of firms (Cole and Elliott, 2003). At the same time, local governments may form complicit relationships with polluting firms (Biswas et al., 2012). Therefore, to reduce the current constraints of environmental regulation, firms need to actively obtain non-environmentally regulated incentives and monitoring from external sources to promote green innovation. This will not only enhance the incentive of companies to actively implement green innovation but also help to play the role of market incentives and external monitoring mechanisms (Shen et al., 2023). So how can we help enterprises obtain non-environmental regulations from the outside to mitigate the negative impacts of a single governance model?
Informal environmental regulation plays an increasingly important role in environmental governance as public awareness of environmental protection increases, and has a “bottom-up” impact on environmental governance compared to formal environmental regulation that forces firms to implement green innovations (Zhao et al., 2022). Policymakers and responsible investors are increasingly focusing on the three factors of environment, society and governance (Deng et al., 2023). Governance (ESG) factors are getting more and more attention from policymakers and investors (Deng et al., 2023). ESG is one kind of informal environmental regulation. As a practical manual for sustainable growth, ESG interprets the idea of fusing corporate governance, social responsibility, and environmental preservation (Li et al., 2023). ESG information is one of the important contents of listed companies’ communication with investors. Enterprises with good ESG performance gain more support from stakeholders and have more advantages in promoting corporate green innovation. So, how do we give full play to the external incentive and supervision mechanisms of fresh energy companies to drive fresh energy companies to take the initiative to carry out green innovation, what role does the ESG rating play in it, and what is the mechanism of its role? The existing literature has rarely explored this issue. Therefore, in view of informal environmental policy, this paper studies the mechanism for the influence of ESG ratings on green innovation, which will help to provide feasible solutions for fresh energy companies, encourage green innovation in new energy firms and increase green growth rates.
The following are this paper’s marginal contributions: First, theoretically speaking, this study unifies the creation of green innovation technologies for new energy businesses with ESG ratings. It examines how new energy companies can use ESG ratings to enhance their internal and external information environments when government subsidies are no longer sufficient to support their internal innovation. It also connects these companies with the market, offers market-oriented governance with appropriate incentives for their green innovation, and coerces new energy companies to engage in green innovation through external supervision mechanisms and market incentives. The research in this paper not only provides theoretical references and policy insights for new energy enterprises to establish a market-oriented green development system, but also enriches the relevant literature on ESG research. Second, green innovation in new energy companies is mostly analyzed from the standpoint of regulation of the environment. This paper will start from the standpoint of non-environmental regulations, combined with the characteristics of new energy enterprises themselves, in-depth analysis of the direction of the influence of ESG on the green innovation ability of companies, the mechanism of the influence, and heterogeneity of the factors, which is conducive to clarifying the role of the mechanism of the impact of informal environmental regulation, and provide ideas for the optimization of green development policies. Green development policy to provide ideas. Third, in terms of empirical research, this paper employs a Staggered Difference-in-difference (DID) approach to investigate the influence of ESG on green innovation in new energy firms, which can effectively address the issue of endogeneity when compared to the direct use of ESG rating data. Finally, the conclusions of this paper are conducive to providing empirical experience for the construction of China’s ESG rating system, which can also provide theoretical support for China’s energy transition policy.
2 Literature review and research hypotheses
2.1 Literature review
2.1.1 Research on ESG ratings
The concept of ESG is a further interpretation of Corporate Social Responsibility (CSR), which not only enriches the content of CSR, but also conforms to today’s social development. The basic idea is to integrate social responsibility, corporate governance and environmental protection into a strategy focused on sustainable development (Tan and Zhu, 2022). With the growth of green sustainability, more and more enterprises began to make ESG disclosure, and a large number of scholars began to study ESG. current research on ESG ratings is from two reasons, on the hand, from the departure of ESG ratings itself, mainly to study the drivers affecting its development; on the other hand, to study the economic impacts of ESG ratings. From the viewpoint of drivers of ESG ratings, one is external factors such as government actions and market stakeholders; the second is internal factors mainly equity structure, corporate governance, and digitalization (Fang et al., 2023). It was found that there is a favorable association between environmental regulations and high-quality growth (as measured by ESG) among external factors (Wang and Wang, 2022). However, Meng et al. (2023) argued that there may be collusive behavior between the government and firms, resulting in pollution of the environment. In addition to government behavior, external institutions play a pivotal role in enhancing firms’ Environmental, Social, and Governance (ESG) ratings by augmenting scrutiny over their environmental investments (Jiang et al., 2022). Concerning internal factors, state-owned enterprises, compelled by national sustainable development policies, are obligated to adhere to ESG ratings. Furthermore, state-owned enterprises, in terms of ownership, exhibit a propensity for higher ESG ratings compared to their non-state-owned counterparts (Tsang et al., 2023). In terms of corporate governance, society’s trust in firms promotes ESG, with particularly female boards of directors facilitating this effect (Elmagrhi et al., 2019; Qiu et al., 2023). In addition, scholars have also found that digitalization can advance corporate ESG development, especially with big data and blockchain technology (Dou et al., 2023).
There have been more studies related to the economic impact of ESG in recent years, and the disagreement among scholars mainly focuses on whether corporate ESG is effective or not, with the majority of proponents and providing evidence on various aspects. For example,: from a risk management perspective, ESG enhances firms’ below-capacity to cope with stock market crashes and various other risks (Silva, 2022). Good ESG performance also generates moral capital, which has an insurance effect and reduces firm risk (Lins et al., 2017). Second, from the management perspective, ESG is beneficial in preventing management deception and improving company management level (He et al., 2022). At the level of corporate performance as well as economic value, ESG contributes to increasing company value and easing funding restrictions (Cheng et al., 2014; Albuquerque et al., 2019). Further research shows that firms that voluntarily disclose CSR have higher firm value (Bucaro et al., 2020). Even when companies reveal shortcomings in their CSR practices, practice shows that firms that choose to disclose exhibit higher market value in contrast to businesses that decide not to reveal (Blacconiere and Patten, 1994; Matsumura et al., 2014). At the same time, there are contrary voices that argue that a company’s ESG rating can have negative effects on the firm. First of all, managers will use corporate responsibility disclosure to manipulate the company’s reputation, and they will “greenwash” the company’s actual situation (Ingram and Frazier, 1980). Moreover, due to the information transfer effect, corporate management will use exploit ESG data to deflect investors’ attention. and disguise poor financial performance (Saini et al., 2023). Finally, the same company may experience ESG evaluation divergence due to the various data sources and models used by different rating agencies. This will negatively affect the demand for stocks; the more divergence in a company’s rating, the more volatile its stock returns will be and the more expensive external financing will be (Christensen et al., 2022).
2.1.2 Research on green innovation in enterprises
Green innovation is defined as new technologies developed to carry out environmentally friendly measures (Castellacci and Lie, 2017) such as preventing pollution (Ma et al., 2021), protecting the environment (Wang and Jiang, 2021), and saving energy consumption (Habiba et al., 2022). It can help enterprises reduce pollution emissions and facilitate internal technological innovation. It also increases the value of the enterprise while improving its overall productivity (Dangelico and Pontrandolfo, 2015). Given the growing environmental problems, it is urgent to promote corporate innovation (Flammer et al., 2021). Currently, research on the elements that influence green innovation is mainly categorized into internal and external aspects. In terms of internal corporate governance, existing studies mainly focus on ownership structure (Amore and Bennedsen, 2016) executive characteristics (He et al., 2021), and board characteristics (He and Jiang, 2019). Amore et al. (2013) discovered an association between the amount of corporate governance and the extent of green innovation in firms. Ineffective corporate governance practices were found to have adetrimental impact on green patents, leading to a simultaneous decrease in the quantity and quality of firms’ green innovations. Further research has found that executives with knowledge of green innovation obtain more reliable green information that is more likely to be translated into actual technology (Post et al., 2011). In addition, boards of directors with internationa experience encourage company’ green innovation and are positively associated with the quality of green innovation (Quan et al., 2021). Finally, from the absorptive capacity perspective, board capital was discovered to be positively associated with green innovation capacity (Yousaf et al., 2022). The external corporate governance aspect mainly includes government-led environmental regulation as well as stakeholder-led non-environmental regulation studies. Classical economic theory (Palmer et al., 1995) suggests that environmental regulations raise business operating expenses and hinder green innovation. Moreover, environmental regulation adversely affects energy-consuming firms (Zhang et al., 2022). Porter’s hypothesis suggests that suitable environmental regulations will motivate corporations to engage in green innovation activities (Porter and Van der Linde, 1995) and produce a certain degree of “innovation compensation” for firms. Further research has discovered that environmental regulation have an incentive effect on enterprises to engage in green innovation activities, resulting in a large increase in the quantity and quality of green innovations (Liu et al., 2022; Li et al., 2023). From the stakeholder level, existing studies have found that consumer pressure on firms can promote their green innovation (Zhang and Zhu, 2019). Stakeholders such as ESG-related shareholders and institutional investors have also been found to influence green innovation (Cotter and Najah, 2012). However, studies have shown that green innovation in different industries is impacted differently by ESG ratings, for example, ESG ratings promote the development of green technologies in manufacturing (Tan et al., 2024). ESG ratings in high-tech businesses have a stronger impact on encouraging corporate green innovation in comparison to non-high-tech sectors (Chen et al., 2023). By combing the impact of ESG ratings on green innovation in different industries, it is found that the efficiency of ESG as a non-environmental regulation on green innovation in different industries has not yet reached a consensus, and there is no exploration of this issue on new energy enterprises, which is a research gap, so exploring the ESG on green innovation in new energy enterprises is of great significance.
Energy companies, which are mainly resource-consuming, are more in need of strengthening endogenous green innovation technology, and China’s new energy enterprises are highly integrated, technologically demanding, and weak in risk-bearing ability (Løvdal and Neumann, 2011). China’s new energy industry has poor green innovation capacity. There are two main reasons for this through domestic scholars’ research: first, the internal R&D funds for new energy enterprises’ innovation are insufficient. Enterprises should ensure that there is sufficient funding within the company for green innovation (Hansen and Birkinshaw, 2007), but new energy companies face problems such as lack of internal funds and financing constraints due to high construction and operation costs (Manso, 2011). Secondly, the level and tendency of innovation is not high, and there is a gap with foreign advanced technology, some key equipment needs to be imported from foreign countries (Chemmanur et al., 2014), and the ability of innovation needs to be improved. In the past, researchers have proposed that new energy enterprises should depend on government assistance (Zhao et al., 2022), using government subsidies as the key policy. The influence of government assistance on green innovation was emphasized (Zeng et al., 2018), and it has been demonstrated that government subsidies can help with the problems of the new energy industry’s low R&D expenditure and low innovation efficiency, which supports the green innovation activities of the enterprises. However, Research suggests that government subsidies do not significantly increase the green innovation capacity of new energy enterprises. Even if they increase the quantity of green patents, they cannot ensure the quality of the inventions (Dang and Motohashi, 2015; Fisch et al., 2017). Moreover, some studies have found that subsidies set by the government, which are based on environmental regulations, have generated speculative behaviors of firms to expand production capacity instead of R&D and innovation. The study suggests that government-led environmental regulation in the utility of the new energy sector, while having some positive impacts, also has its limitations. In recent years, researchers have considered the factors that influence ESG ratings on new energy firms as non-environmental regulations. In the study of ESG and new energy enterprises, it is found that there are consistently higher return spillovers between new energy, ESG and green finance (Jiang et al., 2023). ESG ratings can enhance the financial results of new energy companies (Liu et al., 2022). The ESG and the stability of new energy firms is shaped by an inverted “U” (Anwer et al., 2023). In summary, the research on ESG ratings and green innovation is mainly a study of how external stakeholders influence green innovation through the signals conveyed by ESG ratings. In recent years, some studies have also investigated the influence of ESG ratings on green innovation in the context of industrial heterogeneity, and the findings differ by industry. However, exploring the influence of ESG ratings on green innovation of new energy enterprises is less, the existing research on ESG ratings and new energy enterprises associated primarily focuses on the connection between ESG on new energy companies in the internal financial performance, stability, and external green finance, and less literature on direct research on green innovation, and it is still unclear how new energy companies’ green innovations relate to their ESG ratings and there is a research gap.
In summary, existing studies on ESG ratings have focused on the drivers of ESG ratings as well as economic impacts. Corporate green innovation has centered on both internal and external concerns. Regarding internal governance, the ownership structure, executive characteristics, and board characteristics have emerged as influential factors driving green innovation. By examining these factors, scholars have gained insights into the mechanisms through which organizations foster and promote green innovation. Among the external factors, environmental regulation conducted by the government as well as non-environmental regulation conducted by market interests are examined. Nevertheless, research on how ESG ratings affect green innovation shows that different industries are in agreement on nothing, especially focusing less on heavily polluting energy companies. Researchers have only recently begun to examine the effect of ESG ratings on the innovation of new energy firms from an external, non-environmental regulatory perspective. To date, most studies have looked at how government environmental regulation affects the creative activities of these firms. However, studies rarely address the impact on green innovation and ignore whether there is speculation in the dynamics of ESG ratings driving green innovation. Given this, this paper examines the relationship between ESG ratings and green innovation in new energy companies from the perspective of informal environmental regulation. It accomplishes this by examining the potential impact and mechanism of ESG ratings on green innovation in new energy firms, as well as including both quantity and quality data into the analysis to better evaluate green innovation and prevent enterprise speculation. We use data from A-share listed businesses to carry out an empirical analysis of the relationship between ESG ratings and green innovation in new energy industries to better understand the influencing elements.
2.2 Theoretical analysis and research hypothesis
2.2.1 ESG rating and green innovation of new energy enterprises
New energy enterprises need to search and obtain external green innovation information and resources through different channels to reduce green R&D costs. Green innovation can be a forward-thinking strategy for companies to manage the ecological environment, which helps energy enterprises construct technological barriers, build core competitiveness, and carry out energy transformation (Wang et al., 2022). However, China’s new energy enterprises often encounter greater difficulties than other enterprises in attracting financing from the outside world, mainly due to two reasons: the first is that, due to the late start of China’s new energy companies, their poor innovation ability, and the lower transparency of the financial statements and the incomplete history of the credit record and other characteristics, which leads to the information asymmetry between the external investors of new energy enterprises. External investors are unwilling to bear higher investment risks, and new energy enterprises are vulnerable to credit discrimination in green innovation (Carpenter and Petersen, 2002). Secondly, new energy enterprises engaged in green innovation must concurrently consider the imperative of environmental preservation and the associated costs of mitigating environmental impacts. As these enterprises strive to reduce their environmental impacts, the costs associated with research and development tend to escalate, thereby diminishing their rate of return. Consequently, when external investors are confronted with heightened uncertainties regarding potential returns and associated risks, their inclination to invest in such enterprises diminishes (Doran and Ryan, 2012), Information asymmetry is created between external stakeholders and the enterprise. Under information asymmetry, external stakeholders are unable to effectively monitor the majority shareholders and the management of the enterprise and lack risk tolerance, which makes them more inclined to invest in short-cycle, low-risk conventional projects (Amore et al., 2013).
However, ESG ratings provide a channel for firms to obtain green innovation knowledge and information from external sources, reducing the constraints of information asymmetry on green innovation. Spence’s (1974) signaling theory explains the asymmetry of information. The signals sent by the company can help external stakeholders to assess the company’s quality, as ESG ratings and related information can improve the transparency of information in the capital market, and can more clearly demonstrate the real competitive advantages of firms (Kirmani and Rao, 2000). According to signaling theory, ESG ratings can be regarded as a positive signal that shapes the image of corporate social responsibility (Tamimi and Sebastianelli, 2017) and attracts more investors who uphold the concept of sustainable development (Dyck et al., 2019). This helps companies to finance green innovation and provides an incentive for new energy companies to undertake green innovation activities and increase the number of innovations they produce (Cheng et al., 2014). Positive ESG performance can also attract potential consumers, excellent talents, suppliers, and distributor that prefer the concept of sustainable development (Dai et al., 2021), and reduce some of the possible risks (Chen and Xie, 2022; He et al., 2023). Among other things, the excellent talents attracted, who bring green innovation expertise and key information (Shropshire, 2010), are conducive to new energy enterprises making high-quality green innovation strategic decisions, and can carry out substantial green innovations to raise the market worth and competitiveness of the business (Huang and Li, 2017), which in turn improves the quality of enterprise green innovation. ESG ratings can alleviate the problems caused by information asymmetry, send positive signals to the outside world through green information disclosure, break down information barriers with external stakeholders, and encourage new energy enterprises to take the initiative to implement the “quality and quantity” of green innovation.
Therefore, research hypothesis 1: ESG ratings can promote the “increase in quality and quantity” of corporate green innovation.
2.2.2 ESG ratings, financing constraints and green innovation of new energy enterprises
Many new energy companies encounter the difficult “valley of death” conundrum, in which they are hampered in their green innovation operations due to financial restrictions. The technical characteristics of new energy enterprises, such as high entry barriers, substantial capital requirements, long R&D cycles, and complex strategic dynamics, contribute to high investment risks. Consequently, these enterprises often experience situations where there are “inputs but no outputs” (Kong et al., 2021), exacerbating the problem of financing difficulties. In the new energy industry in china, traditional financing methods primarily include bank loans, listed financing, and government subsidies. However, non-state new energy companies encounter difficulties in obtaining bank loans due to “ownership discrimination” by commercial banks (Lu et al., 2012). The listing process is arduous, and due to the prolonged return on investment cycle associated with the strong technical attributes of new energy enterprises, many promising enterprises are rejected (Qi et al., 2017). Furthermore, the gap in government subsidies has been widening year after year, making the “financing difficulty” a vulnerability to the sustained and robust development of the new energy sector (Ouyang and Lin, 2014). Addressing the challenge of reducing financial restrictions for new energy organizations is crucial to promoting green innovation within these enterprises.
Corporate ESG advantages provide a feasible solution to this problem; first, ESG ratings are a business philosophy that pursues long-term value. From a credit perspective, firms with ESG rating advantages may disclose information more actively, expressing a strong ethical and social one-is image of the company, which boosts the company’s credibility (Kim and Li, 2021; Tan and Zhu, 2022), reduces the bank’s lending restriction on the firm, and prompts the bank to issue loans to the firms with high ESG ratings (Houston and Shan, 2022), reducing the financing cost of enterprises and contributing to a growth of green innovations. Meanwhile, in terms of external financing and government subsidies, companies with high ESG ratings not only attract more external investment for innovation but also compensate for the lack of internal R&D funding due to insufficient government subsidies (Zhang et al., 2023). Because green-conscious investors are more willing to pay a higher premium for companies with high ESG ratings, and thus high ESG ratings can reduce the cost of equity financing (Pástor et al., 2021), green-conscious investors are more vocal when participating in green innovation strategy decision making that favor the improvement of green innovation quality. Therefore, new energy companies with high ESG ratings can receive more external financial support, which is conducive to alleviating the financing constraints of enterprises.
Hypothesis 2:. ESG ratings can promote the “quality and quantity” of green innovation of new energy enterprises by alleviating financing limitations.
2.2.3 ESG ratings, agency risk and green innovation of new energy enterprises
Green innovation in new energy enterprises is a long-term investment that will raise short-term operating and governance costs. But, the separation of the two powers of modern enterprises has formed a series of principal-agent relationships, the interest orientation and pursuit of different goals between the owners and managers of the company cause the loss of interest is known as agency costs (Jensen and Meckling, 2019). Corporate managers are more concerned about their reputation and career risks (Faccio et al., 2016). They pay more attention to the current performance of the firm and abandon long-term projects with higher risks (He and Tian, 2013; Fang et al., 2014). This short-sighted behavior of the management will lead to lower investment efficiency, which will affect their future competitiveness (Wu et al., 2022).
ESG ratings can reduce the monitoring costs of shareholders, strengthen the shareholder monitoring mechanism (Miller, 2006), avoid management’s short-sighted behavior, and force the management to carry out green innovations to enhance the company’s sustainable development capability (Li et al., 2023). Meanwhile, the ESG performance of the company during the management’s tenure has been used as an important part of the management’s performance, and the performance is linked to the salary and compensation, excellent ESG ratings will increase the salary level of the managers, and managers tend to increase their risk-taking ability for their interests (Dunbar et al., 2020), to avoid the shortsightedness of the management, to carry out more long-term project investment that increase the number of green innovations. In addition, management not only pays more attention to green innovation issues, but also performs governance functions more actively out of the maintenance of personal reputation (Hambrick, 2007), it encourages businesses to invest in high-quality green innovation activities that increase corporate value and enhance the quality of corporate green innovation (Cucari et al., 2018). Therefore, enterprises with ESG ratings can help decrease management’s shortsightedness and encourage green innovation by management. to “increase the quantity and improve the quality".
Hypothesis 3:. ESG ratings can reduce agency risk and encourage the “quantity and quality” of green innovation in new energy companies.
2.2.4 ESG rating, R&D investment and green innovation of new energy enterprises
At present, different new energy enterprises in China have great differences in their R&D bases. The new energy industry has a high core technology threshold, and the competition among enterprises is more on technological innovation. R&D investment, especially green innovation investment, determines the innovation and application of enterprise technology. However, enterprise innovation is associated with considerable risk., long return on investment cycle, high sunk cost, etc., and the social benefit is often greater than the enterprise benefit, which will reduce incentives for firms to increase R&D investment (Arrow, 1972; Jones and Williams, 1998). The shortcomings of China’s new energy enterprises, which rely mainly on government subsidies, have also emerged. The government’s financial pressure is increasing, and the subsidy gap is expanding year by year, which makes it impossible to subsidize new energy enterprises sustainably (Li et al., 2018); some enterprises invest in low-technology threshold projects in order to obtain subsidies, and blindly expand their production and neglect R&D innovation (Lerner and Wulf, 2007). It is not advantageous to companies’ R&D investment, which weakens the intrinsic innovation motivation of new energy enterprises and prevents them from innovating green technologies.
ESG ratings can force new energy firms to increase their R&D investment. On the one hand, ESG disclosures can provide information on corporate R&D investments (Hamrouni et al., 2019), increase the transparency of information on corporate R&D activities (Raimo et al., 2021), which promotes the connection between corporations and relevant stakeholders (Wu et al., 2021), and it also helps address the problem of adverse choice (Yang et al., 2018; Kong, 2023). Thus, it motivates new energy companies to invest in innovation and increase the amount of green innovations. On the other hand, in order to obtain higher ESG ratings, enterprises will adopt cleaner production processes, reduce pollution emissions, and maintain good relationships with shareholders, employees, and consumers (Mallinet et al., 2013), and this series of activities will increase the pollution management and operation and management costs of enterprises. At this point, profit-maximizing firms will seek more green technologies to reduce costs and enhance the quality of green technologies by expanding R&D investment to meet their own development needs (Joshi and Hanssens, 2010). In general, under the cost constraints generated by ESG ratings, firms will expand their internal R&D investment for green innovation., and with the help of these green technologies, not only will they be able to reduce their pollutant emissions, but also improve their operational efficiency, which will increase the “quality and quantity” of their green innovations throughout the procedure.
Hypothesis 4:. ESG ratings can improve the “quality and quantity” of green innovation in new energy companies by raising R&D expenditure. This paper summarizes the specific impact mechanisms as shown in Figure 1.
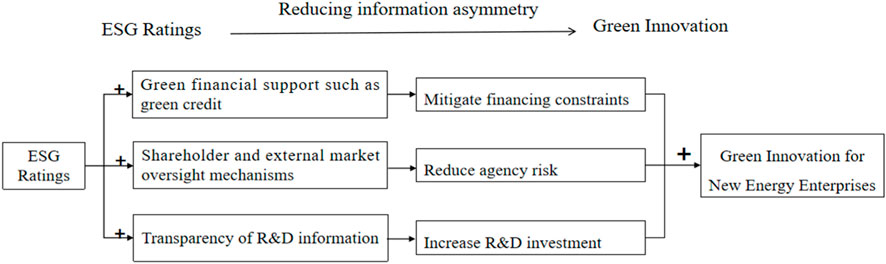
Figure 1. Theoretical framework diagram
3 Research design
3.1 Selection of the research sample and data sources
This research uses data from Chinese A-share-listed new energy companies from 2000 to 2021 as samples and uses the multi-temporal double-difference approach to investigate the impact of ESG ratings on the “incremental quality improvement” of green innovation in enterprises. Screen out new energy enterprises in Wind. The main business of new energy enterprises includes five categories: photovoltaic power generation or photovoltaic product manufacturing, wind power generation or wind power product manufacturing, biomass power generation, lithium battery manufacturing, and new energy vehicles. To assure data accuracy, the samples are then inspected and processed as follows: (i) ST and *ST-type companies are excluded. (ii) research samples with missing primary data are excluded; (iii) financial categories and companies that contain financial business operations are excluded. Shrinking Continuous Variables at the 1% and 99% Deciles in Stata. The China Research Data Service Platform (CNRDD) provides corporate green innovation data, the WIND database provides ESG rating data, and the CSMAR database contains all other data.
3.2 Empirical models
In order to examine the influence of ESG ratings on the “quality and quantity” of corporate green innovation, this paper treats the ESG ratings of the first listing of SynTao Green Finance. as a quasi-natural experiment, and constructs the following model by utilizing the multi-temporal difference-in-differences (Staggered Difference-In-Differences) method:
where the explanatory variable
In order to further examine the dynamic effects of ESG ratings and conduct a parallel trend test, this paper refers to Chen et al. (2023) and constructs the following model:
Where
3.3 Variable design
3.3.1 Explained variables
The explanatory variable green innovation measures the level of green innovation of the firm. The number of green innovations is measured according to the method of Lian et al. (2022). Quality of green innovation is measured according to Zhang et al. (2023). Considering that the amount of green patents, green utility patents and green invention patent applications are count variables, which may exist as 0 and affect the normal distribution of the dependent variable, to satisfy the assumptions of the linear regression and to improve the fitting effect and reliability of the model, this paper adds one to take the logarithm of the data.
3.3.2 Explanatory variables
The explanatory variable
3.3.3 Control variables
Drawing on previous research this paper also control influential factors that may affect firms’ green innovation, including firm’s size (Size); firm’s return on total assets (ROA); firm’s gearing (Lev); firm’s age at listing (Age); firm’s business revenue growth rate (Growth); and other factors such as the proportion of first shareholder’s shares (Top1), number of directors (Bs); and other factors that affect the level of firm’s green governance. this paper also controls for firm (Firm) and year (YEAR) fixed effects.
4 Empirical analysis
4.1 Descriptive analysis
Table 1 displays the model’s primary statistics and all of the variables have their original values. According to the table, the mean values of GreenPatent, GreenUtility, and GreenInvent are 7.936, 5.343, and 3.627. The mean value of ESG_DID is 0.104, indicating that there are in the control variables 10.4% of the sample enterprises have ESG ratings. Among the control variables, the mZean value of Age of the sample enterprises is 15.42, which show that the age of the sample enterprises is small; the maximum and minimum values of Size are 27.55 and 16.70 indicating that enterprises of different sizes are included in the sample; The sample businesses’ high gearing ratio is indicated by the mean value of Lew, which is 0.545; their smaller shareholding concentration is indicated by the mean value of Top1, which is 35.31; their better business performance is indicated by the mean value of ROA, which is 0.0360; and the remaining variables are all within reasonable ranges.
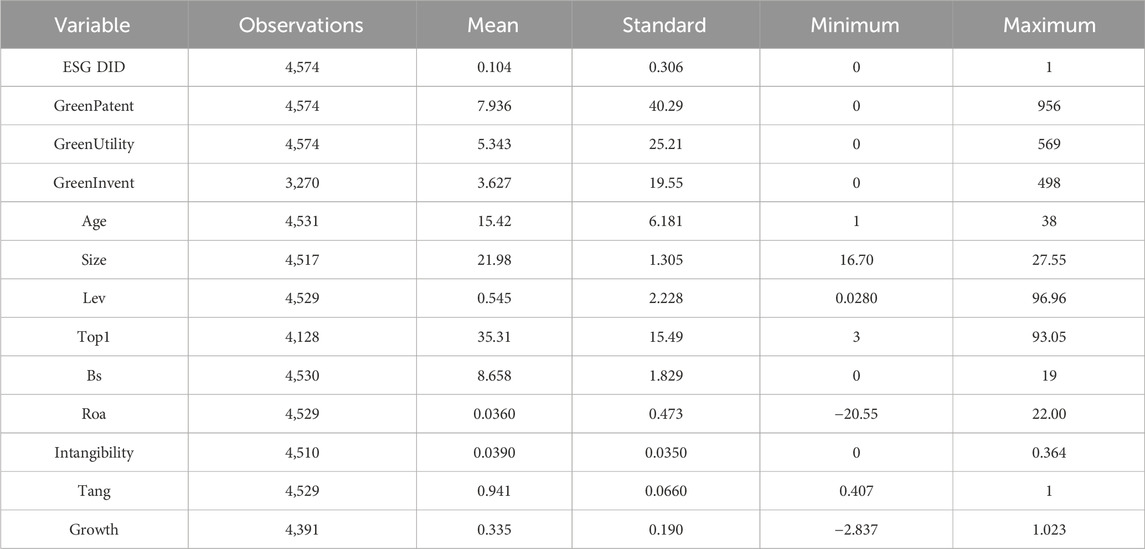
Table 1. Descriptive statistics for key variables.
4.2 Benchmark regression
Table 2 displays the results for the effect of ESG ratings on the “incremental quality” of corporate green innovation. All regressions control for firm and year fixed effects. According to the results in columns (1), (3) and (5), the ESG_DID coefficients are 0.844, 0.458, and 0.691, respectively, and are significant at the 1% level through the significance test, showing that the increase in ESG rating of the company increases the amount of Green patents, the amount of Green innovations, and the amount of Green invent by 84.4%, 45.8%, and 69.1% respectively, which provides preliminary empirical evidence for the theoretical hypotheses of this paper. This also gives empirical support to the theoretical premises of this article. And after adding the control variables, the coefficients of ESG_DID from columns (2), (4) and (6) are 0.410, 0.646 and 0.523 respectively, which still pass the test, indicating that ESG ratings can encourage enterprises’ green innovations and significantly improve both in quantity and quality.
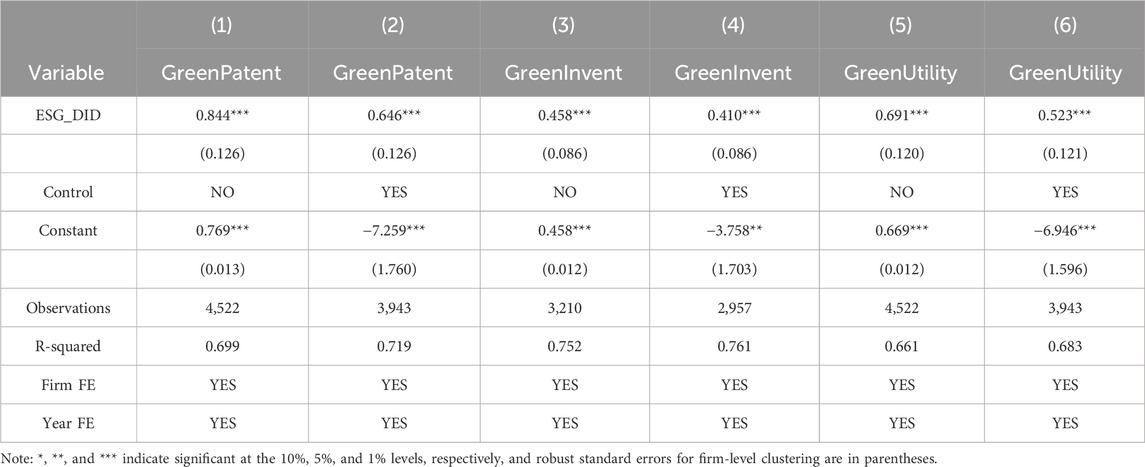
Table 2. Return to baseline.
4.3 Robustness checks
4.3.1 Parallel trend test
The double-difference approach must fulfill the parallel trend test assumption, there should be no systematic differences between firms with and without green innovation before ESG policies are conducted. As a result, this research uses the parallel trend test approach proposed by Jacobson (Jacobson et al., 1993). In this study, we test the dynamic impact of ESG ratings on GreenPatent, GreenUtility and GreenInvent using model (2), and the findings are shown in Figure 2A. Before ESG rating, GreenPatent, GreenUtility, and GreenInvent do not have significant differences and satisfy the assumption of parallel trend; after ESG rating, GreenPatent, GreenUtility, and GreenInvent of the treatment group have a significant increase compared with the control group After the ESG rating, the GreenPatent, GreenUtility and GreenInvent of the treatment group increased significantly in comparison to the control group, demonstrating that the ESG rating plays a function in encouraging the “quality and quantity” of corporate green innovations.
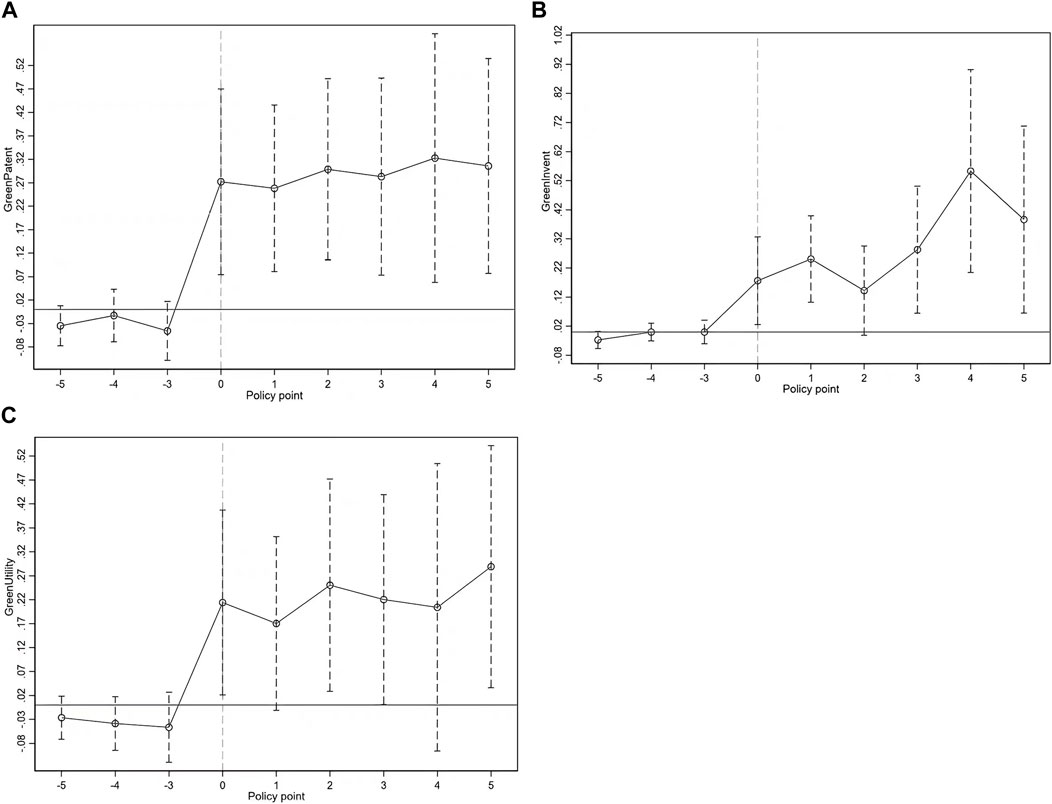
Figure 2. Parallel trend test.
4.3.2 Placebo test
To determine if the effect of ESG ratings on the “quality and quantity” of corporate green innovation is due to chance, this research uses a placebo test. According to Cao and Chen (2022), we created “pseudo-policy dummy variables” by randomly choosing 500 times based on the distribution of ESG rating variables in the baseline regression, then re-regressed the estimation with the model (1) to assess the distribution of coefficients and p-values. As shown in Figure 3, the mean value of the regression coefficients of GreenPatent, GreenUtility, and GreenInvent on the “pseudo-policy dummy variables” is close to 0, and the majority of the p-values are above the 0.1 line and insignificant at the 10% level, indicating that the test was passed. The test was passed, suggesting that it is not by accident that ESG ratings have an impact on the “quality and quantity” of corporate green innovation.
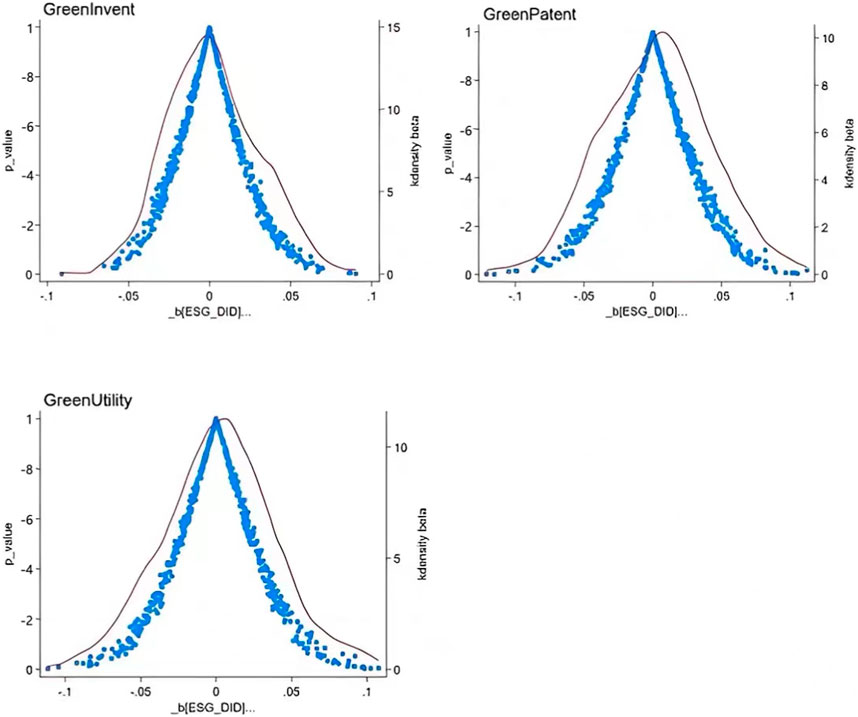
Figure 3. Placebo test.
4.3.3 PSM—DID
Due to the fact that rating agencies may disclose information to companies with sufficient information, there may be sample selection issues. Therefore, to address this issue, propensity matching (PSM) is used to re match control groups and reduce selection bias in sample selection. Using K-nearest neighbor matching, after removing a few unmatched samples, the DID model was used for retesting, and the results are shown in columns (1), (2), and (3) of Table 3. The regression coefficients are 0.452, 0.329, and 0.251 respectively, and the results are all significant, indicating that there is no serious problem of sample selection bias, and the conclusions obtained were reliable.
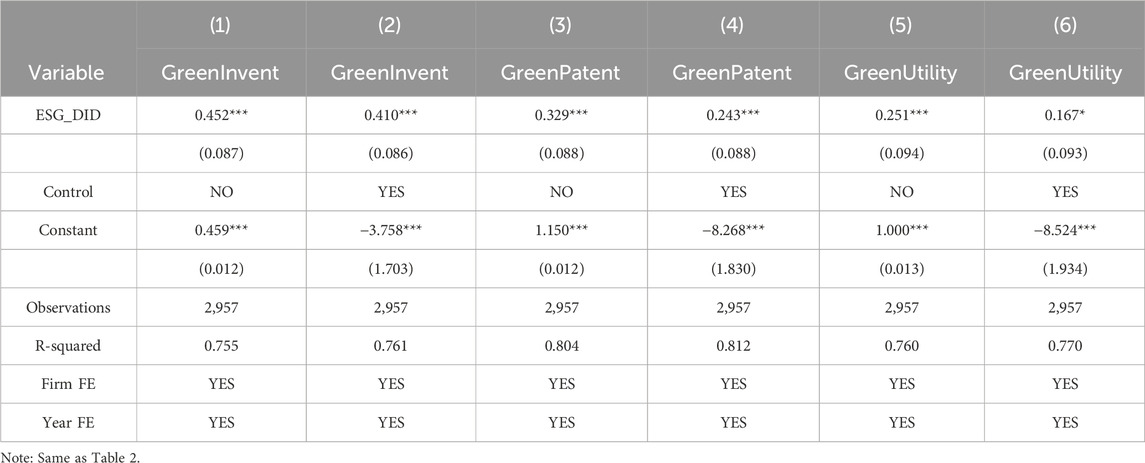
Table 3. PSM—DID test results.
4.3.4 Replacement variables
At present, in addition to the Business Gateway Green Index, the ESG rating data of CSI, Bloomberg, Wind and other companies are also widely used in the study. The CSI rating index is used to reconstruct the explanatory variables to further test the influence of ESG ratings on the “quality and quantity” of company green innovation. And given that the CSI ESG ratings system covers a large number of companies, it is more appropriate to directly utilize the CSI ratings data as the explanatory variables (Deng et al., 2023). Drawing on (Tan et al., 2024) the practice of assigning values from one to nine to the nine ESG ratings, with larger values indicating higher ratings. Table 4 shows, the regression coefficients of CSI ESGs are 0.049, 0.087, and 0.077, which are all significant at 1%, proving that the results are robust.
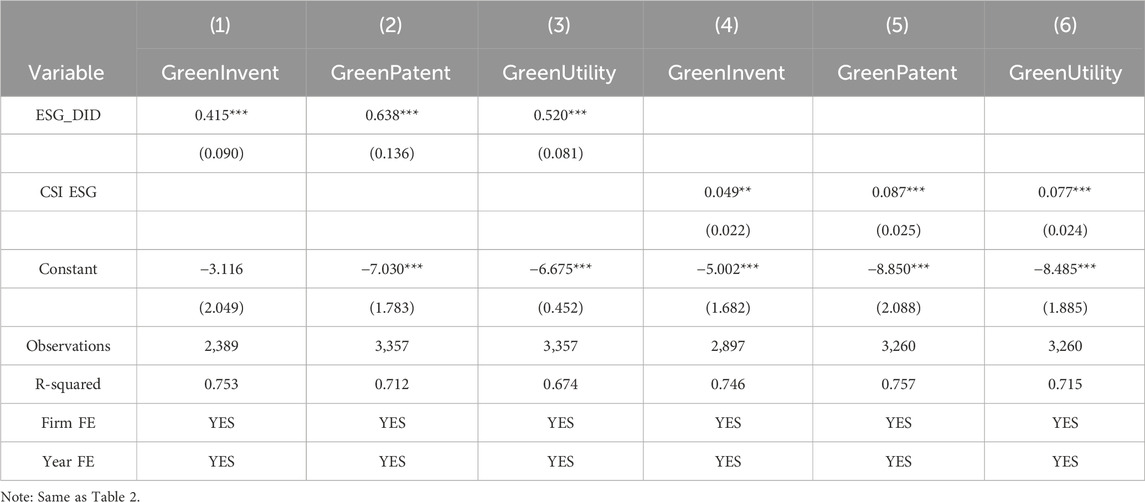
Table 4. Robustness test results 1
4.3.5 Change the time interval
The COVID-19 outbreak in early 2020 severely impacted business performance, and the emergence of the epidemic had a strong negative impact on businesses. In the context of increased economic uncertainty and their own poor financial situation, firms will reduce their investments in long-term, capital-intensive green projects, thus reducing green innovation. To prevent the epidemic from affecting the “quality and quantity” of green innovation, this paper excludes the sample of firms in 2020 and examines the impact of ESG ratings again. Table 4 shows that even after eliminating the 2020 sample, the coefficient of ESG_DID remains significant, indicating that ESG ratings boost the “quality and quantity” of company green innovation, and the estimation results are robust.
4.3.6 Considering lag effect
In the benchmark regression, considering that innovation projects need time to accumulate, some innovation projects are faster or may be slower, and the impact of ESG on different projects is also different, based on which GreenPatent, GreenUtility, and GreenInvent in the t + first and t + second year are further verified. The regression findings are provided in Table 5, all significant at 1%, and the conclusion remains unchanged.
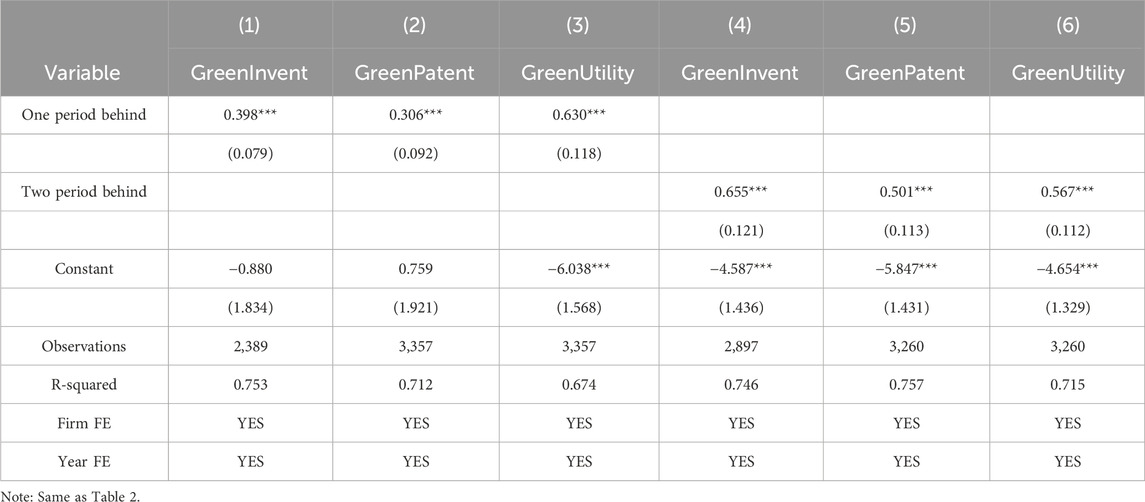
Table 5. Robustness test results 2
5 Heterogeneity test
In order to make the analysis more in-depth, this paper further considers the impact of heterogeneity. As green innovation requires large-scale investments and longer investment cycles, it puts higher demands on the internal capital of enterprises (Li et al., 2021). When the internal capital is not enough to support the innovation project, and there is a serious constraint on external financing, the enterprise will have to postpone or abandon the innovation. If the firm’s external financing can be eased, it will incentivize innovative activities (Xu et al., 2020). Because a firm’s property attributes affect how difficult it is to finance a firm, do ESG ratings cause differences in green innovation among firms with different attributes? Since large firms have a larger scale of capital compared to small firms, does the ESG rating create a difference in the impact of large firms and small firms on firms’ green innovation? Meanwhile, with the context of sustainable development, digital transformation is key to realizing green development and solving the dilemma of system and efficiency “breakthrough”, digital transformation for cracking the financing constraints of enterprises to provide a new solution (Eller et al., 2020). Hence, this study analyzes the heterogeneity in terms of enterprise attributes and firm size (Dasilas, 2024) and whether or not they have undergone digital transformation.
5.1 Enterprise attributes
In this paper, according to the nature of the enterprise belongs to is divided into state-owned and non-state-owned. The difference between them were tested, and Table 6 shows that p = 0.000, indicating that the difference between the groups is significant, and the regression coefficient of state-owned enterprises is larger than that of non-state-owned enterprises, and the impact of ESG ratings on the green innovation of state-owned new energy enterprises in terms of “increasing quality and improving quantity” is more significant. On the one hand, the possible explanation may be that state-owned new energy enterprises are more likely to receive financial support from the government, but the government’s financial support for non-state-owned enterprises is less (Li et al., 2020; Wang et al., 2021). On the other hand, because new energy enterprises have more financial needs and higher risks, banks favor state-owned enterprises and have less trust in non-state-owned enterprises when making green credits (Yu et al., 2021). Therefore, ESG ratings have impact on the “quality and quantity” of green innovation in state enterprise than in non-state enterprise.
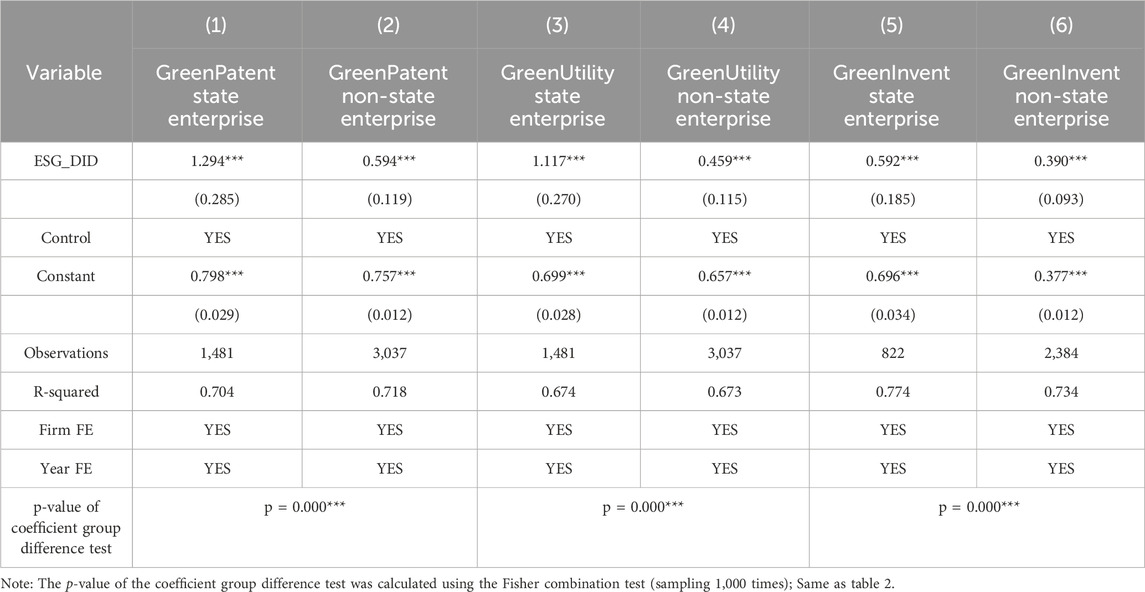
Table 6. Results of the heterogeneity analysis of enterprise attributes.
5.2 Enterprise size
The logarithmic value of operating income is used to assess a company’s size. The smallest 50% of companies are small enterprises, whereas the largest 50% are large enterprises. Table 7 shows that among new energy companies, ESG ratings have a significant impact in large companies. There may be two reasons for this, in the first place, Chinese new energy firms lack core technologies, have higher innovation costs, and have a greater need for capital, which requires large amounts of R&D and operating costs. Large firms have significant cash, talents and technology reserves, stronger risk-bearing ability, and their enthusiasm for green innovation are higher, which can provide support for the application and maintenance of patents (Yao et al., 2021). Secondly, the new energy sector itself has a scale effect, when the scale of the enterprise is expanded, it can improve its operational efficiency, better utilize internal and external financial resources, pay more attention to the company’s own image, form a good interaction with ESG, attract external investors, and promote patent research and developme (Drempetict et al., 2020). Small-scale enterprises are in a disadvantageous position in terms of capital, talents and technology reserves, with a weaker ability to bear risks and higher financing costs, and even if they have a strong sense of green innovation (Asai, 2019), it is hard to invest, and small businesses hard to innovate green even with ESG ratings.
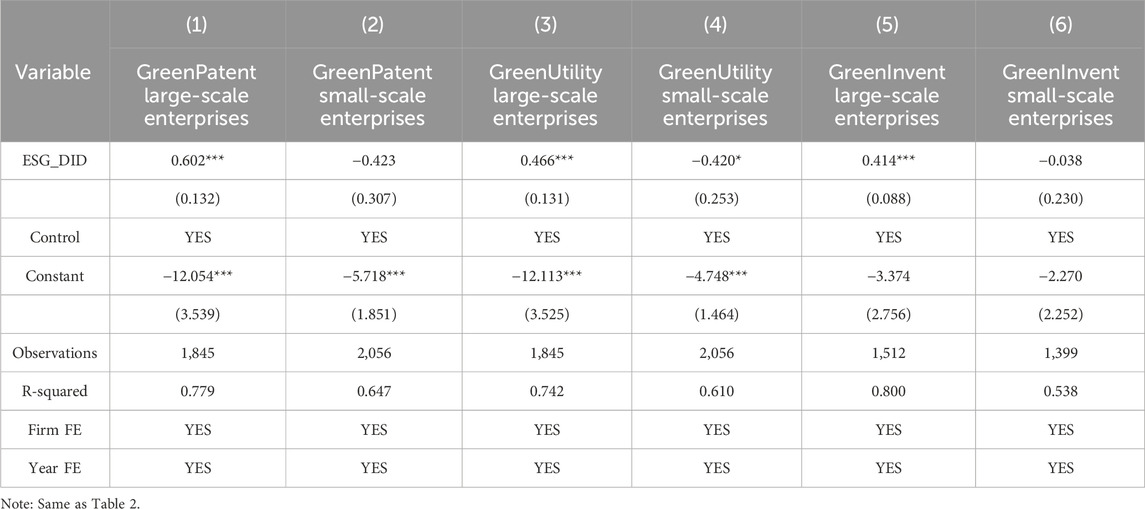
Table 7. Results of the heterogeneity analysis of enterprise size.
5.3 Digital transformation
In the study of this paper, the measure of “the number or percentage of digitization-related keywords in the annual reports of enterprises” was used to collect data on the digital transformation of enterprises (Dou et al., 2023). As shown through Table 8, ESG ratings have a more significant influence on companies with digital transformation than companies without digital transformation. Possible explanations are that China’s new energy enterprises have been established for a relatively short period of time, and the lack of credit when financing, combined with the high risk, high investment and long payback period of green innovation, have exacerbated the difficulty of financing for new energy enterprises. Digital transformation can utilize blockchain, big data and other digital technologies to integrate scattered funds, build a credit platform, compensate for the shortfalls of the conventional financial model (Benitez et al., 2022), and supplement the funds of new energy companies; and the use of digital technology can increase the clarity of companies information, endorse the credibility of new energy companies, and lower the financing costs incurred by credit mismatch (Lu et al., 2021). The result also further shows that the information of new energy enterprises in digital transformation is more transparent and the disclosure content is more truthful, which has prompted the ESG rating to play a real role in helping new energy enterprises to “increase quality and quantity” of green innovation.
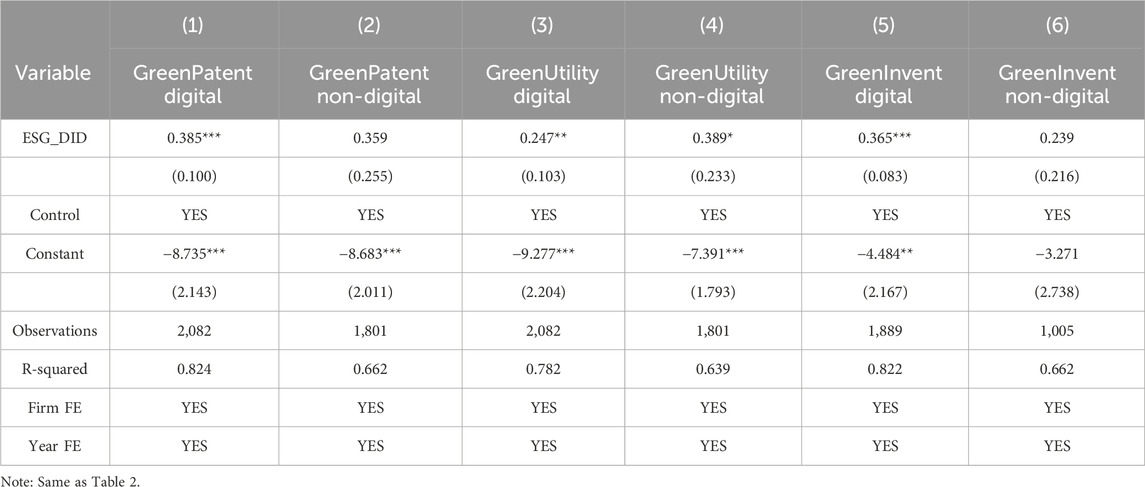
Table 8. Results of the heterogeneity analysis of digital transformation.
6 Analysis of mechanisms
The above section has verified the contribution of ESG ratings to the “quality and quantity” of green innovation from companies, and this section reveals its mechanism from the perspectives of financing constraints, agency problem and innovation efficiency.
6.1 ESG ratings and financing constraints
Good ESG performance of enterprises helps to improve the finance channels, and can lower financing costs by issuing green bonds and green credit. Because of the high-risk and high-investment characteristics of new energy companies, necessitate that enterprises obtain a large amount of funds from outside sources to compensate for the research and development gap, ESG ratings can reduce the information asymmetry, attract more investors with green preferences to invest, alleviate the enterprise’s financing constraints. In this study, we cite Hadlock and Pierce (2010) and use the SA index to measure finance limitations. In addition, there are two types of corporate finance: equity finance and debt finance, the PEG model is used to calculate the cost of equity financing, and the cost of debt financing is calculated using the ratio of corporate interest expenses to total liabilities to assess the influence of ESG ratings on corporate financing limitations. The findings are displayed in Table 9 columns (1), (2), and (3). When the SA index and the cost of equity financing are used as the explanatory variables, the coefficients are significantly negative at the 1% level, while the cost of debt financing’s regression coefficient is not significant. It shows that ESG ratings can reduce the cost of equity financing. Therefore, it can be argued that ESG ratings can increase the “quality and quantity” of firms’ green innovation by reducing funding limitations, and hypothesis two is valid.
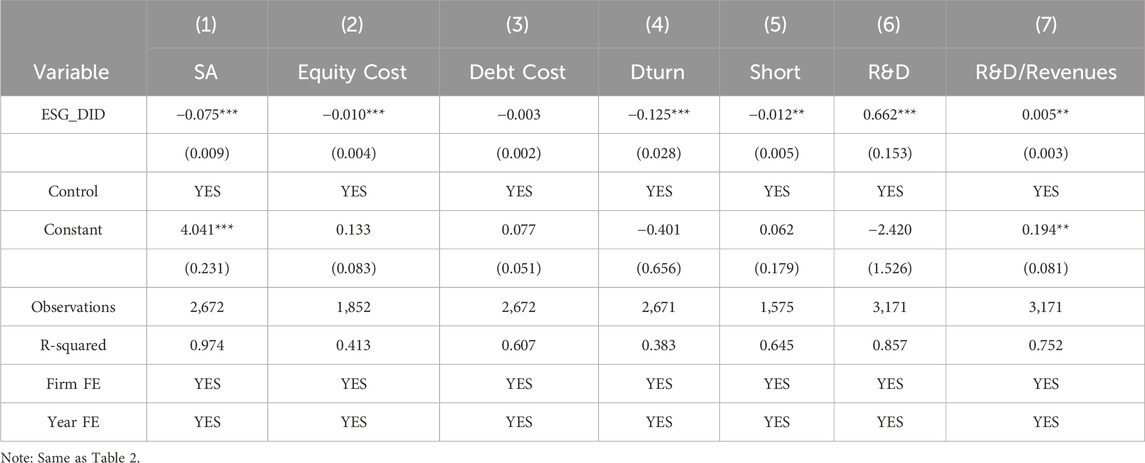
Table 9. Mechanism analysis test results 1
6.2 ESG rating and agency risk
Due to the principal-agent problem between owners and managers of modern corporate enterprises, resulting in the short-sighted behavior of corporate managers, unwilling to take risks due to the long duration of the green innovation cycle and the relatively large business risks, so corporate managers often choose short-term and conservative revenue decisions, reduction of green innovation activities. However, ESG ratings can alleviate the principal-agent behavior of enterprises, avoid the short-sighted behavior of management to a certain extent, enhance their risk-bearing ability, and foster a favorable climate for enterprise green innovation. This paper also introduces two indicators to measure the degree of shortsightedness of corporate management:The ratio of current short-term investments in the enterprise to the enterprise’s total assets at the beginning of the period (Short), and the average monthly excess turnover rate of stocks that reflects the frequency of shareholders’ transactions (DTurn) (Le and Gregoriou, 2020; Xu et al., 2021). Regression coefficients of the ratio of short-term investment to total firm assets at the beginning of the period and stock turnover rate on ESG ratings are significantly negative, which suggests that ESG ratings reduce managerial myopia, according to the results of columns (4) and (5) on the mechanism test in Table 9. As a result, hypothesis three is valid: ESG ratings can increase green innovation “quality and quantity” in firms by lowering managers’ myopia.
6.3 ESG ratings and R&D investment
ESG rating improves the transparency of enterprises’ green innovation activities and prompts stakeholders to play a role in the monitoring mechanism. ESG rating reflects the risks of enterprises in time and passes them to stakeholders, who will directly play the role of monitoring and constraining or give enterprises strong public opinion pressure in order to safeguard their interests, this forces businesses to raise their R&D investment (Wang and Chu, 2024). This paper uses R&D expenditure and the ratio of R&D expenditure to operating revenue to measure R&D investment. The regression coefficients for the mechanism test in columns (6) and (7) of Table 9 are considerably positive, demonstrating that ESG ratings can significantly enhance firms’ R&D spending. As a result, it can be argued that ESG ratings increase the “quality and quantity” of green innovation by increasing R&D expenditure, and research hypothesis four is correct.
7 Conclusion and insights
With the evolution of the global notion of sustainable development, all sectors of society are emphasizing the importance of non-environmental regulation in company green innovation. In this study, we use the ESG ratings of newly listed energy companies disclosed by SynTao Green Finance as exogenous shocks. We used DID to validate the influence of ESG ratings on both the quantity as well as the quality of green innovation in new energy companies. This studies reaches the following essential conclusions: ESG ratings have a favorable effect on the green innovation of new energy firms, and boost both the quantity and quality of innovation, which remains significant after a series of stability tests. Mechanism studies suggest that ESG ratings improve the “quality and quantity” of green innovation in energy businesses by alleviating financing limitations, lowering agency risk, and raising R&D investments. Further heterogeneity studies in this paper show that ESG ratings promote green innovation more significantly in large-scale enterprises in terms of enterprise size. Compared with enterprises without digital transformation, enterprises with digital transformation have more transparent information. Therefore, increasing the authenticity of ESG ratings is more conducive to enterprise financing, thus promoting the “quality and quantity” of green innovation in new energy companies.
The conclusions of this article have significant policy consequences. As the growth of new energy companies in China has reached a stage of transition from government support to market dominance, the government should reduce its direct involvement in businesses and promote appropriate and effective non-environmental regulatory measures to incentivize and steer new energy firms in green innovation. To begin, from the government’s viewpoint, the firstly, it is needed to promote the development of an ESG system with Chinese characteristics, standardize the criteria for ESG ratings, and regulate the supervision of ESG rating disclosure and promote the concept of green innovation in enterprises, especially for non-state-owned enterprises, small-scale enterprises and non-digitally transformed enterprises, the ESG rating is more meaningful to their green innovation activities, and the government can invest more funds in these new energy enterprises. Secondly, it is necessary to assist the development of ESG by means of tax relief, credit preferences and other exit mechanisms, and carry out moderate but not excessive environmental regulation, support for non-State-owned enterprises in particular. Gradually reduce the intervention policy of direct government subsidies, and instead increase precise innovation subsidies to correct the externalities of innovation behavior. In addition, the government should take full advantage of the incentive effect of ESG on new energy enterprises to solve the problem of those who have difficulty in obtaining green credit due to information asymmetry, and to help new energy enterprises overcome their inability to carry out green innovation activities due to financial problems. Secondly, from an enterprises standpoint, new energy enterprises should improve ESG concepts and ESG practices, and carry out ESG concepts throughout the entire process of business operations, establish a good social image through ESG performance, gain the support of the market and stakeholders, and regard ESG ratings as a kind of “value investment”. In addition, enterprises can hire managers with ESG construction experience, give full play to their consulting function, cultivate the awareness of ESG construction among executives, and reduce the information asymmetry of enterprises by mitigating the shortsightedness of executives. In addition, a specialized ESG committee is set up to supervise executives’ investment of funds in substantive green innovation initiatives and to enhance the quality of corporate green innovation. And enterprises should increase the amount of internal R&D investment to create a favorable green innovation environment and promote green innovation in enterprises. Finally, based on the finding of heterogeneity strengthening ESG construction is combined with digitization to enhance the authenticity of information publication through big data, conduct multi-dimensional credit ratings of new energy enterprises, carry out potential risk assessment, and increase the credibility of corporate ESG ratings to attract external financing.
Data availability statement
Publicly available datasets were analyzed in this study. This data can be found here: https://zldatas.com/.
Author contributions
HL: Data curation, Formal Analysis, Methodology, Writing–original draft, Writing–review and editing. YX: Data curation, Writing–original draft, Writing–review and editing.
Funding
The author(s) declare that no financial support was received for the research, authorship, and/or publication of this article.
Conflict of interest
The authors declare that the research was conducted in the absence of any commercial or financial relationships that could be construed as a potential conflict of interest.
Publisher’s note
All claims expressed in this article are solely those of the authors and do not necessarily represent those of their affiliated organizations, or those of the publisher, the editors and the reviewers. Any product that may be evaluated in this article, or claim that may be made by its manufacturer, is not guaranteed or endorsed by the publisher.
References
Abid, M. (2017). Does economic, financial and institutional developments matter for environmental quality? A comparative analysis of EU and MEA countries. J. Environ. Manag. 188, 183–194. doi:10.1016/j.jenvman.2016.12.007
Albuquerque, R., Koskinen, Y., and Zhang, C. (2019). Corporate social responsibility and firm risk: theory and empirical evidence. Manag. Sci. 65 (10), 4451–4469. doi:10.1287/mnsc.2018.3043
Amore, M. D., and Bennedsen, M. (2016). Corporate governance and green innovation. J. Environ. Econ. Manag. 75, 54–72. doi:10.1016/j.jeem.2015.11.003
Amore, M. D., Schneider, C., and Žaldokas, A. (2013). Credit supply and corporate innovation. J. Financial Econ. 109 (3), 835–855. doi:10.1016/j.jfineco.2013.04.006
Anwer, Z., Goodell, J. W., Migliavacca, M., and Paltrinieri, A. (2023). Does ESG impact systemic risk? Evidencing an inverted U-shape relationship for major energy firms. J. Econ. Behav. Organ. 216, 10–25. doi:10.1016/j.jebo.2023.10.011
Arrow, K. J. (1972). Economic welfare and the allocation of resources for invention. UK: Macmillan Education UK, 219–236.
Asai, Y. (2019). Why do small and medium enterprises (SMEs) demand property liability insurance? J. Bank. Finance 106, 298–304. doi:10.1016/j.jbankfin.2019.07.012
Benitez, J., Arenas, A., Castillo, A., and Esteves, J. (2022). Impact of digital leadership capability on innovation performance: the role of platform digitization capability. Inf. Manag. 59 (2), 103590. doi:10.1016/j.im.2022.103590
Biswas, A. K., Farzanegan, M. R., and Thum, M. (2012). Pollution, shadow economy and corruption: theory and evidence. Ecol. Econ. 75, 114–125. doi:10.1016/j.ecolecon.2012.01.007
Blacconiere, W. G., and Patten, D. M. (1994). Environmental disclosures, regulatory costs, and changes in firm value. J. Account. Econ. 18 (3), 357–377.
Bucaro, A. C., Jackson, K. E., and Lill, J. B. (2020). The influence of corporate social responsibility measures on investors' judgments when integrated in a financial report versus presented in a separate report. Contemp. Account. Res. 37 (2), 665–695. doi:10.1111/1911-3846.12542
Caineng, Z. O. U., Xiong, B., Huaqing, X. U. E., Zheng, D., Zhixin, G. E., Ying, W. A. N. G., et al. (2021). The role of new energy in carbon neutral. Petroleum Explor. Dev. 48 (2), 480–491. doi:10.1016/s1876-3804(21)60039-3
Cao, Y., and Chen, S. (2022). Rebel on the canal: disrupted trade access and social conflict in China, 1650–1911. Am. Econ. Rev. 112 (5), 1555–1590. doi:10.1257/aer.20201283
Card, D., and Krueger, A. B. (2000). Minimum wages and employment: a case study of the fast-food industry in New Jersey and Pennsylvania: reply. Am. Econ. Rev. 90 (5), 1397–1420. doi:10.1257/aer.90.5.1397
Carpenter, R. E., and Petersen, B. C. (2002). Capital market imperfections, high-tech investment, and new equity financing. Econ. J. 112 (477), F54–F72. doi:10.1111/1468-0297.00683
Castellacci, F., and Lie, C. M. (2017). A taxonomy of green innovators: empirical evidence from South Korea. J. Clean. Prod. 143, 1036–1047. doi:10.1016/j.jclepro.2016.12.016
Chang, K., Liu, L., Luo, D., and Xing, K. (2023). The impact of green technology innovation on carbon dioxide emissions: the role of local environmental regulations. J. Environ. Manag. 340, 117990. doi:10.1016/j.jenvman.2023.117990
Chemmanur, T. J., Loutskina, E., and Tian, X. (2014). Corporate venture capital, value creation, and innovation. Rev. Financial Stud. 27 (8), 2434–2473. doi:10.1093/rfs/hhu033
Chen, H., Yi, J., Chen, A., Peng, D., and Yang, J. (2023). Green technology innovation and CO2 emission in China: evidence from a spatial-temporal analysis and a nonlinear spatial durbin model. Energy Policy 172, 113338. doi:10.1016/j.enpol.2022.113338
Chen, J., Yang, Y., Liu, R., Geng, Y., and Ren, X. (2023). Green bond issuance and corporate ESG performance: the perspective of internal attention and external supervision. Humanit. Soc. Sci. Commun. 10 (1), 437–512. doi:10.1057/s41599-023-01941-2
Chen, Z., and Xie, G. (2022). ESG disclosure and financial performance: moderating role of ESG investors. Int. Rev. Financial Analysis 83, 102291. doi:10.1016/j.irfa.2022.102291
Cheng, B., Ioannou, I., and Serafeim, G. (2014). Corporate social responsibility and access to finance. Strategic Manag. J. 35 (1), 1–23. doi:10.1002/smj.2131
Christensen, D. M., Serafeim, G., and Sikochi, A. (2022). Why is corporate virtue in the eye of the beholder? The case of ESG ratings. Account. Rev. 97 (1), 147–175. doi:10.2308/tar-2019-0506
Cotter, J., and Najah, M. M. (2012). Institutional investor influence on global climate change disclosure practices. Aust. J. Manag. 37 (2), 169–187. doi:10.1177/0312896211423945
Cucari, N., Esposito De Falco, S., and Orlando, B. (2018). Diversity of board of directors and environmental social governance: evidence from Italian listed companies. Corp. Soc. Responsib. Environ. Manag. 25 (3), 250–266. doi:10.1002/csr.1452
Dai, R., Liang, H., and Ng, L. (2021). Socially responsible corporate customers. J. Financial Econ. 142 (2), 598–626. doi:10.1016/j.jfineco.2020.01.003
Dang, J., and Motohashi, K. (2015). Patent statistics: a good indicator for innovation in China? Patent subsidy program impacts on patent quality. China Econ. Rev. 35, 137–155. doi:10.1016/j.chieco.2015.03.012
Dangelico, R. M., and Pontrandolfo, P. (2015). Being ‘green and competitive’: the impact of environmental actions and collaborations on firm performance. Bus. Strategy Environ. 24 (6), 413–430. doi:10.1002/bse.1828
Dasilas, A. (2024). The nonlinear relationship between employee stock ownership plans and firm performance: evidence from China. J. Bus. Res. 173, 114470. doi:10.1016/j.jbusres.2023.114470
Deng, X., Li, W., and Ren, X. (2023). More sustainable, more productive: evidence from ESG ratings and total factor productivity among listed Chinese firms. Finance Res. Lett. 51, 103439. doi:10.1016/j.frl.2022.103439
Doran, J., and Ryan, G. (2012). Regulation and firm perception, eco-innovation and firm performance. Eur. J. Innovation Manag. 15 (4), 421–441. doi:10.1108/14601061211272367
Dou, B., Guo, S., Chang, X., and Wang, Y. (2023). Corporate digital transformation and labor structure upgrading. Int. Rev. Financial Analysis 90, 102904. doi:10.1016/j.irfa.2023.102904
Drempetic, S., Klein, C., and Zwergel, B. (2020). The influence of firm size on the ESG score: corporate sustainability ratings under review. J. Bus. ethics 167, 333–360. doi:10.1007/s10551-019-04164-1
Dunbar, C., Li, Z. F., and Shi, Y. (2020). CEO risk-taking incentives and corporate social responsibility. J. Corp. Finance 64, 101714. doi:10.1016/j.jcorpfin.2020.101714
Dyck, A., Lins, K. V., Roth, L., and Wagner, H. F. (2019). Do institutional investors drive corporate social responsibility? International evidence. J. financial Econ. 131 (3), 693–714. doi:10.1016/j.jfineco.2018.08.013
Eller, R., Alford, P., Kallmünzer, A., and Peters, M. (2020). Antecedents, consequences, and challenges of small and medium-sized enterprise digitalization. J. Bus. Res. 112, 119–127. doi:10.1016/j.jbusres.2020.03.004
Elmagrhi, M. H., Ntim, C. G., Elamer, A. A., and Zhang, Q. (2019). A study of environmental policies and regulations, governance structures, and environmental performance: the role of female directors. Bus. strategy Environ. 28 (1), 206–220. doi:10.1002/bse.2250
Faccio, M., Marchica, M. T., and Mura, R. (2016). CEO gender, corporate risk-taking, and the efficiency of capital allocation. J. Corp. finance 39, 193–209. doi:10.1016/j.jcorpfin.2016.02.008
Fang, M., Nie, H., and Shen, X. (2023). Can enterprise digitization improve ESG performance? Econ. Model. 118, 106101. doi:10.1016/j.econmod.2022.106101
Fang, V. W., Tian, X., and Tice, S. (2014). Does stock liquidity enhance or impede firm innovation? J. finance 69 (5), 2085–2125. doi:10.1111/jofi.12187
Fisch, C., Sandner, P., and Regner, L. (2017). The value of Chinese patents: an empirical investigation of citation lags. China Econ. Rev. 45, 22–34. doi:10.1016/j.chieco.2017.05.011
Flammer, C., Toffel, M. W., and Viswanathan, K. (2021). Shareholder activism and firms' voluntary disclosure of climate change risks. Strategic Manag. J. 42 (10), 1850–1879. doi:10.1002/smj.3313
Habiba, U. M. M. E., Xinbang, C., and Anwar, A. (2022). Do green technology innovations, financial development, and renewable energy use help to curb carbon emissions? Renew. energy 193, 1082–1093. doi:10.1016/j.renene.2022.05.084
Hadlock, C. J., and Pierce, J. R. (2010). New evidence on measuring financial constraints: moving beyond the KZ index. Rev. financial Stud. 23 (5), 1909–1940. doi:10.1093/rfs/hhq009
Hambrick, D. C. (2007). Upper echelons theory: an update. Acad. Manag. Rev. 32 (2), 334–343. doi:10.5465/amr.2007.24345254
Hamrouni, A., Boussaada, R., and Toumi, N. B. F. (2019). Corporate social responsibility disclosure and debt financing. J. Appl. Account. Res. 20 (4), 394–415. doi:10.1108/jaar-01-2018-0020
Hansen, M. T., and Birkinshaw, J. (2007). The innovation value chain. Harv. Bus. Rev. 85 (6), 121–142.
He, F., Du, H., and Yu, B. (2022). Corporate ESG performance and manager misconduct: evidence from China. Int. Rev. Financial Analysis 82, 102201. doi:10.1016/j.irfa.2022.102201
He, G., Liu, Y., and Chen, F. (2023). Research on the impact of environment, society, and governance (ESG) on firm risk: an explanation from a financing constraints perspective. Finance Res. Lett. 58, 104038. doi:10.1016/j.frl.2023.104038
He, J. J., and Tian, X. (2013). The dark side of analyst coverage: the case of innovation. J. Financial Econ. 109 (3), 856–878. doi:10.1016/j.jfineco.2013.04.001
He, K., Chen, W., and Zhang, L. (2021). Senior management's academic experience and corporate green innovation. Technol. Forecast. Soc. Change 166, 120664. doi:10.1016/j.techfore.2021.120664
He, X., and Jiang, S. (2019). Does gender diversity matter for green innovation? Bus. Strategy Environ. 28 (7), 1341–1356. doi:10.1002/bse.2319
Houston, J. F., and Shan, H. (2022). Corporate ESG profiles and banking relationships. Rev. Financial Stud. 35 (7), 3373–3417. doi:10.1093/rfs/hhab125
Huang, J. W., and Li, Y. H. (2017). Green innovation and performance: the view of organizational capability and social reciprocity. J. Bus. Ethics 145, 309–324. doi:10.1007/s10551-015-2903-y
Ingram, R. W., and Frazier, K. B. (1980). Environmental performance and corporate disclosure. J. Account. Res. 18, 614–622. doi:10.2307/2490597
Jensen, M. C., and Meckling, W. H. (2019). “Theory of the firm: managerial behavior, agency costs and ownership structure,” in Corporate governance, 77–132.
Jiang, L., Zhao, Y., Golsanami, N., Chen, L., and Yan, W. (2020). A novel type of neural networks for feature engineering of geological data: case studies of coal and gas hydrate-bearing sediments. Geosci. Front. 11 (5), 1511–1531. doi:10.1016/j.gsf.2020.04.016
Jiang, W., Dong, L., and Chen, Y. (2023). Time-frequency connectedness among traditional/new energy, green finance, and ESG in pre-and post-Russia-Ukraine war periods. Resour. Policy 83, 103618. doi:10.1016/j.resourpol.2023.103618
Jiang, Y., Wang, C., Li, S., and Wan, J. (2022). Do institutional investors' corporate site visits improve ESG performance? Evidence from China. Pacific-Basin Finance J. 76, 101884. doi:10.1016/j.pacfin.2022.101884
Jones, C. I., and Williams, J. C. (1998). Measuring the social return to R&D. Q. J. Econ. 113 (4), 1119–1135. doi:10.1162/003355398555856
Joshi, A., and Hanssens, D. M. (2010). The direct and indirect effects of advertising spending on firm value. J. Mark. 74 (1), 20–33. doi:10.1509/jmkg.74.1.20
Karmaker, S. C., Hosan, S., Chapman, A. J., and Saha, B. B. (2021). The role of environmental taxes on technological innovation. Energy 232, 121052. doi:10.1016/j.energy.2021.121052
Kim, S., and Li, Z. (2021). Understanding the impact of ESG practices in corporate finance. Sustainability 13 (7), 3746. doi:10.3390/su13073746
Kirmani, A., and Rao, A. R. (2000). No pain, no gain: a critical review of the literature on signaling unobservable product quality. J. Mark. 64 (2), 66–79. doi:10.1509/jmkg.64.2.66.18000
Kong, W. (2023). The impact of ESG performance on debt financing costs: evidence from Chinese family business. Finance Res. Lett. 55, 103949. doi:10.1016/j.frl.2023.103949
Kong, Y., Wang, Y., Jiao, Y., and Peng, D. (2021). Research on the impact of government subsidies on green innovation of new energy enterprises - based on the Cournot competition perspective. Explor. Econ. Issues 6, 71–81.
Le, H., and Gregoriou, A. (2020). How do you capture liquidity? A review of the literature on low-frequency stock liquidity. J. Econ. Surv. 34 (5), 1170–1186. doi:10.1111/joes.12385
Lee, E., Walker, M., and Zeng, C. C. (2017). Do Chinese state subsidies affect voluntary corporate social responsibility disclosure? J. Account. Public Policy 36 (3), 179–200. doi:10.1016/j.jaccpubpol.2017.03.004
Lerner, J., and Wulf, J. (2007). Innovation and incentives: evidence from corporate R&D. Rev. Econ. Statistics 89 (4), 634–644. doi:10.1162/rest.89.4.634
Li, C., Ba, S., Ma, K., Xu, Y., Huang, W., and Huang, N. (2023). ESG rating events, financial investment behavior and corporate innovation. Econ. Analysis Policy 77, 372–387. doi:10.1016/j.eap.2022.11.013
Li, J., Dong, K., and Dong, X. (2022). Green energy as a new determinant of green growth in China: the role of green technological innovation. Energy Econ. 114, 106260. doi:10.1016/j.eneco.2022.106260
Li, J., Lian, G., and Xu, A. (2023). How do ESG affect the spillover of green innovation among peer firms? Mechanism discussion and performance study. J. Bus. Res. 158, 113648. doi:10.1016/j.jbusres.2023.113648
Li, K., Xia, B., Chen, Y., Ding, N., and Wang, J. (2021). Environmental uncertainty, financing constraints and corporate investment: evidence from China. Pacific-Basin Finance J. 70, 101665. doi:10.1016/j.pacfin.2021.101665
Li, K., Zou, D., and Li, H. (2023). Environmental regulation and green technical efficiency: a process-level data envelopment analysis from Chinese iron and steel enterprises. Energy 277, 127662. doi:10.1016/j.energy.2023.127662
Li, Y., Tong, Y., Ye, F., and Song, J. (2020). The choice of the government green subsidy scheme: innovation subsidy vs. product subsidy. Int. J. Prod. Res. 58 (16), 4932–4946. doi:10.1080/00207543.2020.1730466
Li, Z., Huang, Z., and Su, Y. (2023). New media environment, environmental regulation and corporate green technology innovation: evidence from China. Energy Econ. 119, 106545. doi:10.1016/j.eneco.2023.106545
Li, Z., Liao, G., Wang, Z., and Huang, Z. (2018). Green loan and subsidy for promoting clean production innovation. J. Clean. Prod. 187, 421–431. doi:10.1016/j.jclepro.2018.03.066
Lian, G., Xu, A., and Zhu, Y. (2022). Substantive green innovation or symbolic green innovation? The impact of ER on enterprise green innovation based on the dual moderating effects. J. Innovation Knowl. 7 (3), 100203. doi:10.1016/j.jik.2022.100203
Lins, K. V., Servaes, H., and Tamayo, A. (2017). Social capital, trust, and firm performance: the value of corporate social responsibility during the financial crisis. J. Finance 72 (4), 1785–1824. doi:10.1111/jofi.12505
Liu, J., Zhao, M., and Wang, Y. (2020). Impacts of government subsidies and environmental regulations on green process innovation: a nonlinear approach. Technol. Soc. 63, 101417. doi:10.1016/j.techsoc.2020.101417
Liu, M., Shan, Y., and Li, Y. (2022). Study on the effect of carbon trading regulation on green innovation and heterogeneity analysis from China. Energy Policy 171, 113290. doi:10.1016/j.enpol.2022.113290
Liu, P., Zhu, B., Yang, M., and Chu, X. (2022). ESG and financial performance: a qualitative comparative analysis in China's new energy companies. J. Clean. Prod. 379, 134721. doi:10.1016/j.jclepro.2022.134721
Løvdal, N., and Neumann, F. (2011). Internationalization as a strategy to overcome industry barriers—an assessment of the marine energy industry. Energy policy 39 (3), 1093–1100. doi:10.1016/j.enpol.2010.11.028
Lu, M., Gao, Y., and Wan, Q. (2021). Research on evolutionary game of collaborative innovation in supply chain under digitization background. Math. Problems Eng. 2021, 1–18. doi:10.1155/2021/3511472
Lu, Z., Zhu, J., and Zhang, W. (2012). Bank discrimination, holding bank ownership, and economic consequences: evidence from China. J. Bank. Finance 36 (2), 341–354. doi:10.1016/j.jbankfin.2011.07.012
Ma, Q., Murshed, M., and Khan, Z. (2021). The nexuses between energy investments, technological innovations, emission taxes, and carbon emissions in China. Energy Policy 155, 112345. doi:10.1016/j.enpol.2021.112345
Mallin, C., Michelon, G., and Raggi, D. (2013). Monitoring intensity and stakeholders’ orientation: how does governance affect social and environmental disclosure? J. Bus. ethics 114, 29–43. doi:10.1007/s10551-012-1324-4
Manso, G. (2011). Motivating innovation. J. finance 66 (5), 1823–1860. doi:10.1111/j.1540-6261.2011.01688.x
Matsumura, E. M., Prakash, R., and Vera-Munoz, S. C. (2014). Firm-value effects of carbon emissions and carbon disclosures. Account. Rev. 89 (2), 695–724. doi:10.2308/accr-50629
Meng, G., Li, J., and Yang, X. (2023). Bridging the gap between state–business interactions and air pollution: the role of environment, social responsibility, and corporate governance performance. Bus. Strategy Environ. 32 (4), 1872–1884. doi:10.1002/bse.3224
Miller, G. S. (2006). The press as a watchdog for accounting fraud. J. Account. Res. 44 (5), 1001–1033. doi:10.1111/j.1475-679x.2006.00224.x
Ming, Z., Ximei, L., Yulong, L., and Lilin, P. (2014). Review of renewable energy investment and financing in China: status, mode, issues and countermeasures. Renew. Sustain. Energy Rev. 31, 23–37. doi:10.1016/j.rser.2013.11.026
Murty, M. N., and Kumar, S. (2003). Win–win opportunities and environmental regulation: testing of porter hypothesis for Indian manufacturing industries. J. Environ. Manag. 67 (2), 139–144. doi:10.1016/s0301-4797(02)00203-7
Ouyang, X., and Lin, B. (2014). Impacts of increasing renewable energy subsidies and phasing out fossil fuel subsidies in China. Renew. Sustain. energy Rev. 37, 933–942. doi:10.1016/j.rser.2014.05.013
Palmer, K., Oates, W. E., and Portney, P. R. (1995). Tightening environmental standards: the benefit-cost or the no-cost paradigm? J. Econ. Perspect. 9 (4), 119–132. doi:10.1257/jep.9.4.119
Pástor, Ľ., Stambaugh, R. F., and Taylor, L. A. (2021). Sustainable investing in equilibrium. J. Financial Econ. 142 (2), 550–571. doi:10.1016/j.jfineco.2020.12.011
Porter, M., and Van der Linde, C. (1995). Green and competitive: ending the stalemate. Dyn. eco-efficient Econ. Environ. Regul. Compet. Advant. 33, 120–134.
Post, C., Rahman, N., and Rubow, E. (2011). Green governance: boards of directors’ composition and environmental corporate social responsibility. Bus. Soc. 50 (1), 189–223. doi:10.1177/0007650310394642
Qi, S., Qian, Z., and Wang, B. (2017). Market-based incentives for new energy enterprise innovation—a study based on venture capital and enterprise patent data. China Ind. Econ. (12), 95–112.
Qiu, B., Ren, H., Zuo, J., and Cheng, B. (2023). Social trust and female board representation: evidence from China. J. Bus. Ethics 188 (1), 187–204. doi:10.1007/s10551-022-05298-5
Quan, X., Ke, Y., Qian, Y., and Zhang, Y. (2021). CEO foreign experience and green innovation: evidence from China. J. Bus. Ethics 182, 535–557. doi:10.1007/s10551-021-04977-z
Raimo, N., Caragnano, A., Zito, M., Vitolla, F., and Mariani, M. (2021). Extending the benefits of ESG disclosure: the effect on the cost of debt financing. Corp. Soc. Responsib. Environ. Manag. 28 (4), 1412–1421. doi:10.1002/csr.2134
Saini, M., Aggarwal, V., Dhingra, B., Kumar, P., and Yadav, M. (2023). ESG and financial variables: a systematic review. Int. J. Law Manag. 65 (6), 663–682. doi:10.1108/ijlma-02-2023-0033
Shao, Y., and Chen, Z. (2022). Can government subsidies promote the green technology innovation transformation? Evidence from Chinese listed companies. Econ. Analysis Policy 74, 716–727. doi:10.1016/j.eap.2022.03.020
Shen, Q., Pan, Y., and Feng, Y. (2023). Identifying and assessing the multiple effects of informal environmental regulation on carbon emissions in China. Environ. Res. 237, 116931. doi:10.1016/j.envres.2023.116931
Shropshire, C. (2010). The role of the interlocking director and board receptivity in the diffusion of practices. Acad. Manag. Rev. 35 (2), 246–264. doi:10.5465/amr.35.2.zok246
Song, M., Peng, L., Shang, Y., and Zhao, X. (2022). Green technology progress and total factor productivity of resource-based enterprises: a perspective of technical compensation of environmental regulation. Technol. Forecast. Soc. Change 174, 121276. doi:10.1016/j.techfore.2021.121276
Spence, M. (1974). Competitive and optimal responses to signals: an analysis of efficiency and distribution. J. Econ. theory 7 (3), 296–332. doi:10.1016/0022-0531(74)90098-2
Tamimi, N., and Sebastianelli, R. (2017). Transparency among S&P 500 companies: an analysis of ESG disclosure scores. Manag. Decis. 55 (8), 1660–1680. doi:10.1108/md-01-2017-0018
Tan, X., Liu, G., and Cheng, S. (2024). How does ESG performance affect green transformation of resource-based enterprises: evidence from Chinese listed enterprises. Resour. Policy 89, 104559. doi:10.1016/j.resourpol.2023.104559
Tan, Y., and Zhu, Z. (2022). The effect of ESG rating events on corporate green innovation in China: the mediating role of financial constraints and managers' environmental awareness. Technol. Soc. 68, 101906. doi:10.1016/j.techsoc.2022.101906
Tsang, A., Frost, T., and Cao, H. (2023). Environmental, social, and governance (ESG) disclosure: a literature review. Br. Account. Rev. 55 (1), 101149. doi:10.1016/j.bar.2022.101149
Wang, K., and Jiang, W. (2021). State ownership and green innovation in China: the contingent roles of environmental and organizational factors. J. Clean. Prod. 314, 128029. doi:10.1016/j.jclepro.2021.128029
Wang, L., Long, Y., and Li, C. (2022). Research on the impact mechanism of heterogeneous environmental regulation on enterprise green technology innovation. J. Environ. Manag. 322, 116127. doi:10.1016/j.jenvman.2022.116127
Wang, S., and Liu, X. (2017). China’s city-level energy-related CO2 emissions: spatiotemporal patterns and driving forces. Appl. energy 200, 204–214. doi:10.1016/j.apenergy.2017.05.085
Wang, X., Li, Z., Shaikh, R., Ranjha, A. R., and Batala, L. K. (2021). Do government subsidies promote financial performance? Fresh evidence from China's new energy vehicle industry. Sustain. Prod. Consum. 28, 142–153. doi:10.1016/j.spc.2021.03.038
Wang, Z., and Chu, E. (2024). Shifting focus from end-of-pipe treatment to source control: ESG ratings’ impact on corporate green innovation. J. Environ. Manag. 354, 120409. doi:10.1016/j.jenvman.2024.120409
Wang, Z. J., and Wang, H. (2022). Low-carbon city pilot policy and high quality development of enterprises: from the perspective of economic efficiency and social benefit. Bus. Manag. J. (BMJ) 44 (6), 43–62.
Wu, B., Monfort, A., Jin, C., and Shen, X. (2022). Substantial response or impression management? Compliance strategies for sustainable development responsibility in family firms. Technol. Forecast. Soc. change 174, 121214. doi:10.1016/j.techfore.2021.121214
Wu, S., Gong, G., Huang, X., and Tian, H. (2021). The interaction between suppliers and fraudulent customer firms: evidence from trade credit financing of Chinese listed firms. J. Bus. Ethics 179, 531–550. doi:10.1007/s10551-021-04832-1
Xu, J., Liu, F., and Shang, Y. (2021). R&D investment, ESG performance and green innovation performance: evidence from China. Kybernetes 50 (3), 737–756. doi:10.1108/k-12-2019-0793
Xu, K., Geng, C., Wei, X., and Jiang, H. (2020). Financing development, financing constraint and R&D investment of strategic emerging industries in China. J. Bus. Econ. Manag. 21 (4), 1010–1034. doi:10.3846/jbem.2020.12727
Xu, Y., Yuan, L., Lee, H., Baire, S., Nakonieczny, J., and Zhao, X. (2023). Fintech development and firm technological innovation efficiency: empirical findings in China. IEEE Trans. Eng. Manag. 71, 3881–3891. doi:10.1109/tem.2023.3239499
Yang, S., He, F., Zhu, Q., and Li, S. (2018). How does corporate social responsibility change capital structure? Asia-Pacific J. Account. Econ. 25 (3-4), 352–387. doi:10.1080/16081625.2017.1354710
Yao, S., Pan, Y., Sensoy, A., Uddin, G. S., and Cheng, F. (2021). Green credit policy and firm performance: what we learn from China. Energy Econ. 101, 105415. doi:10.1016/j.eneco.2021.105415
Yousaf, I., Patel, R., and Yarovaya, L. (2022). The reaction of G20+ stock markets to the Russia–Ukraine conflict “black-swan” event: evidence from event study approach. J. Behav. Exp. Finance 35, 100723. doi:10.1016/j.jbef.2022.100723
Yu, C. H., Wu, X., Zhang, D., Chen, S., and Zhao, J. (2021). Demand for green finance: resolving financing constraints on green innovation in China. Energy Policy 153, 112255. doi:10.1016/j.enpol.2021.112255
Zeng, S., Jiang, C., Ma, C., and Su, B. (2018). Investment efficiency of the new energy industry in China. Energy Econ. 70, 536–544. doi:10.1016/j.eneco.2017.12.023
Zhang, C., Zhou, B., and Tian, X. (2022). Political connections and green innovation: the role of a corporate entrepreneurship strategy in state-owned enterprises. J. Bus. Res. 146, 375–384. doi:10.1016/j.jbusres.2022.03.084
Zhang, D., Meng, L., and Zhang, J. (2023). Environmental subsidy disruption, skill premiums and ESG performance. Int. Rev. Financial Analysis 90, 102862. doi:10.1016/j.irfa.2023.102862
Zhang, F., and Zhu, L. (2019). Enhancing corporate sustainable development: stakeholder pressures, organizational learning, and green innovation. Bus. Strategy Environ. 28 (6), 1012–1026. doi:10.1002/bse.2298
Zhang, M., Yan, T., Gao, W., Xie, W., and Yu, Z. (2023). How does environmental regulation affect real green technology innovation and strategic green technology innovation? Sci. Total Environ. 872, 162221. doi:10.1016/j.scitotenv.2023.162221
Zhang, S., Zhang, M. A., Qiao, Y., Li, X., and Li, S. (2022). Does improvement of environmental information transparency boost firms’ green innovation? Evidence from the air quality monitoring and disclosure program in China. J. Clean. Prod. 357, 131921. doi:10.1016/j.jclepro.2022.131921
Zhao, X., Ma, X., Chen, B., Shang, Y., and Song, M. (2022). Challenges toward carbon neutrality in China: strategies and countermeasures. Resour. Conservation Recycl. 176, 105959. doi:10.1016/j.resconrec.2021.105959
Zhao, X., Nakonieczny, J., Jabeen, F., Shahzad, U., and Jia, W. (2022). Does green innovation induce green total factor productivity? Novel findings from Chinese city level data. Technol. Forecast. Soc. Change 185, 122021. doi:10.1016/j.techfore.2022.122021
Zhao, Y., Mao, J., and Li, Y. (2022). Local governments’ environmental emphasis and corporate green innovation: evidence from China. Econ. Change Restruct. 55 (4), 2577–2603. doi:10.1007/s10644-022-09406-3
Keywords: new energy enterprises, ESG ratings, green innovation, non-environmental regulation, staggered difference-in-difference
Citation: Liu H and Xu Y (2024) The impact of ESG ratings on the quality and quantity of green innovation of new energy enterprises. Front. Energy Res. 12:1382139. doi: 10.3389/fenrg.2024.1382139
Received: 05 February 2024; Accepted: 10 April 2024;
Published: 20 June 2024.
Edited by:
Ziwei Zhou, Hubei University of Technology, ChinaReviewed by:
Silin Chen, Zhongnan University of Economics and Law, ChinaXianglin Chen, China Geological Survey, China
Jin Dandan, Macau University of Science and Technology, China, in collaboration with reviewer XC
Copyright © 2024 Liu and Xu. This is an open-access article distributed under the terms of the Creative Commons Attribution License (CC BY). The use, distribution or reproduction in other forums is permitted, provided the original author(s) and the copyright owner(s) are credited and that the original publication in this journal is cited, in accordance with accepted academic practice. No use, distribution or reproduction is permitted which does not comply with these terms.
*Correspondence: Haiwen Liu, YjIyMDkxMTA0MDA5QGNpdHl1LmVkdS5tbw==