 Nabila Khurshid
 Chinyere Emmanuel Egbe
 Nabila Akram
- 1Department of Economics, Comsats University Islamabad, Pakistan
- 2Economics and Finance Medgar Evers College, City University of New York, NY, United States
Introduction: This study delves into the intricate relationship between non-renewable energy sources, economic advancement, and the ecological footprint of well-being in Pakistan, spanning the years from 1980 to 2021.
Methods: Employing the quantile regression model, we analyzed the co-integrating dynamics among the variables under scrutiny. Non-renewable energy sources were dissected into four distinct components—namely, gas, electricity, and oil consumption—facilitating a granular examination of their impacts.
Results and discussion: Our empirical investigations reveal that coal, gas, and electricity consumption exhibit a negative correlation with the ecological footprint of well-being. Conversely, coal consumption and overall energy consumption show a positive association with the ecological footprint of well-being. Additionally, the study underscores the detrimental impact of geopolitical risks on the ecological footprint of well-being. Our findings align with the Environmental Kuznets Curve (EKC) hypothesis, positing that environmental degradation initially surges with economic development, subsequently declining as a nation progresses economically. Consequently, our research advocates for Pakistan’s imperative to prioritize the adoption of renewable energy sources as it traverses its developmental trajectory. This strategic pivot towards renewables, encompassing hydroelectric, wind, and solar energy, not only seeks to curtail environmental degradation but also endeavors to foster a cleaner and safer ecological milieu.
1 Introduction
One of the major challenges that modern societies face is improving their wellbeing while reducing pressures on their environments. The environmental intensity of wellbeing (EIWB) is an indicator that quantifies the environmental footprint or impact associated with achieving a specific level of human values. The concept of the Environmental Interlinked Worldwide Biosphere has gained increasing importance in recent years as a result of the rising societal value and practices in eco-economic activities. These activities give rise to various environmental challenges, such as climate change, depletion of natural resources, and pollution (Zaman et al., 2017). The statement highlights that our choices regarding canned products, cosmetics, and lifestyle have a broader impact outside our immediate area (Li et al., 2022). The limited availability of resources, the release of greenhouse gas emissions, and the significant ecological impact all indicate the need for doing a cost-benefit analysis and comparison about the environmental costs associated with our energy consumption decisions (Ahmad et al., 2020). To effectively address the complex interconnections between non-renewable energy extraction, geopolitical dangers, economic outputs, and ecological intensities, it is crucial to understand the extensive transformations occurring within the framework of sustainable development. In addition, to establish sustainable foundations within the global energy system, it is imperative to address the requisite problems and dangers correspondingly.
The utilization of finite energy resources is a significant contributing factor to the ongoing global conflict between economic expansion and environmental sustainability. The use of fossil fuels in the production of non-renewable energy sources has significant economic and environmental consequences, both in the short-term and long-term (Zhang et al., 2023a). Energy is a distinctive commodity that plays a crucial role in the advancement of economies, enhancing the quality of life, and ultimately addressing fundamental necessities. However, renewable energy sources, including coal, oil, natural gas, and fossil fuels, are the primary contributors to global energy production. This poses environmental concerns due to the limited stocks of fossil fuels and the growing world population. To conduct a comprehensive sustainability analysis, it is imperative to consider both social wellbeing and ecological stress (Dietz et al., 2012). Furthermore, it is crucial to decarbonize the economy by reducing the consumption of non-renewable energy and adopting sustainable energy sources to promote development and human growth. Coal generates the most amount of CO2 compared to other fossil fuels, and this is the source of most of the climate changes (Khan et al., 2020). Even though these emissions add to the greenhouse effect and then cause global warming accompanied by the associated ecological disruptions. Energy-related CO2 emissions inclusive of international organizations are estimated to have reached a historic highest point of 33.1 gigatons in the year 2019 (Energy, 2019). One of the alarming risks of coal mining and extraction is deforestation, habitat destruction, removal of topsoil, and water contamination (Rehman et al., 2021). During the insults air pollution that is propelled by natural gas and coal can be so severe such as respiratory diseases, cardiovascular health issues, and early deaths. The World Health Organization (WHO, 2022) highlights that there are 4.2 million premature deaths linked to outdoor air pollution as stated.
Conversely, oil extraction has detrimental effects on the ecosystem due to practices such as dredging and other approaches (Butler, 2012). Additionally, the combustion of oil in transportation and power generation contributes to the presence of pollutants in the atmosphere. The main pollutants identified in the study conducted by Hannun and Razzaq (2022) were nitrogen oxides (NO_2), sulfur dioxide (SO_2), and particulate matter (PM), among other substances. These pollutants have a detrimental impact on both air quality and human health, as well as causing a decline in individuals’ emotional wellbeing. The use of oil leads to environmental degradation, soil and freshwater contamination, and ecological disturbances caused by overspills, tank leaks, and improper disposal practices (Asif et al., 2022). Furthermore, similar to fossil fuels, they also contribute to the exacerbation of environmental degradation. However, it is undeniable that the use of fossil fuels in electric power plants results in the release of greenhouse gas emissions, so impacting the environment. According to Brauers (2022), the extraction of natural gas is comparatively less environmentally detrimental than the extraction of oil and coal. However, it still exacerbates various other environmental concerns, such as the destruction of habitats, contamination of water sources, fugitive leaks, and even seismic activity. The continuing utilization of renewable energy sources plays a significant role in enhancing ecological wellbeing by reducing reliance on non-renewable energy sources and implementing ecologically sustainable measures to mitigate climate change. (Osama et al., 2023).
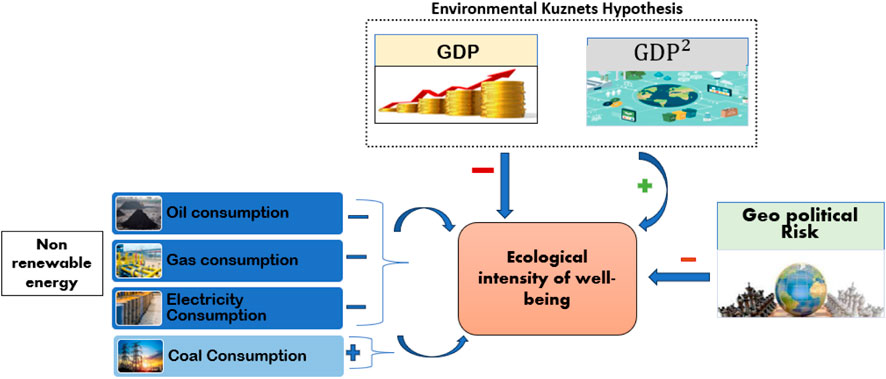
Energy consumption is intricately linked to economic development (Parveen et al., 2020; Khurshid et al., 2023c). It can have both beneficial and bad effects on EIWB. One advantage of economic expansion is the potential for enhanced access to products and services, such as healthcare and education, which can contribute to the improvement of human wellbeing (Niu et al., 2021). Economic growth can lead to the development of eco-friendly technologies and sustainable practices, hence mitigating the adverse environmental impacts of economic activity (Khan et al., 2020; Khurshid, 2023b). Conversely, it has a detrimental effect on EIWB, leading to heightened resource use, deforestation, climate change, and pollution. According to Ahmad et al. (2022) and Khurshid et al. (2023c), the process of economic expansion can potentially contribute to increased urbanization and industrialization, which in turn may lead to the loss of habitats and a decline in biodiversity. The impact of economic expansion on EIWB is contingent upon the regulatory framework in place and the strategies implemented to mitigate its negative consequences. Kuznets’s hypothesis posits that during the initial phases, nations give precedence to economic growth and industrialization, resulting in the emergence of pollution and environmental damage. As their revenue rises, they tackle environmental concerns by implementing awareness campaigns, policy interventions, and technical progress. They also allocate resources towards cleaner technologies and regulations (Dinda, 2004; Khurshid et al., 2023d).
Geopolitical risk poses a significant challenge to the Environmental Impact Assessment (EIWB). It is imperative for politicians to carefully evaluate the environmental ramifications of their political choices and devise strategies to mitigate adverse effects. According to Sweidan (2023) and Safi et al. (2023), the presence of geopolitical problems is closely linked to environmental concerns, as distant issues have the potential to generate instability and conflict. Climate change encompasses more than mere environmental concerns, as it exacerbates conflicts between nations and occasionally leads to conflicts over natural resources. The economics and investment in electric vehicles (EVs) and reinvestment can be influenced by various factors (Husnain, et al., 2022). This phenomenon is exemplified by the environmental degradation resulting from political instability and violence, as governments prioritize immediate economic benefits over long-term sustainability. Moreover, geopolitical risk has the potential to impact the availability of natural resources, such as clean water and food, which play a crucial role in determining the overall wellbeing of individuals. Political instability and wars can significantly impact supply chains, leading to inadequate resource acquisition and depletion of key resources for individuals and groups (Zhang et al., 2023b; Khurshid et al., 2023e) Figure 1.
➢ The contribution of this research is manifold:
➢ The research investigates the extent to which human wellbeing and development are
➢ related to the consumption of non-renewable energy and how this links to geopolitical issues. The study focuses on the long-term sustainability of existing socio-economic structures, considering global development disparities and the demands of individual nations. The scope of this study is defined by the inclusion of the following three topics: non-renewable energy consumption, the concept of wellbeing, and the ecological intensity of such wellbeing. Although this concept is not new, we have not found any research that decomposes the effects of non-renewable energy consumption into oil, coal, gas, and electricity consumption on the ecological intensity of wellbeing. Secondly, we analyze and synthesize the concept of wellbeing, drawing upon various streams of literature. It is important to compile a working definition of this term, as well as potential notions of what constitutes a non-sustainable level of development. This will allow the concept of ecological intensity and wellbeing to be fully understood.
➢ Research on Pakistan’s biodiversity highlights the importance of understanding how geopolitical challenges can impact conservation efforts. Political upheaval and violence can harm ecosystems and animal populations, necessitating careful consideration of hotspots and protected areas. Transnational issues like border conflicts, water management, and migratory patterns also affect biodiversity preservation. Addressing this research gap can provide valuable insights for policymakers, conservation practitioners, and international organizations to develop strategies for biodiversity conservation in the face of geopolitical challenges.
➢ Previous research in Pakistan has explored the relationship between economic growth and environmental degradation. However, there needs to be more research in the specific context of Pakistan regarding validating the Environmental Kuznets Hypothesis and its implications for biodiversity loss. We could address this research gap by conducting a comprehensive study that investigates the impact of economic growth on EWIB.
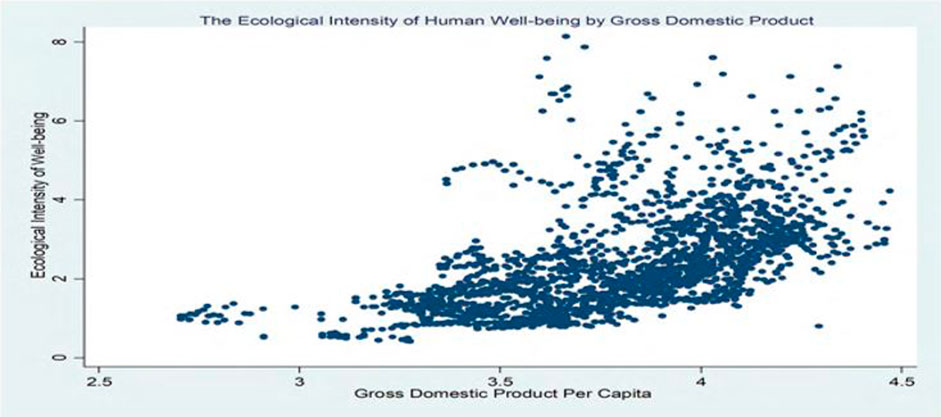
Figure 1. EIWB by GDP per capita (1989–2013) for developing countries (Source: Irshad et al., 2021).
2 Brief review of prior literature
2.1 Economic development and EIWB
According to the ecological modernization hypothesis, economic progress harms the natural world. Furthermore, extensive research shows that the influence of subsequent economic growth on human wellbeing diminishes once we reach a fair level of wellbeing (Brady et al., 2007). Grossman and Krueger (1995) examined the reduced-form relationship between significant environmental factors and per capita income. They could not find any proof that economic expansion causes an ongoing decline in environmental quality. Economic development delivers a first stage of improvement for the majority of metrics. The tipping points for various populations vary but often occur before a nation’s per capita income surpasses $8,000 (Rosa and Dietz, 2012). According to Dietz and Jorgenson (2014), economic progress has had little impact on EIWB in less developed nations since the early 1970s, while somewhat increasing intensity in wealthier ones. Reid et al. (2005) used the biophysical environment and depended on various ecosystem services to promote human wellbeing by employing economic growth. As a result, people disrupt biogeochemical cycles, harvest biomass, and modify land cover, among other environmental pressures.
2.2 Geopolitical risk and EIWB
The literature needs to sufficiently develop studies on the relationship between GPR and ecological intensity of wellbeing. Recent studies on the environmental effects of GPR include Riti et al. (2022), Husnain et al. (2022), Zhao et al. (2021), and Anser et al. (2021). In the BRICS nations, Riti et al. (2022) found a positive correlation between GPR and environmental degradation. They noticed that the GPR-environment relationship exhibits an aggregation bias. Anser et al. (2021) observed that GPR simultaneously raises CO2 emissions in the BRICS nations. From 2002 to 2019, Tahir et al. (2022) evaluated the effects of terrorism on environmental sustainability and ecosystems in the MENA nations. This study also tested the Environmental Kuznets Curve (EKC) theory. The empirical findings show that since terrorism raises CO2 emissions, it is bad for the sustainability of the environment. The results also revealed a significant positive link between energy use and CO2 emissions. Empirically, the results confirmed the MENA region’s applicability of the EKC theory.
2.3 Non-renewable energy consumption and EIWB
According to Shahbaz and Dube (2012), using fossil fuels for energy in daily life, manufacturing, emitting considerable amounts of smoke, and using wood as a fuel source all increase CO2 emissions. Emissions of CO2 harm various sectors of the economy, such as forestry and agriculture. According to Wang (2021) and others, employing fossil fuels to stimulate economic growth may be successful during the first stages of growth. However, it will not be helpful during the later stages. Wenlong et al. (2023) used the ARDL approach. They discovered that coal transportation and rents both considerably and favorably contribute to the short- and long-term decline of ecological footprints at various quantile ranges. Karlilar and Emir (2023) examine the relationship between fuel usage, renewable energy sources, and ecological impact in India using data from 1995 to 2018. The findings revealed that utilising coal contributes significantly to ecosystem degradation. Majeed et al. (2021) investigated the asymmetric influences of aggregate and disaggregate energy use, economic development, and environmental quality in Pakistan from 1971 to 2014. The data suggested that increased oil use had a detrimental impact on the ecology. Odebayo et al. (2023) use quantile techniques, such as quantile cointegration, quantile causality, and quantile-on-quantile regression, to look at these connections. The study’s conclusions indicate that oil consumption, hydroelectric energy use, population density, and economic growth drive most quantiles of environmental deterioration in Turkey.
2.3.1 Concluding remarks
The ecological intensity of human wellbeing focuses on promoting sustainable practices, protecting ecosystems, and valuing nature’s benefits for a healthier, more resilient, and more fulfilling future. The literature on economic development, geopolitical risks, and non-renewable energy consumption concludes that these indicators significantly and negatively impact the ecological intensity of human wellbeing. However, existing literature often focuses on isolated aspects of the relationship between non-renewable energy consumption, geopolitical risks, economic development, and ecological wellbeing. There is a lack of comprehensive research that integrates these factors to provide a holistic understanding of their interconnections. The current research adds to the literature since it attempts to investigate the combined impact of economic development, geopolitical risk, non-renewable energy consumption, and ecological intensity on human wellbeing. Moreover, the existing literature mostly examines the relationship between these factors in developed countries, overlooking the challenges faced by emerging economies and vulnerable regions like Pakistan. Further research is required to address the specific dynamics and vulnerabilities in these contexts.
3 Methodology
3.1 Conceptual framework
Figure 2 illustrates the relationship between EIWB, economic development, geopolitical risk, and non-renewable energy consumption. Economic development can lead to increased resource extraction, pollution, habitat destruction, climate change, and other ecological impacts that affect the ecological intensity of wellbeing in the early stages of economic growth and development. Environmental regulations, technological advancements, and public awareness initiate a transition phase that involves efforts to mitigate ecological impacts. In this phase, economic growth continues, and societies become more aware of the environmental consequences and consumption patterns. Societies may experience improved ecological wellbeing once they reach a certain level of economic development. The improvement in economic wellbeing could be due to factors such as improved environmental policies, increased awareness, technological innovations, and shifts towards sustainable production and consumption patterns.
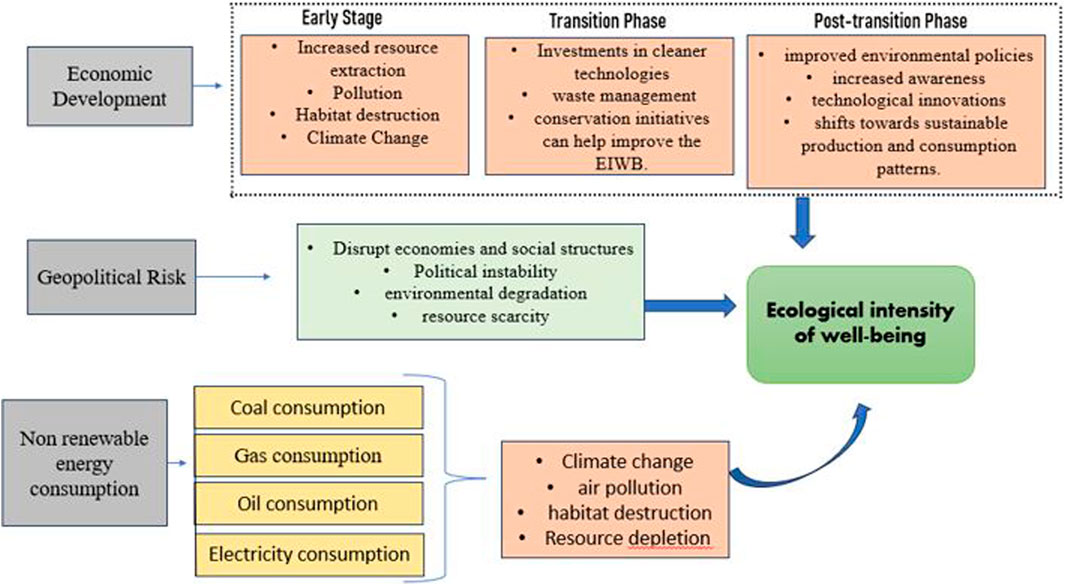
Figure 2. Transmission Mechanism of study variables.
Geopolitical risk impacts EIWB by disrupting economies, social structures, and political stability, which can lead to environmental degradation and resource scarcity. Non-renewable energy consumption contributes to climate change, air pollution, habitat destruction, and other environmental degradation, impacting the ecological intensity of wellbeing. Transitioning towards renewable energy sources, improving energy efficiency, and promoting sustainable practices are essential for reducing ecological impacts and ensuring a healthier and more sustainable future for both ecosystems and human wellbeing.
3.2 Variable description and data setting
The following mod can show the variable linkage:
The baseline model of our study is specified as:
Where EWIB is in the ecological intensity of wellbeing, LCC, LEC, LGAS, LOC, and LENG are a log of coal, electricity, gas, oil, and energy consumption, respectively. At the same time, LGDP is the log of GDP per capita, GPR, LURB, geopolitical risks, and the log of urbanization, respectively. According to the simultaneous model, the LGDP (log of GDP per capita) and other LCC, LEC, LGAS, LOC, LENG, LGPR, LURB, and other log-transformed variables are applied. These transformations are, namely, of logarithmic, inverse, and square-root ones which allow to give sense to a coefficient and to settle a problem of distribution and scale of a variable. While including the squared term of GDP per capita (GDP2) can permit capturing some anomalous nonlinear relationships between GDP and EWIB, such relationships in GE analysis could be alternatively explained by other cultural factors. Variables and metrics, like LGDP and LCC, are log-transformed to address skewness and heteroscedasticity.
The Ecological Intensity for Human wellbeing is the relationship between environmental pressure and human wellbeing. The authors applied this method at the national level using the child mortality rates per capita to the environmental ecological footprint indicator for each country. Almost in every country, research finds the mortality rate of children being monitored and well trusted indicator of prosperity. This renewable energy option is for not only reducing lovers but also the environment and carbon dioxide emissions. This method, founded on the data of the World Bank (2012) has also been employed by a few recent studies in the area of economic measure of the ecological intensity and carbon intensity of human wellbeing (e.g., Dietz et al., 2012; Jorgenson, 2014, respectively). While these aspects resulted, we selected the rate of life expectancy which we present in the article. The per capita ecological footprint (Jorgenson and Clark, 2012; Kitzes et al., 2009) constitutes a thorough assessment of consumption-based ecological strain. The Per Capita Ecological Footprint calculates the amount of bio-productive land required for maintaining consumption levels from crops, grassland, pasture, fishing grounds, and forest, as well as the land needed to absorb carbon dioxide emitted by fossil fuels and constructed infrastructures. The footprint includes the space required for built infrastructure (such as roads and buildings) and the land required to absorb the carbon dioxide released during fossil fuel usage. A recent inclusion is the subcomponent of the ecological footprint that deals with nuclear impact. This subcomponent of the nuclear footprint, which only made up a small percentage of the global footprint in 2000, is predicted to be like the footprint of producing the same amount of power using fossil fuels. The ecological footprint is computed by combining importation with domestic production and subtracting exports from domestic production. The ecological footprint is calculated for approximately 600 products, including raw materials and processed goods. Alternative metrics might be used in future research to account for environmental impacts.
Before the analysis can proceed, there is a problem with using a ratio as a dependent variable. A ratio can be dominated by either the numerator or the dominator since their variability and range might differ. The ecological footprint per capita’s coefficient of variation (standard deviation/mean) in the current study is 0.355. The infant mortality rate has a coefficient of variation of 0.253, with a range of 124.5–52.8. As a result, the variation in ecological footprint per capita (the numerator) exceeds the variation in infant mortality rate (the dominator). Under these conditions, variations in the ecological footprint per capita will generate variations in the ratio. To solve this issue, we employ the same strategy developed by New Economics Foundation scholars Dietz et al. (2012), Jorgenson et al. (2014), and Jorgenson (2015). We limit the numerator and denominator coefficients of variation to be equal by including a constant in the numerator that changes the mean without changing the variance. The coefficients of variation for the two variables in our data may be equalized by multiplying the ecological footprint per capita by 45.013. As a result, we employ the following metric to assess the ecological intensity of human wellbeing:
E.F. stands for ecological footprint per person, EIWB for the ecological intensity of human wellbeing, and IMR for infant mortality rate. Following earlier studies (Dietz et al., 2012; Jorgenson, 2014), we multiply the ratio by 100 to scale it.
The current research investigates the relationship between renewable energy sources, economic growth, geopolitical risks, and ecological intensity of wellbeing. This analysis used the annual data series from 1980 to 2021 for Pakistan. The data was driven by considerations of data availability, temporal consistency, and methodological rigor. The primary data sources used in this study are the WDI (World Development Indicators) and the Ministry of Energy. Table 1 below presents a detailed description of variables, their assigned symbols, and data sources.
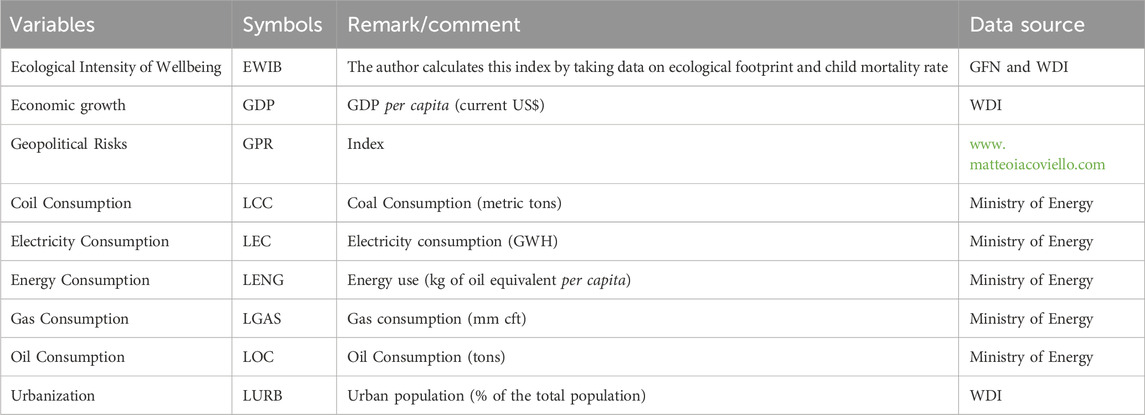
Table 1. Description and definition of variables.
3.2.1 Estimation technique
In addition, using the method of Koenker and Basset, the study used the quantile regression analysis to investigate the relationship of EIWB with Non-renewable energy sources like coal, gas, electricity, and oil consumption along with economic growth, and geopolitical risks. Quantile regression analysis is a useful method in scenarios where the relationship between variables may vary across various parts of the distribution because it provides increased flexibility, robustness, and insights into conditional relationships. Furthermore, this technique defies the limitation on the assumption of the same mistake. The model may be broadly characterized as follows:
In Eq. 3,
In addition, by reducing the appropriate value of "
Quantile regression uses a generalized temporal technique or a basic linear technique. As a result, we restrict the scaled absolute errors for each criterion to a reasonable level, such that the weighting of positive and negative residues differs in the given quantity of valuing. As a result, by extending Eq. 2 in the following direction, the interaction of relative variables may be derived as:
In Eq. 6,
4 Results and discussion
4.1 Descriptive statistics analysis
The descriptive statistics findings are shown in Table 2 below. The Jarque-Bera test probability values revealed that most variables are not normally distributed. Non-stationary data may have trends, seasonality, or other patterns that change over time. The non-normality of the data can be an indicator that these patterns are not constant and may require special handling in modeling.

Table 2. Descriptive statistics.
4.2 Stationarity test
To identify the stationarity of the variables of each variable, we used a Phillip Perron (P.P.) unit root test. The results (Table 3) confirm that the series is a mix of stationary and non-stationary variables.
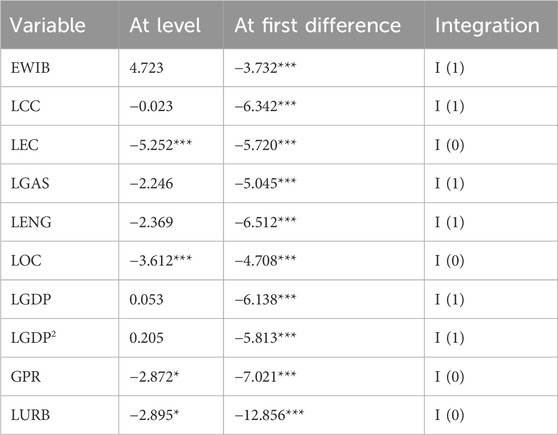
Table 3. Results of phillip perron unit root test.
4.3 Structural break unit root test
We conducted the Zivot and Andrews (1992) test and discovered that, with a single unknown break, EWIB, GDP, LCC, LOC, LGAC, and LURB exhibit stationarity at both level with intercept and trend. Conversely, LENG and LOC were found to be stationary at first difference. This suggests varying levels of integration among the series. Further validation using the Zivot and Andrews (1992) test with a single unknown structural break confirmed the robustness of our findings, indicating a mixture of I (0) and I (1) integration among the variables.
4.4 Results of quantile regression estimation
Table 4 presents the results of the quantile regression analysis. Non-renewable energy consumption has many impacts, such as rising temperatures, changing precipitation patterns, and extreme weather events associated with climate change. These have far-reaching ecological consequences, including altered ecosystems, disrupted biodiversity, and increased risks to human health and livelihoods. The current study separates non-renewable energy consumption into four categories: total electricity consumption, coal energy consumption, oil energy consumption, and gas energy consumption. Our results support the claim that LCC significantly impacts the EWIB by 33.9 percent. LEC impacted EWIB negatively and significantly, by 5.636 percent.
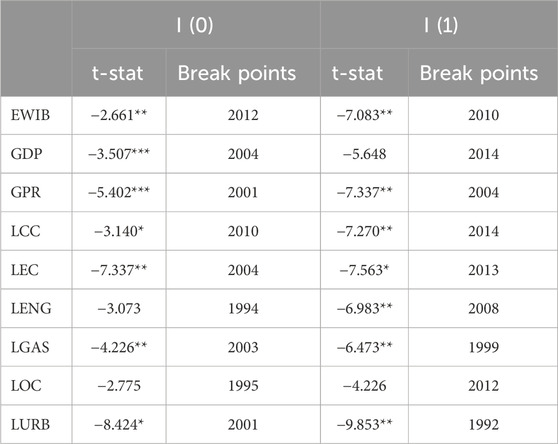
Table 4. Zivot-Andrews Structural Break Unit Root test Results.
Furthermore, LENG has a positive and significant impact of 11.6 percent, while LGAS has a negative and insignificant impact (59.8 percent) on EWIB. Besides, LOC impacts the EWIB negatively and insignificantly, by 37.4 percent. The results show that the adverse indications are quantitatively greater than the positive signs, implying that non-renewable energy use causes environmental deterioration and harms EIWB. Nathaniel and Khan (2020) discovered that non-renewable energy considerably triggers environmental deterioration in ASEAN nations. Destek and Sinha (2020) discovered that growing non-renewable energy usage increases environmental damage.
Non-renewable energy damages environmental quality. According to Chien (2022), the consumption of renewable energy significantly improves environmental quality at all quantiles (0.10–0.90), while the consumption of non-renewable energy only significantly deteriorates it at lower quantiles (0.10–0.40). Previous studies, such as those of Butler (2012) and Hannun and Razzaq (2022), also support the negative impact of oil consumption on EIWB. Brauers (2022) also explains the negative relationship between electricity consumption and ecological wellbeing, pointing out that the generation and consumption of electricity have ecological implications due to the release of greenhouse gases by fossil fuel-based power plants.
Our findings show that GDP negatively impacts the ecological intensity of wellbeing per capita, with a one percent increase in GDP reducing EWIB by 0.302 units. In our model, we also incorporated the quadratic term of GDP because we wanted to know about the impact of economic growth over time. Our results from Table 5 also confirm that if GDP doubles, it can increase EWIB by 0.416 units. These findings support the EKC theory, consistent with earlier research (Knight and Rosa, 2011; Dietz et al., 2012). As a result, developing nations continue to lag in achieving the critical GDP barrier, after which EIWB may decline. According to Irshad et al. (2021), economic expansion favors EIWB, and rising urbanization can also boost EIWB. These data indicate that current modernization practices are less likely to lead to sustainability in underdeveloped nations. Ahmad et al. (2021) discovered that economic expansion reduces biocapacity but raises it until they reach a specific threshold level.

Table 5. Results of quantile regression estimates.
The coefficient of GPR is −0.055 and insignificant, which shows that a unit increase in GPR reduces EWIB by 0.055 units. Geopolitical conflicts can destroy natural resources and ecosystems. Our results are consistent with those of Osama et al. (2023), who found that the impact of GPR on EIWB is negative and statistically significant, with coefficient values of 0.028. Riti et al. (2022), Husnain et al. (2022), and Anser et al. (2021) also support the negative relationship. On the contrary, Sweidan (2021) found that geopolitical risk tends to lower environmental stress levels or promote environmental sustainability.
With a coefficient value of 9.285, urbanization has a strong and favorable influence on EWIB. It implies that a 1% rise in LURB improves EWIB by 9.285 units. Our results agree with those of Irshad et al. (2021), who discovered that increased urbanization could enhance EIWB. According to the ecological modernization idea, as civilizations become more urbanized, environmental quality and related advantages improve (York et al., 2003). These findings contrast those of Ahmad et al. (2021), who reported a negative association between urbanization and biocapacity per capita, showing that urbanization is a substantial cause of biocapacity loss in Brazil. According to Chen and Chang (2016), Khurshid et al. (2022a) and Khurshid et al. (2022b), urbanization has significant positive effects at all income levels, indicating that the ecological footprint would increase with the rate of urbanization in a country with high or low income. The pursuit of economic progress by emerging nations will impact the environment. Developed nations may seek to boost their economies through activities that harm the environment.
4.5 Estimated quantile process
Table 6 shows the estimated quantile process results for GDP, GDP2, GPR, LECC, LEC, LGAS, LOC, and LUBR with a quantile range of (0.1–0.9). The quantile range of all variables demonstrates the enormous influence of various non-renewable energy consumption, GPR, and GDP on the EIWB in Pakistan.
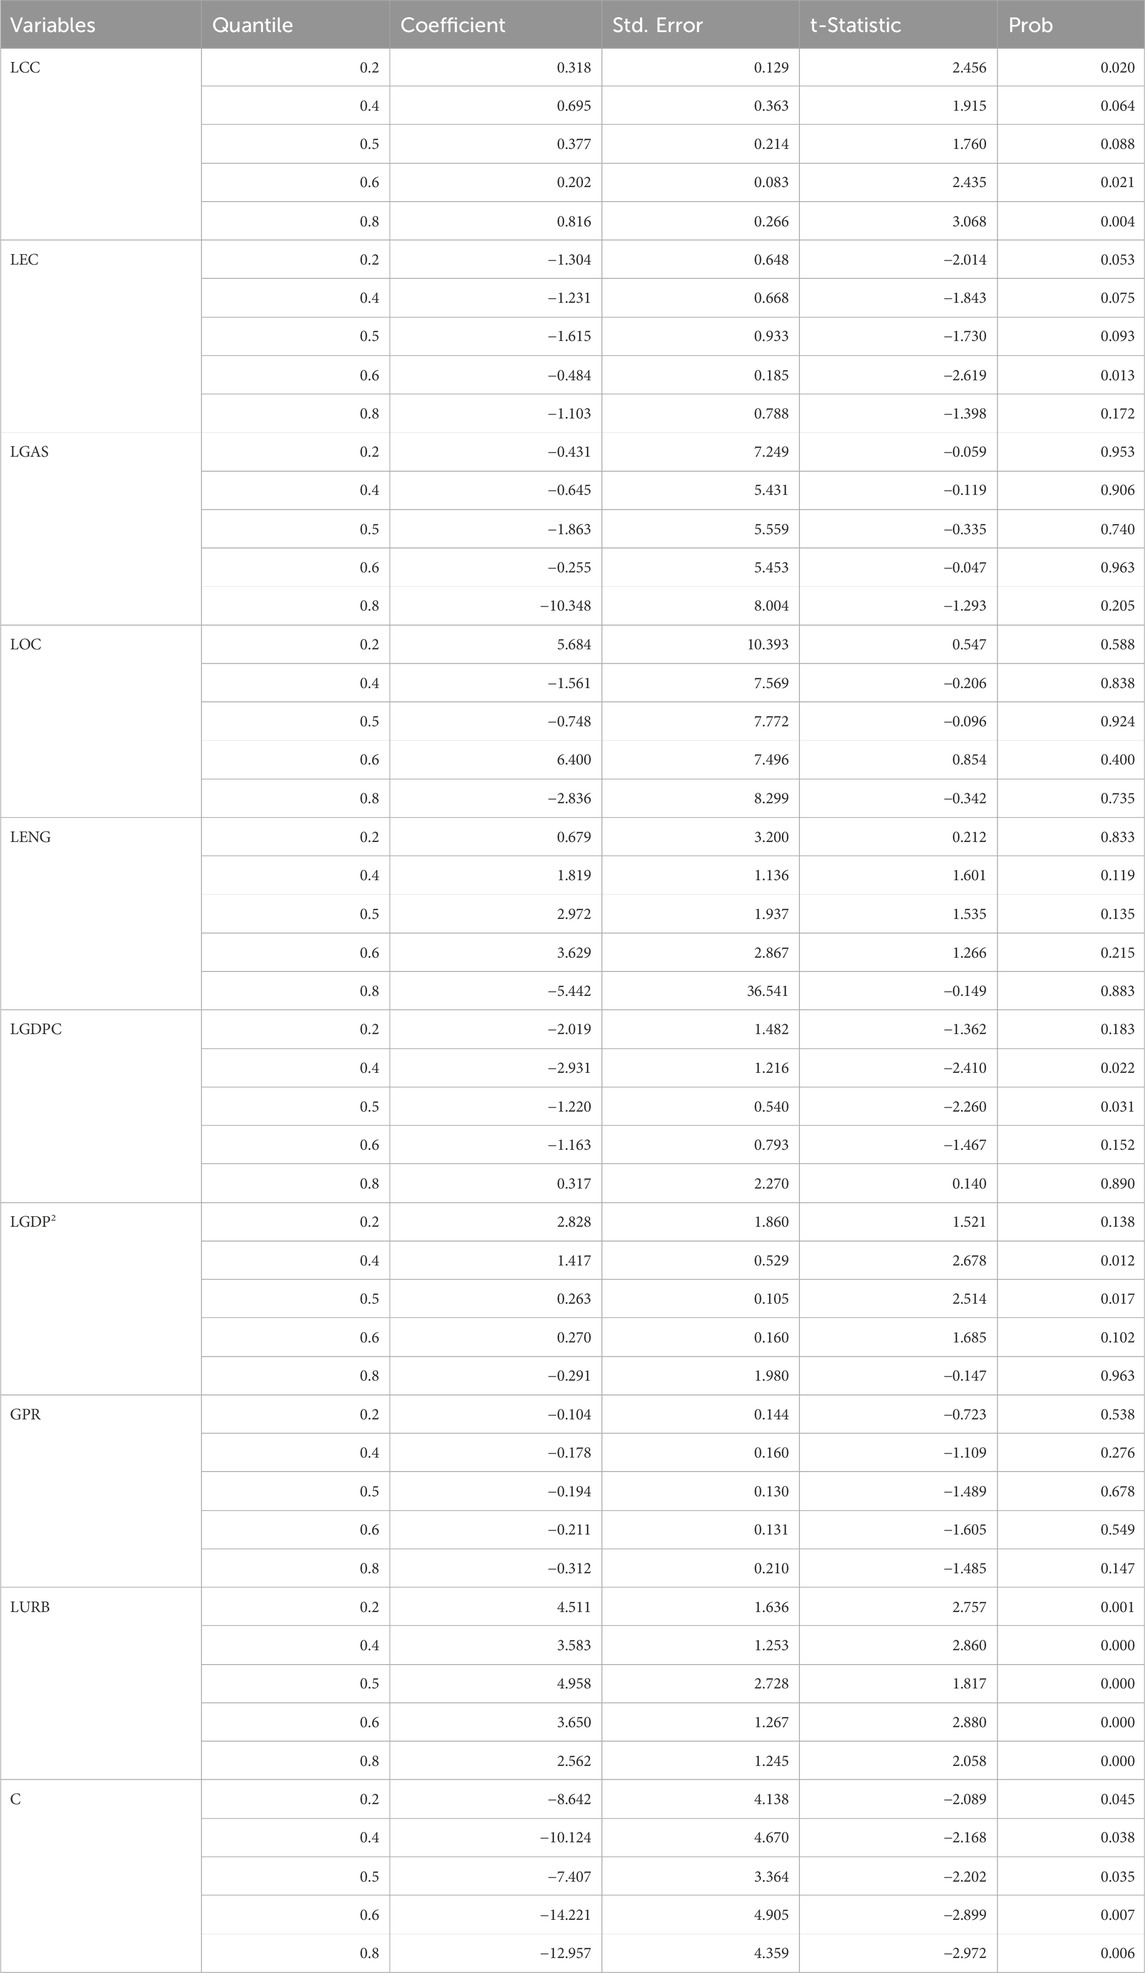
Table 6. Outcomes of estimated quantile process.
Figure 3 also shows a graphical depiction of the quantile process estimations. It demonstrates the significance of the components on which the influence of ecological intensity of wellbeing is created throughout the cycle. The bold red line represents a rough estimate and a 90% confidence range.
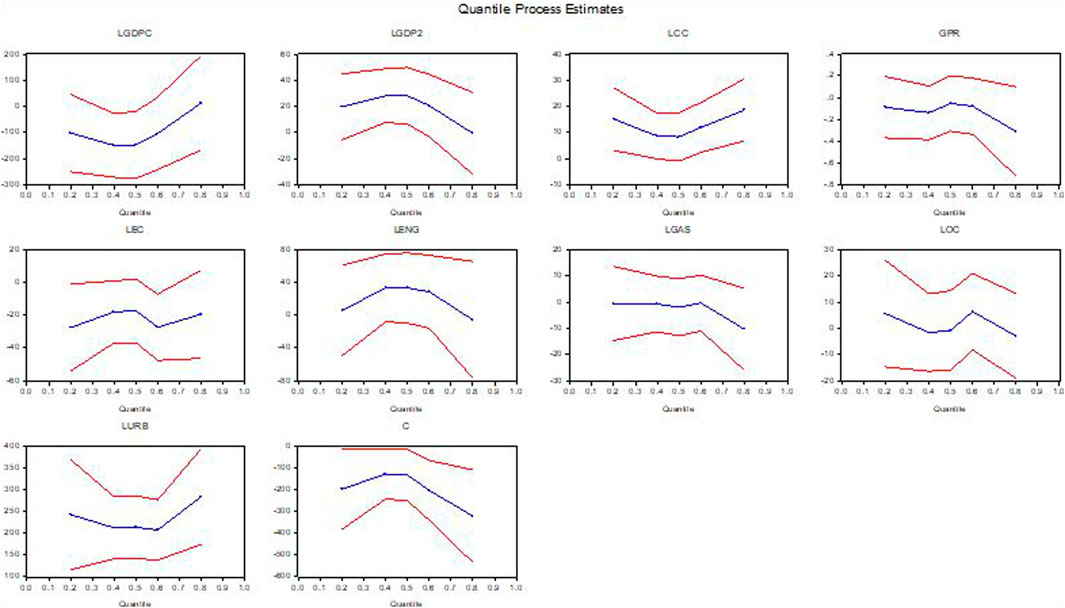
Figure 3. Plot of quantile process estimates.
4.5.1 Estimation of symmetric quantile test
Table 7 demonstrates that the Wald test summary Chi-Sq. statistic value of 85.010 is statistically significant at the 1% level, hence the null hypothesis of slope equality across quantiles is rejected. This finding validates the conclusion enforced by Chart 1 and confirms that the connection between the explanatory variables and the dependent variable varies over quantile values. This is relevant because it shows that in cases when the research emphasis is on specific quantiles, linear models can lead to inadequate conclusions as to whether there is a link between the explanatory and dependent variables, and if a link exists these models may suggest a wrong conclusion about the strength of the link. Table 7 also presents the results of the test for symmetry between quantiles. The null hypothesis of this test is that the distribution is symmetric. The test statistic is statistically significant at the 1% level, which shows significant asymmetry and contradicts the hypothesis of null symmetry between quantiles. These data confirm the diverse influence of the explanatory variables on EWIB.
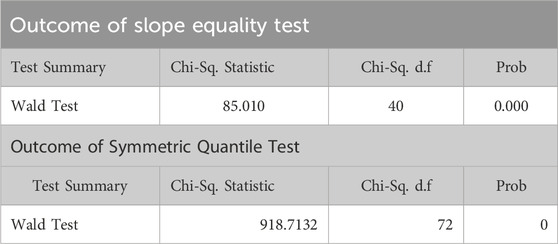
Table 7. Quantile slope equality test and symmetric quantile test.
4.5.2 Estimates of cointegration regression techniques
The cointegrating equation estimations include the application of the Dynamic least squares (DOLS and Fully modified least squares (FMOLS) approaches proposed by Phillips and Moon (1999) and Kao and Chiang (2000) respectively. These techniques seek to estimate the long-run relationship among the variables. DOLS and FMOLS solve the problem of endogeneity and eliminate small sample bias, the application of the FMOLS approach essentially requires that all variables must have the same order of integration and that the regressors must not appear as co-integrated. The current research also applied Fully modified least squares (FMOLS) and Dynamic least squares (DOLS) to expose the linkages among variables. Table 8 reflects the results of FMOLS and exposes the effect of variables LCC (0.683), LEC (−0.346), LENG (0.098), and LGAS (−0.532) on EWIB in Pakistan. From our results, the results of FMOLS, LCC, and LENG positively impact EWIB, while LEC and LGAS negatively impact EWIB.
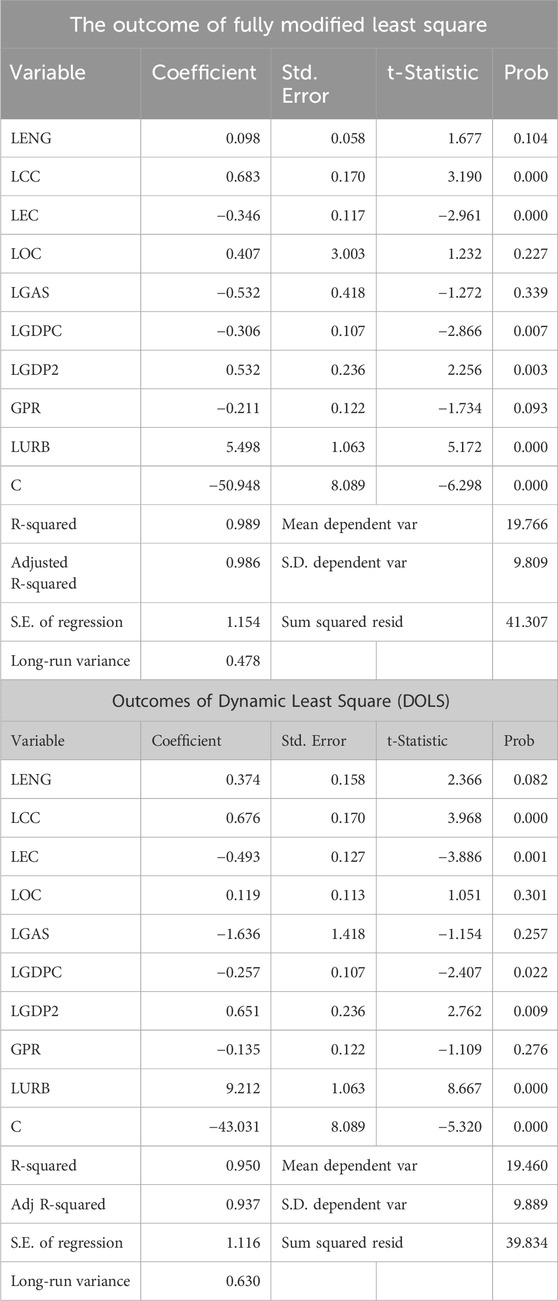
Table 8. Outcomes of FMOLS and DOLS.
5 Conclusion and policy recommendation
The research examines the impact of non-renewable energy consumption, geopolitical risks, and economic development on Pakistan’s ecological wellbeing, analyzing the components of non-renewable energy like oil, coal, gas, and electricity using quantile regression.
Firstly, we find that coal consumption and total energy consumption positively affect the EWIB, while LEC, LGAS, and LOC negatively contribute to the EWIB. Also, the outcome of cointegration regression analysis through FMLOS and DOLS reveals that LCC and LOC positively affect the EWIB while LEC and LGAS negatively affect the EWIB. Non-renewable resources, used in manufacturing, transportation, and energy production, primarily meet Pakistan’s energy needs. However, these resources can lead to biodiversity loss, habitat destruction, pollution, climate change, population decline, and even extinction. Disruptions to ecosystems, such as heavy metal discharge into rivers and pollution from oil extraction, can also negatively impact marine and coastal habitats.
Secondly, we found that economic development significantly impacts ecological wellbeing, with impacts varying across quantiles. It can contribute to environmental degradation, with CO2 emissions being the main cause. The EKC is valid in the case of Pakistan. Thirdly, our analysis uncovers the role of geopolitical risks in shaping ecological wellbeing, with heightened risks amplifying environmental pressures, particularly among countries already experiencing lower wellbeing levels. This underscores the importance of addressing geopolitical tensions and fostering international cooperation to mitigate environmental vulnerabilities.
To promote resilience and sustainability, the study suggests giving priority to renewable energy sources and enhancing energy efficiency in all spheres of the economy. Furthermore, to minimize negative effects, an integrated approach to economic and environmental policy is necessary, integrating strict environmental rules and green growth initiatives. Given the impact of geopolitical concerns on ecological wellbeing, it is important to promote diplomatic efforts and international cooperation to resolve conflicts in the region. Investing in conservation and ecological restoration projects, as well as public awareness and education campaigns, may further support sustainability efforts. By implementing these recommendations, Pakistan can progress towards a future that balances ecological wellbeing and economic development and skillfully manages geopolitical threats to safeguard the environment for future generations.
Data availability statement
The original contributions presented in the study are included in the article/supplementary material, further inquiries can be directed to the corresponding author.
Author contributions
NK: Conceptualization, Formal Analysis, Methodology, Software, Supervision, Writing–original draft. CE: Data curation, Funding acquisition, Investigation, Methodology, Writing–review and editing. NA: Methodology, Software, Validation, Visualization, Writing–review and editing.
Funding
The author(s) declare that no financial support was received for the research, authorship, and/or publication of this article.
Conflict of interest
The authors declare that the research was conducted in the absence of any commercial or financial relationships that could be construed as a potential conflict of interest.
Publisher’s note
All claims expressed in this article are solely those of the authors and do not necessarily represent those of their affiliated organizations, or those of the publisher, the editors, and the reviewers. Any product that may be evaluated in this article, or claim that may be made by its manufacturer, is not guaranteed or endorsed by the publisher.
References
Adebayo, T. S., Ullah, S., Kartal, M. T., Ali, K., Pata, U. K., and Ağa, M. (2023). Endorsing sustainable development in BRICS: the role of technological innovation, renewable energy consumption, and natural resources in limiting carbon emission. Sci. Total Environ. 859, 160181. doi:10.1016/j.scitotenv.2022.160181
Ahmad, M., Jiang, P., Majeed, A., Umar, M., Khan, Z., and Muhammad, S. (2020). The dynamic impact of natural resources, technological innovations, and economic growth on ecological footprint: an advanced panel data estimation. Resour. Policy 69, 101817. doi:10.1016/j.resourpol.2020.101817
Ahmad, M., Muslija, A., and Satrovic, E. (2021). Does economic prosperity lead to environmental sustainability in developing economies? Environmental Kuznets curve theory. Environ. Sci. Pollut. Res. 28 (18), 22588–22601. doi:10.1007/s11356-020-12276-9
Ahmad, N. I., Mahiyuddin, W. R. W., Azmi, W. N. F. W., Azlee, R. S. R., Shaharudin, R., and Sulaiman, L. H. (2022). Exposure Assessment of methyl mercury from consumption of fish and seafood in Peninsular Malaysia. Environ. Sci. Pollut. Res. 29 (17), 24816–24832. doi:10.1007/s11356-021-17483-6
Anser, M. K., Syed, Q. R., and Apergis, N. (2021). Does geopolitical risk escalate CO2 emissions? Evidence from the BRICS countries. Environ. Sci. Pollut. Res. 28 (35), 48011–48021. doi:10.1007/s11356-021-14032-z
Asif, Z., Chen, Z., An, C., and Dong, J. (2022). Environmental impacts and challenges associated with oil spills on shorelines. J. Mar. Sci. Eng. 10 (6), 762. doi:10.3390/jmse10060762
Brady, D., Kaya, Y., and Beckfield, J. (2007). Reassessing the effect of economic growth on well-being in less-developed countries, 1980–2003. Stud. Comp. Int. Dev. 42, 1–35. doi:10.1007/s12116-007-9003-7
Brauers, H. (2022). Natural gas as a barrier to sustainability transitions? A systematic mapping of the risks and challenges. Energy Res. Soc. Sci. 89, 102538. doi:10.1016/j.erss.2022.102538
Chen, Y., Chang, K. T., Han, F., Karacsonyi, D., and Qian, Q. (2016). Investigating urbanization and its spatial determinants in the central districts of Guangzhou, China. Habitat Int. 51, 59–69. doi:10.1016/j.habitatint.2015.10.013
Chien, F. (2022). How do renewable energy and non-renewable energy affect environmental excellence in N-11 economies? Renew. Energy 196, 526–534. doi:10.1016/j.renene.2022.07.013
Destek, M. A., and Sinha, A. (2020). Renewable, non-renewable energy consumption, economic growth, trade openness and ecological footprint: evidence from organisation for economic Co-operation and development countries. J. Clean. Prod. 242, 118537. doi:10.1016/j.jclepro.2019.118537
Dietz, T., and Jorgenson, A. K. (2014). Towards a new view of sustainable development: human well-being and environmental stress. Environ. Res. Lett. 9, 031001. doi:10.1088/1748-9326/9/3/031001
Dietz, T., Rosa, E. A., and York, R. (2012). Environmentally efficient well-being: is there a Kuznets curve? Appl. Geogr. 32 (1), 21–28. doi:10.1016/j.apgeog.2010.10.011
Dinda, S. (2004). Environmental Kuznets curve hypothesis: a survey. Ecol. Econ. 49 (4), 431–455. doi:10.1016/j.ecolecon.2004.02.011
Grossman, G. M., and Krueger, A. B. (1995). Economic growth and the environment. Q. J. Econ. 110 (2), 353–377. doi:10.2307/2118443
Hannun, R. M., and Razzaq, A. H. A. (2022). “Air pollution resulted from coal, oil and gas firing in thermal power plants and treatment: a review,” in IOP conference series: earth and environmental science (vol. 1002, No. 1, p. 012008) (IOP Publishing).
Husnain, M. I. U., Syed, Q. R., Bashir, A., and Khan, M. A. (2022). Do geopolitical risk and energy consumption contribute to environmental degradation? Evidence from E7 countries. Environ. Sci. Pollut. Res. 29 (27), 41640–41652. doi:10.1007/s11356-021-17606-z
Irshad, H., Hussain, A., and Malik, M. I. (2021). The ecological intensity of well-being in developing countries: a panel data analysis. Hum. Ecol. Rev. 27 (1), 79–99. doi:10.22459/her.27.01.2021.05
Jorgenson, A. K. (2014). Economic development and the carbon intensity of human well-being. Nat. Clim. Change 4 (3), 186–189. doi:10.1038/nclimate2110
Jorgenson, A. K., Alekseyko, A., and Giedraitis, V. (2014). Energy consumption, human well-being and economic development in central and eastern European nations: a cautionary tale of sustainability. Energy Policy 66, 419–427. doi:10.1016/j.enpol.2013.11.020
Jorgenson, A. K., and Clark, B. (2012). Are the economy and the environment decoupling? A comparative international study, 1960–2005. Am. J. Sociol. 118 (1), 1–44. doi:10.1086/665990
Jorgenson, A. K., and Dietz, T. (2015) Economic growth does not reduce the ecological intensity of human well-being (Vol. 10, pp. 149-156). Japan: Springer.
Karlilar, S., and Emir, F. (2023). Exploring the role of coal consumption, solar, and wind power generation on ecological footprint: evidence from India using Fourier ADL cointegration test. Environ. Sci. Pollut. Res. 30 (9), 24077–24087. doi:10.1007/s11356-022-23910-z
Khan, M. K., Khan, M. I., and Rehan, M. (2020). The relationship between energy consumption, economic growth, and carbon dioxide emissions in Pakistan. Financ. Innov. 6, 1–13. doi:10.1186/s40854-019-0162-0
Khurshid, N. (2023b). Does the causality between environmental sustainability, non-renewable energy consumption, geopolitical risks, and trade liberalization matter for Pakistan? Evidence from VECM analysis. Heliyon 9 (11), e21444. doi:10.1016/j.heliyon.2023.e21444
Khurshid, N., Ajab, S., Tabash, M. I., and Barbulescu, M. (2023c). Asymmetries in climate change and livestock productivity: non-linear evidence from autoregressive distribution lag mode. Front. Sustain. Food Syst. 7, 1139631. doi:10.3389/fsufs.2023.1139631
Khurshid, N., Emmanuel Egbe, C., Fiaz, A., and Sheraz, A. (2023d). Globalization and economic stability: an insight from the rocket and feather hypothesis in Pakistan. Sustainability 15 (2), 1611. doi:10.3390/su15021611
Khurshid, N., Fiaz, A., Ali, K., and Khurshid, J. (2022a). Climate change shocks and economic growth: a new insight from non-linear analysis. Front. Environ. Sci. 2111. doi:10.3389/fenvs.2022.1039128
Khurshid, N., Fiaz, A., Ali, K., and Rashid, M. (2023e). Unleashing the effect of energy efficiency, knowledge spillover, and globalization on environmental sustainability: a VECM analysis for policy empirics. Environ. Dev. Sustain., 1–23. doi:10.3390/su15021611
Khurshid, N., Khurshid, J., Munir, F., and Ali, K. (2023f). Asymmetric effect of educational expenditure, knowledge spillover, and energy consumption on sustainable development: nuts and Bolts for policy empirics. Heliyon 9, e18630. doi:10.1016/j.heliyon.2023.e18630
Khurshid, N., Khurshid, J., Shakoor, U., and Ali, K. (2022b). Asymmetric effect of agriculture value added on CO2 emission: does globalization and energy consumption matters for Pakistan. Front. Energy Res. 1796.
Knight, K. W., and Rosa, E. A. (2011). The environmental efficiency of well-being: a cross-national analysis. Soc. Sci. Res. 40 (3), 931–949. doi:10.1016/j.ssresearch.2010.11.002
Koenker, R., and Bassett, G. (1978). Regression quantiles. Econ. J. Econ. Soc. 46, 33–50. doi:10.2307/1913643
Li, C. (2022). China's multi-dimensional ecological well-being performance evaluation: a new method based on coupling coordination model. Ecol. Indic. 143, 109321. doi:10.1016/j.ecolind.2022.109321
Majeed, M. T., Tauqir, A., Mazhar, M., and Samreen, I. (2021). Asymmetric effects of energy consumption and economic growth on ecological footprint: new evidence from Pakistan. Environ. Sci. Pollut. Res. 28, 32945–32961. doi:10.1007/s11356-021-13130-2
Nathaniel, S., and Khan, S. A. R. (2020). The nexus between urbanization, renewable energy, trade, and ecological footprint in ASEAN countries. J. Clean. Prod. 272, 122709. doi:10.1016/j.jclepro.2020.122709
Niu, X. T., Yang, Y. C., and Wang, Y. C. (2021). Does economic growth improve public health? A cross-regional heterogeneous study in China. Front. Public Health 9, 704155. doi:10.3389/fpubh.2021.704155
Osama abed el-Raouf, M., Mageed, A., Salama, M. M., Mosaad, M. I., and AbdelHadi, H. A. (2023). Performance enhancement of grid-connected renewable energy systems using UPFC. Energies 16 (11), 4362. doi:10.3390/en16114362
Parveen, S., Farooq, S., Sahibzada, H. E., and Ali, H. (2020). Relationship of energy consumption and economic growth in Pakistan. J. Bus. Soc. Rev. Emerg. Econ. 6 (2), 605–617. doi:10.26710/jbsee.v6i2.1188
Rehman, G., Hamayun, M., Rahman, A., Haseeb, M., Umar, M., Ali, S., et al. (2021). Impacts of mining on local fauna of wildlife in district mardan and district mohmand khyber pakhtunkhwa Pakistan. Braz. J. Biol. 84, e251733. doi:10.1590/1519-6984.251733
Reid, W. V., Mooney, H. A., Cropper, A., Capistrano, D., Carpenter, S. R., Chopra, K., and Zurek, M. B. (2005). Ecosystems and human well-being-Synthesis: A report of the Millennium Ecosystem Assessment. Washington, DC: Island Press.
Riti, J. S., Shu, Y., and Riti, M. K. J. (2022). Geopolitical risk and environmental degradation in BRICS: aggregation bias and policy inference. Energy Policy 166, 113010. doi:10.1016/j.enpol.2022.113010
Rosa, E., and Dietz, T. (2012). Human drivers of national greenhouse-gas emissions. Nat. Clim. Change 2, 581–586. doi:10.1038/nclimate1506
Safi, N., Rashid, M., Shakoor, U., Khurshid, N., Safi, A., and Munir, F. (2023). Understanding the role of energy productivity, eco-innovation and international trade in shaping consumption-based carbon emissions: a study of BRICS nations. Environ. Sci. Pollut. Res. 30 (43), 98338–98350. doi:10.1007/s11356-023-29358-z
Shahbaz, M., and Dube, S. (2012). Revisiting the relationship between coal consumption and economic growth: cointegration and causality analysis in Pakistan. Appl. Econ. Int. Dev. 12 (1), 1–13.
Sweidan, O. D. (2021). The geopolitical risk effect on the U.S. renewable energy deployment. J. Clean. Prod. 293, 126189. doi:10.1016/j.jclepro.2021.126189
Sweidan, O. D. (2023). The effect of geopolitical risk on environmental stress: evidence from a panel analysis. Environ. Sci. Pollut. Res. 30 (10), 25712–25727. doi:10.1007/s11356-022-23909-6
Tahir, M., Burki, U., and Azid, T. (2022). Terrorism and environmental sustainability: empirical evidence from the MENA region. Resour. Environ. Sustain. 8, 100056. doi:10.1016/j.resenv.2022.100056
Wang, K., Baky, A. H., Bhuiyan, S. I., Kraus, J., Campbell, C., Stanich, R., et al. (2021). CO2-free conversion of fossil fuels by multiphase plasma at ambient conditions. Fuel 304, 121469. doi:10.1016/j.fuel.2021.121469
Wenlong, Z., Nawaz, M. A., Sibghatullah, A., Ullah, S. E., Chupradit, S., and Minh Hieu, V. (2023). Impact of coal rents, transportation, electricity consumption, and economic globalization on ecological footprint in the USA. Environ. Sci. Pollut. Res. 30 (15), 43040–43055. doi:10.1007/s11356-022-20431-7
York, R., Rosa, E. A., and Dietz, T. (2003). STIRPAT, IPAT and ImPACT: analytic tools for unpacking the driving forces of environmental impacts. Ecol. Econ. 46 (3), 351–365. doi:10.1016/s0921-8009(03)00188-5
Zaman, K., Abdullah, I., and Ali, M. (2017). Decomposing the linkages between energy consumption, air pollution, climate change, and natural resource depletion in Pakistan. Environ. Prog. Sustain. Energy 36 (2), 638–648. doi:10.1002/ep.12519
Zhang, Y., Li, L., Sadiq, M., and Chien, F. (2023b). The impact of non-renewable energy production and energy usage on carbon emissions: evidence from China. Energy and Environ., 0958305X2211504. doi:10.1177/0958305x221150432
Zhang, Y., Zhang, L., Yu, H., and Tu, Y. (2023a). Does Geopolitical risk drive natural resource extraction globally? A Case of Global. Resour. Policy 82, 103450. doi:10.1016/j.resourpol.2023.103450
Keywords: non-renewable energy consumption, environmental kuznet hypothesis, geopolitical risks, economic development, Pakistan
Citation: Khurshid N, Egbe CE and Akram N (2024) Integrating non-renewable energy consumption, geopolitical risks, economic development with the ecological intensity of wellbeing: evidence from quantile regression analysis. Front. Energy Res. 12:1391953. doi: 10.3389/fenrg.2024.1391953
Received: 26 February 2024; Accepted: 10 May 2024;
Published: 04 June 2024.
Edited by:
Melike E. Bildirici, Yıldız Technical University, TürkiyeCopyright © 2024 Khurshid, Egbe and Akram. This is an open-access article distributed under the terms of the Creative Commons Attribution License (CC BY). The use, distribution or reproduction in other forums is permitted, provided the original author(s) and the copyright owner(s) are credited and that the original publication in this journal is cited, in accordance with accepted academic practice. No use, distribution or reproduction is permitted which does not comply with these terms.
*Correspondence: Nabila Khurshid, bmFiaWxha2h1cnNoaWRAY29tc2F0cy5lZHUucGs=