 Abdulaziz Almutairi
 Naif Albagami1
- 1Department of Electrical Engineering, College of Engineering, Majmaah University, Saudi Arabia
- 2Department of Educational Sciences, College of Education, Majmaah University, Saudi Arabia
- 3Department of Electrical Engineering, College of Engineering, Qassim University, Unaizah, Saudi Arabia
- 4Department of Electrical Power Engineering, Faculty of Electrical Engineering, University Technology Malaysia (UTM), Skudai, Malaysia
- 5Department of Electrical Engineering, Graphic Era Deemed to be University, Dehradun, India
Demand management of electric vehicles (EVs) in shared residential parking lots presents challenges for sustainable transportation systems. Especially, in shared parking lots where multiple EVs share the same parking space, such as residential apartments. This is challenging due to involvement of various factors such as limited number of chargers, limited capacity of transformer, and diverse driving behavior of EV owners. To address this issue, this study proposes an optimal demand management framework that addresses limited chargers, transformer capacity, and diverse driving behavior to promote sustainable EV integration. By estimating driving behavior, energy consumption, and utilizing a linear programming-based optimization model, power allocation to EVs is optimized based on multiple factors. A satisfaction index is introduced to measure the satisfaction level of the EV community, further emphasizing user-centric sustainability. Performance analysis includes factors such as power usage, charger utilization, and community satisfaction. The performance of the proposed method is compared with a conventional method and the proposed method increase the satisfaction index of the community by up to 10%. In addition, sensitivity analysis is used to explore the impact of factors like charger availability, EV penetration, and transformer capacity limits. Results show that with 3% EV penetration, satisfaction levels exceed 75%, reaching over 80% with five chargers and 6% EV penetration.
1 Introduction
1.1 Motivation
Emissions in transportation represent a critical contributor to global environmental challenges, accounting for a significant portion of greenhouse gas emissions worldwide. It accounts for about a quarter of the total emissions (Vision, 2050), necessitating urgent decarbonization efforts to align with international climate agreements. Electric vehicles (EVs) are considered a viable option to reduce emissions from the transport sector, especially if they are charged with renewable power (Hussain and Musilek, 2022a). Therefore, the penetration of EVs is increasing day by day. For example, a total of 14% of all new cars sold were electric in 2022, up from around 9% in 2021 and less than 5% in 2020. Over 2.3 million EVs were sold in the first quarter of 2023, about 25% more than in the same period last year. It is expected that about 14 million EVs will be sold by the end of 2023, representing a 35% year-on-year increase (IEA Global EV, 2023). The International Energy Agency (IEA) has also increased the expected share of EVs by 2030 to 35% from 25% in the previous year’s outlook report (IEA Global EV, 2023). In addition different issues related to power electronics and their monitoring and control are discussed in (Liu, 2021; Wang et al., 2022). Similarly, the impacts on weak grids is discussed in (Shao et al., 2023) and on low carbon energy economy in (Luo et al., 2024).
However, the transition to EVs as a viable solution for reducing greenhouse gas emissions in the transportation sector presents several challenges for the power sector (Khan et al., 2022; Zhang et al., 2022). For example, at the power system level, accommodating the increased demand necessitates additional power plants to cater to EVs’ energy needs and serve as reserves (Heuberger et al., 2020). This heightened demand strains local infrastructure, causing technical issues like voltage fluctuations, network congestion, and phase imbalances, particularly at the distribution level (Hou et al., 2017). Moreover, in residential circuits, the peak EV load coincides with the peak residential load (weekday evenings) and can easily overload the local equipment (Fachrizal et al., 2021; Zhang H. et al., 2023). This is especially challenging for apartment complexes where several EVs are parked and charged together (Hussain and Musilek, 2022b). In addition, the impact of EVs on the air quality in China is assessed in (Lyu et al., 2024) for different cities throughout the lifecycle of EVs. Different types of dispatch strategies are also discussed in the literature such as distributed dispatch (Li et al., 2022) and dynamic dispatch (Duan et al., 2023). Finally, decentralized energy control is discussed in (Shirkhani et al., 2023) and an adaptive lightweight defect detection model is proposed in (Lei et al., 2023).
1.2 Literature review
To address these issues, related to equipment overloading in distribution systems, several studies are conducted in literature. These studies can be broadly divided into two categories. In the first group of studies, system-level measures are suggested to manage the load of EVs. For example (Almutairi and Alyami, 2021), proposes per-unit load estimation of EVs to model and analyze various penetration levels of EVs in different locations (Tran et al., 2019). suggests using home solar panels to charge EVs, aiming to reduce power surges and enhance grid stability (Kong et al., 2022). introduces an optimization model for managing EV charging loads in distribution networks, employing a bi-level programming approach to select charging stations and manage loads. Additionally (Mazhar et al., 2023), evaluates machine learning-based methods for managing EV load in smart cities. Several studies also proposed dynamic pricing as a method to manage EV loads. For instance (Limmer and Rodemann, 2019), proposes dynamic pricing at EV charging stations to reduce peak demand charges and increase operator profits. Similarly (Moghaddam et al., 2019), suggests dynamic pricing to shift loads during evening peaks, aiming to minimize overlaps with residential peak hours and reduce network instability risks. Furthermore (Sayarshad et al., 2021), introduces a dynamic pricing model for urban freight transport involving electric and conventional vehicles, aiming to reduce costs and delays. Different aspects of EVs models such variations in electrical parameters and underlying voltage tracking control are discussed in (Zhang et al., 2021; Zhang X. et al., 2023).
However, several studies report that system-level management and pricing policies alone may not be suitable for effectively managing the load of EVs (Hussain and Musilek, 2021; Geotab, 2023; Hussain and Musilek, 2021; Zhang et al., 2021; Zhang X. et al., 2023; Sayarshad et al., 2021; Moghaddam et al., 2019; Limmer and Rodemann, 2019; Mazhar et al., 2023; Kong et al., 2022; Tran et al., 2019; Almutairi and Alyami, 2021; Lei et al., 2023; Shirkhani et al., 2023; Shirkhani et al., 2023; Duan et al., 2023). This is primarily due to local equipment, especially in distribution systems, often experiencing overload from direct connections of EVs, resulting in technical issues such as voltage fluctuations and network congestion (Geotab, 2023). Moreover, implementing EV charging infrastructure might not universally suit all communities, especially in residential or commercial settings (Almutairi and Alrumayh, 2022). Consequently, a second group of studies has emerged recently, focusing on local demand management of EVs to mitigate local equipment overload, discussed below.
The growing adoption of EVs is discussed in (Tulabing et al., 2018), where localized demand control is proposed to prevent grid congestion. Simulations suggest that a 40% EV participation rate ensures grid resilience despite 100% EV adoption. Additionally (Chen and Chang, 2016), introduces a demand response-based method for EVs, employing cloud-based management to minimize costs. Meanwhile (Hussain et al., 2023), presents a welfare-focused model for realizing Vehicle-to-Vehicle (V2V) communication to manage EV charging stations with multiple EVs (Ahmadi et al., 2023). discusses various approaches for mitigating EV charging costs, including strategies such as solar power connections and V2X approaches. Furthermore, a comprehensive review conducted in (Zhang et al., 2020) focuses on energy management strategies for EVs, highlighting clustered EV demand management as a significant challenge.
1.3 Research gap and contributions
From the literature review, it is evident that numerous studies have explored managing EV load both at the system and local levels. However, most of these studies have concentrated on single homes, analyzing their collective impact on the system. In shared parking stations like residential apartments and commercial centers, EVs can readily overload local equipment, such as transformers. Additionally, allocating power to EVs during system peak load hours poses a complex challenge, involving factors such as customer satisfaction levels, available equipment capacity, and the number of chargers in each locality. The existing literature has not comprehensively considered all these factors together. It is imperative to consider all these factors collectively to present various options for policymakers aimed at maximizing EV owners’ satisfaction. These options may include installing more chargers or upgrading local equipment by the utility. Furthermore, this multi-factor analysis is essential for selecting the optimal number of chargers for a given number/percentage of EVs in any shared parking location.
To address the research gaps identified in the previous paragraphs, a multi-factor EV load management framework is proposed in this study. The aim of this framework is to offer insights into determining the optimal number of chargers and capacity constraints of local equipment (transformers). These insights will assist policymakers and utilities in planning system upgrades and installations suitable for accommodating a specific level of EVs. The framework’s implementation involves several steps. The major contributions of this study are as follows:
• EV driver behavior is estimated using the National Household Travel Survey (NHTS) dataset. Subsequently, EV parameters are utilized to determine the daily energy demand of EVs.
• An optimization model is then developed to allocate the available power among EVs within the charging station of a residential apartment complex. This consideration encompasses a shared parking lot accommodating both conventional vehicles and EVs.
• A satisfaction index is proposed to quantitatively measure EV owners’ satisfaction levels by comparing the allocated energy demand with the actual demand before their departure time.
• A sensitivity analysis is conducted to assess various parameters, including the number of chargers, EV penetration levels, and transformer capacity limits.
This analysis aims to further enhance the understanding of the framework’s performance under different conditions.
The reminder of the paper is organized as follows. Introduction section is followed by modeming of EV demand (Section 2), where vehicle driving parameters and EV parameters are extracted. In section 3, an optimization problem is formulated to allocate power to EVs considering various factors such as number of chargers, number of EVs, and capacity of the distribution equipment such as transformers. The performance of the proposed method is evaluated for a residential apartment complex in Section 4. A sensitivity analysis of various factors, including the number of chargers, the penetration level of EVs, and the limits of the transformer’s capacity in conducted in Section 5. Finally, conclusions and future research direction are discussed in Section 6.
2 Demand management of electric vehicles
Managing the demand of EVs in shared parking lots, particularly in residential apartment complexes poses significant challenges. These challenges arise from the limited availability of charging spots and the constraints imposed by local transformers. Consequently, this section begins with the estimation of EV load, followed by strategies for load management specifically focusing on EVs (Section 3).
2.1 System configuration
While the adoption of EVs is increasing worldwide, their penetration levels remain relatively low compared to conventional vehicles. Consequently, most shared parking lots are primarily designated for conventional vehicles, with only a limited number of slots equipped with chargers for EVs. This study considers this prevalent scenario where conventional vehicles dominate the parking spaces. Figure 1 illustrates the system configuration, comprising a residential apartment complex with a shared parking lot. The designated EV spots within the parking lot are equipped with chargers. Both the building and the charging stations are connected to the utility grid via the same transformer. Hence, effective management of the EV load in the charging station becomes crucial since the peak load of residential buildings often coincides with the peak load of EVs. This synchronization occurs because many EV owners tend to park their vehicles and commence charging upon arriving home in the evenings.

Figure 1. Overview of the system configuration.
2.2 Demand modeling of electric vehicles
Estimating the load of EVs involves several sequential steps. Initially, data pertaining to drivers’ travel behavior is required, followed by data related to EVs (Yang et al., 2024). Due to the limited availability of large datasets specifically for EV drivers, conventional vehicle data is commonly utilized, as seen in other studies (NHTS, 2023). The NHTS data is considered reliable and has been utilized by numerous researchers for similar analyses. Therefore, in this study, NHTS data is employed to estimate driver behavior. An overview of the various steps involved is presented in Figure 2. The data is first pre-processed to rectify any erroneous reporting, such as missing fields or unrealistic speeds. Subsequently, vehicle trips are recorded, and daily mileages are computed for each vehicle.
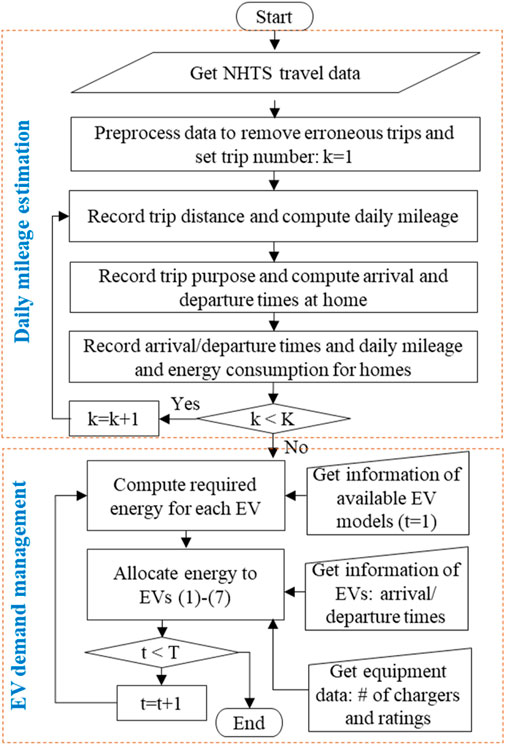
Figure 2. EV demand estimation and load management process.
In this study, stochastic simulation models for PEV deployment are implemented using a data-driven approach that integrates key components such as driver behavior, PEV characteristics, charging infrastructure, grid integration, and policy and market factors. The models utilize historical data and statistical methods to simulate driver behaviors, including trip lengths, frequencies, and charging preferences, based on datasets like the NHTS. The models also consider the need for charging infrastructure and assess the grid impact of PEV charging, taking into account factors like charger placement and capacity. Policy and regulatory analysis are incorporated to evaluate the impact of government policies on EV adoption.
2.2.1 Daily mileage estimation
To estimate the daily mileage of vehicles, each vehicle is assigned an ID and is tracked for each day. Then, the daily mileage is computed based on the total number of trips and distance covered during each trip. The extracted data is shown in Figure 3. It can be observed that most of the vehicles travel under 100 km daily. Details about the estimation process can be found in (Fathy et al., 2023). In this study, home is considered as the test case for EVs. However, it should be noted that the same process can be used to track EVs to different locations such as workplace or any specific location such as commercial centers. The problem formulation remains the same, irrespective of the location.
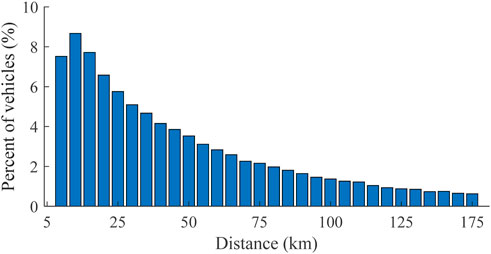
Figure 3. Daily mileage of vehicles extracted from the data.
2.2.2 Arrival and departure time estimation
The study records the origin and destination of each vehicle to ascertain their respective arrival and departure times at home. Notably, a vehicle might have multiple visits to the home, but for this study, the last arrival time and the first departure time are considered. The extracted arrival and departure times of vehicles are depicted in Figure 4, revealing that a majority of vehicles arrive home during the evening hours between 15:00 and 19:00.
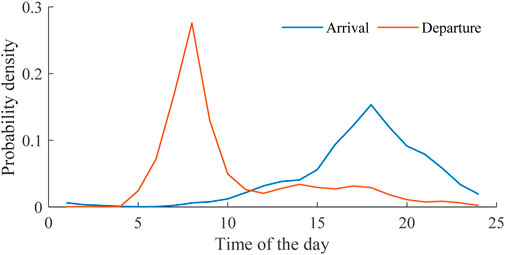
Figure 4. Daily arrival and departure times of vehicles.
2.2.3 Energy demand modeling
Following the estimation of daily mileage for vehicles, the study incorporates technical parameters specific to EVs. The data pertaining to commercially available EVs can be found in (EV Database, 2023). This dataset includes information on the mileage efficiency and useable battery size of various EV models. As per the database, the average energy efficiency across all EVs stands at 195 Wh/km, while the average useable battery size is recorded at 68.9 kWh (as of November 2023). This data serves as the basis for computing the daily energy consumption of EVs. Figure 5 illustrates the daily energy consumption of EVs, revealing that the majority of EVs consume under 25 kWh of energy on a daily basis. This observation aligns reasonably well with the average vehicle mileage of under 100 km per day and an average energy efficiency of 195 Wh/km.
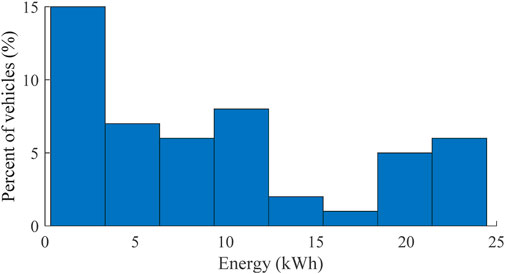
Figure 5. Daily energy consumption of EVs.
3 Problem formulation
In this section, an optimization problem is formulated to allocate power to EVs considering various factors such as number of chargers, number of EVs, and capacity of the distribution equipment such as transformers. A linear programming-based model is developed which is guaranteed to be convex and can easily be solved by commercial optimization tools. Due to the convexity of the problem, it can be easily solved in a very short time using commercial software such as CPLEX, making it suitable for real-time applications.
3.1 Objective function
The objective function is designed to minimize the energy difference between the required energy demand (
3.2 Constraints
Several constraints are necessary to ensure the equitable allocation of available energy among EVs while adhering to physical constraints such as the availability of chargers and the capacity of the transformer. For instance, Eq. 2 ensures that the total allocated power to any EV (
Additional constraints are necessary to ensure that the capacity limits of the transformer are not breached. Eq. 5 stipulates that the total power drawn by all EVs during any time interval ‘t’ should be less than or equal to the capacity of the transformer (
3.3 Satisfaction index
To evaluate the effectiveness of the proposed allocation scheme and to offer insights to policymakers, this study introduces an index. This index gauges the satisfaction level of EV owners by assessing the allocated power to each EV and comparing it with the required energy. It can be mathematically modeled as
Where
4 Performance evaluation
This section evaluates the performance of the proposed method using a residential apartment complex comprising 320 vehicles. For this case, the ratio of EVs is approximately 3% (10EVs). Subsequent sections conduct an analysis across different percentage levels. The developed linear programming model is implemented in Python, integrating the optimization tool CPLEX (IBM CPLEX, 2023). This study considers a scheduling horizon of 1 day (T = 24) with a sample period of an hour (t = 1). It should be noted that the performance of the proposed framework is tested for a scheduling horizon of 1 day. However, the formulations are generalized and can be used for any time horizon, such as a week, month, or year. Given the residential nature of the building, most vehicles arrive home in the evening and depart in the morning the following day. Hence, the scheduling horizon spans from 10 a.m. and extends until 10 a.m. the subsequent day. Additionally, most residential buildings utilize level 2 chargers for community charging. Consequently, this study employs level 2 chargers rated at 7.6 kW power.
4.1 Input data
To facilitate visualization, this section focuses on 10 selected EVs, constituting roughly 3% of the total vehicle fleet. Table 1 displays the parameters associated with these selected EVs. The original load demand for each EV is randomly generated within the range of (Liu, 2021; EV Database, 2023) kWh, aligning with the survey data discussed in the previous section. Furthermore, the arrival times of these EVs correspond to the survey data, reflecting the trend of vehicles arriving home mostly during the afternoon and evening hours. Similarly, the departure time of most vehicles is early morning the following day. Therefore, the arrival and departure times for each EV are randomly generated (separately) following a normal distribution. The mean and standard deviation of EV arrival and departure times are based on the NHTS survey data, discussed in the previous section. EVs with both short and long parking durations are selected for this analysis to consider different types of drivers. The parking duration is determined based on the arrival and departure times. In this section, two chargers are considered. Additionally, the transformer’s capacity (remaining capacity after serving the building load) is set at 35 kW. The profile of the residential apartment complex on a selected day is shown in Figure 6.
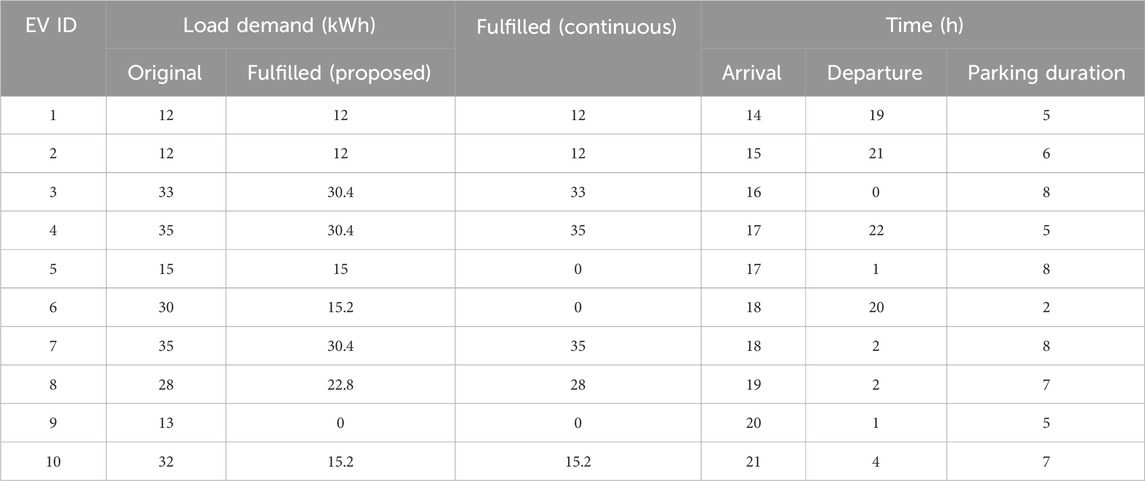
Table 1. Input data of EV fleet used in this section.
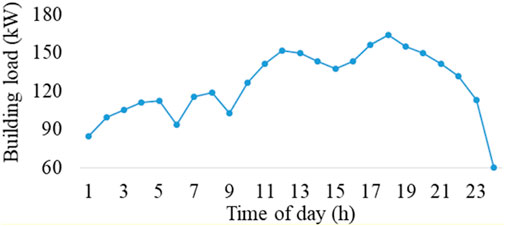
Figure 6. Daily energy consumption profile of the building.
4.2 Performance evaluation
This section conducts an analysis of the proposed method’s performance using a fleet of 10 EVs based on the parameters outlined in the input data section. The evaluation assesses the performance concerning energy allocation, charger utilization, and driver satisfaction (utilizing the proposed satisfaction index). The performance of the proposed method is compared with conventional method (named as continuous), where once EVs occupies the charger it remains connected until it is fully charged.
4.2.1 Energy allocation
An overview of the original demand for each EV and the total allocated energy before their departure time is depicted in Figure 7. Notably, it is evident that the energy demand of EV1, EV2, and EV5 is entirely satisfied owing to their relatively lower energy demands and medium to high parking durations (refer to Table 1). Furthermore, for EV1 and EV2, the chargers were available since they were the first two EVs to arrive home (Table 1). Interestingly, despite being parked for 5 h, none of the energy demands for EV9 are fulfilled. This occurred because both chargers were occupied by other EVs, remaining unavailable before EV9’s departure. This observation aligns with the data presented in Table 2, detailing the hourly charging for each EV. For all other EVs, their demand is only partially fulfilled due to various factors such as lower parking durations, higher energy demands, and/or charger unavailability. In the case of the conventional method, the energy demand of EV5, EV6, and EV9 is not fulfilled because both chargers were occupied by EVs that arrived earlier. Details about the charger utilization can be found in Table 3.
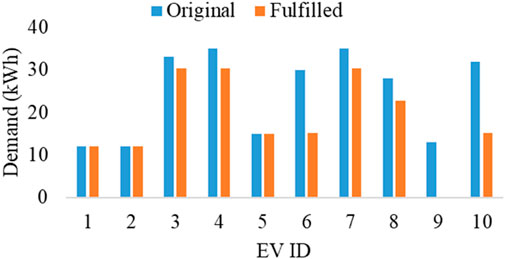
Figure 7. Allocate energy to EVs.
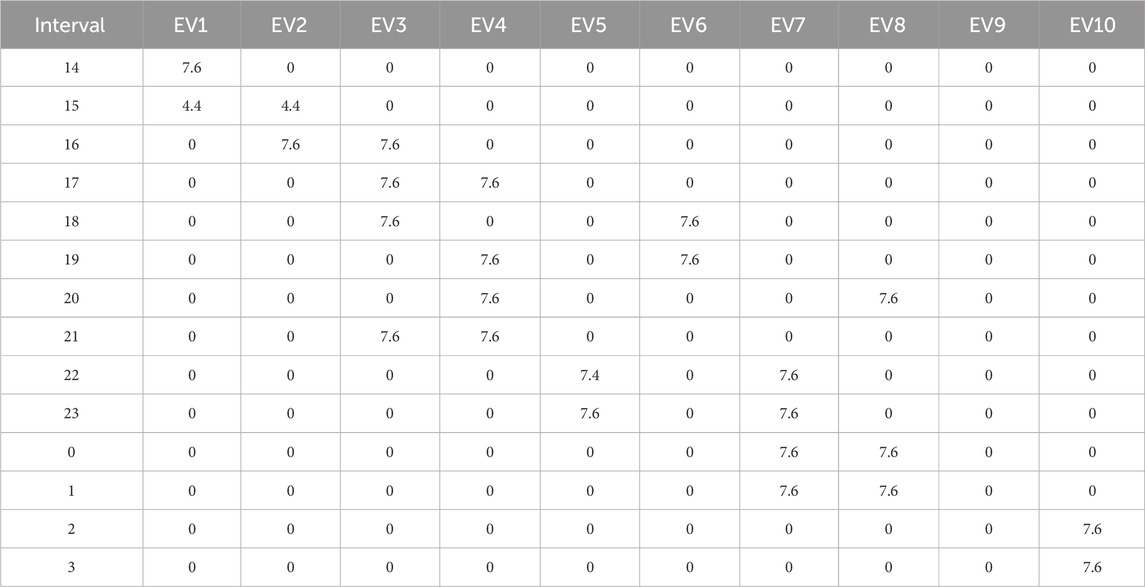
Table 2. Interval-wise power allocation to each EV under proposed method.
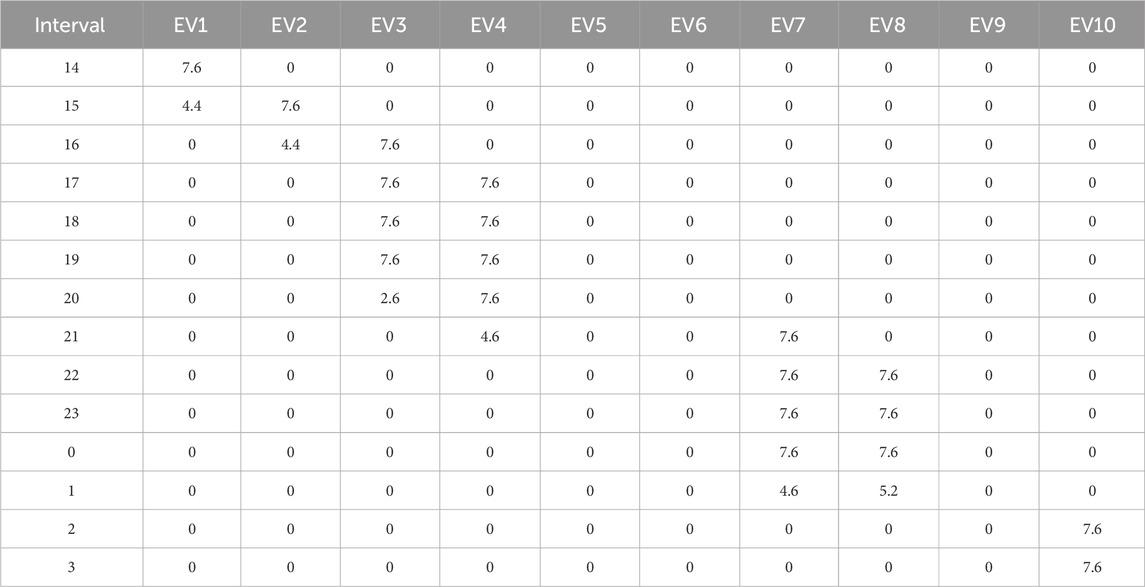
Table 3. Interval-wise power allocation to each EV under continuous method.
4.2.2 Charger utilization
The developed framework ensures that, at any given time interval, no more chargers are utilized than the available count. The binary variable data, employed in the problem formulation to monitor charger usage, has been extracted and visualized in Figure 8. The plot demonstrates that at no point are more than two chargers employed simultaneously. For improved clarity, distinct colors designate different time intervals in the visualization. Moreover, verification from Table 2 reaffirms the usage of a maximum of two chargers throughout any time interval. During intervals 14, 2, and 3, only one charger is in use, attributed to the availability of only one uncharged EV during those periods. Conversely, both chargers are efficiently utilized during the remaining intervals. It is important to note that Table 2 exclusively displays intervals with non-zero values of charging power, rather than representing the entire scheduling horizon.
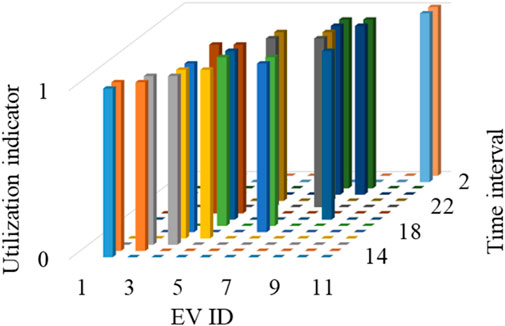
Figure 8. Charger usage indictor.
4.2.3 Driver satisfaction
The evaluation of the proposed satisfaction index for all 10 EVs is illustrated in Figure 9. Notably, the majority of EVs exhibit a satisfaction index exceeding 50%. However, EV9 and EV10 have satisfaction indices below 50%. The average index for the entire community stands at 75%. Contrarily, in case of the continuous method, the satisfaction index of EVs 5, 6, and 9 is zero. In addition, the overall satisfaction index of the community is 65% which is lower than the proposed method.
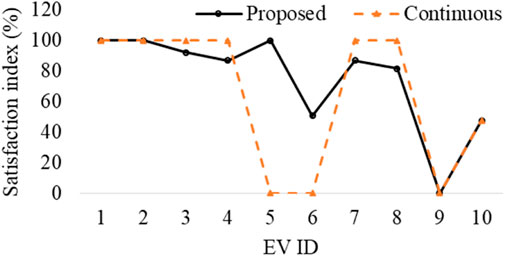
Figure 9. Satisfaction index of EV users.
Improving the index can be achieved through multiple strategies. Firstly, augmenting the number of chargers could notably enhance satisfaction, considering the current limitation of only two chargers available in the building. Additionally, incentivizing EVs to alter their charging and arrival behavior could optimize the utilization of the available chargers, subsequently augmenting the satisfaction index.
5 Discussion and analysis
This section conducts a sensitivity analysis of various factors, including the number of chargers, the penetration level of EVs, and the limits of the transformer’s capacity. Detailed discussions regarding each parameter are presented in the subsequent section.
5.1 Number of chargers
In this section, the variation of the number of chargers from 2 to 6 is simulated across five different cases. A fleet of 20 EVs is considered, with a transformer limit set at 35 kW. For each case, computations include the total power consumed by the chargers, the utilization count of chargers in each interval, and the overall satisfaction of the community. The respective results are displayed in Figures 10–12, specifically showcasing intervals with non-zero values of charging power.
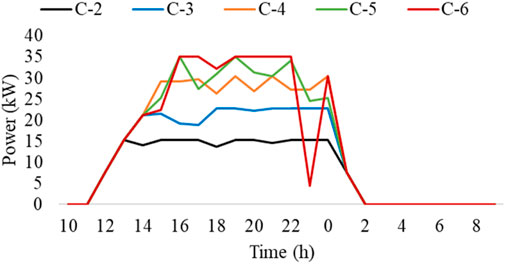
Figure 10. Total power consumption of chargers under different number of chargers.
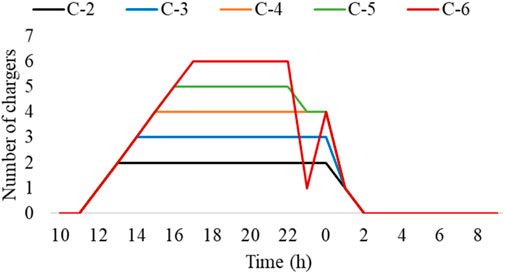
Figure 11. Charger utilization under different number of chargers.
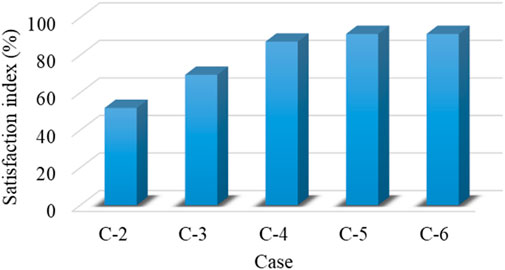
Figure 12. Community satisfaction under different number of chargers.
Figure 10 demonstrates an anticipated increase in power consumption with the rising number of chargers. Notably, the total power consumption is constrained to 35 kW for specific intervals in the C-5 and C-6 cases, aligning with the transformer’s available capacity. Figure 11 illustrates that the maximum count of chargers is employed during the evening hours due to the arrival of a higher number of EVs at home. However, it is essential to note that, across each case, the maximum available chargers are utilized.
Examining the satisfaction index in Figure 12 reveals a significant increase in satisfaction levels for the initial three cases, reaching a saturation point in the last two cases. Notably, the satisfaction level for the last two cases remains consistent. This outcome suggests that, considering the fixed transformer capacity and driving behaviors of EV owners, increasing the number of chargers beyond 5 does not notably affect satisfaction. Such results hold vital importance for policymakers to determine the minimum necessary number of chargers for a given EV count.
5.2 Penetration level of EVs
In this section, the share of the EV fleet incrementally increased up to 50% across five simulation cases. Starting from around 3% of the total fleet (320 vehicles), the penetration rate is doubled in each case until it reaches 50% (160 EVs). For consistency, the number of chargers remains fixed at five, and the transformer capacity is set at 35 kW throughout these simulations.
The analysis primarily focuses on the total power consumption of the chargers for each case. Additionally, a charger utilization index is devised to estimate the chargers’ utilization under varying penetration rates. The community’s satisfaction is also evaluated, and the outcomes are visualized in Figures 13–15. Figure 12 illustrates a proportional increase in charger power consumption with the growing number of EVs, which is an expected outcome. However, the power consumption becomes constrained by the remaining capacity of the transformer (35 kW), notably evident in the last three cases. Consequently, it can be inferred that the current configuration of five chargers and a 35-kW transformer capacity cannot sustain more than a 6% penetration of EVs.
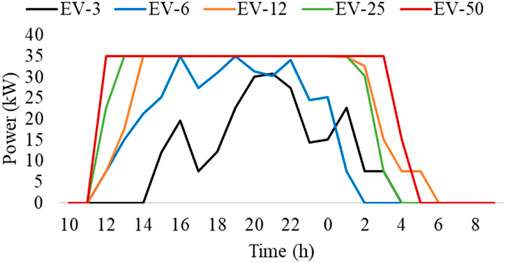
Figure 13. Total power consumption under different EV penetration levels.
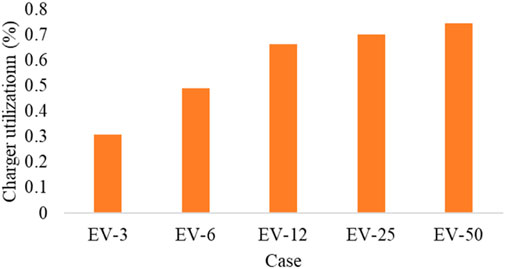
Figure 14. Charger utilization under different EV penetration levels.
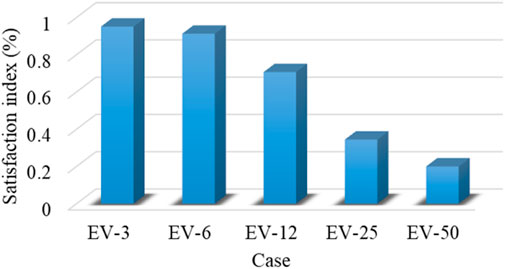
Figure 15. Community satisfaction index under different EV penetration levels.
Figure 14 shows the utilization level of chargers during the scheduling horizon (24 h). The utilization is computed using
Where
Examining Figure 15 reveals a decrease in the satisfaction level of the EV community with the escalating EV penetration rates. This decline is directly linked to the transformer’s capacity limitations. As the number of EVs increases, more capacity becomes necessary. Consequently, these results suggest that an increasing number of EVs are unable to fulfill their energy demands before their departure times.
This analysis underscores that relying solely on charger utilization as a measure is not sufficient to determine the optimal number of chargers or the EV penetration level. It is imperative to consider both charger utilization and customer satisfaction collectively to determine the most suitable number of chargers for any EV community.
5.3 Impact of transformer capacity
In this section, five simulations are conducted by varying the capacity of the transformer. The analysis includes power consumption, charger utilization, and EV user satisfaction, displayed in Figures 16–18. For these simulations, the number of chargers remains fixed at 5, with 20 EVs considered.
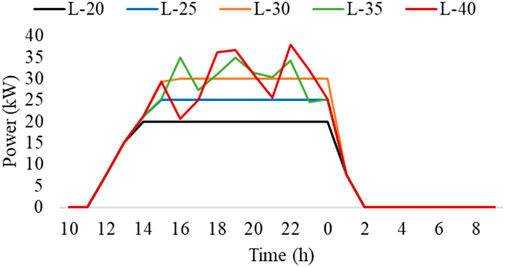
Figure 16. Total power consumption under different transformer capacity limits.
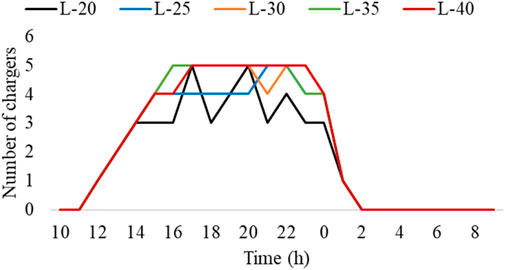
Figure 17. Charger utilization under different transformer capacity limits.
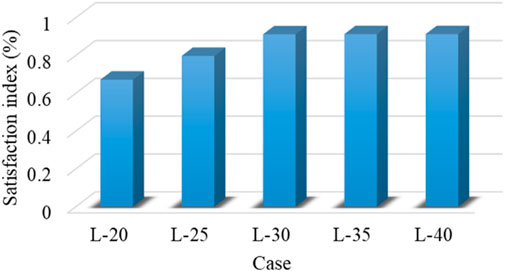
Figure 18. Community satisfaction under different transformer capacity limits.
Figure 16 illustrates that the charging power is restricted by the transformer’s capacity limits in the initial three cases. However, in the last two cases, the power remains below the capacity limit for most intervals. Additionally, Figure 17 demonstrates that due to these capacity constraints, all chargers are not fully utilized in the first three cases. Conversely, in the last two cases, all five chargers are utilized to maximize consumer satisfaction.
The community satisfaction index in Figure 18 shows an increase during the first three cases and remains stable in the last two cases. This implies that, for this community comprising 20 EVs and 5 chargers, a transformer capacity exceeding 30 kW proves sufficient. Moreover, increasing the transformer capacity beyond this threshold does not significantly impact consumer satisfaction levels. Such insights are crucial for utilities in planning transformer upgrades considering a certain level of EVs and chargers.
5.4 Potential policy implications
Based on the findings of this study, following policy implications can be inferred. Firstly, the study demonstrates the effectiveness of the proposed framework in efficiently allocating energy and utilizing chargers. The results show that with proper scheduling, EV energy demands can be met while ensuring charger availability and avoiding overloading the transformer. This suggests that policymakers should consider implementing similar optimization strategies in residential areas to manage EV charging effectively.
Secondly, the study highlights the importance of infrastructure planning. The analysis shows that increasing the number of chargers beyond a certain point does not significantly improve user satisfaction. This suggests that policymakers should focus on installing an optimal number of chargers based on factors such as transformer capacity and EV penetration rate. Additionally, the study suggests that increasing transformer capacity can improve user satisfaction up to a certain point, indicating that utilities should consider upgrading transformers in areas with high EV penetration.
Lastly, the study emphasizes the need for incentives to encourage EV owners to adjust their charging behavior. The satisfaction index shows that some EVs are not able to fulfill their energy demands due to charger unavailability. Incentives such as time-of-use pricing or rewards for off-peak charging could help distribute charging load more evenly and improve overall system performance.
6 Conclusion
A framework has been proposed to effectively manage the load of electric vehicles in shared parking lots, considering various critical factors such as the number of chargers, EV penetration levels, and the remaining capacity of the transformer. This framework utilizes a linear programming-based model to simulate diverse scenarios and introduces an index to quantitatively measure the satisfaction level of vehicle owners based on the energy charged before their departure time. Simulation outcomes have revealed that, for a given apartment complex, a consumer satisfaction level exceeding 75% can be achieved when 3% of the total vehicle fleet comprises EVs. Moreover, sensitivity analysis has demonstrated that merely five chargers can elevate the satisfaction level beyond 80% with an EV penetration level of up to 6% (20 EVs). However, the transformer capacity emerges as a pivotal factor in maximizing EV user satisfaction, particularly with higher EV penetration. The findings suggest that the transformer’s capacity can become a bottleneck as EV penetration increases. Consequently, it is imperative for policymakers and utilities to collaboratively determine the optimal number of chargers concerning both the transformer’s capacity and the expected EV penetration levels. Furthermore, planning equipment upgrades becomes crucial, necessitating considerations of imminent EV and charger penetration levels. Solely increasing the number of chargers is not advantageous under the constraints imposed by the transformer’s limited capacity. Thus, a comprehensive approach integrating multiple factors is vital for optimizing EV load management and ensuring consumer satisfaction in shared parking lots.
In this study, the feasibility analysis of managing electric vehicle loads is conducted at a higher level, focusing on overall load management strategies without considering the detailed power flow within the distribution system. The inclusion of power flow analysis would significantly enhance the practicality of this method by providing more detailed insights into how the proposed load management strategies would impact the distribution system’s operation and performance. Power flow analysis would allow for a more accurate assessment of potential voltage fluctuations, line losses, and overall system stability, enabling policymakers and utilities to make more informed decisions regarding electric vehicle integration and infrastructure planning.
Data availability statement
The original contributions presented in the study are included in the article/Supplementary material, further inquiries can be directed to the corresponding author.
Author contributions
AA: Conceptualization, Writing–original draft. NA: Methodology, Writing–review and editing. SA: Software, Writing–review and editing. OA: Validation, Writing–review and editing. HM: Formal Analysis, Validation, Writing–original draft.
Funding
The author(s) declare financial support was received for the research, authorship, and/or publication of this article. This research was funded by the Deputyship for Research and Innovation, Ministry of Education in Saudi Arabia, project number (IFP-2022-24).
Acknowledgments
The authors extend their appreciation to the Deputyship for Research and Innovation, Ministry of Education in Saudi Arabia, for funding this research work through project number (IFP-2022-24).
Conflict of interest
The authors declare that the research was conducted in the absence of any commercial or financial relationships that could be construed as a potential conflict of interest.
Publisher’s note
All claims expressed in this article are solely those of the authors and do not necessarily represent those of their affiliated organizations, or those of the publisher, the editors and the reviewers. Any product that may be evaluated in this article, or claim that may be made by its manufacturer, is not guaranteed or endorsed by the publisher.
References
Ahmadi, M., Sayed, M., Danish, S., Josip, A., Šoli´c, Š., Jakus, D., et al. (2023). Electric vehicle charging station power supply optimization with V2X capabilities based on mixed-integer linear programming. Sustain 15, 16073. doi:10.3390/SU152216073
Almutairi, A., and Alrumayh, O. (2022). Optimal charging infrastructure portfolio for minimizing grid impact of plug-in electric vehicles. IEEE Trans. Ind. Inf. 18, 5712–5721. doi:10.1109/TII.2022.3146292
Almutairi, A., and Alyami, S. (2021). Load profile modeling of plug-in electric vehicles: realistic and ready-to-use benchmark test data. IEEE Access 9, 59637–59648. doi:10.1109/ACCESS.2021.3072982
Chen, Y.-W., and Chang, J. M. (2016). Fair demand response with electric vehicles for the cloud based energy management service. IEEE Trans. Smart Grid 9, 458–468. doi:10.1109/TSG.2016.2609738
Duan, Y., Zhao, Y., and Hu, J. (2023). An initialization-free distributed algorithm for dynamic economic dispatch problems in microgrid: modeling, optimization and analysis. Sustain. Energy, Grids Netw. 34, 101004. doi:10.1016/J.SEGAN.2023.101004
EV Database (2023). Compare electric vehicles - EV database. Available at: https://ev-database.org/#sort:path∼type∼order=.rank∼number∼desc%7Crange-slider-range:prev∼next=0∼1200%7Crange-slider-acceleration:prev∼next=2∼23%7Crange-slider-topspeed:prev∼next=110∼350%7Crange-slider-battery:prev∼next=10∼200%7Crange-slider-towweight:pre (accessed on November 30, 2023).
Fachrizal, R., Ramadhani, U. H., Munkhammar, J., and Widén, J. (2021). Combined PV–EV hosting capacity assessment for a residential LV distribution grid with smart EV charging and PV curtailment. Sustain. Energy, Grids Netw. 26, 100445. doi:10.1016/J.SEGAN.2021.100445
Fathy, A., Al-Shamma’, A. A., Farh, H. M. H., Almutairi, A., Albagami, N., Almesned, S., et al. (2023). Electric vehicle load estimation at home and workplace in Saudi Arabia for grid planners and policy makers. Sustain 15, 15878. doi:10.3390/SU152215878
Geotab (2023). Charge the north EV case study: EV preparation for fleets | geotab. Available at: https://www.geotab.com/blog/preparing-for-evs/(accessed on November 30, 2023).
Heuberger, C. F., Bains, P. K., and Mac Dowell, N. (2020). The EV-olution of the power system: a spatio-temporal optimisation model to investigate the impact of electric vehicle deployment. Appl. Energy 257, 113715. doi:10.1016/J.APENERGY.2019.113715
Hou, M., Zhao, Y., and Ge, X. (2017). Optimal scheduling of the plug-in electric vehicles aggregator energy and regulation services based on grid to vehicle. Int. Trans. Electr. Energy Syst. 27, e2364. doi:10.1002/ETEP.2364
Hussain, A., Bui, V. H., and Musilek, P. (2023). Local demand management of charging stations using vehicle-to-vehicle service: a welfare maximization-based soft actor-critic model. eTransportation 18, 100280. doi:10.1016/J.ETRAN.2023.100280
Hussain, A., and Musilek, P. (2021). “A game-theoretic approach for charging demand management of electric vehicles during system overload,” in 2021 IEEE Electr. Power Energy Conf. EPEC, Toronto, ON, Canada, October, 2021, 353–358.
Hussain, A., and Musilek, P. (2022a). Resilience enhancement strategies for and through electric vehicles. Sustain. Cities Soc. 80, 103788. doi:10.1016/j.scs.2022.103788
Hussain, A., and Musilek, P. (2022b). Reliability-as-a-Service usage of electric vehicles: suitability analysis for different types of buildings. Energies 15, 665. doi:10.3390/EN15020665
IBM CPLEX (2023). Mathematical program solvers - IBM CPLEX. Available at: https://www.ibm.com/products/ilog-cplex-optimization-studio/cplex-optimizer (accessed on November 30, 2023).
Khan, Z. A., Imran, M., Altamimi, A., Alvarez-Alvarado, M. S., Sudhakar Babu, T., and Almutairi, A. (2022). Impact assessment of diverse EV charging infrastructures on overall service reliability. Sustain 14, 13295. doi:10.3390/SU142013295
Kong, W., Ye, H., Wei, N., Xing, D., and Chen, W. (2022). Dynamic pricing based EV load management in distribution network. Energy Rep. 8, 798–805. doi:10.1016/J.EGYR.2022.02.187
Lei, Y., Yanrong, C., Hai, T., Ren, G., and Wenhuan, W. (2023). DGNet: an adaptive lightweight defect detection model for new energy vehicle battery current collector. IEEE Sens. J. 23, 29815–29830. doi:10.1109/JSEN.2023.3324441
Li, P., Hu, J., Qiu, L., Zhao, Y., and Ghosh, B. K. (2022). A distributed economic dispatch strategy for power-water networks. IEEE Trans. Control Netw. Syst. 9, 356–366. doi:10.1109/TCNS.2021.3104103
Limmer, S., and Rodemann, T. (2019). Peak load reduction through dynamic pricing for electric vehicle charging. Int. J. Electr. Power Energy Syst. 113, 117–128. doi:10.1016/J.IJEPES.2019.05.031
Liu, G. (2021). Data collection in MI-assisted wireless powered underground sensor networks: directions, recent advances, and challenges. IEEE Commun. Mag. 59, 132–138. doi:10.1109/MCOM.001.2000921
Luo, J., Zhuo, W., Liu, S., and Xu, B. (2024). The optimization of carbon emission prediction in low carbon energy economy under big data. IEEE Access 12, 14690–14702. doi:10.1109/ACCESS.2024.3351468
Lyu, W., Hu, Y., Liu, J., Chen, K., Liu, P., Deng, J., et al. (2024). Impact of battery electric vehicle usage on air quality in three Chinese first-tier cities. Sci. Rep. 14, 21–13. doi:10.1038/s41598-023-50745-6
Mazhar, T., Asif, R. N., Malik, M. A., Nadeem, M. A., Haq, I., Iqbal, M., et al. (2023). Electric vehicle charging system in the smart grid using different machine learning methods. Sustain 15, 2603. doi:10.3390/SU15032603
Moghaddam, Z., Ahmad, I., Habibi, D., and Masoum, M. A. S. (2019). A coordinated dynamic pricing model for electric vehicle charging stations. IEEE Trans. Transp. Electrif. 5, 226–238. doi:10.1109/TTE.2019.2897087
NHTS (2023). NHTS datasets. Available at: https://nhts.ornl.gov/download.shtml (accessed on November 30, 2023).
Sayarshad, H. R., Mahmoodian, V., and Bojović, N. (2021). Dynamic inventory routing and pricing problem with a mixed fleet of electric and conventional urban freight vehicles. Sustain 13, 6703. doi:10.3390/SU13126703
Shao, B., Xiao, Q., Xiong, L., Wang, L., Yang, Y., Chen, Z., et al. (2023). Power coupling analysis and improved decoupling control for the VSC connected to a weak AC grid. Int. J. Electr. Power Energy Syst. 145, 108645. doi:10.1016/J.IJEPES.2022.108645
Shirkhani, M., Tavoosi, J., Danyali, S., Sarvenoee, A. K., Abdali, A., Mohammadzadeh, A., et al. (2023). A review on microgrid decentralized energy/voltage control structures and methods. Energy Rep. 10, 368–380. doi:10.1016/J.EGYR.2023.06.022
Tran, V. T., Islam, M. R., Muttaqi, K. M., and Sutanto, D. (2019). An efficient energy management approach for a solar-powered EV battery charging facility to support distribution grids. IEEE Trans. Ind. Appl. 55, 6517–6526. doi:10.1109/TIA.2019.2940923
Tulabing, R., James, J., Mitchell, B., Park, H., Boys, J., Salcic, Z., et al. (2018). Mitigation of local grid congestion due to electric vehicles through localized demand control. Int. Conf. Innov. Smart Grid Technol. ISGT Asia, 254–259. doi:10.1109/ISGT-ASIA.2018.8467768
Vision (2050). A strategy to decarbonize the global transport sector by mid-century | international council on clean transportation. Available at: https://theicct.org/publication/vision-2050-a-strategy-to-decarbonize-the-global-transport-sector-by-mid-century/(accessed on June 16, 2022).
Wang, Y., Chen, P., Yong, J., Xu, W., Xu, S., and Liu, K. (2022). A comprehensive investigation on the selection of high-pass harmonic filters. IEEE Trans. Power Deliv. 37, 4212–4226. doi:10.1109/TPWRD.2022.3147835
Yang, C., Wu, Z., Li, X., and Fars, A. (2024). Risk-constrained stochastic scheduling for energy hub: integrating renewables, demand response, and electric vehicles. Energy 288, 129680. doi:10.1016/J.ENERGY.2023.129680
Zhang, F., Wang, L., Coskun, S., Pang, H., Cui, Y., and Xi, J. (2020). Energy management strategies for hybrid electric vehicles: review, classification, comparison, and outlook. Energies 13, 3352. doi:10.3390/EN13133352
Zhang, H., Wu, H., Jin, H., and Li, H. (2023a). High-dynamic and low-cost sensorless control method of high-speed brushless DC motor. IEEE Trans. Ind. Inf. 19, 5576–5584. doi:10.1109/TII.2022.3196358
Zhang, X., Lu, Z., Yuan, X., Wang, Y., and Shen, X. (2021). L2-Gain adaptive robust control for hybrid energy storage system in electric vehicles. IEEE Trans. Power Electron. 36, 7319–7332. doi:10.1109/TPEL.2020.3041653
Zhang, X., Wang, Y., Yuan, X., Shen, Y., and Lu, Z. (2023b). Adaptive dynamic surface control with disturbance observers for battery/supercapacitor-based hybrid energy sources in electric vehicles. IEEE Trans. Transp. Electrif. 9, 5165–5181. doi:10.1109/TTE.2022.3194034
Keywords: electric vehicle charging, demand management, sustainable transportation, shared residential buildings, user satisfaction, resource optimization, integrated sustainability, sustainable communities
Citation: Almutairi A, Albagami N, Almesned S, Alrumayh O and Malik H (2024) Optimal management of electric vehicle charging loads for enhanced sustainability in shared residential buildings. Front. Energy Res. 12:1396899. doi: 10.3389/fenrg.2024.1396899
Received: 06 March 2024; Accepted: 26 April 2024;
Published: 22 May 2024.
Edited by:
Flah Aymen, École Nationale d’Ingénieurs de Gabès, TunisiaReviewed by:
Hassan M. Hussein Farh, Imam Muhammad ibn Saud Islamic University, Saudi ArabiaYasser Assolami, Taibah University, Saudi Arabia
Hisham Alharbi, Taif University, Saudi Arabia
Copyright © 2024 Almutairi, Albagami, Almesned, Alrumayh and Malik. This is an open-access article distributed under the terms of the Creative Commons Attribution License (CC BY). The use, distribution or reproduction in other forums is permitted, provided the original author(s) and the copyright owner(s) are credited and that the original publication in this journal is cited, in accordance with accepted academic practice. No use, distribution or reproduction is permitted which does not comply with these terms.
*Correspondence: Abdulaziz Almutairi, YWQuYWxtdXRpcmlAbXUuZWR1LnNh