 Ziao Su
 Chongming Yang
 Yutong Liu
 Zhiying Mu
- 1College of Electrical and Information Engineering, Hunan University, Changsha, China
- 2Industrial Training Centre, Shenzhen Polytechnic University, Shenzhen, China
- 3School of Mathematics, Shandong University, Jinan, China
1 Introduction
The installation of solar photovoltaic (PV) systems has been stimulated by governmental incentive mechanisms and the continual reduction in technology costs in recent years (Chattopadhyay and Alpcan, 2015). However, with the substantial integration of distributed PV systems at high penetration levels (Chen et al., 2019a), reverse power flow in the distribution network has been observed, thus triggering issues such as voltage violations and reverse overloads (Ismael et al., 2019; Wu et al., 2021). Therefore, the evaluation of maximum PV hosting capacity of the distribution network can assist distribution network planners in making decisions regarding PV generation (SUN et al., 2021). The current evaluation method considering safe operation constraints is traditional planning method of optimal power flow (Chen et al., 2016) and random scenario simulation method (Ding and Mather, 2016) which can ensure the randomness of PV configuration. To enhance the PV hosting capacity, strategies such as reactive power control (Astero and Söder, 2018), voltage control using OLTC (Wang et al., 2016), energy storage technologies (Hashemi and Østergaard, 2016), and network reconfiguration (Fu and Chiang, 2018) are continuously proposed. With the increasing proliferation of distributed resources, a promising approach to enhancement is also presented by power aggregation (Müller et al., 2017; Wang and Wu, 2021) and proactive control of diversified flexibility resources along feeders. Therefore, this research aims to provide insightful viewpoints and discussions on the assessment method of the maximum PV hosting capacity of the distribution network based on the aggregation of diversified flexibility resources.
The main contributions of this work can be twofold as listed: (1) A highly constrained zonotope aggregation model for diversified flexibility resources is proposed, and a two-stage adaptive robust framework is employed to innerly approximate the projection region of the high-dimensional original space of diversified flexibility resources; (2)A PV hosting capacity evaluation method with flexibility space boundaries is presented to accommodate distributed PV by maximizing the net load during peak PV output on the load side.
2 Highly constrained zonotope aggregation model of diversified flexibility resources
Due to diversified flexibility resources’ small scale, dispersion, and large number, coordinating their control is highly challenging (Chen and Li, 2021). Aggregating flexibility resources on feeders can fully utilize the potential flexibility, reduce invocation difficulty, and lower computational complexity. Specifically, the process of flexibility aggregation can be described as the projection of the power feasible domain of all flexibility resources onto the total power feasible domain of feeders (Wei et al., 2015; Tan et al., 2019; Chen and Li, 2021). Based on the acquisition of the power feasible domain of all flexibility resources on feeders, upon observation of the strong constraints imposed by the network of the distribution network when the aggregation scale is large (Wang and Wu, 2021), the high-dimensional precise original space of flexibility resources is constituted. The analytical form of computing its dimensionality reduction projection onto the precise power flexibility space of the feeder is highly challenging; thus, most studies are focused on approximation methods (Chen and Li, 2021).
Firstly, the power-adjustable range of individual flexibility resources, including energy storage devices, electric vehicles, and HVAC-like energy storage devices, is described through a virtual energy storage model in this paper (Hughes et al., 2016). Given the discrete scheduling decision cycle with N scheduling points and a time interval of
Where
The linear method outlined in (Bernstein et al., 2018) is employed to derive the network power flow model, whereby the magnitudes of node voltage v, branch current i, and feeder line aggregated active power pagg, can be expressed as the following linear expressions:
Where D, d, F, f, H, h, J and j are the system parameters. It is necessary to ensure that node voltages and branch currents are not exceeded, as follows:
Where
Then, the feeder power flexibility space P, representing the dimensionality reduction projection of the high-dimensional constrained space Z, is approximately obtained using the zonotope U as shown in Figure 1A. For the N-dimensional zonotope (Müller et al., 2017), its representation can be established with the central point c, a specific generator matrix G, and a scaling factor
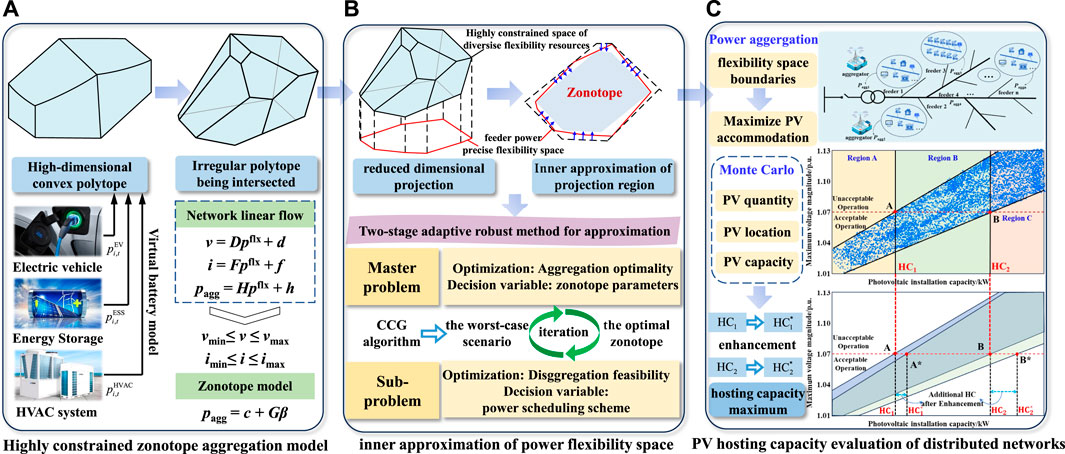
Figure 1. The proposed model, approximation method and PV hosting capacity evaluation. (A) Highly constrained zonotope aggregation model. (B) Inner approximation of power flexibility space. (C) PV hosting capacity evaluation of distributed networks.
The advantage of zonotope projection approximation over ellipsoidal projection (Cui et al., 2021) and cuboidal projection (Chen et al., 2019b) lies in its generator vectors
3 Two-stage adaptive robust method for inner approximation of power flexibility space
The feeder power flexibility space obtained after dimensionality reduction projection becomes more intricate and challenging to obtain. The inner approximation requires ensuring that the approximated flexibility space is optimally bounded internally. Simultaneously, it is imperative to ensure that any aggregated power trajectory within the approximated flexibility space can be realized through scheduling without violating operational constraints, thereby guaranteeing the feasibility of the disaggregation (Chen and Li, 2021).
In this paper, the power flexibility aggregation and disaggregation problem are formulated as a two-stage adaptive robust optimization problem as shown in Figure 1B, where power aggregation is treated as uncertain variables, and the requirement to ensure the feasibility of disaggregation is regarded as adaptive robust constraints (Hua et al., 2024). In the first stage, the objective is to determine the optimal approximation space for the aggregated feeder power. In the second stage, the objective is to ensure the feasibility of disaggregation.
The construction of any S normal vectors, denoted as
The introduction of
In the first stage, the zonotope parameters
4 PV hosting capacity evaluation of distributed networks with flexibility space boundaries
As the penetration rate of PV systems in distribution networks continues to increase, the occurrence of peak PV output not coinciding with peak load power (Xiong et al., 2020) may lead to phenomena such as reverse power flow and overvoltage in low-voltage distribution networks (Zhang et al., 2018; Li et al., 2020). The increase in node voltages within distribution networks becomes the primary factor limiting the integration of distributed PV systems (Lee et al., 2020). Reference (Cao et al., 2024) ensures magnitudes of each bus are maintained within the safety range due to the load shedding. Therefore, effectively increasing the net load during periods of high PV output on the load side helps mitigate the risk of operational constraints exceeding limits, thereby enhancing the hosting capacity of distributed PV systems (Zhou et al., 2021).
In a low-voltage distribution network with H feeders,
The PV penetration rate range selected in this paper is 0%–300%, with an incremental step size of 10%. Using the Monte Carlo method, the quantity, location, and capacity of PV grid connections are randomly simulated, with the PV grid connection capacity increasing according to the PV penetration rate (Ding and Mather, 2016). The steady-state power flow of the system is then calculated. For each PV penetration rate
Two lines parallel to the vertical axis are drawn respectively at points HC1 and HC2 to divide the coordinate graph into three regions: A, B, and C. In region A, points represent scenarios where the capacity of PV systems connected to the distribution network is less than HC1. Regardless of the node in the distribution network where PV systems are connected, the system voltage remains within the permissible range of the supply voltage. In region B, points represent scenarios where the capacity of PV systems connected to the distribution network falls between HC1 and HC2. If the selection of PV integration positions and capacity allocation is unreasonable, it may lead to excessively high or even over-limit system voltage levels. In such cases, the distribution network planner must ensure that the PV systems are appropriately allocated. In region C, points represent scenarios where the capacity of PV systems connected to the distribution network exceeds HC2. Regardless of the installation scheme employed, it will lead to over-limit system voltage. The aggregation and regulation of flexibility resources on the load side result in the accommodation of distributed photovoltaics, leading to the rightward shift of HC1 and HC2, with HC1 increasing to HC*1 and HC2 increasing to HC*2.
5 Case studies
In this section, the enhancement effect of PV hosting capacity by aggregated and coordinated diversified flexibility resources is demonstrated through numerical simulations based on the proposed method. IEEE 33-bus distribution network system is employed as a case study for simulation verification, with a radial configuration and a standard voltage level set at 12.66 kV. All the algorithms are executed with an AMD Ryzen 7 5800H with Radeon Graphics CPU running at 3.20 GHz, and 16.0 GB RAM. The optimization model involved in the proposed method is programmed and solved using the commercial solver Gurobi 10.0.3. The comparison between results of PV hosting capacity and computational time under different algorithms is shown in Table 1.

Table 1. Comparison of PV hosting capacity evaluation method.
As shown in Table 1, it can be seen that the proposed method, compared to the random scenario simulation, can increase the PV hosting capacity by over 9.96%. Due to the necessity of considering flexible resource power aggregation and proactive control, the computational time is comparatively longer. When the scale of flexible resources is large, aggregation can shorten the computational time compared to distributed scheduling. However, our method show a slight decrease in the PV hosting capacity compared to the demand response enhancement method, which is attributed to the approximate feasible domain of the aggregation solution, leading to certain accuracy errors. Overall, the method proposed can effectively assess the PV hosting capacity of the distribution network.
6 Discussion and conclusion
In this paper, the flexibility resource power regulation model, feeder power aggregation model, two-stage robust aggregation solution method, and PV hosting capacity assessment strategy is elaborately investigated. The key findings are summarized as follows: 1) A highly constrained zonotope aggregation model of diversified flexibility resources is proposed, and a two-stage adaptive robust method is introduced to internally approximate the power flexibility space, ensuring the optimality of aggregation and the feasibility of disaggregation; 2) The aggregation and control of flexibility resource power on the load side can accommodate high peak output from distributed PV, thereby enhancing the PV hosting capacity of the distribution network and simultaneously reducing the computational complexity of dispatch decision-making.
Author contributions
ZS: Writing–original draft, Conceptualization. CY: Writing–review and editing, Formal Analysis, Data curation. YL: Writing–review and editing, Visualization. ZM: Writing–review and editing, Investigation.
Funding
The author(s) declare that no financial support was received for the research, authorship, and/or publication of this article.
Conflict of interest
The authors declare that the research was conducted in the absence of any commercial or financial relationships that could be construed as a potential conflict of interest.
Publisher’s note
All claims expressed in this article are solely those of the authors and do not necessarily represent those of their affiliated organizations, or those of the publisher, the editors and the reviewers. Any product that may be evaluated in this article, or claim that may be made by its manufacturer, is not guaranteed or endorsed by the publisher.
References
Astero, P., and Söder, L., Improving PV dynamic hosting capacity using adaptive controller for STATCOMs[J]. IEEE Trans. Energy Convers., 2018, 34(1): 415–425. doi:10.1109/TEC.2018.2873057
Bernstein, A., Wang, C., Dall’Anese, E., Le Boudec, J. Y., and Zhao, C. (2018). Load flow in multiphase distribution networks: existence, uniqueness, non-singularity and linear models. IEEE Trans. Power Syst. 33, 5832–5843. doi:10.1109/TPWRS.2018.2823277
Cao, Y., Zhou, B., Chung, C. Y., Wu, T., Zheng, L., and Shuai, Z. (2024). A coordinated emergency response scheme for electricity and watershed networks considering spatio-temporal heterogeneity and volatility of rainstorm disasters. IEEE Trans. Smart Grid, 1. doi:10.1109/TSG.2024.3362344
Chattopadhyay, D., and Alpcan, T. (2015). Capacity and energy-only markets under high renewable penetration. IEEE Trans. Power Syst. 31, 1692–1702. doi:10.1109/TPWRS.2015.2461675
Chen, X., Dall’Anese, E., Zhao, C., and Li, N. (2019b). Aggregate power flexibility in unbalanced distribution systems. IEEE Trans. Smart Grid 11, 258–269. doi:10.1109/TSG.2019.2920991
Chen, X., and Li, N. (2021). Leveraging two-stage adaptive robust optimization for power flexibility aggregation. IEEE Trans. Smart Grid 12, 3954–3965. doi:10.1109/TSG.2021.3068341
Chen, X., Mcelroy, M. B., Wu, Q., Shu, Y., and Xue, Y. (2019a). Transition towards higher penetration of renewables: an overview of interlinked technical, environmental and socio-economic challenges. J. Mod. Power Syst. Clean Energy 7, 1–8. doi:10.1007/s40565-018-0438-9
Chen, X., Wu, W., Zhang, B., and Lin, C. (2016). Data-driven DG capacity assessment method for active distribution networks. IEEE Trans. Power Syst. 32, 3946–3957. doi:10.1109/TPWRS.2016.2633299
Cui, B., Zamzam, A., and Bernstein, A. (2021). “Network-cognizant time-coupled aggregate flexibility of distribution systems under uncertainties,” in 2021 American Control Conference (ACC), New Orleans, LA, USA, May, 2021, 1723–1728.
Ding, F., and Mather, B. (2016). On distributed PV hosting capacity estimation, sensitivity study, and improvement. IEEE Trans. Sustain. Energy 8, 1010–1020. doi:10.1109/TSTE.2016.2640239
Fu, Y. Y., and Chiang, H. D. Toward optimal multiperiod network reconfiguration for increasing the hosting capacity of distribution networks[J]. IEEE Trans. Power Deliv., 2018, 33(5): 2294–2304.doi:10.1109/TPWRD.2018.2801332
Hashemi, S., and Østergaard, J. Efficient control of energy storage for increasing the PV hosting capacity of LV grids[J]. IEEE Trans. Smart Grid, 2016, 9(3): 2295–2303. doi:10.1109/TSG.2016.2609892
Hua, Z., Zhou, B., Or, S. W., Zhang, J., Li, C., and Wei, J. (2024). Robust emergency preparedness planning for resilience enhancement of energy-transportation nexus against extreme rainfalls. IEEE Trans. Industry Appl. 60, 1196–1207. doi:10.1109/TIA.2023.3274615
Hughes, J. T., Domínguez-García, A. D., and Poolla, K. (2016). Identification of virtual battery models for flexible loads. IEEE Trans. Power Syst. 31, 4660–4669. doi:10.1109/TPWRS.2015.2505645
Ismael, S. M., Aleem, S. H. E. A., Abdelaziz, A. Y., and Zobaa, A. F. (2019). State-of-the-art of hosting capacity in modern power systems with distributed generation. Renew. energy 130, 1002–1020. doi:10.1016/j.renene.2018.07.008
Lee, J., Bérard, J. P., Razeghi, G., and Samuelsen, S. (2020). Maximizing PV hosting capacity of distribution feeder microgrid. Appl. Energy 261, 114400. doi:10.1016/j.apenergy.2019.114400
Li, R., Wong, P., Wang, K., and Yuan, F. (2020). Power quality enhancement and engineering application with high permeability distributed photovoltaic access to low-voltage distribution networks in Australia. Prot. Control Mod. Power Syst. 5, 18. doi:10.1186/s41601-020-00163-x
Müller, F. L., Szabó, J., Sundström, O., and Lygeros, J. (2017). Aggregation and disaggregation of energetic flexibility from distributed energy resources. IEEE Trans. Smart Grid 10, 1205–1214. doi:10.1109/TSG.2017.2761439
Sun, W., Huang, F., and Zhang, W. (2021). Evaluation of feeder available capacity considering demand response. Electr. Power Autom. Equip. 41 (06), 156–165. doi:10.16081/j.epae.202101008
Tan, Z., Zhong, H., Wang, J., Xia, Q., and Kang, C. (2019). Enforcing intra-regional constraints in tie-line scheduling: a projection-based framework. IEEE Trans. Power Syst. 34, 4751–4761. doi:10.1109/TPWRS.2019.2913876
Wang, S., Chen, S., Ge, L., and Wu, L. Distributed generation hosting capacity evaluation for distribution systems considering the robust optimal operation of OLTC and SVC[J]. IEEE Trans. Sustain. Energy, 2016, 7(3): 1111–1123. doi:10.1109/TSTE.2016.2529627
Wang, S., and Wu, W. (2021). Aggregate flexibility of virtual power plants with temporal coupling constraints. IEEE Trans. Smart Grid 12, 5043–5051. doi:10.1109/TSG.2021.3106646
Wei, W., Liu, F., and Mei, S. (2015). Real-time dispatchability of bulk power systems with volatile renewable generations. IEEE Trans. Sustain. Energy 6, 738–747. doi:10.1109/TSTE.2015.2413903
Wu, H., Yuan, Y., Zhu, J., Qian, K., and Xu, Y. (2021). Potential assessment of spatial correlation to improve maximum distributed PV hosting capacity of distribution networks. J. Mod. Power Syst. Clean Energy 9, 800–810. doi:10.35833/MPCE.2020.000886
Xiong, L., Liu, X., Zhang, D., and Liu, Y. (2020). Rapid power compensation-based frequency response strategy for low-inertia power systems. IEEE J. Emerg. Sel. Top. Power Electron. 9, 4500–4513. doi:10.1109/JESTPE.2020.3032063
Zhang, D., Li, J., and Hui, D. (2018). Coordinated control for voltage regulation of distribution network voltage regulation by distributed energy storage systems. Prot. Control Mod. Power Syst. 3, 3. doi:10.1186/s41601-018-0077-1
Keywords: diversified flexibility resources, flexibility space boundaries, hosting capacity, two-stage adaptive robust, zonotope aggregation
Citation: Su Z, Yang C, Liu Y and Mu Z (2024) Opinions on hosting capacity evaluation of distribution network with zonotope power flexibility aggregation. Front. Energy Res. 12:1406654. doi: 10.3389/fenrg.2024.1406654
Received: 25 March 2024; Accepted: 13 May 2024;
Published: 03 June 2024.
Edited by:
Yonghui Liu, Hong Kong Polytechnic University, Hong Kong SAR, ChinaReviewed by:
Guibin Wang, Shenzhen University, ChinaShiwei Xia, North China Electric Power University, China
Copyright © 2024 Su, Yang, Liu and Mu. This is an open-access article distributed under the terms of the Creative Commons Attribution License (CC BY). The use, distribution or reproduction in other forums is permitted, provided the original author(s) and the copyright owner(s) are credited and that the original publication in this journal is cited, in accordance with accepted academic practice. No use, distribution or reproduction is permitted which does not comply with these terms.
*Correspondence: Chongming Yang, eWFuZ2Nob25nbWluZzMxOEBzenB1LmVkdS5jbg==