- 1Energy-Economy-Environment (E3) Sustainable Analysis Group, Clemson University, Department of Environmental Engineering and Earth Sciences, Clemson, SC, United States
- 2Department of Mechanical Engineering, Clemson University, Clemson, SC, United States
- 3Department of Mechanical Engineering, The Brew Hammond Energy Centre, Kwame Nkrumah University of Science and Technology (KNUST), Kumasi, Ghana
The developing world continues to face substantial obstacles to achieving affordable and dependable electricity access. This issue is especially pertinent for Nigeria, where diesel generators are widely relied upon in urban and rural regions because of an underdeveloped and unreliable national grid. The lack of grid reliability is worsened in Northeastern Nigeria, an area plagued by conflict, extreme poverty, and grid infrastructure deterioration. This study investigates the feasibility of implementing community-scale microgrids in rural areas without grid connection access. It focuses on assessing the technical, economic, and environmental aspects of utilizing these microgrids to deliver inexpensive and dependable electricity to underserved populations to increase energy access. A case study was conducted in Kabuiri, a village with an estimated population of 2,300 residents and an estimated load demand of 610 kWh per day. A hybrid microgrid system was designed and optimized to meet the community’s load demand using HOMER software, sized to produce 610 kWh/day of electricity with a renewable penetration of 99%. The optimal solar PV/battery/generator system had a levelized cost of electricity (LCOE) of $ 0.093 per kWh, a net present cost (NPC) of $266,709, and an annual operating cost of $9,110. The system contributed 1,624 kg CO2 eq/year of global warming potential and 56.81 kg O3 eq/year of smog formation during operation. Sensitivity analysis showed that the system could effectively react to or adapt to substantial increases in diesel prices, requiring only marginal increases in photovoltaic capacity and reduced generator usage to maintain the most cost-efficient operation. Additionally, the system model can be adapted based on the population of the remote community without substantially impacting the LCOE, however, the NPC increases with increase in population size. This research will aid in increasing energy access in remote locations by providing insights to stakeholders and energy access project developers.
1 Introduction
Located in Sub-Saharan Africa, Nigeria possesses a population of more than 200 million people and remains one of the largest economies on the continent (International Trade Administration, 2023). The country experiences significant disparities in access to electricity between the southern coastal regions and the drier inland regions of the north. A greater divide is seen, however, between urban and rural areas, which often lack the size and proximity to be priority targets for new connections to the challenged national electrical grid. Currently, national electricity access rates in Nigeria sit at 86% and 34% for urban and rural regions respectively (USAID, 2023). With Nigeria’s urbanization rate estimated at approximately 50% in 2015, an estimated 67 million Nigerians—more than one-quarter of the population—live in rural areas without access to electricity (Bloch et al., 2015). As accessible and affordable electricity remains a fundamental requirement for human and economic development (UNSDG, 2024), developing cost-effective means of electrifying distant rural settlements fulfills a critical need that is not likely to be addressed otherwise.
In regions where electricity access is limited or restricted, the conventional means of generating electricity for critical services is to rely on diesel or gasoline generator setups. While generators offer a simplified system for on-demand power generation when compared to alternative means of local power generation, their levelized cost per kWh often significantly exceeds the cost of electricity from a central grid (Babatunde et al., 2020). In the past 10 years, a significant increase has been seen in the usage of photovoltaic (PV) cells combined with battery energy storage systems to supply electricity for remote applications. Systems based on this PV-battery architecture possess several key advantages over generator-based system architectures: primarily, reduced operation and maintenance expenses as a proportion of overall lifecycle costs, greater autonomy from fuel price fluctuations for the user, and significant potential savings in the cost of energy delivered to the end user (Kosmadakis and Elmasides, 2021). An additional benefit of PV systems is a significant reduction in direct greenhouse gas (GHG) and other air emissions. Generator-based systems have the primary advantages of greater instantaneous capacity and independence from weather variability. Between these two system types, a hybrid system architecture is positioned to take advantage of the respective strengths of PV and generator-based architecture to best suit the required demand.
Numerous studies have investigated the potential for PV-based systems to generate electricity for semi-autonomous microgrids with utility connections. However, these studies commonly develop systems that fundamentally rely on sourcing generation or selling excess generation back to the utility. A 2014 report investigating the economic viability of an 80 kW grid-connected PV system in Nigeria yielded a competitive levelized cost of energy (LCOE) for the system of $0.103 per kWh (Akinsipe et al., 2021). However, for remote applications, such a utility-grid connection cannot be reliably assumed to be possible, and overall costs can be expected to increase significantly as a result. Similar studies of microgrid systems relying solely on PV-based generation must contend with a fundamental balance between the overall cost of a system and the sizing of PV panels and battery storage to meet demand. Variations in load profiles and generation fluctuation could impact the ability of solar generation to meet demand, posing significant limitations to PV-based systems.
One 2018 study of an off-grid PV system for a commercial operation in northwest Nigeria examined the required microgrid infrastructure for two candidate loads based on the expected appliances on-site. For the study, Category 1 was composed of essential devices and hardware with an average electricity consumption of 36.34 kWh/day, while Category 2 expanded Category 1 to include an air-conditioning system, requiring an average electricity requirement of 198.1 kWh/day. The results of the study found that Category 1-based systems were only slightly more cost-efficient than Category 2 per kWh, with final LCOE values of $0.53 per kWh versus $0.54 per kWh, respectively. Category 1 bore a significantly reduced system cost of $92,450, while Category 2 possessed a system cost of $505,920 (Oladeji et al., 2018). It is important to note that the LCOE determined for both systems, based solely on PV generation, is significantly higher than rates typical of a grid connection of around $0.15 per kWh (225 Naira per kWh) (BLS, 2024).
The inclusion of a generator into a PV-based microgrid offers significant potential not only to stabilize electricity supply in times of low PV generation but also to significantly supplement costs needed for increased energy storage capacity for off-grid applications. A 2014 paper examining a generator-PV system for providing energy to a community in Northeast Nigeria found an optimized hybrid generation system delivering an average of 485 kWh/day to users would require an installation cost of $958,800 and deliver energy at an LCOE of $0.566 per kWh (Tijani et al., 2014a). The LCOE presented is significantly higher than both conventional grid rates. However, it is essential to note that this microgrid architecture does not rely on a grid connection and that adding a generator component increases system reliability beyond the low-cost PV-only architecture in periods of low solar generation. Given that the cost of PV panel capacity has decreased by over 50% between 2017 and 2020 alone, future PV-only and hybrid microgrids may experience substantial cost reductions. Hybrid microgrids may become an increasingly appealing alternative for energy systems striving to optimize resilience and operational reliability (Birol, 2024).
A 2023 study examined the feasibility of PV-only architectures for providing power to supermarkets in the southern city of Port Harcourt, Nigeria. Ijeoma et al. found that a PV-based system architecture with a peak power of 232 kW, a 100 A/560 V charge controller, and a 60 V/75 kW inverter was sufficient to meet the electricity needs of a supermarket with a daily consumption profile of 561 kWh. This system architecture would possess an overall lifecycle cost of $266,936 with an LCOE of $0.14/kWh (Ijeoma et al., 2024a). Importantly, the average solar irradiance for Port Harcourt (4.21 kWh/m2/day) is low relative to that experienced in many parts of Nigeria (NASA, 2023).
Northeastern Nigeria, a region beset by conflict and severe poverty, struggles with significant barriers to providing reliable electricity access. The existing electricity infrastructure is often inadequate, with intermittent outages, making it challenging for residents to meet basic needs. The recent removal of fuel of fuel subsidy by the Nigeria has exacerbated this issue as the price of fuel has increase by more than 100% (Nigeria, 2024; Aljazeera, 2024). Solar PV offers a sustainable and renewable solution, but the high initial costs of solar installations are prohibitive for these communities. This energy deficit hampers education, healthcare, and economic activities, perpetuating the cycle of poverty. To overcome this hurdle, innovative financing mechanisms and humanitarian aid are crucial (Akpan et al., 2013; Momoh et al., 2018).
With a relative lack of examination of the viability of hybrid microgrid architectures to improve energy access for remote locations in Northeast Nigeria, this study aims to conduct a techno-economic and environmental analysis of community-scale microgrid projects in a primary candidate remote village of Kabuiri in Northeast Nigeria and the applicability of the model for other remote villages in the region considering the recent removal of fuel subsidy by the Nigerian government. This analysis investigates system design, variable component sizing, and environmental and financial impacts of various system architectures. The system’s environmental impact is also analyzed based on different impact categories, such as global warming potential, acidification potential, ozone layer depletion, etc., to understand the respective implications on human and ecosystem health.
2 Methods
This section details the sourcing and methodology used in the system modeling and analysis. In designing a PV-based microgrid, optimizing the size of its components is crucial for maximizing the use of available solar energy and storage systems. This approach ensures the microgrid operates efficiently and cost-effectively (Mathew et al., 2022).
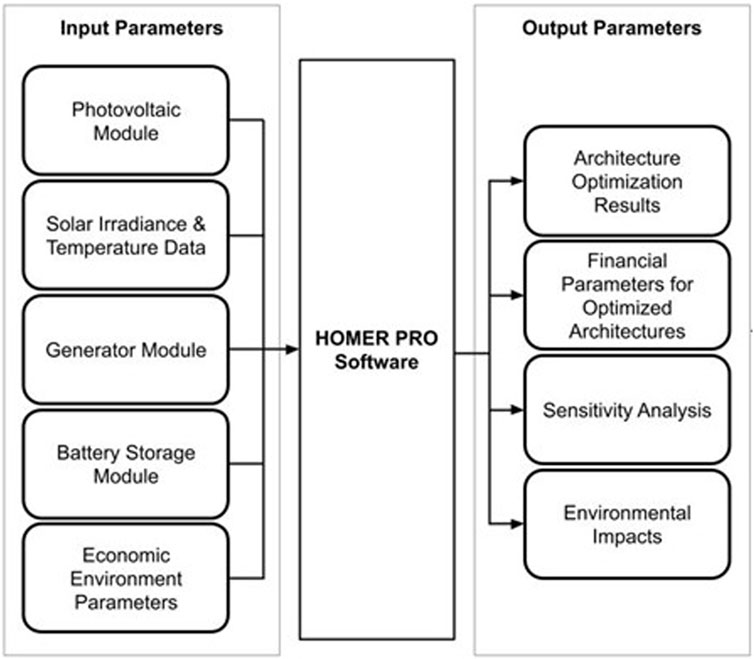
The schematic in Figure 1 outlines the step-by-step methodology used to conduct the analysis, providing a clear visual representation of the process. Understanding these technical details is crucial for replicating and interpreting the results accurately. The technical details of the required parameters in each stage are explained below.
2.1 Load demand
This study examines the viability of a community-scale microgrid for providing electricity to a community in Northeast Nigeria. In this effort, constructing an accurate and effective representation of community-scale electrical load is critical. Ajayi et al. conducted a 2016 study involving the creation of a demand profile for a rural community in northern Nigeria. For 200 households, Ajayi et al. estimated an average daily consumption of 358 kWh per day (Ajayi et al., 2016). This demand model accumulates power drawn from various common appliances over expected use times and corresponds with expected power consumption for rural families in developing countries, about 1 kWh per day per person (Meier et al., 2024). For this analysis, the load demand curve used will be proportionally scaled directly from this 2016 baseline of 200 households.
For more tangible results to be produced from this analysis, we selected a primary candidate village from Northeast Nigeria was selected. The village of Kabuiri was adopted as this model community for rural electrification. The village of Kabuiri, located at latitude and longitude 11.57 N, 13.53 E, represents a small and remote settlement in Northeast Nigeria with a significant lack of available electricity. The village has remained largely isolated from the electrical infrastructure present in towns with closer proximity to urban areas. Because of this lack of proximity to major urban centers, Kabuiri is not expected to receive a connection to the national grid in the near future. To further assess the viability of the load profile being applied to other communities in the same region, three additional communities besides Kabuiri were identified and examined. These three communities are Karagawaru (11.91 N, 12.55 E), Abodari (11.00 N, 12.83 E), and Garuhiza (10.63 N, 12.55 E) respectively.
Due to a lack of available census data for the village of Kabuiri and others in the region, a rough population estimate was performed as a part of this study. This estimate involved the identification of households through available satellite imagery sourced from a 2023 Google Maps image combined with available census data on the average number of residents per household in the region. Census data indicated an average of 6.87 residents per household in 2018 in Yobe State (The World Bank Working for a World Free of Poverty, 2018), a neighboring state in Northeastern Nigeria with a demography similar to that of Borno State. Based on the census data from Yobe State, we estimated the population of each household in the examined villages in Borne State. Figure 2 shows the resulting household identification for each village. This process yielded an approximate population estimate of 2,316 residents in Kabuiri, 447 residents in Karagawaru, 646 residents in Abodari, and 2,597 residents in Garuhiza. For additional information regarding the population estimation process, see Supplementary Material 2.
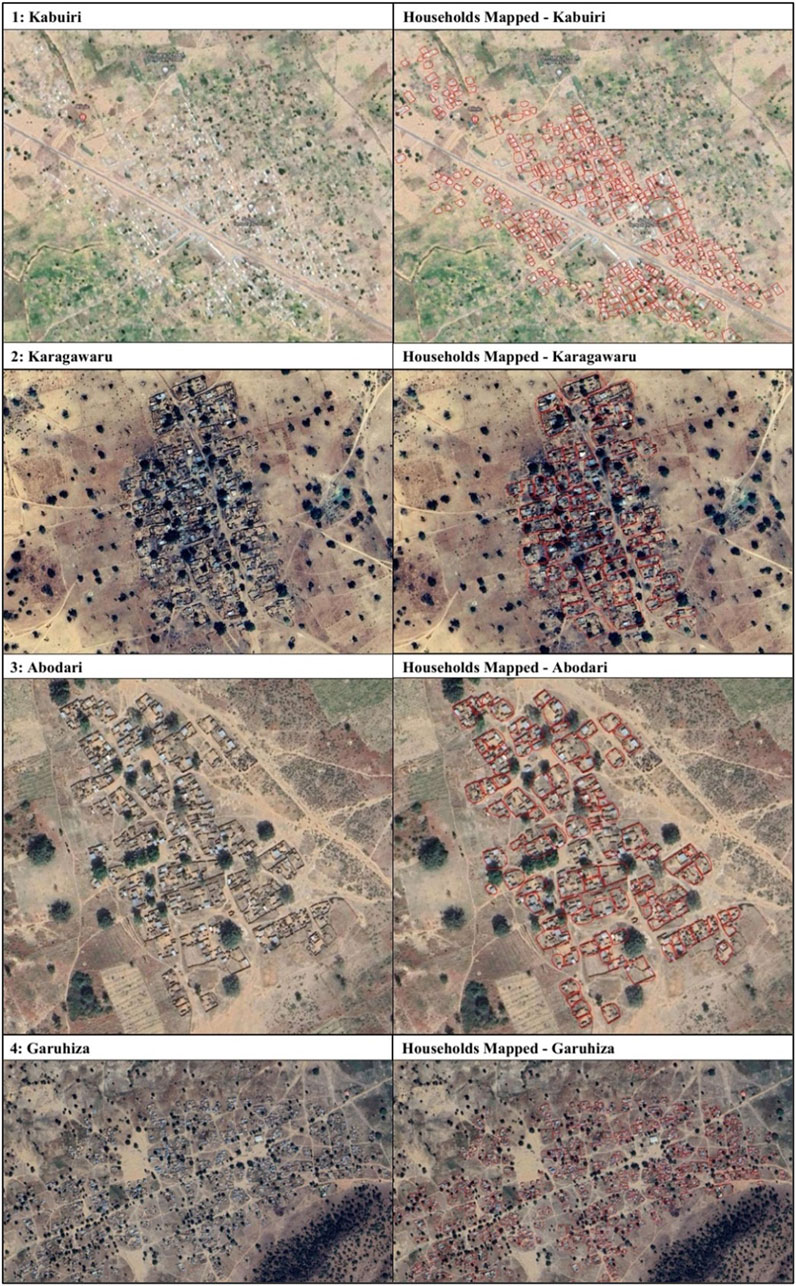
Figure 2. A breakdown of the population estimates for all examined communities. The estimated number of households in Kabuiri is 337. Based on the 6.87 average number of persons per household in Yobe State; Kabuiri was estimated to have 2,316 residents. Similarly, Karagawaru was estimated to have 65 households and 447 residents; Abodari was estimated to have 94 households and 646 residents, and Garuhiza was estimated to have 378 households and 2,597 residents.
The system was modeled using Kabuiri as the primary case study. The 337 households in Kabuiri yield an estimated 602 kWh per day power demand for the village. Table 1 shows the breakdown of daily power demand from various appliances drawn from Ajayi et al., scaled directly to produce the estimated load demand for Kabuiri (Akpan et al., 2013). We conducted a sensitivity analysis to assess the system’s viability and applicability to the other identified communities in the region.
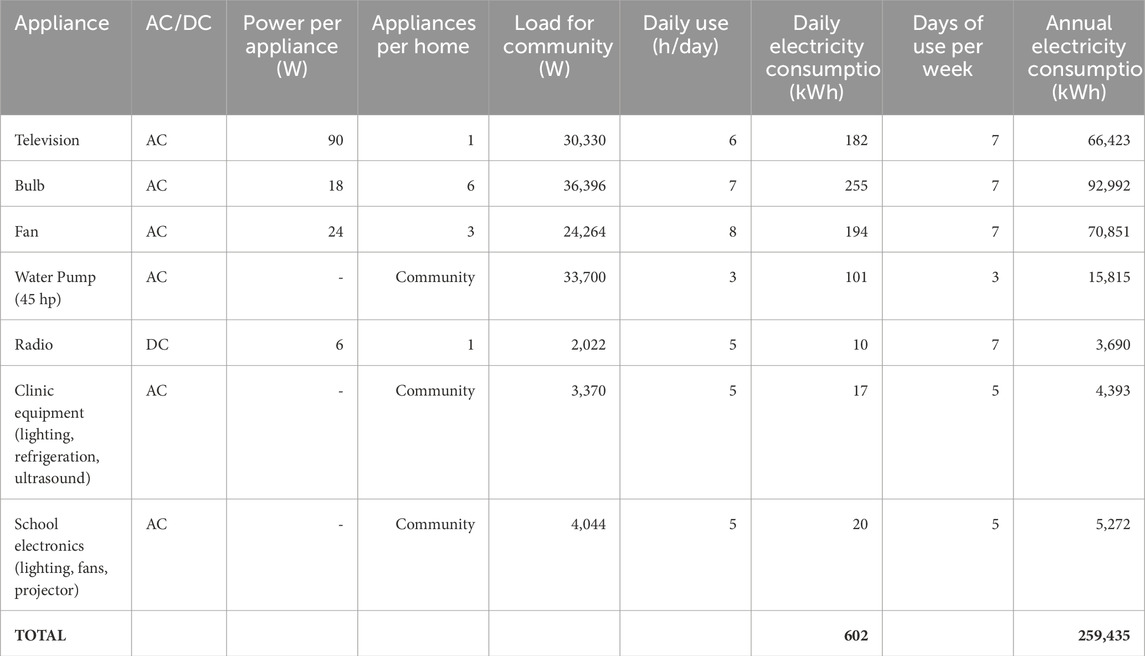
Table 1. The scaled power demand and electricity consumption for the 337 households in Kabuiri, proportionately scaled based on Ajayi et al. (Akpan et al., 2013).
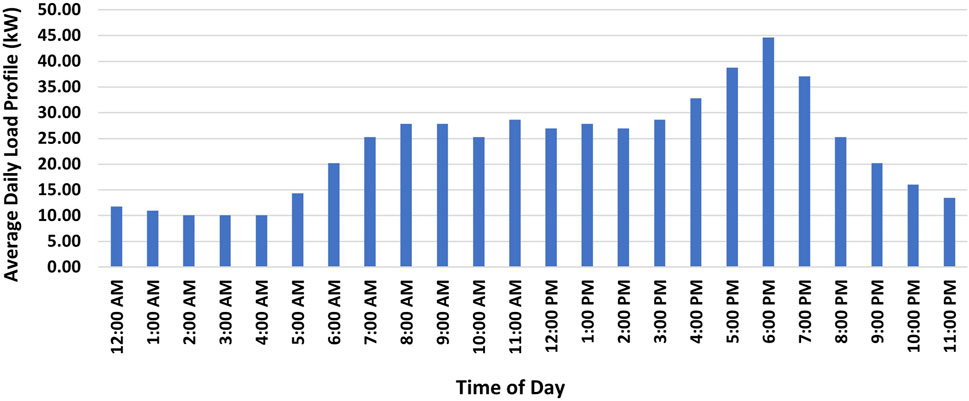
The daily load profile for the modeled community energy usage of Kabuiri is broken down over an average day in Figure 3. The demand profile shows a baseline overnight load of approximately 12 kW before rising to a stable level of 27 kW between 5:00 and 8:00 a.m. Daytime energy consumption remains at this relatively stable level until 4:00 p.m. when energy consumption peaks at 45 kW at 6:00 p.m. before gradually dropping off to the overnight baseline.
The daily load profile for the modeled community energy usage of Kabuiri is broken down over an average day in Figure 3. The demand profile shows a baseline overnight load of approximately 12 kW before rising to a stable level of 27 kW between 5:00 and 8:00 a.m. Daytime energy consumption remains at this relatively.
This general shape is common among most power grids, with the afternoon spike in energy consumption being caused by increased demand for interior lighting and appliance usage in the early afternoon (Meier et al., 2024).
2.2 Solar radiation
The solar irradiance and temperature data for Kabuiri was collected from the National Aeronautics and Space Administration (NASA) Prediction of Worldwide Energy Resources (POWER) database. This database contains meteorological data from July 1983 to June 2005 (NASA, 2023). The average daily horizontal solar irradiation in Kabuiri was recorded by the database at 5.90 kWh/m2/day. This means, on average, that a given square meter of PV panel will receive about 5.90 kWh of energy per day of global horizontal solar irradiance. Figure 4 shows the average daily horizontal solar radiation for each month over the average sample year from the POWER Database. The monthly average clearness index is also shown in Figure 4 from the same POWER Database, indicating how clear the sky is, on average, for each month due to cloud amount, water vapor content, aerosol concentration, and wind speed (Tanu et al., 2021). Average daily horizontal solar radiation and clearness together allow for an estimation of the overall amount of solar energy available in Kabuiri.
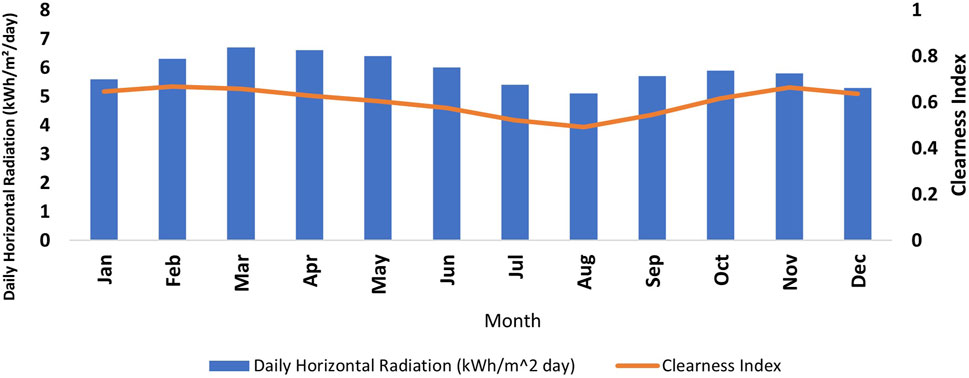
Figure 4. The monthly averages for daily horizontal solar radiation from NASA’s Prediction of Worldwide Energy Resources Database.
2.3 Solar module
Solar photovoltaic (PV) systems convert solar radiation into electrical energy using solar modules. These modules, consisting of interconnected solar cells on a base plate, are wired together to form a solar PV system with other balance-of-system components like inverters, charge controllers, and optional battery storage (Ajao et al., 2011).
The solar module examined in this research comprises various modeled strings of PV cells. PV cells represent the smallest individual component of any PV-based module and produce a set voltage (approximately 0.5 V) when exposed to intense visible light, with the electric current produced by a single PV cell corresponding directly with its surface area. To make use of PV cells in a practical manner, they are commonly arranged in series or parallel wiring configurations to increase the delivered voltage and current, respectively, to meet the required specifications. PV modules represent combined blocks of PV cells installed as a part of a larger contiguous surface to aid in the installation, protection, and use of PV cells. For larger projects, PV modules themselves are wired together in series or parallel to satisfy output voltage and current constraints. This DC output power is then fed through a charge controller or similar control system to an inverter, battery storage, or other load (Duffie et al., 2024).
The capacity of the PV array is calculated based on the average solar radiation at the design location, considering the daily energy demand and derating factors such as wiring losses, dust, and other environmental influences. This approach provides a safety margin between the limits of the PV modules and the stresses they experience (Williams and Beng, 2021; Ijeoma et al., 2023a). The capacity of the PV module can be determined using Equation 1:
where Edaily is the daily energy demand, fd is the derating factor assumed, and Sh (also known as peak sunshine hour) is the number of hours the sun must shine at its peak (1000 W/m2) to deliver the same amount of energy received throughout the day (Ijeoma et al., 2023a).
The performance characteristics of commercially available PV modules are typically assessed at Standard Test Conditions (STC). STC is defined as 25°C and the illumination of 1,000 W per square meter with a distribution reflective of real-world conditions–termed Air Mass 1.5. It is common, however, for post-installation performance to often fall 10–15 percent below the listed STC performance, largely due to factors such as shading, dirt buildup, and temperature-dependent factors (Duffie et al., 2024). The HOMER simulation uses a dynamic derating factor to adjust the instantaneous output of a PV module, accounting for module temperature and current panel conditions. The power output is determined from the module’s performance characteristics at standard test conditions, following IEC 60904–3, which considers direct, diffuse, and albedo irradiance components (Monokroussos et al., 2020).
The power output of a PV module is evaluated using Equation 2.
Where
ReSun Solar Energy [RS7I-425M] PV panel was selected as the basis for PV energy generation within the system architecture. This monocrystalline panel has a listed capacity of 425 W at 34 V, with a rated efficiency of 19.24%, with dimensions of 2,115 mm × 1052 mm × 30 mm (Victronenergy, 2024). This panel model was selected for use due to its availability in the international market and the low cost of $0.16 per watt of rated capacity. Further manufacturer information regarding the technical parameters of the PV panel is shown in Supplementary Material P1.
2.4 Battery module
A battery stores excess energy from other power-producing modules for later use, improving energy efficiency and lowering grid reliance. Batteries play a vital role in storing renewable energy, ensuring a steady power supply even during minimal solar or wind activity periods. They also play an essential role in balancing supply and demand on the grid, resulting in a more reliable and sustainable energy system (Joseph and Shahidehpour, 2006; Ndukwe and Iqbal, 2019).
The battery storage capacity can be determined using Equation 3:
where Edaily (kWh) is daily electricity demand, Beff is the battery efficiency, Vbat is the battery nominal voltage, DOD is the depth of discharge, number of days of autonomy (DA), and DM is the design margin (Mathew et al., 2022).
The Sunlight 2 V 26 RES OPzS 4,730, a vented, 2 V, 3,000 A h, lead-acid battery was selected for use with a listed nominal capacity of 4.923 kWh (Monokroussos et al., 2020; Victronenergy, 2024). The lead-acid battery is the predominant means of energy storage for most small-scale energy storage applications due to the cost and lifespan advantages it offers over other solutions. For microgrid architectures relying on PV generation, battery storage fills a fundamental role in guaranteeing a continuous power supply, either during periods of low irradiance or at night. However, battery storage installation and maintenance can make up a sizable portion of overall project costs and must be balanced accordingly.
The HOMER simulation environment models the battery capacity and lifespan of lead acid batteries dynamically based on environmental and operational conditions. Included in this is dynamic modeling of battery life for lead acid batteries based on their cycling, state of charge, and age. Further manufacturer information regarding the technical parameters of the battery system is shown in Supplementary Material P2.
2.5 Inverter module
For electric microgrids, the inverter converts electricity between direct current (DC) and alternating current (AC) inside the system’s architecture. While most electrical devices rely on AC power supplies, PV panels and battery storage systems fundamentally operate on DC. This necessitates a bidirectional inverter to ensure that AC power from a generator or external source can be used to charge the battery system, as well as allow the PV and battery modules to supply AC power for distribution (Okoye and Oranekwu-Okoye, 2018). This conversion process has an inherent inefficiency, accounted for in the HOMER simulation process.
The process of sizing an inverter comprises establishing the proper power capacity for the application or load it will handle. The inverter is sized based on the following equation:
To get the best possible performance, it is essential that the power rating of the inverter be equal to or greater than the total power requirements of the devices that are connected to it. To achieve the best performance, it is crucial that the power rating of the inverter be equal to or greater than the total power requirements of the connected devices. This condition guarantees that all devices receive sufficient power.
A large generic inverter was used for this analysis as a modeling aid to allow for dynamic component sizing inside the HOMER model. For the final implementation of any system architecture presented here, an inverter corresponding to the specific battery and demand characteristics would need to be selected. To account for capacity-tied pricing for the different inverters commercially available, the cost of an inverter was modeled at $260 per kW of rated capacity. This rate is extrapolated from the specifications of the Victron SmartSolar MPPT RS 450/100-Tr (Victronenergy, 2024). Further manufacturer information regarding the technical parameters of the inverter system is shown in Supplementary Material P3.
2.6 Generator and MGS modules
For electric microgrids, generators often serve a secondary role unless an alternative means of meeting electrical demand is not available. The capacity of generators to rapidly match power demand makes them a commonly used source of backup power. For the purposes of this study, a Modular Gasification System (MGS) was modeled as a potential generator substitute. This MGS system would produce power from local biomass procured at an assumed $10 per ton.
HOMER utilizes the following equation to compute the average total efficiency of a generator system:
where Pgen is the generator’s electrical production in kWh, mfuel is total fuel consumption in kg/yr., and LVHfuel is the lower heating value of the fuel (MJ/yr.). We should note that the 3.6 factor is because 1 kWh = 3.6 MJ (Homer energy, 2023a).
An available DG6500SE 5 kW commercial generator was selected for this study, with additional generation capacity being modeled in 5 kW increments according to the simulation analysis. Overall generator capacity is sized by HOMER to the smallest capacity to sufficiently meet electrical demand. The manufacturers’ specifications of the microgen can be found in Supplementary Material P4.
2.7 Economic indicators
The key economic parameters of this study comprise investment cost, net present cost (NPC), levelized cost of electricity (LCOE), simple payback time (SPBT), and internal rate of return (IRR). With financial conditions within Nigeria being relatively volatile, this study assumes a standard discount rate of 8% and an inflation rate of 2% (Ijeoma et al., 2024a). The impact of the discount rate fluctuations is assessed in the sensitivity analysis.
2.7.1 Net present cost (NPC)
Net present cost represents a critical measure of the overall value of a project. Calculated as the summation of all time-value costs of the project, it ranges to include equipment, installation, operation and maintenance, fuel, and potential emission penalty costs, as well as an estimation of asset resale value at the final stage of the project lifespan (Tijani et al., 2014a). Within HOMER, NPC is determined through the summation of all discounted cashflows over the lifespan of a project. All system architectures that meet demand requirements within the HOMER software are ranked by their respective NPC–from which other cost metrics are derived (Homer energy, 2023c).
2.7.2 Levelized cost of electricity (LCOE)
The LCOE of a project is a representation of the overall cost of a project in per unit terms of the energy delivered to the end user. Like the calculation of NPC, the LCOE of a project is determined procedurally within HOMER as a ranking metric between system architectures.
LCOE is calculated in HOMER Pro using Equation 6.
where
2.7.3 Simple payback time (SPBT)
The payback period is the length of time required to repay the cost of an investment. SPBT can be determined from Equation 7.
Shorter payback times indicate more attractive investments, while more extended payback periods indicate less desired assets (Olatomiwa et al., 2015).
2.7.4 Internal rate of return (IRR)
The internal rate of return (IRR) is the project’s yearly rate of growth from an investment. IRR is calculated such that the net present value is set to zero (Ijeoma et al., 2023b). IRR was calculated using Equation 8.
2.8 Environmental assessment parameters
For this research, pollution from the system architectures stems solely from the combustion emissions during operation. Internally, the HOMER software reports six pollutants carbon dioxide (CO2), carbon monoxide (CO), particulate matter (PM), sulfur dioxide (SO2), nitrogen oxides (NO2), and unburned hydrocarbons (UHC) (Ijeoma et al., 2024b). These pollutants have numerous adverse effects on the environment and ecosystems. The environmental impact of these pollutants was evaluated using the EPA’s Tool for the Reduction and Assessment of Chemicals and Other Environmental Impacts (TRACI) 2.1 life cycle impact assessment model. TRACI considers resource depletion, human health implications, and ecological quality across different impact categories.
The following TRACI impact categories were considered in this study: global warming potential (GWP), acidification potential (AP), eutrophication potential (air and water), photochemical smog potential (SP), and human health particulate (HHP) potential. These impact indicators provide a key metric for evaluating system end-point impacts on human health and the environment. This comprehensive methodology enables organizations to understand their environmental footprint better and make informed decisions to mitigate negative impacts (Ijeoma et al., 2024b). TRACI 2.1 characterization factors were applied to the direct emission of different pollutants from the optimized architecture and used to determine their potential midpoint impacts on the environment. See Supplementary Material P6 for more information on the descriptions of these pollutants, impact categories, and TRACI 2.1 characterization factors.
2.9 HOMER pro software
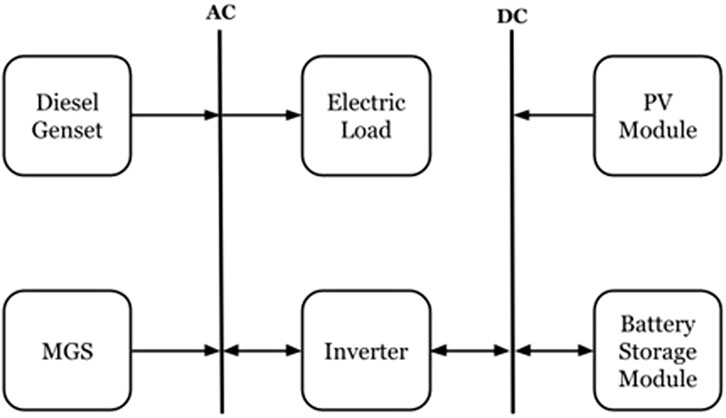
The HOMER Pro software represents a software-based deterministic approach to microgrid modeling and was used to perform the system simulations used in this analysis (Mathew et al., 2022). The HOMER software is provided with key input parameters: model solar irradiance and temperature data (incorporated from the NASA POWER database), the load demand curve, as well as the available system modules of varying sizing for battery storage, PV generation, diesel microgen, and additional system components. These system parameters, along with various fuel prices for the completion of a sensitivity analysis, were incorporated into the simulation. The running simulation, once completed, ranks winning system architectures by component sizing and classification, life cycle cost of energy (LCOE), and Net Present Cost (NPC). Various system architectures that successfully meet load demand are ranked by NPC and LCOE within the HOMER analysis. Through consideration of the various parameters of winning architectures, the optimal system architecture can be selected by the user regarding NPC, LCOE, predicted emissions, and operating cost. The framework for the system design architecture used is shown in Figure 5 below consisting of all design modules.
3 Results and discussion
This section details the simulation outputs and results of this overall analysis in technical, economic, and environmental terms.
3.1 System technical results
Following the HOMER analysis, the optimal system architectures for supplying community load were determined at the baseline diesel price of $1.00 USD/L for all possible combinations of system components. Table 2 shows the result of the hybrid system configurations based on the baseline diesel price.
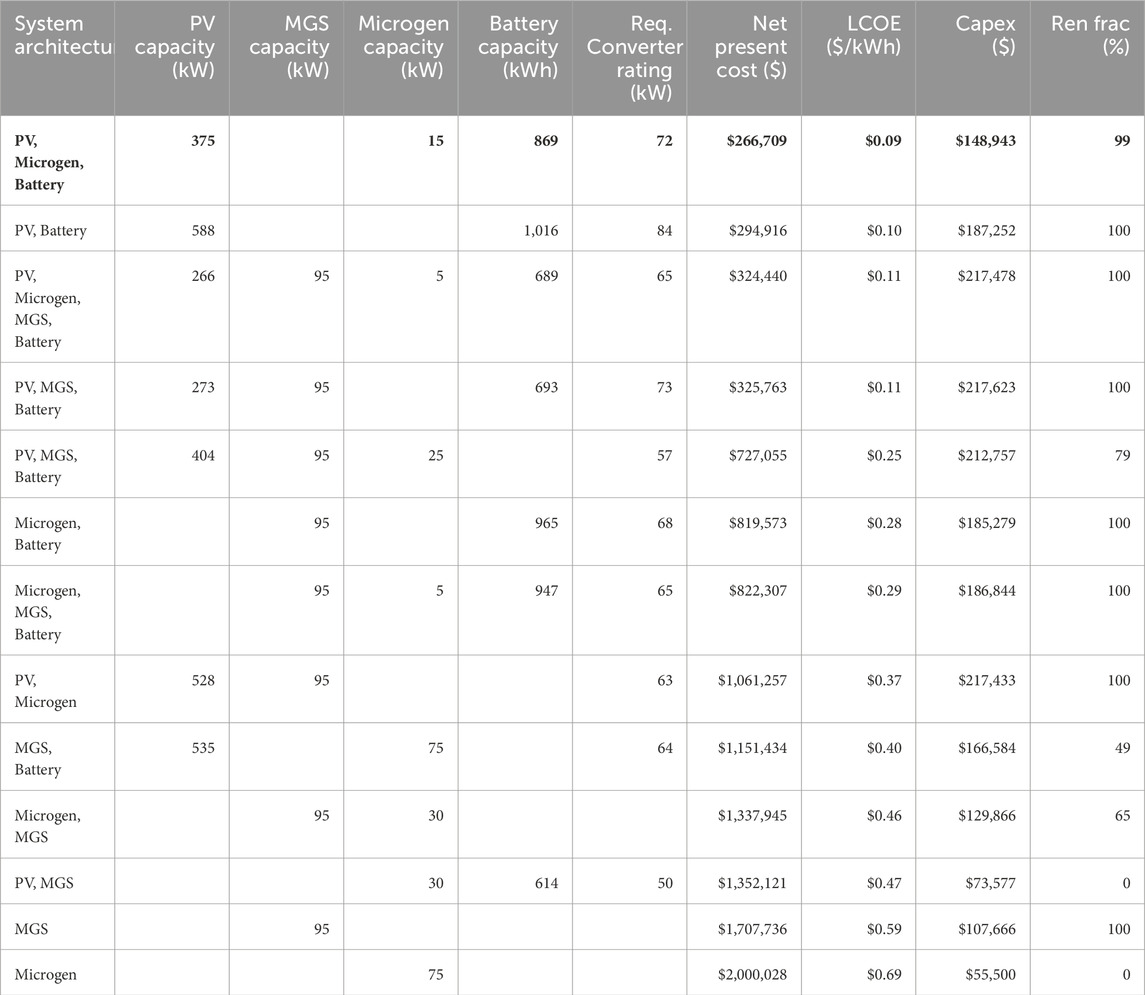
Table 2. HOMER Simulation Results for the optimum system architecture by type. Optimal System Architecture is listed in bold. All architectures shown make use of cycle charging dispatch, a combined inverter and a rectifier of the specified size and operate with the assumed baseline diesel price of $1.00 per liter.
The optimal system, shown in bold in Table 2, consists of solar PV, battery, and microgen components. It possesses a rated PV capacity of 375 kW, producing an average of 1,978 kWh per day and 722,100 kWh per year for a capacity factor of 22.0%. This is paired with 869 kWh of lead acid battery storage, yielding a system with 20.5 h of autonomy for this architecture and a useable generation capacity of 522 kW. The battery storage module processes an estimated 111,500 kWh per year in throughput (energy out of the battery), yielding an expected service life of 6.23 years while providing approximately 45.2% of total instantaneous load over the course of a model year. The baseline system architecture makes use of 15 kW of microgen capacity operating in a cycle charging configuration to satisfy electrical demand. This microgen is required to operate at a mere 1.47% capacity factor (only operating for 187 h per year), producing a nominal microgen service life of 80.2 years. The simulation of the system architecture indicates that an inverter with a rating of 72.06 kW or greater is required to satisfactorily meet system needs. This system produces an estimated 724,030 kWh per year in combined electrical production, sufficiently meeting the estimated community need of approximately 220,500 kWh per year with less than 200 kWh of unmet electric load. For this baseline system design, more than 99% of all electric generation was produced from renewable energy, with the remaining 0.87% provided by microgen.
The findings of our study align with a similar hybrid energy system analysis conducted by Ijeoma et al. (Ijeoma et al., 2024b), where their solar-battery-generator system produced 386,574 kWh per year of electricity and 173,195 kWh per year of excess energy, for which the excess energy was assumed to be sold to the grid. A hybrid study was also conducted by Odou et al. (Odou et al., 2020a) in the Benin Republic for rural electrification; their system yielded about 7.7% excess energy. The difference in energy production and excess energy in this study can be attributed to the higher PV reliance and lesser load demand. It is possible that excess energy generated in this system architecture may be effectively utilized to supply additional deferrable loads within the community once installed.
Figures 6A,B show the output of the PV and Microgen systems respectively, and the state of charge of the battery module in Figure 6C over the course of a model year based on the hourly simulation. On average, the PV system produces 1,978 kWh of generation capacity per day, however, this generation is variable and noticeably intermittent. This variability and intermittency can lead to instances where the overall energy storage present is insufficient to meet foreseeable future demand. At this point, the 15 kW Microgen is brought online to aid in supplying demand and/or recharging the lead acid batteries to ensure that sufficient electrical supply remains available. For the selected location of this study, local wet seasons typically correspond to significantly less sunny periods in the mid-to-late summer and place additional strain on this system. Visible in Figure 6B is a period around Day 210 where a spell of consecutively darker days produces a significant drop in PV generation. During this period, the system relies on the 15 kW Microgen to aid in power generation—acting as a backstop to help the system meet demand.
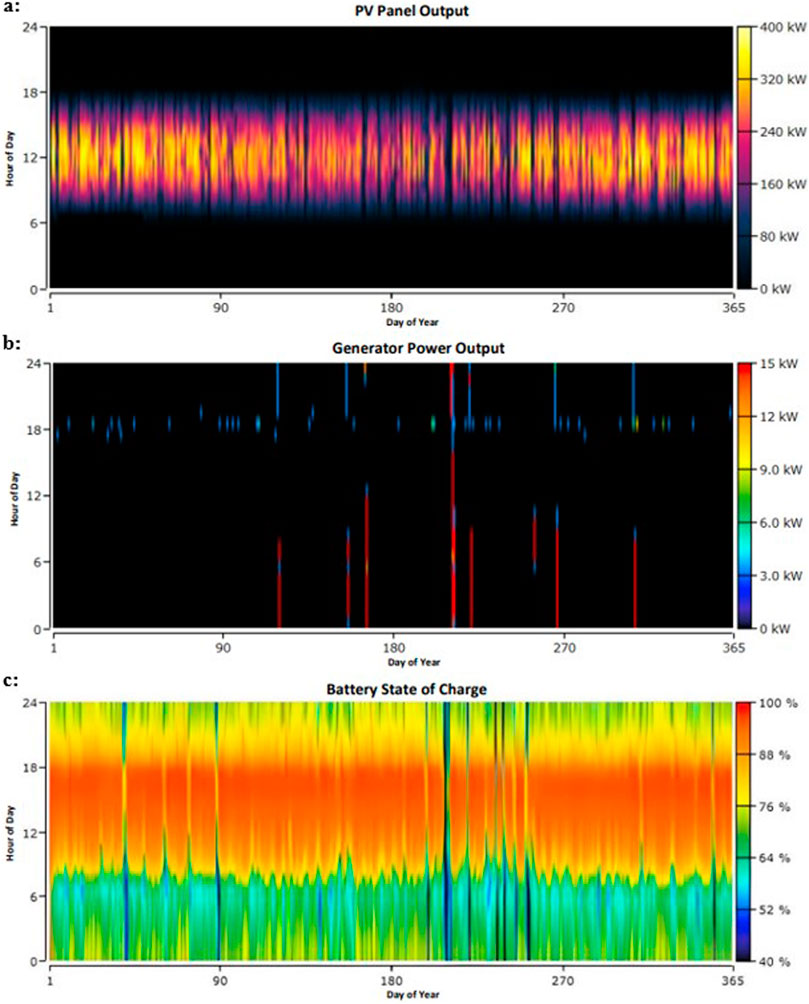
Figure 6. (A) Breakdown of the output profiles of the PV. (B) Output profile of the Microgen modules. (C) The state of charge for the lead acid battery storage.
The system operation behavior is analogous to the Ijeoma et al., 2024 solar PV/battery/generator system, wherein their system also showed a period of consecutive dark days around day 90. The difference in variability is attributed to the different regions of the country with slightly different weather conditions and solar irradiance that both projects inhabit. Of note is the difference in average daily horizontal solar irradiation, where the recorded average daily horizontal solar irradiation is 4.21 kWh/m2/day in Port Harcourt per the NASA POWER database. The same database records 5.90 kWh/m2/day for the selected portion of Northeast Nigeria, which shows that variability in solar PV performance is expected.
To ensure consistent electricity is available, the optimal system makes effective use of the Microgen to supply consistent power during periods of low PV production. This results in little overall use of the generator, however, as is visible in Figure 6B. Over the year, the Microgen operates with a mean output of 10.3 kW for 187 h, requiring only 48 starts. For these 187 h of operation, the unit consumes 620 L (approximately 164 gallons) of diesel fuel. Considering the relatively high operating cost of the Microgen unit, this unit is operating efficiently within the larger system by making use of more costly means of electrical production only when necessary to avoid capacity shortfall. The community may consider removing the Microgen to replace it with a PV-battery-only system with additional unmet load due to the Microgen’s low-capacity usage, which could reduce the overall net present cost (NPC) by 7.1% to $247,500. The total capacity shortfall would be increased from 220 kWh to 2,150 kWh per year, but this would still represent a modest percentage of the total power consumed, resulting in an overall system LCOE of less than $0.09 per kWh. The increase in capacity shortfall would be manageable for the system if adequately planned to fall when the load demand is not critical.
Regarding generator usage, this study significantly outperformed others, such as Modu et al.‘s (Modu et al., 2018), which used a generator system for 4,299 h annually and consumed 26,662 L of diesel fuel. Similarly, in Ijeoma et al. (Ijeoma et al., 2024b), the Microgen was operational for 180 h with 28 starts and consumed 4,177 L of diesel. This difference is largely attributed to the current system’s prioritization of PV capacity to take advantage of local solar resources, resulting in fewer starts and less overall fuel consumption. Therefore, this system was able to achieve greater efficiency and reduce emissions.
Figure 6C displays the state of charge for the lead acid battery system, showing the remaining portion of the energy stored within the battery bank on a per-hour basis over the model year. On most days, the battery bank reaches a state of near-full charge before discharging from 4 p.m. onwards, only being depleted to the 40% minimum charge state three times in the model year. These regular charge patterns demonstrate the full use and effectiveness of the battery bank, effectively harnessing PV generation during productive hours to meet electrical demand throughout a given day. As mentioned earlier, this 869 kWh lead acid battery system provides only 20.5 h of autonomy, forcing the system to rely little on energy storage for shortfalls in PV generation between prolonged sunny and cloudy periods. Due to limited capacity to store excess PV generation, 465,270 kWh of the total 724,020 kWh generated by the system remains unused and is written off as excess generation. While this quantity, representing 64.3% of all electricity generated by the optimized system architecture, is not prescribed value within this system, it remains available for instantaneous private and/or community uses during the sunny midday hours. Therefore, it may represent a valuable opportunity for more infrequent or deferrable loads within the community. This excess energy can also be sold to potential future grid connections to generate income that could be used to cover system operational costs should the opportunity arise.
3.2 System economic results
The economic results of the optimal system architecture are shown in Table 3 below. The PV, battery, and Microgen system possessed an initial cost of $148,943 and NPC of $266,709. The optimal system has an estimated $9,110 in running costs each year while providing electricity to users at an LCOE of $0.0927 per kWh. This provides an Internal Rate of Return (IRR) of 142.7% and a simple payback period of 0.8 years under the assumed 2% annual inflation rate and an 8% discount rate. A sensitivity analysis was conducted to assess the impact of the discount rate on the system NPC.
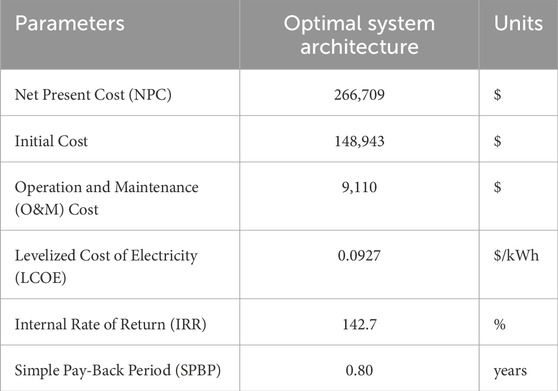
Table 3. Annual financial parameters of the optimal system architecture and the conventional Microgen-only alternative.
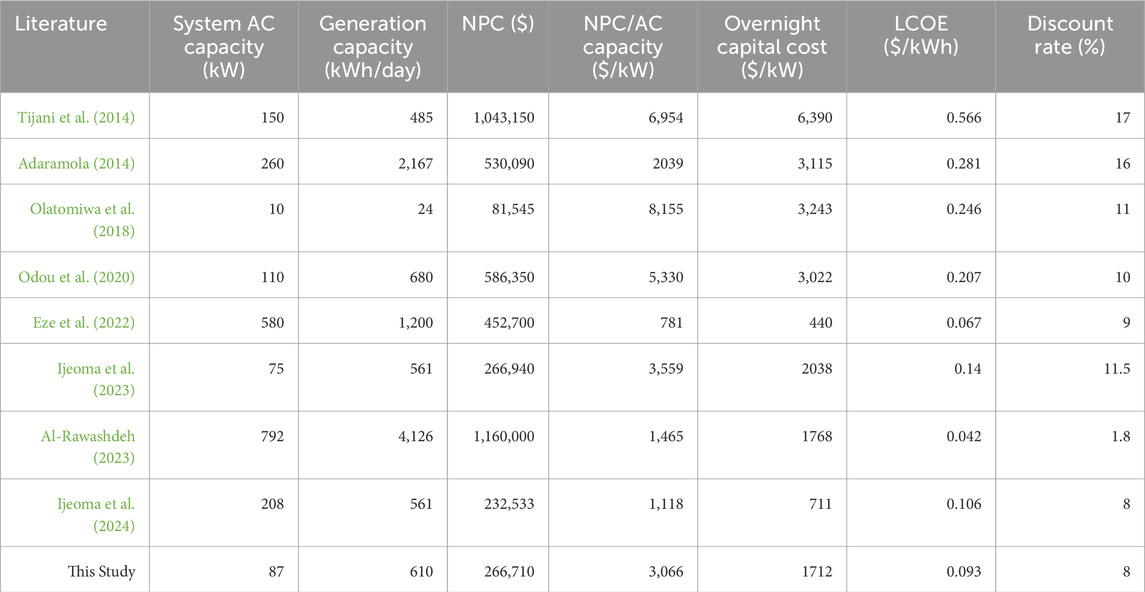
The findings of this study compare favorably to similar studies examining the feasibility of microgrids throughout West Africa and Nigeria specifically. Table 4 shows the economic comparison of the system results with related literature in West Africa. Of interest are the findings of Tijani et al., 2014, wherein an optimized PV/Battery/Generator system was designed with the aid of the HOMER analysis software. This system, which is of comparable scale and was intended for rural application in Northern Nigeria, possessed an LCOE of $0.566 per kWh compared to the $0.093 per kWh produced in this analysis. The stark difference in overall cost between systems can largely be attributed to the difference in the price of PV modules, where the cost of PV capacity in their study was at an astounding $7,200 per kW. In contrast, in this study, the same metric was evaluated at approximately $160 per kW (Tanu et al., 2021). While this does not necessarily indicate a more or less effective design given available resources, it does provide a clear indication of the substantial impact that falling PV panel prices have had on the affordability of decentralized electricity generation.
However, Eze et al., 2022, and Al-Rawashdeh et al., 2023, examined a grid-connected hybrid system in which excess electricity is sold back to the grid at market rates, significantly reducing overall LCOE costs to $0.054 per kWh and $0.042 respectively (Odou et al., 2020a), (Al-Rawashdeh et al., 2023). More recent studies by Ijeoma et al., 2024 presented a comparatively marginal improvement. They designed a microgrid architecture for supermarkets in Port Harcourt in Southern Nigeria, achieving an LCOE of $0.106 per kWh compared to this study’s $0.093 per kWh. Much of the difference in LCOE between systems can be attributed to the increased effectiveness of PV systems in Northeast Nigeria as compared to the coastal environment of Port Harcourt.
As shown in Table 4, this study has a high NPC to AC capacity ratio due to the use of solar PV energy for battery charging instead of a generator, preventing significant demand spikes. Comparing this study with others, it shows a similar ratio for kWh/day generated to a PV-only system designed by Ijeoma et al. (Ijeoma et al., 2023b) in Port Harcourt, Nigeria. Also, for more information on the different options for financing energy access projects, see Supplementary Material P7.
3.3 Environmental impact analyses result
The environmental impact due to Microgen operation of the optimal system architecture from the HOMER analysis is shown in Table 5. The results indicate that CO2 represents the dominant pollutant produced by the system in overall quantity, followed by CO. The optimized system architecture has a much lower CO2 emission due to the reduction in diesel usage as result of the solar PV system.
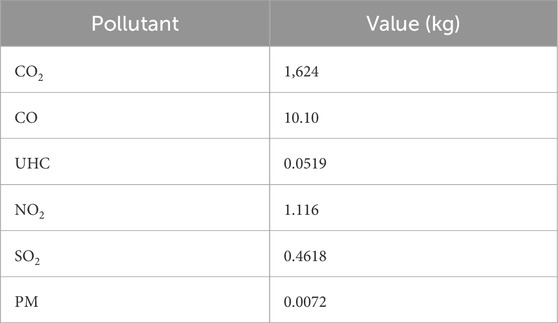
Table 5. The annual pollutant production of the optimal system architecture and conventional Microgen-only alternative.
Table 6 displays the endpoint impact of these pollutants over various impact categories according to TRACI 2.1. The global warming air impact indicates a quantified value of the impact of the system on global warming. Similarly, the air smog and particulate metrics provide quantified values for the overall system impact in these impact categories, all expressed in terms of their respective predominant pollutants.
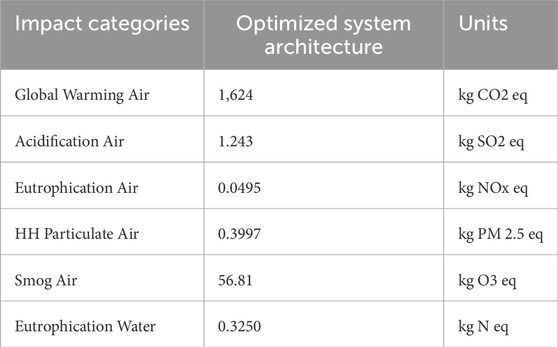
Table 6. The annual pollutant production characterized using TRACI 2.1 characterization factors for different impact categories across conventional and optimized system architectures.
This study found that minimal use of a generator in a hybrid energy system resulted in only 0.007 kg CO2 per kW for each year of operation. This represents a stark decrease compared to previous studies by Tijani et al. (Tijani et al., 2014b), Modu et al. (Modu et al., 2018), and Ijeoma et al. (Ijeoma et al., 2024b), which produced 0.081, 0.665, and 0.053 kg of CO2 per kWh respectively for each year of operation. Further reductions in emissions from the current system contribute to climate change mitigation, air quality improvement, biodiversity preservation, and human health in the region.
3.4 Sensitivity analysis
This section covers a sensitivity analysis performed on the effect of fuel price on the primary microgrid system for Kabuiri, as well as the effect of discount rate on economic factors. Additionally, a sensitivity analysis was performed assessing the required changes in the same microgrid system for serving communities across a range of possible sizes. Along this range of community sizes lies the three additional communities: Karagawaru, Abodari, and Garuhiza.
3.4.1 Kabuiri fuel price microgrid sensitivity analysis
After the removal of the general fuel subsidy by the Nigerian government in 2023 (KPMG, 2024), (Nigeria, 2024), the price of a liter of diesel increased by more than 200% from $0.25 per liter to $0.8 per liter, and this price continues to increase (Aljazeera, 2024), (Sun Connect News, 2024). To assess the impact of diesel price on the optimum system architecture, a sensitivity analysis was performed along 10 cent increments of the diesel price ranging from $0.4 per liter to $2.5 per liter. An analysis of the economic and design parameters of various optimized systems over this range of possible diesel prices yields insights into trends in system design and broader economic viability.
The results from the sensitivity analysis are shown in Table 7 and the normalized economic parameters of the preferred system architecture in Figure 7. The sensitivity analysis results show that, regardless of the price of diesel, the preferred system architecture remained a PV/battery/generator system with relatively minor increases in LCOE seen between systems alongside increases in diesel price. Significant increases in the required system capital expenditure were observed with increases in diesel price, while no similar trend is noticeable with annual operation cost. In terms of changes in system parameters across the range of sensitivity cases, a relatively minor change was observed in the required generator sizing and overall renewable penetration, largely because of the comparatively minor role that the Microgen already played in total energy production.
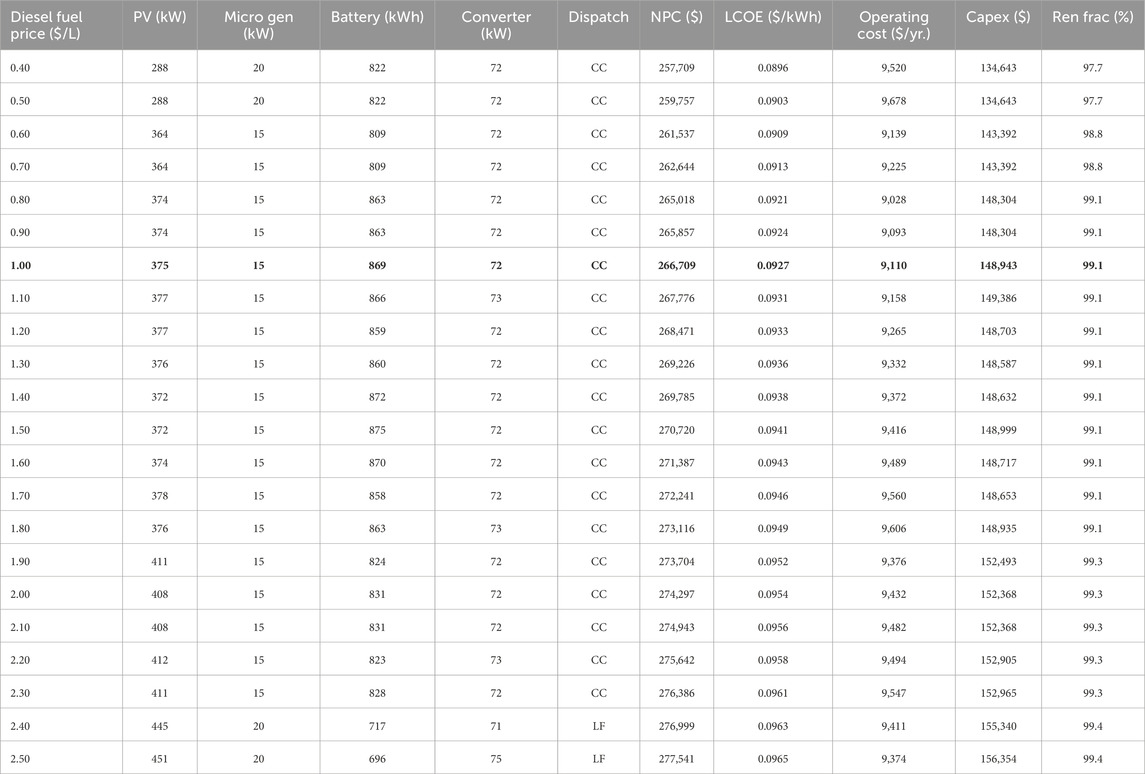
Table 7. The optimized system architectures for all diesel price variation scenarios. Shown in bold are the system parameters for the baseline system architecture at $1.00 per liter.
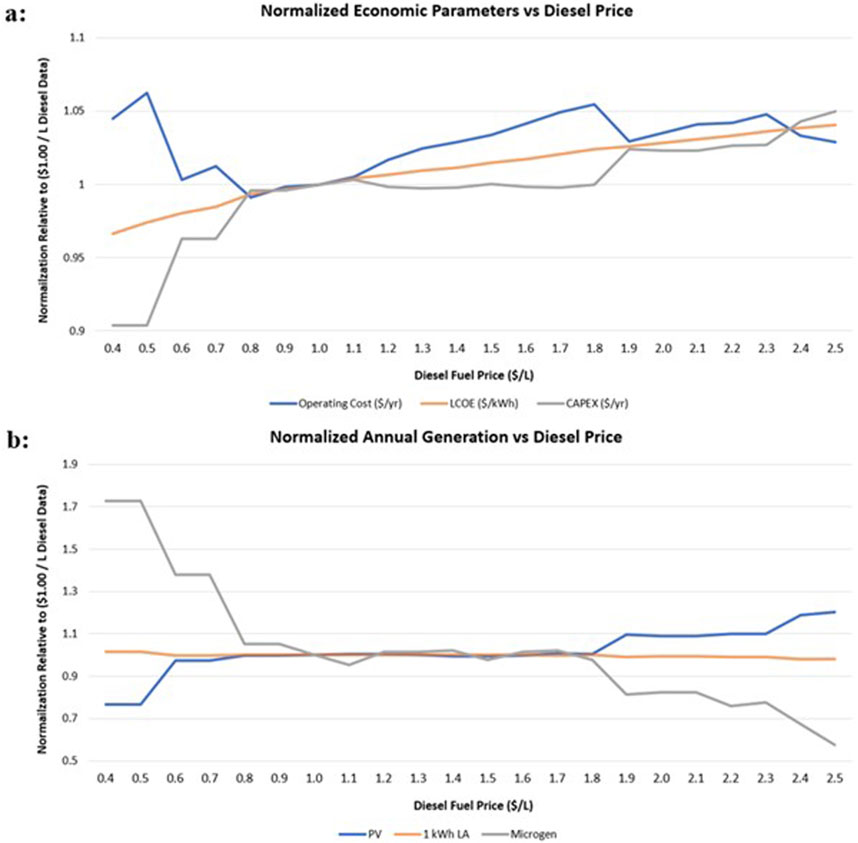
Figure 7. The economic parameters and annual generation of the winning Kabuiri system architecture normalized to the baseline system architecture at $1.00 per liter are shown in parts A and B, respectively.
The diminishing role of Microgen energy production is observed as the diesel price increases in Figure 7B. A similar trend was also observed in Ijeoma et al. (Ijeoma et al., 2024b), whose study showed that a PV/battery/generator system becomes more attractive as the price of diesel increases. These results suggest that the relative cost-effectiveness of PV/battery systems could be heavily influenced by fluctuations in diesel prices, making them a more viable alternative in certain economic conditions. Further research is needed to explore how multiple external factors ranging from fuel price uncertainty to component supply shortages may impact the overall attractiveness of PV/battery systems compared to traditional energy sources.
The sensitivity analysis highlights the importance of considering long-term diesel price fluctuations over a project’s lifespan and how a system can be adapted to changing economic conditions. The optimal system architecture adapts to increasing diesel prices by increasing installed PV capacity, holding the required generator rating constant, and decreasing required battery storage capacity. In theory, this would allow owners/operators to install additional PV capacity in times of high fuel prices without overhauling the broader microgrid system, allowing them to adapt to higher fuel price environments effectively.
3.4.2 Kabuiri discount rate microgrid sensitivity analysis
To aid in evaluating the potential effects of Nigeria’s variable discount rate, a sensitivity analysis was performed on the economic parameters of the optimal system for Kabuiri over a wide range of potential discount rates. Examining the potential effects of volatile discount rates on the economic parameters of the system may provide insight into the viability of projects in Nigeria’s unique economy.
The impact of the discount rate on the NPC of the optimal system is illustrated in Figure 8. This sensitivity analysis demonstrates that changes in the discount rate may have significant implications for the overall NPC of the system. The impact of volatile discount rates on NPC is particularly pronounced between 1% and 15%, with starkly diminishing changes seen as the discount rate increases further. Furthermore, substantial increases in the discount rate led to optimal architectures favoring reduced PV capacity and increased generator usage—presumably due to the increased cost of financing PV installation. At the time of writing, the monetary rate held by the Nigerian Central Bank sits at 12.5%, suggesting that further potential hikes in the monetary rate as a proxy for discount rate has comparatively little potential to drastically harm the NPC and component sizing of the optimal system architecture (Monetary Credit, 2024). Further information on the effect of the discount rate on baseline system LCOE and IRR can be found in Supplementary Material P7.
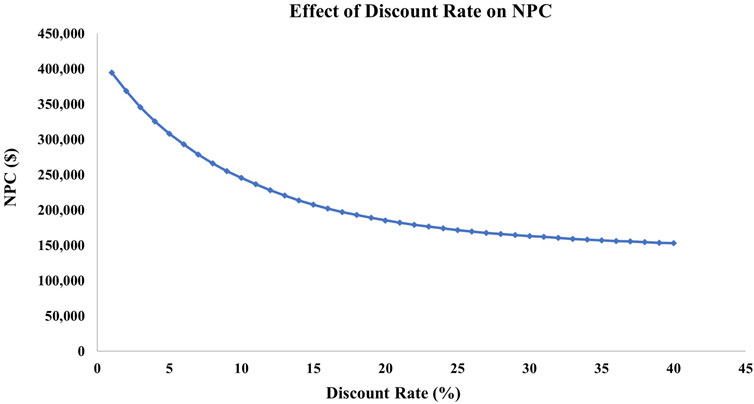
Figure 8. The relationship between the discount rate and Net Present Cost (NPC) of the baseline system architecture.
3.4.3 Community size microgrid sensitivity analysis
A broader sensitivity analysis was conducted to assess the potential viability of similar microgrid systems for other communities in the Northeast region of Nigeria. Considering the population size of three different communities briefly discussed in Section 2.1, the analysis was conducted using scaling of per capita load demand across potential communities ranging from 10 to 1,500 households. It is important to note that there are communities with fewer than 60 households in rural Nigeria. Still, the methods used in this study are only sometimes suitable for electrifying these communities. Instead, communities on these far ends of the examined range would likely benefit from precisely sized models but are still included in this data to help identify trends and areas of high performance. Figure 9 below shows trends in LCOE and component-specific costs across the range of this sensitivity analysis.
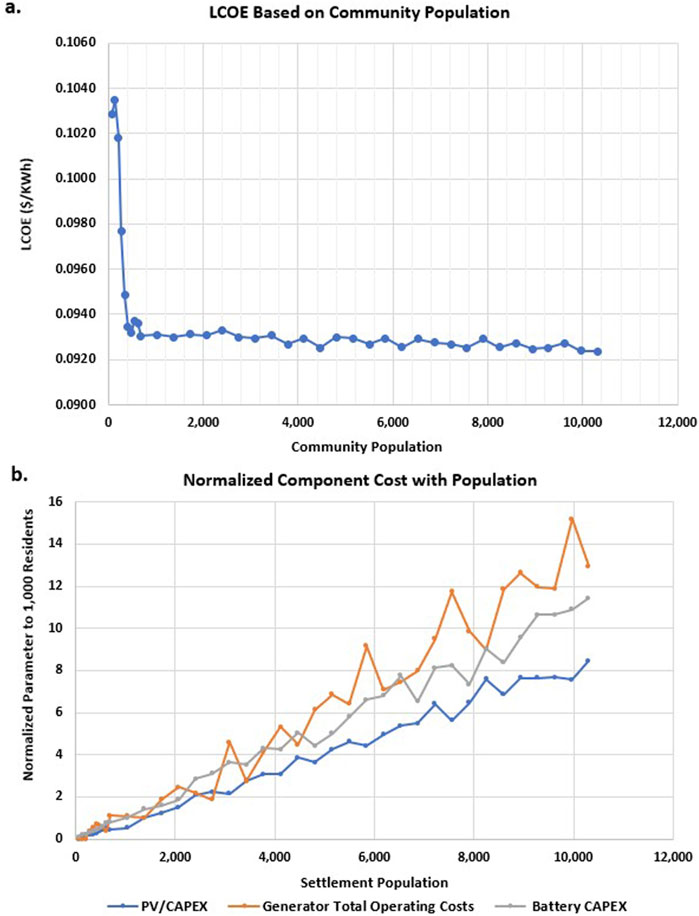
Figure 9. The evolving LCOE of idea system architectures and the relative changes in component costs are shown in parts A and B, respectively.
The sensitivity analysis results in Figure 9 highlight the potential feasibility of microgrid systems for electrification to a wide range of community sizes in remote locations. While noticeable fluctuation in the LCOE was observed for smaller communities, the LCOE of each optimum system architecture quickly settled to a baseline near $0.093 per kWh as community size increased past approximately 450 residents. Complete data produced in this sensitivity analysis can be found in Supplementary Material P8. At no point during this analysis did a system utilizing an MGS module become competitive, though the preferred microgrid architectures trended towards the same PV/battery/Microgen configuration optimum for Kabuiri. This analysis is not meant to thoroughly investigate and develop optimum system architectures for all possible rural communities but effectively provides a quick snapshot of the potential efficacy of the hardware and configurations examined in this study across other communities of various sizes. For more information and a breakdown of the results of this sensitivity analysis, see Supplementary Material P8 and Supplementary Material 2.
4 Conclusion
This study aims to provide a solution to improving energy access in Northern Nigeria by conducting a techno-economic and environmental analysis of community-scale microgrid projects in a primary candidate remote village of Kabuiri in Northeast Nigeria and the applicability of the model for other remote villages in the region. The hybrid microgrid system for the Kabuiri community was designed to meet the community’s electrical load demand while minimizing costs and environmental impacts. The results show that the optimal system architecture for Kabuiri was a PV/battery/generator-based system, providing an estimated 610 kWh of electricity daily with an LCOE of $0.0927 per kWh and an NPV of $266,709. Under 2% annual inflation and an 8% discount rate, the optimal system had an IRR of 142.7% and an SPBT of 0.8 years. The environmental impact assessment revealed that CO2 and CO were the most significant pollutants produced by the system, and they had a massive impact on global warming potential and smog formation.
The sensitivity analysis demonstrated that the optimal system for Kabuiri is highly resilient to fluctuations in diesel prices. The sensitivity results also showed that increased diesel costs significantly reduced overall generator usage and system-wide emissions as the system opted for increased PV capacity. The model indicated that costs and environmental impacts can be mitigated by incorporating more PV capacity and reducing reliance on the generator. This shift towards local renewable energy generation benefits the environment and provides a sustainable, reliable energy solution for remote communities in the region. Furthermore, sensitivity analysis conducted on three other remote communities (Karagawaru, Abodari, and Garuhiza) in the region affirms the model viability for energy generation for similar remote communities in Northern Nigeria. The sensitivity analysis result suggests optimal hybrid architectures for rural communities from 400–4,000 residents. However, rural communities with populations outside the approximate 400–4,000 resident range may benefit from more specially sized microgrid components. More specialized microgrid design and research are needed to produce definitively optimized system architectures for any rural community.
The study demonstrates the potential of microgrids to enhance energy access in remote areas, thereby reducing energy inequality and enhancing the quality of life for underserved communities. It also suggests that investing in renewable energy infrastructure can yield long-term economic and environmental benefits.
Data availability statement
The original contributions presented in the study are included in the article/Supplementary Material, further inquiries can be directed to the corresponding authors.
Author contributions
CL: Data curation, Formal Analysis, Investigation, Visualization, Writing–original draft, Methodology. MI: Conceptualization, Formal Analysis, Investigation, Methodology, Project administration, Software, Visualization, Writing–original draft, Writing–review and editing. RY: Writing–review and editing, Validation. BC: Writing–review and editing, Conceptualization. HC: Writing–review and editing. MC-D: Conceptualization, Resources, Software, Supervision, Validation, Writing–review and editing, Methodology.
Funding
The author(s) declare that no financial support was received for the research, authorship, and/or publication of this article.
Conflict of interest
The authors declare that the research was conducted in the absence of any commercial or financial relationships that could be construed as a potential conflict of interest.
The author(s) declared that they were an editorial board member of Frontiers, at the time of submission. This had no impact on the peer review process and the final decision.
Publisher’s note
All claims expressed in this article are solely those of the authors and do not necessarily represent those of their affiliated organizations, or those of the publisher, the editors and the reviewers. Any product that may be evaluated in this article, or claim that may be made by its manufacturer, is not guaranteed or endorsed by the publisher.
Supplementary material
The Supplementary Material for this article can be found online at: https://www.frontiersin.org/articles/10.3389/fenrg.2024.1454281/full#supplementary-material
References
Adaramola, M. S. (2014). Viability of grid-connected solar PV energy system in Jos, Nigeria. Int. J. Electr. Power Energy Syst. 61, 64–69. doi:10.1016/j.ijepes.2014.03.015
Ajao, K. R., Oladosu, O. A., and Popoola, O. T. (2011). Using homer power optimization software for cost benefit analysis of hybrid-solar power generation relative to utility cost in Nigeria. Available at: www.arpapress.com/Volumes/Vol7Issue1/IJRRAS_7_1_14.pdf.
Ajayi, O. O., Ohijeagbon, O. D., Mercy, O., and Ameh, A. (2016). Potential and econometrics analysis of standalone RE facility for rural community utilization and embedded generation in North-East, Nigeria. Sustain Cities Soc. 21, 66–77. doi:10.1016/j.scs.2016.01.003
Akinsipe, O. C., Moya, D., and Kaparaju, P. (2021). Design and economic analysis of off-grid solar PV system in Jos-Nigeria. J. Clean. Prod. 287 (Mar), 125055. doi:10.1016/j.jclepro.2020.125055
Akpan, U. S., Isihak, S. R., and Udoakah, Y. O. N. (2013). “Electricity access in Nigeria: viability of off-grid photovoltaic system,” in IEEE AFRICON conference (Nigeria: Institute of Electrical and Electronics Engineers Inc.). doi:10.1109/AFRCON.2013.6757778
Aljazeera (2024). Nigerian petrol prices reach record high after subsidy removal | Oil and Gas News. Al Jazeera. Available at: https://www.aljazeera.com/news/2023/7/18/nigerian-petrol-prices-reach-record-high-after-subsidy-removal (Accessed June 19, 2024).
Al-Rawashdeh, H., Al-Khashman, O. A., Al Bdour, J. T., Gomaa, M. R., Rezk, H., Marashli, A., et al. (2023). Performance analysis of a hybrid renewable-energy system for green buildings to improve efficiency and reduce GHG emissions with multiple scenarios. Sustain. Switz. 15 (9), 7529. doi:10.3390/su15097529
Babatunde, O. M., Ayegbusi, C. O., Babatunde, D. E., Oluseyi, P. O., and Somefun, T. E. (2020). Electricity supply in Nigeria: cost comparison between grid power tariff and fossil-powered generator. Int. J. Energy Econ. Policy 10 (2), 160–164. doi:10.32479/ijeep.8590
Birol, F. (2024). Technology perspectives energy special report on clean energy innovation accelerating technology progress for a sustainable future energy technology perspectives foreword special report on clean energy innovation acknowledgements special report on clean energy innovation.
BLS (2024). Before the nigerian electricity regulatory commission in the matter of june 2024 supplementary order to the multi-year tariff order 2024 for yola electricity distribution plc. Available at: http://www.bls.qov.
Duffie, J. A., Beckman, W. A., and Blair, N. (2024). Solar engineering of thermal processes, photovoltaics and wind.
Eze, F., Ogola, J., Kivindu, R., Egbo, M., and Obi, C. (2022). Technical and economic feasibility assessment of hybrid renewable energy system at Kenyan institutional building: a case study. Sustain. Energy Technol. Assessments 51 (Jun), 101939. doi:10.1016/j.seta.2021.101939
Homer energy (2023a). Generator average total EfficiencyBack ButtonSearch IconFilter icon. Available at: https://www.homerenergy.com/products/pro/docs/3.11/generator_average_total_efficiency.html (Accessed December 19, 2023).
Homer energy (2023b). Levelized cost of energy back button search icon filter icon. Available at: https://www.homerenergy.com/products/pro/docs/3.11/levelized_cost_of_energy.html (Accessed December 19, 2023).
Homer energy (2023c). Net present cost - HOMER. Available at: https://www.homerenergy.com/products/pro/docs/3.11/net_present_cost.html (Accessed December 19, 2023).
Ijeoma, M. W., Chen, H., Carbajales-Dale, M., and Yakubu, R. O. (2023a). Techno-economic assessment of the viability of commercial solar PV system in Port Harcourt, rivers state, Nigeria. Energies (Basel) 16 (19), 6803. doi:10.3390/en16196803
Ijeoma, M. W., Chen, H., Carbajales-Dale, M., and Yakubu, R. O. (2023b). Techno-economic assessment of the viability of commercial solar PV system in Port Harcourt, rivers state, Nigeria. Energies (Basel) 16 (19), 6803. doi:10.3390/en16196803
Ijeoma, M. W., Lewis, C. G., Chen, H., Chukwu, B. N., and Carbajales-Dale, M. (2024a). Technical, economic, and environmental feasibility assessment of solar-battery-generator hybrid energy systems: a case study in Nigeria. Front. Energy Res. 12. doi:10.3389/fenrg.2024.1397037
Ijeoma, M. W., Lewis, C. G., Chen, H., Chukwu, B. N., and Carbajales-Dale, M. (2024b). Technical, economic, and environmental feasibility assessment of solar-battery-generator hybrid energy systems: a case study in Nigeria. Front. Energy Res. 12. doi:10.3389/fenrg.2024.1397037
International Trade Administration (2023). Electricity. Power systems and renewable energy. Available at: https://www.trade.gov/country-commercial-guides/electricity-power-systems-and-renewable-energy (Accessed July 28, 2023).
Joseph, A., and Shahidehpour, M. (2006). “Battery storage systems in electric power systems,” in 2006 IEEE power engineering society general meeting, PES (IEEE Computer Society). doi:10.1109/pes.2006.1709235
Kosmadakis, I. E., and Elmasides, C. (2021). A sizing method for PV–battery–generator systems for off-grid applications based on the LCOE. Energies (Basel) 14 (7), 1988. doi:10.3390/en14071988
KPMG (2024). removing-nigerias-pms-fuel-subsidies - KPMG Nigeria. Available at: https://kpmg.com/ng/en/home/insights/2023/06/removing-nigeria-pms-fuel-subsidies.html (Accessed June 19, 2024).
Mathew, M., Hossain, M. S., Saha, S., Mondal, S., and Haque, M. E. (2022). Sizing approaches for solar photovoltaic-based microgrids: a comprehensive review. John Wiley and Sons Inc. doi:10.1049/esi2.12048
Meier, P., Tuntivate, V., Barnes, D. F., V Bogach, S., and Farchy, D. (2024). Energy sector management assistance program Peru: national Survey of rural household energy use energy and poverty special report.
Modu, B., Aliyu, A. K., Bukar, A. L., Abdulkadir, M., Gwoma, Z. M., and Mustapha, M. (2018). Techno-economic analysis of off-grid hybrid pv-diesel-battery system in katsina state, Nigeria. Available at: www.azojete.com.ng.
Momoh, Z., Anuga, J. A., and Obidi, A. J. (2018). Implications of poor electricity supply on Nigeria’s national development. Humanit. Soc. Sci. Lett. 6 (2), 31–40. doi:10.18488/journal.73.2018.62.31.40
Monetary Credit (2024). Foreign trade and exchange policy guidelines for fiscal years 2022/2023 central bank of Nigeria.
Monokroussos, C., Gao, Q., Zhang, X., Lee, E., Wang, Y., Zou, C., et al. (2020). Rear-side spectral irradiance at 1 sun and application to bifacial module power rating. Prog. Photovoltaics Res. Appl. 28 (8), 755–766. doi:10.1002/pip.3268
NASA (2023). NASA power | prediction of Worldwide energy resources. Available at: https://power.larc.nasa.gov/ (Accessed May 07, 2023).
Ndukwe, C., and Iqbal, T. (2019). Sizing and dynamic modelling and simulation of a standalone PV based DC microgrid with battery storage system for a remote community in Nigeria. J. Energy Syst. 3 (2), 67–85. doi:10.30521/jes.544710
Nigeria (2024). Removal of fuel subsidy must not exacerbate poverty - amnesty International. Available at: https://www.amnesty.org/en/latest/news/2023/06/nigeria-remove-fuel-subsidy-exacerbate-po/ (Accessed June 19, 2024).
The World Bank Working for a World Free of Poverty (2018). Nigeria living standards Survey A Survey report by the Nigerian national bureau of statistics (in collaboration with the world bank) section IV: employment and remittances.
Odou, O. D. T., Bhandari, R., and Adamou, R. (2020a). Hybrid off-grid renewable power system for sustainable rural electrification in Benin. Renew. Energy 145, 1266–1279. doi:10.1016/j.renene.2019.06.032
Odou, O. D. T., Bhandari, R., and Adamou, R. (2020b). Hybrid off-grid renewable power system for sustainable rural electrification in Benin. Renew. Energy 145, 1266–1279. doi:10.1016/j.renene.2019.06.032
Okoye, C. O., and Oranekwu-Okoye, B. C. (2018). Economic feasibility of solar PV system for rural electrification in Sub-Sahara Africa. Elsevier Ltd. doi:10.1016/j.rser.2017.09.054
Oladeji, A. S., Balogun, O. S., and Aliyu, S. O. (2018). Use of standalone photovoltaic system for office building: the case study of national centre for hydropower research and development, Nigeria. Niger. J. Technol. 36 (4), 1208. doi:10.4314/njt.v36i4.30
Olatomiwa, L., Blanchard, R., Mekhilef, S., and Akinyele, D. (2018). Hybrid renewable energy supply for rural healthcare facilities: an approach to quality healthcare delivery. Sustain. Energy Technol. Assessments 30, 121–138. doi:10.1016/j.seta.2018.09.007
Olatomiwa, L., Mekhilef, S., Huda, A. S. N., and Ohunakin, O. S. (2015). Economic evaluation of hybrid energy systems for rural electrification in six geo-political zones of Nigeria. Renew. Energy 83, 435–446. doi:10.1016/j.renene.2015.04.057
Sun Connect News (2024). Impact of fuel subsidy removal in Nigeria - sun Connect news. Available at: https://sun-connect.org/impact-of-fuel-subsidy-removal-in-nigeria/(AccessedJune 19, 2024).
Tanu, M., Amponsah, W., Yahaya, B., Bessah, E., Ansah, S. O., Wemegah, C. S., et al. (2021). Evaluation of global solar radiation, cloudiness index and sky view factor as potential indicators of Ghana’s solar energy resource. Sci. Afr. 14, e01061. doi:10.1016/j.sciaf.2021.e01061
Tijani, H. O., Wei Tan, C., and Bashir, N. (2014a). Techno-economic analysis of hybrid photovoltaic/diesel/battery off-grid system in northern Nigeria. J. Renew. Sustain. Energy 6 (3), 033103. doi:10.1063/1.4873122
Tijani, H. O., Wei Tan, C., and Bashir, N. (2014b). Techno-economic analysis of hybrid photovoltaic/diesel/battery off-grid system in northern Nigeria. J. Renew. Sustain. Energy 6 (3), 033103. doi:10.1063/1.4873122
UNSDG (2024). Energy access and affordability: powering ahead to 2030. Available at: https://unsdg.un.org/latest/stories/energy-access-and-affordability-powering-ahead-2030 (Accessed June 16, 2024).
USAID (2023). Power Africa in Nigeria | power Africa. Washington DC, United States: U.S. Agency for International Development. Available at: https://www.usaid.gov/powerafrica/nigeria (Accessed July 28, 2023).
Victronenergy (2024). SmartSolar MPPT RS 450|100 and 450|200-isolated inside the SmartSolar MPPT RS 450|100 SmartSolar MPPT RS 450|100. Available at: www.victronenergy.com.
Keywords: hybrid micro-grid systems design, life cycle cost, levelized cost of electricity, net present value, financial mechanism, energy access, remote locations, environmental assessment
Citation: Lewis CG, Ijeoma MW, Yakubu RO, Chukwu BN, Chen H and Carbajales-Dale M (2024) Achieving universal energy access in remote locations using HOMER energy model: a techno-economic and environmental analysis of hybrid microgrid systems for rural electrification in northeast Nigeria. Front. Energy Res. 12:1454281. doi: 10.3389/fenrg.2024.1454281
Received: 24 June 2024; Accepted: 14 October 2024;
Published: 29 October 2024.
Edited by:
Yi Jin, Jiangsu University, ChinaReviewed by:
Olanrewaju Oyewola, Fiji National University, FijiMobi Mathew, Rajiv Gandhi Institute of Petroleum Technology, India
Copyright © 2024 Lewis, Ijeoma, Yakubu, Chukwu, Chen and Carbajales-Dale. This is an open-access article distributed under the terms of the Creative Commons Attribution License (CC BY). The use, distribution or reproduction in other forums is permitted, provided the original author(s) and the copyright owner(s) are credited and that the original publication in this journal is cited, in accordance with accepted academic practice. No use, distribution or reproduction is permitted which does not comply with these terms.
*Correspondence: Muzan Williams Ijeoma, bWlqZW9tYUBjbGVtc29uLmVkdQ==; Michael Carbajales-Dale, bWRhbGVAY2xlbXNvbi5lZHU=
†These authors have contributed equally to this work and share first authorship
 Christopher Garrett Lewis
 Muzan Williams Ijeoma
 Rahimat Oyiza Yakubu
 Benjamin Nnamdi Chukwu
 Hao Chen
 Michael Carbajales-Dale