 Jianlin Tang
 Yanhong Xiao2
- 1CSG Electric Power Research Institute, Guangzhou, Guangdong, China
- 2Guizhou Power Grid Co., Ltd., Guiyang, China
The operation effects of a source-side carbon capture power plant (CCPP) and power-to-gas (P2G) equipment do not match. The response range of the load-side traditional demand response strategy is small, and the adjustment period is limited, which leads to the problem that the complementary potential of low-carbon characteristics on both sides of the source and load is not fully utilized. This article proposes an electricity–heat coupling system scheduling strategy considering the complementary low-carbon characteristics of “source-load.” First, the low-carbon operation characteristics of CCPP and P2G with integrated, flexible operations are analyzed, and a source-side CCPP-P2G comprehensive flexible operation mode is proposed. Second, based on the characteristics of flexible adjustment and mutual substitution of electricity and heat load, a load-side comprehensive demand response method is proposed. Finally, the complementary mechanism of low-carbon characteristics on both sides of the source and load is analyzed, and a low-carbon economic dispatch model of the electricity–heat coupling system is constructed to realize the source–load collaborative low-carbon operations. The simulation analysis verifies that the proposed strategy can give full play to the energy time shift advantages of the source-side CCPP and P2G and improve the economic and environmental benefits of the system operations.
1 Introduction
Under the background of the dual-carbon target, the energy and power industry, as the main source of global carbon emissions, urgently needs to explore new ways of clean and low-carbon development (Ji et al., 2013; Han et al., 2020). Developing low-carbon power technology is the core means to directly reduce carbon emissions in new power systems (Cheng et al., 2020; Zheng et al., 2022; Li et al., 2024). At present, thermal power generation still occupies a dominant position in China’s energy structure. Therefore, the low-carbon transformation of the source-side units and the demand response strategy of the load side are important ways to realize the low-carbon operations of the integrated energy system and the key measures to realize the popularization and application of the integrated energy system (Liao et al., 2024).
Carbon capture, utilization and storage, and P2G technology are important ways to promote low-carbon transformation on the source side (Wu et al., 2023; Abdilahi et al., 2018). Traditional coal-fired and gas-fired power plants are transformed into carbon capture power plants by means of carbon capture and storage technology, which can equip them with good flexible operation characteristics (Zhang et al., 2023; Lu et al., 2013). It can also effectively promote renewable energy consumption while achieving large-scale and high-efficiency reductions in carbon emissions (Ding et al., 2022). Currently, the installed carbon capture system mainly balances the unit emission reduction and load supply output by adjusting the split-flow operation of the proportion of direct exhaust gas and the liquid storage operation of decoupling the exhaust gas capture and precipitation process. However, the former is prone to conflict between load demand and carbon capture demand, and the latter cannot actively emit CO2 according to demand, resulting in poor scheduling flexibility. By installing solution storage to form a comprehensive flexible CCPP operations mode, the processes of absorption and CO2 capture can be decoupled from each other so that the total amount of CO2 to be resolved can be adjusted from time to time under the operating conditions of the unit and the load demand of the system. This would effectively expand the net output range of the unit, significantly improve the dispatching capability of the unit, and realize the energy time-shift of the captured power (Lei et al., 2023). Cui et al. (2021a) compared and analyzed the effect of integrated flexible and fixed operations of CCPPs. It proved that the integrated, flexible operation method could significantly reduce the system operating cost and carbon emissions. Tan et al. (2022) constructed a synergistic operation model of wind turbines and a CCPP that further exploited the potential of joint operations of a CCPP and renewable energy sources.
Coupling the carbon capture system with the P2G system, using the captured and precipitated CO2 as the carbon source required in the power-to-gas conversion reaction process, and using the renewable energy source to provide the main electric energy for the operation of the electric-to-gas conversion system (Zhang et al., 2020) can improve the consumption of renewable energy and realize the recycling of carbon resources (Siqin et al., 2022). Yan et al. (2021) constructed a two-stage refinement model for P2G that contributes to the system’s response to the green-certificate-carbon-trading mechanism through joint operation. Ma et al. (2021) considered the operating characteristics of cogeneration units retrofitted with carbon capture equipment and constructed a low-carbon scheduling method for cooperative operation with the P2G system. It realized the recycling of carbon and reduced the system’s energy cost. In the coupling relationship between a CCPP and a P2G, carbon storage equipment plays a key role in solving the problem of asynchronous operations between them. Lu et al. 2023) embodied a carbon recycling module with a carbon storage device that can store part of the CO2 generated by the unit when the renewable energy output is low, thus realizing the low-carbon scheduling of a virtual power plant.
Although improving the operating efficiency of low-carbon equipment such as CCPP and P2G on the source side can effectively reduce the power system’s emissions, the early realization of the “dual-carbon” goal still requires the assistance of low-carbon reforms on the energy consumption side (Zhang et al., 2024). Demand response as a flexible resource on the load side has a larger scheduling potential at the low-carbon level. Demand response can guide all types of energy consumers to optimize their energy use periods and strategies by adjusting price signals or incentives, maximizing their subjective initiative in the interests of users, and assisting in the safe, efficient, low-carbon, and clean operation of the power system. For example, the demand response on the load side can reduce the peak load, alleviate the net output pressure of the load of the CCPP, and improve the CCPP’s ability to provide the upper spinning reserve. Zhao et al. (2022) established a virtual power plant optimal scheduling model considering carbon capture and demand response and assisted the CCPP in adjusting its supply load power and capture power by guiding the electric load to participate in the demand response. The strategy can facilitate the operation of the carbon capture system while meeting the load demand. Zhou and Zheng (2022) introduced the in-system integrated demand response for electricity and heat, analyzed the complementary dispatch value of multiple loads, and further explored the low carbon and economy of system operations.
The above analyses indicate that source-side CCPP, P2G systems, and load-side demand response strategies are all effective means of low carbon. In a system with complementary characteristics, either the source side or the load side can play a role in reducing carbon emissions when the other side is not able to support the low-carbon operation of the whole system by itself. They are the core of improving the operational efficiency of the system, reducing carbon emissions, and increasing the new energy consumption rate. Existing studies have three problems: First, most existing studies directly connect the P2G with the carbon capture system, ignoring the existence of operating time and space inequality and mismatch of the operation effect between the two. These studies lack in-depth research on their synergistic operation mode, which leads to the low utilization rate of carbon resources. Second, current research has considered the potential dispatchability of multiple flexible loads, but the traditional demand response strategy has a small response range and limited regulation period and does not fully explore the flexible substitution potential among multiple loads. The low-carbon performance of the load side of the system needs to be further improved. Third, few studies deeply analyze the problems and limitations of the synergistic low-carbon dispatch between demand response resources on the load side and the source side of the CCPP and P2G, failing to clarify the complementarity of the source-load cooperation. Therefore, it is necessary to study the synergistic operation of the carbon capture system and the P2G system, combined with the integrated demand response strategy for multiple loads on the load side, to realize the complementary relationship between the source and the load, to explore the low-carbon potential in-depth, and to further improve the economy and low-carbon performance of electricity–heat coupling system operations.
In summary, this article studies electricity–heat coupling system scheduling strategies that consider complementary source–load low-carbon characteristics. The main contributions of this article follow.
(1) The flexible and synergistic operation of a CCPP-P2G system can significantly reduce the total cost of system operations as well as carbon emissions and fully utilize the energy time shift advantages of both systems.
(2) Compared with source-side optimization only, the total system cost is reduced by 0.22%, and the carbon emissions are reduced by 17.47% after considering the integrated demand response. It is proved that the integrated demand response approach can provide the mutual benefit effect of electricity and heat loads based on the reasonable adjustment of the peak and valley differences.
(3) Considering the comprehensive flexible operation of the CCPP-P2G system and the integrated demand response characteristics of the electric and thermal loads, the potential of the electricity–heat coupling system’s source–load synergistic low-carbon effect can be fully exploited, and the renewable energy sources can be efficiently utilized to improve the economy and low-carbon nature of the electricity-heat coupling system.
The rest of the article is organized as follows. Section 2 constructs a low-carbon economic operating mode on the source side of the electricity–heat coupling system. Section 3 constructs a low-carbon economic operating mode on the load side of the electricity–heat coupling system. Section 4 proposes a low-carbon economic dispatch model of the electricity–heat coupling system based on the complementary mechanism of the source–load low-carbon characteristics. Section 5 analyzes the reasonableness and effectiveness of the model through simulation comparison. Section 5 concludes the article.
2 Source-side low-carbon economic operation method
2.1 Comprehensive flexible operation method model for carbon capture power plants
The comprehensive flexible operation mode of CCPPs combines the advantages of multiple flexible operation modes. In addition to the active and controllable capture level, its energy consumption time-shift characteristic can greatly relieve the down-peaking and standby pressure of the unit, which can help solve the problem of intermittent power output from the wind. It is one of the ideal power sources for cooperating with renewable energy. The comprehensive flexible operation mode of the CCPP is shown in Figure 1. The comprehensively flexible operation method model for carbon capture power plants is shown in Equations 1–9:
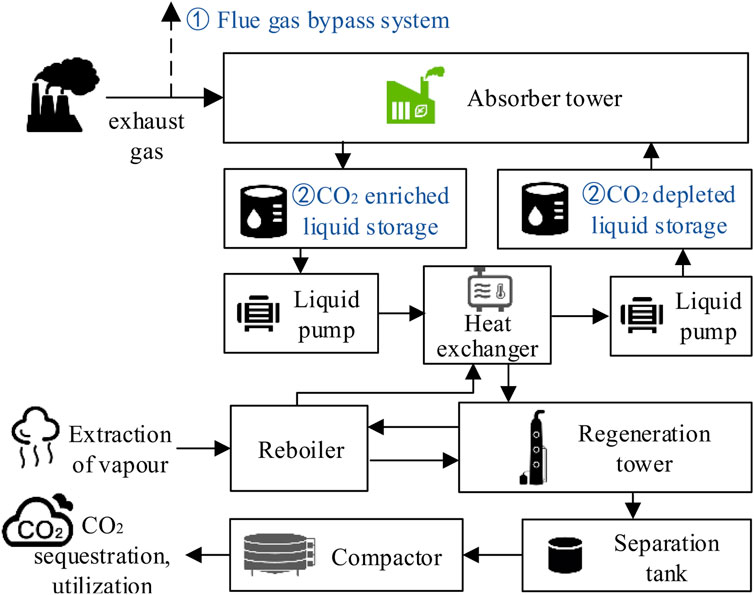
Figure 1. Comprehensive flexible operation of CCPPs.
The CO2 emissions of the CCPP i
where
where
The CO2 in the liquid storage is stored in the alcohol amine solution in the form of a compound, and the volume of CO2 absorbed by the liquid is as follows:
where
To ensure that the CO2 absorbed on that day is fully resolved and utilized, the liquid storage model is contrasted as follows:
where
The carbon capture energy consumption
where
The output power of the unit with a carbon capture system is mainly composed of load power and capture power. Therefore, the total output power
where
Therefore, the adjustable boundary of unit i capture power is
The load power boundary of the CCPP based on comprehensive flexible operation is as follows:
The load power boundary of the CCPP based on split-flow operation is as follows:
As shown in Figure 2, the comprehensive flexible operation mode of CCPPs can reduce the conflict between users’ electricity consumption and carbon capture demand and increase the amount of carbon capture by transferring the analytical demand of CO2 absorbed during load peak to load valley. At the same time, this method can adjust the flue gas absorption level of the unit according to the operation of the electricity–heat coupling system and improve the operational economy of the unit.
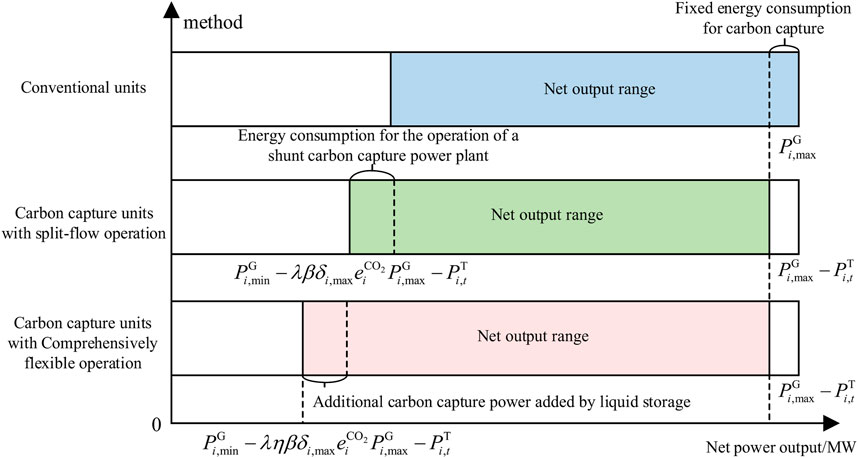
Figure 2. Comparison of load supply power boundaries of different CCPP operating modes.
In summary, the carbon capture power plant, under the comprehensive flexible operation mode, can transfer the captured CO2 processing output during a high-load demand period to a low-load demand period and realize the time shift of the captured power energy. It is conducive to improving the consumption level of renewable energy, assists with peak shaving and valley filling, and reduces the carbon emissions of the electricity–heat coupling system.
2.2 Modeling and characterization of the CCPP-P2G flexible operation mode
Carbon capture power plants based on comprehensive flexible operations also emit CO2 when working, and the P2G system can improve the economic benefits of the system by increasing the operating power at the peak of new energy output. In addition, if the P2G system realizes the complete conversion of CO2 precipitation during this period and there is still room for improvement in operating power, it is necessary to purchase carbon sources from outside, but high raw material costs will inhibit its wind curtailment level. To solve the problems of unequal operating time and space and mismatched operation effect and improve the operational flexibility of the CCPP-P2G system, it is necessary to further study the operation strategy of a coupled CCPP-P2G system.
In this article, carbon storage equipment is added between the two to establish a CCPP-P2G flexible operation mode, which ensures a sufficient carbon source to synthesize methane for gas turbine recycling during P2G operations in the peak hours of renewable energy output.
As shown in Figure 3, when the wind power output is low, the CCPP-P2G flexible operation mode can reduce the power of CO2 conversion in the P2G system, and the carbon capture system will be separated out. The CO2 that should be converted at the same time is stored in the carbon storage device without the need to dispatch the unit output power supply to convert it into methane. At the peak of wind power output, the CCPP-P2G flexible operation mode can fully use the remaining wind power for CO2 conversion and ensure that the carbon source required for P2G operations is sufficient. This method is equivalent to using zero-carbon and low-cost renewable energy to realize the carbon cycle and dynamic utilization of carbon and to promote the P2G system to better adjust the operating power with the fluctuation of wind power output to improve the consumption level of renewable energy in the system.
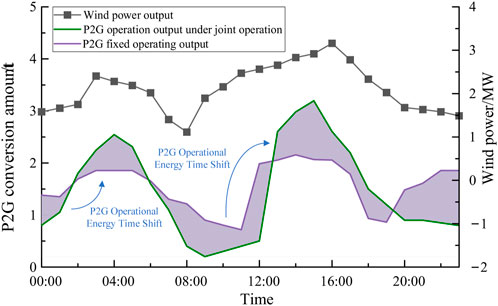
Figure 3. Comparison of different operating modes of the P2G system.
Carbon storage equipment is an important part of the flexible operation mode of CCPP-P2G. The model of carbon storage equipment is shown in Equation 10:
where
The power consumed by P2G equipment to produce natural gas is shown in Equation 11:
where
Correspondingly, the amount of CO2
where
In summary, the captured CO2 is compressed and stored, which can reduce the operating cost of the system through carbon trading and also provide carbon to be recycled by P2G equipment for gas turbines, while improving the low-carbon level and economic benefits of the electricity–heat coupling system.
3 Load-side low-carbon economic operation method
In the previous section, the flexible operation mode of CCPP-P2G is established, but it is limited to implementing low-carbon scheduling only on the source side. By combining the comprehensive demand response of the multi-load on the load side with the complementary resources on both the source and load sides, the low-carbon potential of the electricity–heat coupling system can be further released.
3.1 Load characteristic analysis and demand response mechanism
At present, the traditional power demand response has developed into a comprehensive demand response that integrates multiple energy types. Users in the electricity–heat coupling system can convert energy supply means to meet the same needs through air conditioners, electric water heaters, and other equipment. The loads participating in the response in the electricity–heat coupling system can be divided into two categories.
(1) Price-based demand response load uses only one kind of energy. The energy consumption time is adjusted, or the energy consumption demand is reduced, mainly via transferable or reduced loads, depending on the energy price at the time.
(2) Alternative demand response loads can use various forms of energy to achieve the same demand by comparing energy prices and optimizing energy selection to meet the load demand. In the same period, the total energy demand of users is fixed, but the type of energy used can be changed.
3.2 Model of the load-side integrated demand response mode
The demand response model of the electricity and heat load is shown in Equation 13:
where
(1) Price-based demand response model:
The price-based demand response formulates the energy time-sharing price according to the load curve, guides the user to improve the energy use strategy, and achieves peak shaving and valley filling.
This article analyzes the time-sharing electricity and heat prices based on the current pilot peak-valley average three-period time-sharing electricity and heat prices in China and uses the price elasticity matrix to characterize the changes in a load before and after demand response:
where
The transferable load optimizes the energy utilization strategy by comparing the time-sharing electricity/heat price. From Equation 14, the transferable load
where
The load that can be reduced,
where
(2) Alternative demand response model:
By comparing the prices of various types of energy in the electricity–heat coupling system during the same period, the alternative demand response considers various factors, such as the operation of the equipment in the system, and spontaneously and flexibly adjusts the form of energy use.
In the electricity–heat coupling system, the mutual conversion between the electric load and the heat load obeys the law of conservation of energy, and the alternative demand response model can be obtained by the calorific value equivalent method in Equations 17, 18:
where
Among them, the power and heat load conversion amounts satisfy the following constraints in Equation 19:
where
4 Low-carbon economic operation strategy of the electricity–heat coupling system
4.1 Analysis of complementary mechanism of source–load low-carbon characteristics
The flexible operation method of the source-side CCS-P2G system and the load-side integrated demand response strategy are both effective ways to improve the low-carbon performance and economy of the electricity–heat integrated energy system. Therefore, this chapter considers the synergy between the source-side low-carbon operations mechanism and the load-side comprehensive demand response and establishes a low-carbon economic dispatch model of the electricity–heat coupling system considering the complementary low-carbon characteristics of source–load to further improve the economic and environmental benefits of the integrated energy system.
The electricity–heat coupling system constructed in this article is shown in Figure 4. The source side of the electricity–heat coupling system includes coal-fired units, natural gas-source cogeneration units, and wind turbines. Among them, the traditional coal-fired and gas-fired units can be transformed into CCPPs to capture and analyze the CO2 emitted by the unit by being equipped with carbon capture equipment. At the same time, the carbon storage equipment plays a role as the hub to connect the carbon capture and P2G, and the CO2 stored after analysis is used to generate methane to supply the gas unit for recycling.
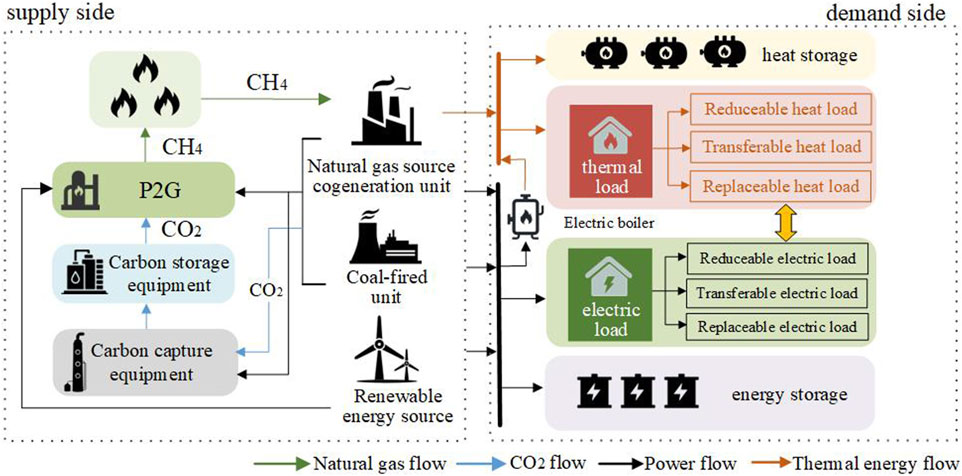
Figure 4. Integrated energy system model with CCS, P2G, and various types of demand response.
The load side assists the low-carbon economic operation of the source side by coordinating various demand response resources, including 1) multiple energy storage devices such as power storage, heat storage, and carbon storage devices, and 2) traditional electric and heat loads and flexible loads, including electric vehicle load, air conditioning, and electric water heater.
The first two sections of this article demonstrate that the flexible operation method of the source-side CCPP-P2G and the load-side comprehensive demand response strategy are both effective ways to improve the low carbon and economy of electricity–heat coupling system scheduling. Demand response can effectively expand the operational advantages of the CCPP-P2G with flexible operations on the source side. First, due to the different carbon emission levels of CCPPs, during the peak electric load period, the integrated demand response of electricity and heat can transfer from the peak period to the valley period or convert the electric demand to heat demand, alleviating the net output pressure of high-emission units, promoting the low-carbon units of the system to increase the output level, and directly reducing the carbon emissions. Second, demand response can improve the utilization efficiency of renewable energy in the system and help reduce the construction cost of solution storage and carbon storage equipment and the cost of solution loss.
In summary, this article considers the synergy between the source-side and the load-side and establishes a low-carbon economic model of electricity–heat coupling system considering the complementary low-carbon characteristics of source–load to further improve the economic and environmental benefits of the electricity–heat coupling system.
4.2 Modeling of the low-carbon economic operation mode of an electricity–heat coupling system
Based on the low-carbon economic operation mode of an electricity–heat coupling system source and load, this section takes the optimal system cost as the objective function and constructs a low-carbon economic dispatch model of an electricity–heat coupling system considering source–load mutual assistance in Equation 20:
where
Among them, the costs are shown in Equations 21–32:
(1) Operating cost of the thermal power unit.
The operating cost
where
(2) Operating cost of the combined heat and power (CHP) unit.
where
(3) Carbon transaction costs.
where
The trading volume that can participate in the carbon trading market at time t of the electricity–heat coupling system is
where
It can be obtained that the carbon transaction cost
where
(4) Electricity–heat coupling system wind curtailment penalty cost.
The wind abandonment penalty
where
(5) Solvent depletion costs.
The cost of solvent depletion
where
(6) Electricity and heat load demand response costs.
where
(7) Cost of carbon storage equipment.
The cost of carbon storage equipment
where
(8) Electricity transaction costs.
The cost of purchasing power
where
The system constraints are shown in Equations 33–47:
(1) Electrical and thermal power balance constraints:
where
(2) Gas volume balance constraints:
where K is the number of P2G devices.
(3) Wind power output constraints:
(4) Thermal unit constraints:
Thermal unit output constraints are
Thermal unit climb constraints are
where
(5) Natural gas-source cogeneration unit constraints:
The power of the gas-fired units during time t is shown below, taking into account the constraint that the power of the cogeneration units must be determined by “heat to power:”
where
The cogeneration unit output constraint is
The climbing constraint is
where
(6) Electric boiler constraints:
The heating power
where
(7) Carbon storage equipment constraints:
Carbon storage equipment must meet carbon storage capacity constraints:
where
(8) Energy storage device constraints:
Energy storage devices must satisfy charging and discharging constraints and capacity constraints:
where
5 Case analysis
5.1 Parameter setting
In this article, 24 h is used as a scheduling cycle. The details of electricity, heat loads, and wind power output are shown in Supplementary Appendix Figure SA in Supplementary Appendix SA (Wu et al., 2022). The price demand elasticity matrix is shown in Supplementary Appendix Table SA in Supplementary Appendix SA (Cui et al., 2021b). The parameters of thermal power units are shown in Supplementary Appendix Table SB in Supplementary Appendix SA (Cui et al., 2021b). The parameters of natural gas-sourced electricity–heat-coupled units are shown in Supplementary Appendix Table SC in Supplementary Appendix SA (Wu et al., 2022). The parameters of carbon capture and P2G equipment are shown in Supplementary Appendix Table SD in Supplementary Appendix SA (Cui et al., 2021b). The nonlinear terms included in the model developed in this article are transformed into linear form by the big-M method and are solved optimally using CPLEX.
The scheduling results in the following five scenarios are compared and analyzed to compare and verify the effectiveness of the source–load low-carbon strategy proposed in this article.
(1) No demand-side response, no restriction on flue gas split ratio, carbon capture system based on split-flow operations, and a P2G system based on fixed operations;
(2) No demand-side response, no limit on flue gas diversion ratio, a carbon capture system based on integrated flexible mode operations, and a P2G system based on fixed operations;
(3) No demand-side response, set the limit value of flue gas diversion ratio to 0.8, a carbon capture system based on diversion type operations, and a P2G system based on flexible operations;
(4) No demand-side response, no restriction on the flue gas split ratio, carbon capture, and a P2G system operating flexibly.
(5) Comprehensive demand response strategy, no restriction on flue gas diversion ratio, carbon capture, and a synergistic and flexible P2G system
5.2 Economic analysis of system operation considering the complementary low-carbon characteristics of source-load
The scheduling results of the five scenarios are shown in Table 1, and the detailed scheduling results for each scenario are shown in Figures 5–9 and Supplementary Appendix Figure SB1 in Supplementary Appendix SB.
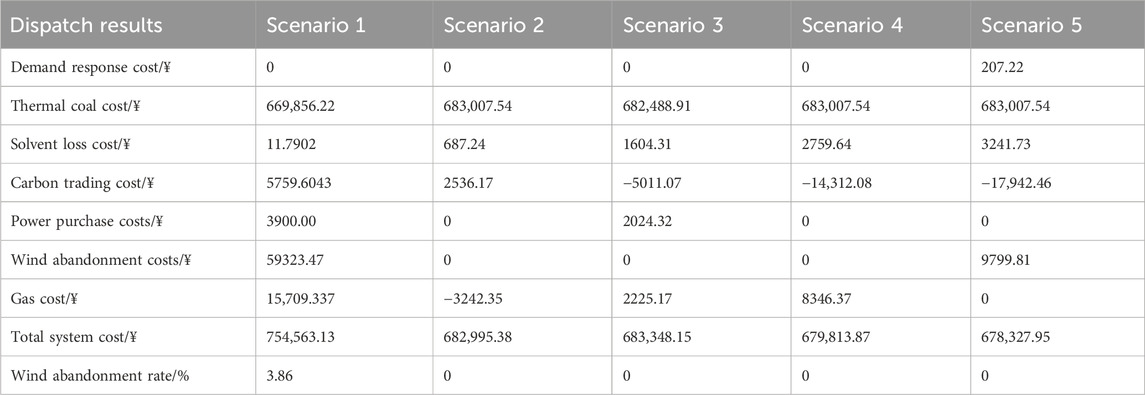
Table 1. Economic comparison of operations in Scenarios 1–5.
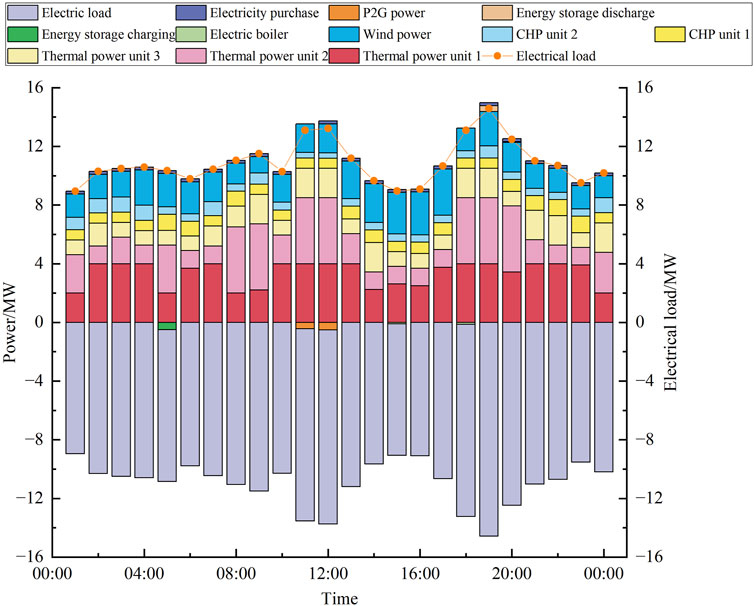
Figure 5. Optimized scheduling results of Scenario 1.
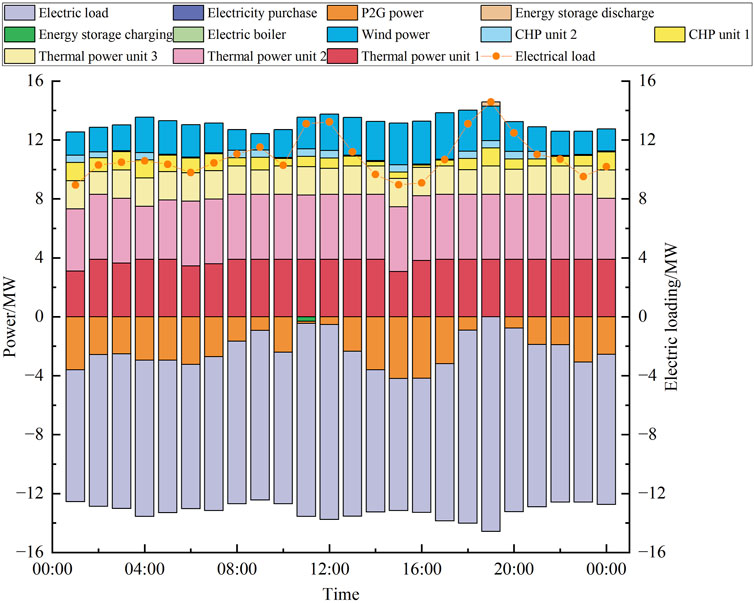
Figure 6. Optimized scheduling results of Scenario 2.
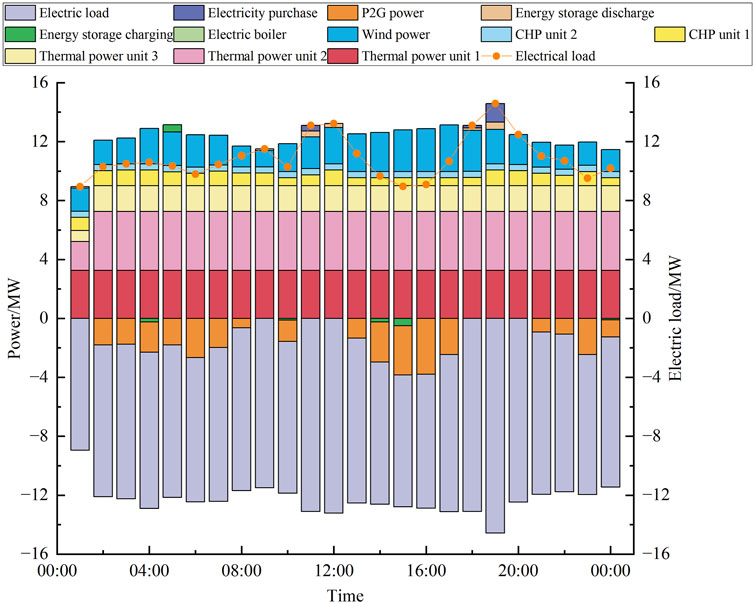
Figure 7. Optimized scheduling results of Scenario 3.
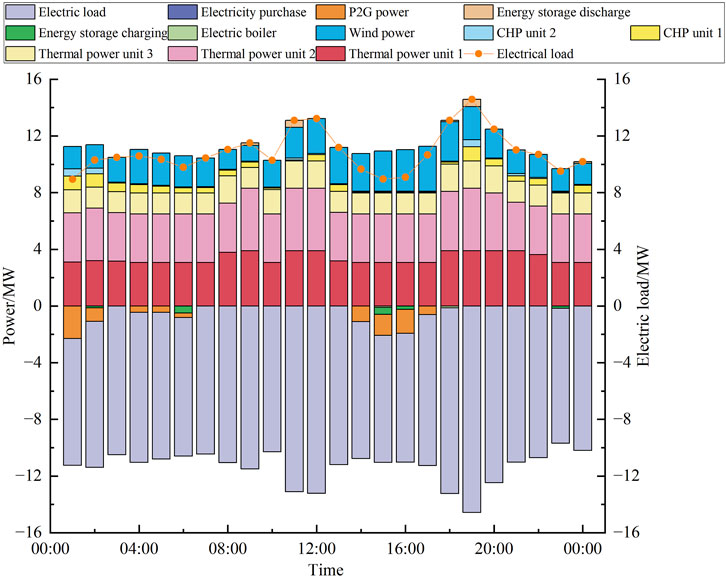
Figure 8. Optimized scheduling results of Scenario 4.
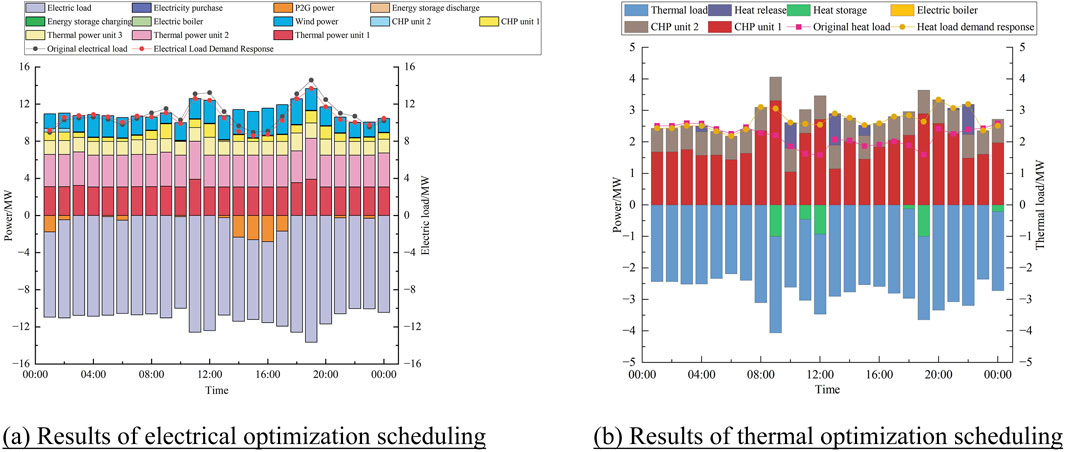
Figure 9. Optimized scheduling results of Scenario 5. (A) Results of electrical optimization scheduling and (B) results of thermal optimization scheduling.
Combining Table 1 and Figure 5 shows that when the carbon capture system and the P2G system are operated in a fixed mode, each unit on the source side of the electricity–heat coupling system has the worst regulating ability, the system has serious wind abandonment, and it is necessary to purchase electricity from outside to meet the load demand at some times. In addition, the units with carbon capture systems have the worst low-carbon performance and the lowest level of system carbon reduction. As most of the exhaust gas is discharged into the atmosphere, it is not converted to P2G for use by the gas-fired units, resulting in low CO2 utilization efficiency, which in turn leads to the high cost of purchased gas for the system. Compared to the other scenarios, Scenario 1 has the highest total system operating cost and the worst low-carbon effect.
Combining Table 1 and Figure 6 shows that the fixed operation of P2G in Scenario 2 realizes the conversion of all the captured CO2, so this operation mode has the highest utilization efficiency of CO2, the most amount of methane produced by the conversion, and the lowest cost of gas required by the system. However, due to the high power consumption of the P2G system, the CCPP needs to pump out part of the carbon capture power to supply power to the P2G system, resulting in less CO2 capture in the system. The reduction of carbon emissions of the electricity–heat coupling system is still poor.
Combining Table 1 and Figure 7 shows that compared with Scenario 1, the flexible operation of the P2G system in Scenario 3 can utilize the energy time-shift characteristic to operate at the time of low load valley and wind power peak, which reduces the pressure of the unit to supply the P2G operations. Therefore, the flexibility of the unit is improved, and it can put out more power to capture and convert the emitted CO2, and the level of carbon emissions in Scenario 3 is significantly reduced compared with Scenarios 1 and 2. However, the fixed operation of the carbon capture system still has a large impact on the system’s operation. The units must analyze and process the CO2 emitted at each time in real time, which leads to the system needing to purchase power from the outside during some of the peak load hours, which increases the operating cost of the electricity–heat coupling system. At the same time, the large amount of CO2 generated by the units during peak load periods is also not stored and utilized, resulting in the low-carbon effect of the system remaining unsatisfactory.
Scenario 4 carries out the synergistic and flexible scheduling of the CCPP-P2G system without restricting the flue gas split ratio, that is., the source-side optimization strategy proposed in this article. The total cost of the system in Scenario 4 is reduced by 9.91%, 0.47%, and 0.52% compared to Scenarios 1, 2, and 3, respectively. This is due to the fact that the CO2 precipitated by the carbon capture system in Scenario 4 can be supplied to the P2G system to generate natural gas when the wind power consumption of the system is low. Its flexible operation will not affect the operation status of the carbon capture system, so its carbon emission reduction effect and carbon trading benefit rise significantly compared with Scenario 2. Compared with Scenario 3, the carbon source required for operating the P2G can be supplied flexibly by the carbon capture system. In comparison with Scenario 3, the carbon source required for P2G operations can be supplied by the carbon capture system in a flexible mode; thus, the synergistic operation of P2G reduces the operating pressure of the unit while increasing the amount of wind curtailment and consumption and thus reduces the cost of purchased electricity of the electricity–heat coupling system.
As CHP units have the working mode of “setting power by heat,” it is easy to cause the units to force the power output to increase when meeting the heat load demand, resulting in a conflict with the wind power output in certain time periods. It is not conducive to the consumption of renewable energy, as shown in Table 1, Figure 5, and Figure 10. Thus, the wind abandonment situation in Scenario 1 is serious. At the same time, due to thermal power and gas units arriving at the upper limit of power output during the peak period of electric and thermal loads, the power that can be provided to the carbon capture system and P2G system is less, so most of the CO2 cannot be stored and utilized. In the valley period of the load, because there is no liquid and carbon storage device system, it is not possible to realize the energy time-shift. The carbon capture system and the P2G system can only achieve the absorption and conversion of the CO2 discharged by the current unit, resulting in low wind power utilization efficiency.
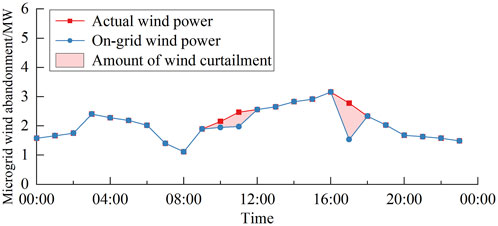
Figure 10. Wind curtailment of Scenario 1.
5.3 Low-carbon analysis of system operations considering the complementary low-carbon characteristics of source–load
The carbon emissions of system operations under five scenarios are shown in Table 2, and the comparison results of each scenario are shown in Figure 11.
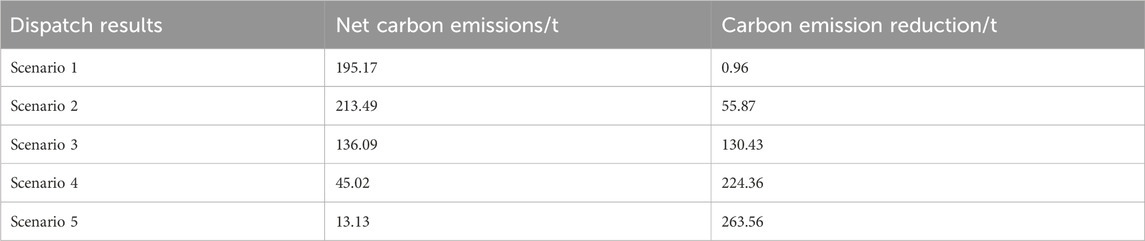
Table 2. Low-carbon comparison of operations in Scenarios 1–5.
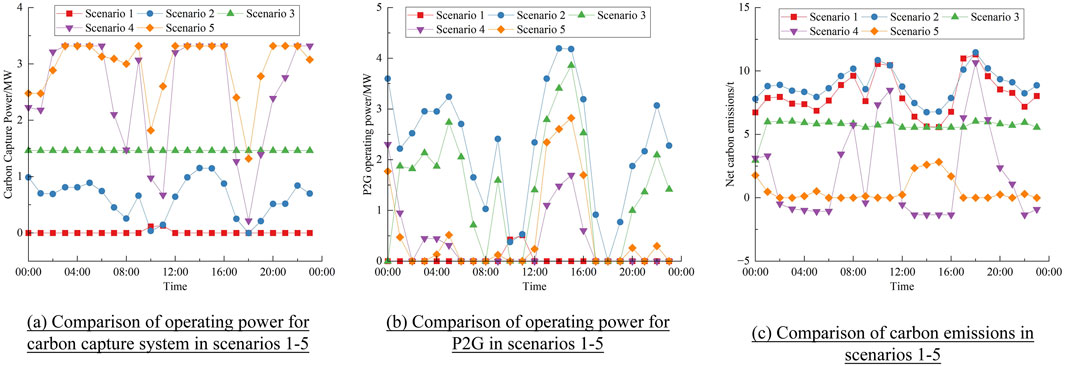
Figure 11. Comparison of different operating methods of the CCS-P2G system. (A) Comparison of operating power for CCPPs. (B) Comparison of operating power for P2Gs. (C) Comparison of carbon emissions in Scenarios 1–5.
As shown in Figure 11A, the CCPPs in Scenarios 1 and 3 are based on fixed operations, so their capture power does not fluctuate much, while the operation trend of the carbon capture system is the same in each of the remaining scenarios. As shown in Figure 11B, the operation trend of the P2G system is the same in each of the scenarios. The peak load periods are at 11:00–12:00 and 17:00–19:00, and the electricity–heat coupling system supplies P2G energy is lower, which is in line with the actual situation. Scenario 2 has the highest power for P2G operations. However, because the P2G is not equipped with a carbon storage device, the CCPP must reduce the carbon capture power in order to supply power to the P2G system, so the carbon emissions of Scenario 2 are still high.
In Scenario 3, the carbon capture system must analyze the CO2 generated by each unit that does not enter the flue gas bypass system at each moment, so the carbon emissions of the system are not significantly improved. However, the P2G system configured with a carbon storage device can operate flexibly with wind power, and the power supplied by the system to the P2G system is increased accordingly, so compared with Scenarios 1 and 5, the power of the P2G operations is at a higher level.
In Scenario 4, the net carbon emissions of the system are reduced by 76.93%, 78.91%, and 66.92% compared with Scenarios 1, 2, and 3, respectively. The carbon emission reduction of the system is increased by 223.4 t, 168.49 t, and 93.93 t compared with Scenarios 1, 2, and 3, respectively, and the degree of carbon emission reduction reaches 83.29%. Scenario 4 lifts the constraints on the flue gas split ratio, and the system further utilizes the energy time-shift characteristics of the carbon capture electricity-to-gas system during the 02:00–06:00 period, which results in a lower level of overall carbon emissions and better economic benefits of the system.
Scenario 5 adopts an integrated demand response strategy on the load side, and compared with Scenario 4, the net carbon emissions of the system are reduced by 70.84%. The carbon emission reduction level is improved by 17.47%. In Scenario 5, the operating power of the carbon capture and P2G systems are both at a high level, especially during the 13:00–16:00 period of peak wind power output, and the conversion of the system’s P2G is significantly improved.
As can be seen from Figure 11C, Scenarios 1–5 have the same carbon emissions trends. Scenario 4 resolves CO2 from the liquid storage device and consumes CO2 from the wind power conversion carbon storage device during the 02:00–06:00 and 20:00–24:00 periods when the wind power output is higher and uses the carbon capture system and P2G to reduce carbon emissions during the 13:00–16:00 period, when the load demand is lower. Scenario 5 not only completely resolves all the CO2 emitted in this time but also resolves stored CO2 through the liquid storage device during the 02:00–06:00, 13:00–16:00, and 22:00–23:00 periods, realizing negative carbon emissions from the system.
Scenario 5, which operates based on the integrated demand response strategy, has low system emissions for all time periods. This is due to the use of low-carbon unit output and renewable energy to meet part of the peak load demand through the load-side demand response strategy in conjunction with the source-side units. At the same time, the amount of load curtailed by price demand response directly compresses the unit output, which correspondingly reduces the carbon emissions of the system. In addition, the alternative demand response also reduces the output of high-carbon thermal power units and utilizes the electric–thermal coupling characteristics of CHP units to enhance the carbon capture power of natural gas-sourced CCPPs based on meeting the thermal load demand, realizing the low-carbon economic operation of the system.
In summary, through the complementary source–load low-carbon characteristics of the electricity–heat coupling system, the energy time-shift characteristics of the CCPP-P2G and the electric–thermal coupling characteristics of the CHP unit are fully utilized, which significantly improves the system economy and carbon emissions. In addition, Scenario 5, with this article’s scheduling method, both realizes the full consumption of renewable energy and improves the support of zero-carbon resources for carbon emission reduction and carbon recycling.
6 Conclusion
This article proposes a low-carbon economic dispatch method for an electricity–heat coupling system that considers the complementary low-carbon characteristics of source–load, utilizes the energy time-shift advantages of source-side carbon capture and a P2G system, and combines with the flexibility of load-side resources to participate in the integrated demand response. This method effectively realizes the source–load synergy, promotes wind power consumption, and improves the system’s low-carbon performance and economic efficiency. The simulation demonstrates the effectiveness of the strategy proposed in this article and draws the following conclusions.
(1) The flexible operation mode of the CCPP-P2G system can significantly reduce the total cost of the system’s operations and carbon emissions. Compared with the flexible operation mode of carbon capture or P2G system alone, this mode is more capable of promoting the consumption of renewable energies, reducing the carbon emissions of the system, and giving full play to the advantages of the energy time-shift of the two.
(2) Compared with only optimizing the source side, the total system cost is reduced by 0.22%, and the carbon emission reduction level is increased by 17.47% after considering the integrated demand response. It proves that the integrated demand response approach can play a role in the mutual benefit effect of electricity and heat loads based on rationally adjusting their peak-to-valley differences. In addition, compared with the traditional demand response strategy, this approach has a wider adjustment range and a more significant low-carbon effect.
(3) Considering the synergistic and flexible operation of the CCPP-P2G and considering the integrated demand response characteristics of the electric and thermal loads, the potential of the source–load synergistic low-carbon effect of the electricity–heat coupling system can be fully exploited, and the renewable energy sources are utilized efficiently to improve the economy and low-carbon nature of the electricity–heat coupling system.
Data availability statement
The original contributions presented in the study are included in the article/Supplementary Material; further inquiries can be directed to the corresponding author.
Author contributions
JT: conceptualization, funding acquisition, project administration, software, supervision, writing–original draft, and writing–review and editing. YX: methodology and writing–review and editing. BQ: visualization and writing–review and editing. HH: validation and writing–review and editing. MZ: formal analysis and writing–review and editing. JO: investigation and writing–review and editing. JW: resources and writing–review and editing. RC: data curation and writing–review and editing.
Funding
The author(s) declare that financial support was received for the research, authorship, and/or publication of this article. This work was supported in part by the China Southern Power Grid Corporation Technology Project (GZKJXM20222151). The funder was not involved in the study design, collection, analysis, interpretation of data, the writing of this article, or the decision to submit it for publication.
Conflict of interest
Authors YX, HH, JO and RC were employed by Guizhou PowerGrid Co., Ltd.
The remaining authors declare that the research was conductedin the absence of any commercial or financial relationships thatcould be construed as a potential conflict of interest.
Publisher’s note
All claims expressed in this article are solely those of the authors and do not necessarily represent those of their affiliated organizations, or those of the publisher, the editors, and the reviewers. Any product that may be evaluated in this article, or claim that may be made by its manufacturer, is not guaranteed or endorsed by the publisher.
Supplementary material
The Supplementary Material for this article can be found online at: https://www.frontiersin.org/articles/10.3389/fenrg.2024.1456151/full#supplementary-material
References
Abdilahi, A. M., Mustafa, M. W., Abujarad, S. Y., and Mustapha, M. (2018). Harnessing flexibility potential of flexible carbon capture power plants for future low carbon power systems: review. Renew. and Sustain. Energy Rev. 81, 3101–3110. doi:10.1016/j.rser.2017.08.085
Cheng, Y. H., Zhang, N., Zhang, B. S., Kang, C. Q., Xi, W. M., and Feng, M. S. (2020). Low-carbon operation of multiple energy systems based on energy-carbon integrated prices. Ieee Trans. Smart Grid 11 (2), 1307–1318. doi:10.1109/tsg.2019.2935736
Cui, Y., Deng, G. B., Zhao, Y. T., Zhong, W. Z., Tang, Y. H., and Liu, X. Y. (2021b). Economic dispatch of power system with wind power considering the complementarity of low-carbon characteristics of source side and load side. Proc. CSEE 41 (14), 4799–4815. (in Chinese).
Cui, Y., Zhang, C., Deng, G. B., Li, Y. C., Yu, S. P., and Shen, Z. (2021a). “Multi objective low carbon economic dispatch of power system considering integrated flexible operation of carbon capture power plant,” in Power system and green energy conference (PSGEC) (IEEE).
Ding, C., Zhou, Y. Y., Ding, Q. C., and Li, K. M. (2022). Integrated carbon-capture-based low-carbon economic dispatch of power systems based on eemd-lstm-svr wind power forecasting. Energies 15 (5), 1613. doi:10.3390/en15051613
Han, X., Qiu, J., Sun, L., Shen, W., Ma, Y., and Yuan, D. (2020). Low-carbon energy policy analysis based on power energy system modeling. Energy Convers. Econ. 1 (1), 34–44. doi:10.1049/enc2.12005
Ji, Z., Kang, C. Q., Chen, Q. X., Xia, Q., Jiang, C. M., Chen, Z. X., et al. (2013). Low-carbon power system dispatch incorporating carbon capture power plants. Ieee Trans. Power Syst. 28 (4), 4615–4623. doi:10.1109/tpwrs.2013.2274176
Lei, D. Y., Zhang, Z. H., Wang, Z. J., Zhang, L. Y., and Liao, W. (2023). Long-term, multi-stage low-carbon planning model of electricity-gas-heat integrated energy system considering ladder-type carbon trading mechanism and ccs. Energy 280, 128113. doi:10.1016/j.energy.2023.128113
Li, C. Y., Yan, Z. C., Yao, Y. M., Deng, Y. L., Shao, C. Z., and Zhang, Q. (2024). Coordinated low-carbon dispatching on source-demand side for integrated electricity-gas system based on integrated demand response exchange. Ieee Trans. Power Syst. 39 (1), 1287–1303. doi:10.1109/tpwrs.2023.3263844
Liao, W., Liu, D., Wu, Y., and Liu, T. (2024). Bi-level optimization of multi-regional power system considering low-carbon oriented synergy of both source and load sides. IET Renew. Power Gener. 18 (3), 515–528. doi:10.1049/rpg2.12778
Lu, S. Y., Lou, S. H., Wu, Y. W., and Yin, X. G. (2013). Power system economic dispatch under low-carbon economy with carbon capture plants considered. Iet Generation Transm. and Distribution 7 (9), 991–1001. doi:10.1049/iet-gtd.2012.0590
Lu, X. L., Pan, M., Ju, L. W., Wei, W. T., Song, Y. H., Pan, Y. S., et al. (2023). Dispatching optimization model of combined heat and power virtual power plant considering carbon capture and power-to-gas. Electr. Power Constr. 44 (8), 107–117. (in Chinese).
Ma, Y. M., Wang, H. X., Hong, F., Yang, J. Y., Chen, Z., Cui, H. Q., et al. (2021). Modeling and optimization of combined heat and power with power-to-gas and carbon capture system in integrated energy system. Energy 236, 121392. doi:10.1016/j.energy.2021.121392
Siqin, Z., Niu, D. X., Wang, X. J., Zhen, H., Li, M. Y., and Wang, J. B. (2022). A two-stage distributionally robust optimization model for P2g-cchp microgrid considering uncertainty and carbon emission. Energy 260, 124796. doi:10.1016/j.energy.2022.124796
Tan, Z. F., Yang, J. C., Li, F. Q., Zhao, H. C., and Li, X. D. (2022). Cooperative operation model of wind turbine and carbon capture power plant considering benefit distribution. Sustainability 14 (18), 11627. doi:10.3390/su141811627
Wu, J. L., Lou, P., Guan, M. Y., Huang, Y. Z., Zhang, W. X., and Cao, Y. C. (2022). Operation optimization strategy of multi-microgrids energy sharing based on asymmetric nash bargaining. Power Syst. Technol. 46 (7), 2711–2723. (in Chinese).
Wu, J. Q., Zhang, Q., Lu, Y. D., Qin, T. X., and Bai, J. Y. (2023). Source-load coordinated low-carbon economic dispatch of microgrid including electric vehicles. Sustainability 15 (21), 15287. doi:10.3390/su152115287
Yan, Q. Y., Ai, X. B., and Li, J. M. (2021). Low-carbon economic dispatch based on a ccpp-P2g virtual power plant considering carbon trading and green certificates. Sustainability 13 (22), 12423. doi:10.3390/su132212423
Zhang, D. D., Zhu, H. Y., Zhang, H. C., Goh, H. H., Liu, H., and Wu, T. (2022). Multi-objective optimization for smart integrated energy system considering demand responses and dynamic prices. Ieee Trans. Smart Grid 13 (2), 1100–1112. doi:10.1109/tsg.2021.3128547
Zhang, Q., Wu, J. Q., Sun, T., Huang, Y. Y., and Li, C. Y. (2024). Multi-microgrid Bi-layer economic scheduling strategy considering evolutionary-stackelberg hybrid game of electric vehicles. Iet Smart Grid, 18. doi:10.1049/stg2.12159
Zhang, R. F., Jiang, T., Li, F. X., Li, G. Q., Chen, H. H., and Li, X. (2020). Coordinated bidding strategy of wind farms and power-to-gas facilities using a cooperative game approach. Ieee Trans. Sustain. Energy 11 (4), 2545–2555. doi:10.1109/tste.2020.2965521
Zhang, X., Liu, Z., Ding, T., Zhang, H., Siano, P., Meng, H., et al. (2023). Multi-stage stochastic dual dynamic programming to low-carbon economic dispatch for power systems with flexible carbon capture and storage devices. IET Generation, Transm. and Distribution 17 (19), 4359–4374. doi:10.1049/gtd2.12973
Zhao, H. R., Zhang, C., Zhao, Y. H., and Wang, X. J. (2022). Low-carbon economic dispatching of multi-energy virtual power plant with carbon capture unit considering uncertainty and carbon market. Energies 15 (19), 7225. doi:10.3390/en15197225
Zheng, Y. W., Gao, L., Li, S., and Wang, D. (2022). A comprehensive evaluation model for full-chain ccus performance based on the analytic hierarchy process method. Energy 239, 122033. doi:10.1016/j.energy.2021.122033
Keywords: source–load complementarity, electricity–heat coupling system, low-carbon characteristic, demand response, carbon capture
Citation: Tang J, Xiao Y, Qian B, Hu H, Zhou M, Ou J, Wang J and Chen R (2024) Economic operation strategy of an electricity–heat coupling system considering complementary low-carbon characteristics of source-load. Front. Energy Res. 12:1456151. doi: 10.3389/fenrg.2024.1456151
Received: 28 June 2024; Accepted: 27 August 2024;
Published: 04 October 2024.
Edited by:
Qiang Yu, China Agricultural University, ChinaCopyright © 2024 Tang, Xiao, Qian, Hu, Zhou, Ou, Wang and Chen. This is an open-access article distributed under the terms of the Creative Commons Attribution License (CC BY). The use, distribution or reproduction in other forums is permitted, provided the original author(s) and the copyright owner(s) are credited and that the original publication in this journal is cited, in accordance with accepted academic practice. No use, distribution or reproduction is permitted which does not comply with these terms.
*Correspondence: Jianlin Tang, dGFuZ2psMkBjc2cuY24=