 Sara Bagheri1
 Mansour Yeganeh
- 1Department of Architecture, Islamic Azad University, Semnan Branch, Semnan, Iran
- 2Department of Architecture, Tarbiat Modares University, Tehran, Iran
The proportions of exterior windows in low-rise residential buildings are crucial for optimizing energy consumption. This study investigates and optimizes these proportions for buildings in the temperate climate of Rasht City, Iran. A building was simulated in DesignBuilder software to explore how different window-to-wall ratios affect energy consumption. Using a parametric algorithm, the percentage of windows on each building facade was varied from 10% to 100%, and heating, cooling, and lighting loads were calculated. The results revealed that optimizing window proportions can significantly reduce annual energy consumption. For the north-facing facade, the optimal window-to-wall ratio is between 26% and 33%. On the south side, the most efficient window proportion is 21%–25%, resulting in the lowest energy consumption of 2,102 kWh/m2 per year. The optimal window proportions for the east and west facades are 54%–57%, and 58%, respectively. The study found a strong correlation between energy consumption and the window-to-wall ratio for the south-facing facade, with a correlation coefficient of 0.97. For the north, east, and west facades, the correlation coefficients are 0.72, 0.17, and 0.33, respectively. These findings can predict energy consumption for residential buildings in Rasht and similar climates. Optimizing window proportions is an effective strategy to reduce energy use and enhance residents’ quality of life, applicable to both new constructions and renovations of existing buildings.
1 Introduction
Energy consumption in buildings accounts for about 40% of global energy use, with 60% of this related to heating and cooling, especially in the residential sector. Similarly, in Iran, buildings are a significant contributor to energy consumption (Asfour, 2020; Noaman et al., 2022; Spanodimitriou et al., 2022). Highlight the significant demand for cooling and heating savings in buildings, reinforcing the importance of energy-efficient design (Albatayneh et al., 2021; He et al., 2021; Sakhaei et al., 2020). This is particularly relevant given the rising global energy demand, which underscores the necessity of transitioning to renewable energy sources. Among these, solar photovoltaic (PV) technology has emerged as a leading solution for large-scale electricity generation (Mardani et al., 2024)
The increasing global energy demand necessitates a shift towards renewable energy sources, with solar photovoltaic technology being a prominent option for large-scale electricity generation.
Considering the increase in land population and urbanization growth up to 80% in 2030 and the increase in total energy demand in buildings between 110%–150% by 2050 and 160%–220% by 2095 compared to 2005, reducing energy consumption through improving efficiency Building energy has been considered (Mahiwal et al., 2021). Hoseinzadeh (2019) highlighted that half of the energy consumed by buildings is lost through windows. The study of smart windows in Iran for energy optimization across various climates and the analysis of cooling energy consumption strategies in different Iranian cities underscore the importance of optimizing the window-to-wall ratio. Addressing this issue is essential for improving energy efficiency in buildings. The optimal ratio of the outer window of the building to the wall is to reduce the annual energy consumption of the building, which should be applied in the early stages of building design (Goia, 2016). An essential point in the design process to determine the optimal percentage of external windows is to pay attention to the urban topology and the characteristics of the environment around the building (Košir et al., 2017). It should be noted that the optimal ratio of exterior windows to receive daylight is not equal to its value for minimum energy consumption (Byggregler and Författningssamling, 2009). The type of glass, its shape, and the location of the radiator should be taken into account so that with the correct placement of the external opening, the annual energy loss of the building through the thermal bridge can be reduced by half (Marino et al., 2017; Misiopecki et al., 2017; Ghanbari et al., 2022).
A study evaluated the increase in the ratio of outdoor windows in the north face and its decrease in the south face of 20 residential buildings. The results showed that for the stability of the building, small and large windows should be used in the north and south front, respectively. Also, the dimensions of the effective external opening do not significantly affect heating, while this value is significant on the cooling load (Halawa et al., 2017; Zare et al., 2022). Another study in residential buildings in cold climates showed that using solutions such as taking advantage of internal heat produced by equipment and people, obtaining solar heat, and triple-layered glass has greatly reduced heat loss. In addition, using the more oversized exterior windows on the north front used more suitable daylight conditions. Other results show that using larger north window dimensions has led to a slight increase in the heating load. On the other hand, more oversized windows on the south face of the building increase the ventilation speed, and awnings should also be used (Persson et al., 2006; Azizibabani et al., 2021).
In another study, Goia (2016) compared low-emissivity three-pane windows, three-pane clear windows, low-emission double-pane windows, and clear double-pane windows with five types of single-pane windows for a residential building in Rome, Italy. The results showed that the outer window of the building with an area ratio of less than 0.2 had the best performance. A study in a temperate oceanic climate for an office building showed that the optimal ratio is between 35% and 45% and does not depend on the facade and orientation of the building. Also, the overall energy consumption of the building depends a little on the efficiency of the air conditioning system and the geometry of the building. On the other hand, it depends on the shading system, and the internal heat load changes significantly (Goia et al., 2013; Motie et al., 2023).
Research in the cold climate of Europe, between 35 and 60° north, showed that the most suitable ratio of Bjorn windows to the wall is between 30 and 45 percent (Goia, 2016). In Europe, the use of an elongated form has been proposed to receive more solar heat. Also, the square plan with a 50% exterior window ratio on the south front and without a canopy was introduced as one of the best models. However, in the case of extensive use of window surfaces with movable awnings, energy consumption has been minimized (Košir et al., 2017). In a study in Indonesia, Lee et al. (2013) found that changing the characteristics of exterior window glass affects the amount of visible light and absorption of thermal energy. Shell design guidelines for five climates are provided. According to ASHRAE’s classification in climates 1 and 2, the most advantages are related to using windows in the north, south, west, and east facades, respectively. Also, in the regions of 3–5 ASHRAE, it is related to the view of the south front, north front, west front, and east front. The recommended ratio of the outer windows’ dimensions to the building’s outer wall on all fronts is 25%.
Various studies have used various optimization algorithms to improve the performance of the building shell; the genetic algorithm is one of them, which aims at optimal design to minimize the energy consumption of the building. A genetic algorithm study evaluated residential buildings with L-shaped, rectangular, plus, H-shaped, trapezoidal, and T-shaped forms. The effect of the ratio and type of external glass was analyzed in it. The results showed that trapezoid and rectangle forms had the best cost and life cycle performance. In addition, the square form performs best in all climates with minimum cost (Tuhus-Dubrow and Krarti, 2010). Amaral et al. (2016) in research optimized the window dimensions of a space in the Portuguese climate in terms of thermal comfort. The investigated variables were window dimensions, canopy type, and opening orientation. The parametric results showed that the west and north-east directions are inappropriate, and three-paned glass should be used in the north face. Also, a canopy does not affect the thermal performance of a triple-glazed window. On the other hand, it provides the possibility of using a window with wider dimensions.
Recently, using Design Builder software, the optimal dimensions of the exterior windows of the building in different climates have been investigated. Marino et al. (2017), in a study using Dizan Builder software with the Energy Plus engine, optimized the building shell in 12 Italian climates. The results showed that in all studied climates, the percentage of window to wall with 25.9% with poor insulation and 23.5% with proper insulation is the most optimal ratio. In another study, the percentage of external windows on the energy consumption of an office building in Libya was evaluated with Energy Plus software. The results showed that with the increase in the percentage of the window, the heating load decreased, and the cooling load increased between 6% and 180% (Alghoul et al., 2017).
In a study, Krarti et al. (2005) analyzed the variables of the percentage of exterior window area, type of glass, and building geometry on the amount of electrical energy consumption in the American climate. The results showed that increasing the coefficient of transmitted light leads to an increase in the benefits of daylight. Latitude has a relatively small effect on the amount of daylight, and in all spaces, the coefficient of transmitted light greater than 0.3 has led to a decrease in the amount of energy return. The purpose of designing wider openings in the outer walls of residential buildings is to receive more daylight, which leads to more heat loss and solar absorption (Bruno, 2017). In addition, the window area should not be less than ten percent of the interior floor area to use daylight (Byggregler and Författningssamling, 2009; Goharian et al., 2022).
An essential point in the design process to determine the optimal percentage of external windows is to pay attention to the urban topology and the characteristics of the environment around the building (Košir et al., 2017; Goharian et al., 2023). It should be noted that the optimal ratio of exterior windows to receive daylight is not equal to its value for minimum energy consumption (Byggregler and Författningssamling, 2009). The type of glass, its shape, and the location of the radiator are things that should be taken into account in such a way that with the correct placement of the external opening, the amount of annual energy loss by the building through the thermal bridge can be reduced by half (Marino et al., 2017; Misiopecki et al., 2017; Goharian et al., 2023).
According to reviewed studies, determining the optimal percentage of windows on different sides of a building significantly impacts internal thermal comfort, resident satisfaction, and overall energy consumption. Research is ongoing in various climates to identify the optimal percentage of external openings. However, there is a gap in research regarding the optimal window-to-wall ratio for residential buildings in Rasht City, which has a moderate and humid climate.
This research aims to identify the optimal percentage of windows on the four sides of residential buildings in Rasht, providing valuable guidance for designers and architects to achieve sustainable design. Additionally, the study seeks to determine the correlation coefficient between building energy consumption and the percentage of exterior windows. This correlation will help estimate and predict energy consumption, contributing to sustainability in both new and existing buildings.
2 Description of the climate region
The first step to designing a sustainable architecture is to study the desired climate. According to Kopen’s climate classification, Iran has four climates: temperate and humid, hot and humid, cold and hot and dry (Kottek et al., 2006). Rasht has a temperate Caspian and semi-Mediterranean climate (Figure 1), which has hot and humid summers and cold and wet winters. The city of Rasht, the capital of Gilan Province in northern Iran, is located at a latitude of 37° 12′N and a longitude of 49° 39′E. Situated at an elevation of 36.7 m above sea level, Rasht experiences a humid and moderate climate due to its geographical location. The city is significantly influenced by the Caspian Sea, resulting in frequent rainfall and high humidity in the region (Jahanbani et al., 2011; Alamdari et al., 2022).
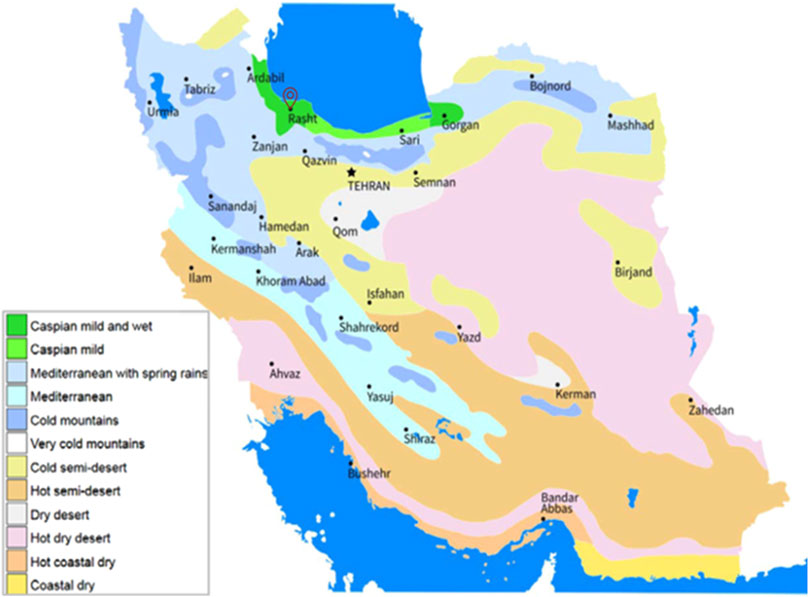
Figure 1. Climatical zoning of Iran (Pilechiha et al., 2020).
Figure 2 shows the cytometric chart of Rasht according to the ASHRAE standard 55 version 2004 output of the climate advisor software. According to Figure 2, thermal comfort exists 7% of the year without a specific design strategy. While 33.8% of the period of the year is created by using passive solar solutions, thermal comfort is created, 10.1% of which is by creating a canopy on the window. Also, according to the desired climate, 24% of the year, dehumidification is needed to achieve thermal comfort in the indoor space.

Figure 2. Rasht psychrometric chart.
The direction of the wind flow in the year from different directions, and its intensity is shown in Figure 3, which is the dominant wind from the northwest. Also, the average temperature of Rasht during the year 1390–1400 in the months of the year is shown in Figure 4. The minimum and maximum temperatures in the year are −4 and 35°C, respectively, which occurred in January and August. The months of July, August, and September are considered as warm months (Figure 4).
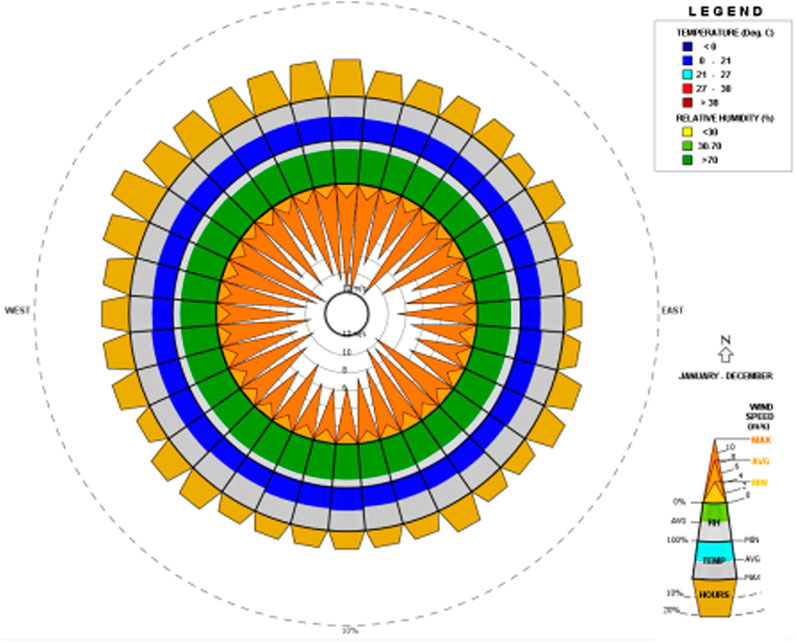
Figure 3. Annual wind flow diagram of Rasht city.
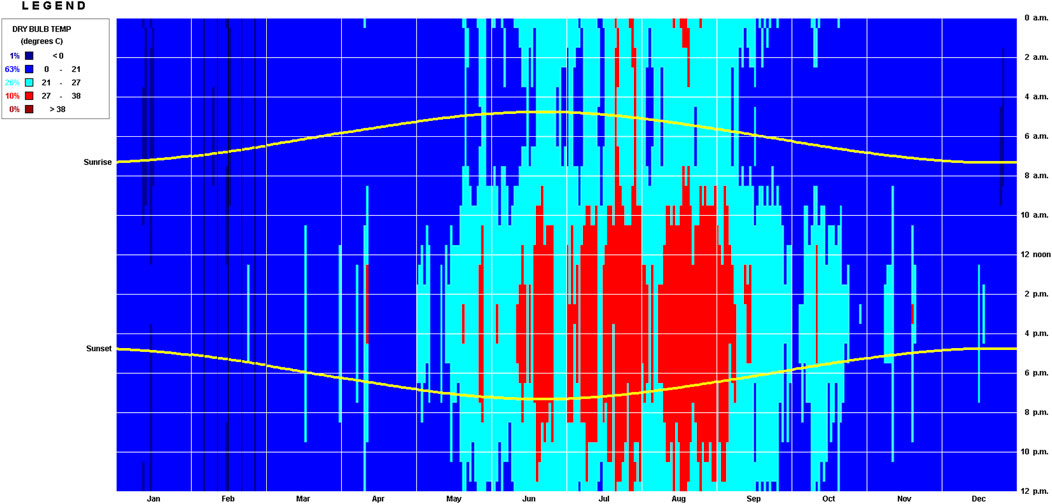
Figure 4. The average monthly temperature of Rasht city.
3 Research method
The research steps and methods used in this study are shown in Figure 5. First, to determine the optimal percentage of windows in the outer walls of a residential building, a space with dimensions of 4 m * 6 m and a height of 4 m was selected as a residential space. This space has an east-west extension (Figure 6).
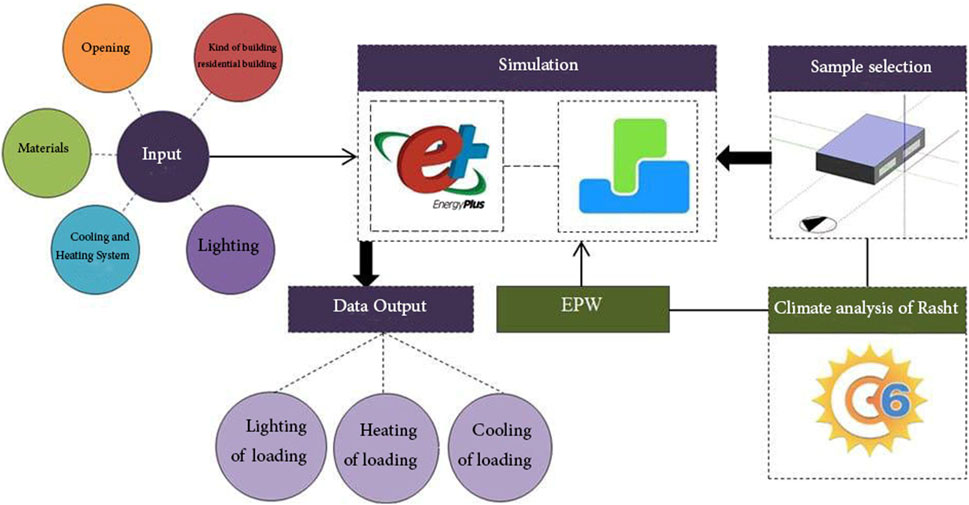
Figure 5. Study and simulation steps.
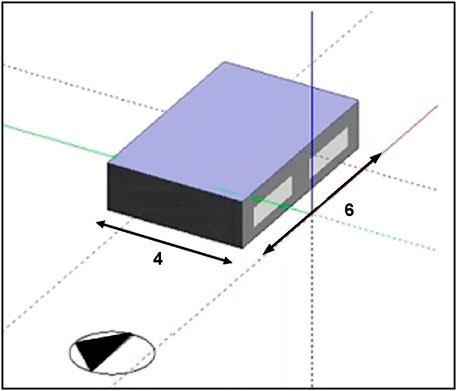
Figure 6. Simulated space in Design Builder software with a 30% window percentage on the south front.
3.1 Simulation tools
DesignBuilder is a sophisticated graphical interface specifically created to facilitate EnergyPlus simulations. As a state-of-the-art software tool, it enables comprehensive analysis of building energy consumption,
The specifications of the simulated space are given in Table 1. According to the ASHRAE standard, the heating point was 22°C, and the cooling point was 24°C. The materials used in the sample space are given in Table 2. In the intended space, the glasses were considered as double-glazed glass. The thickness of each glass is mm3, the thickness of the air layer between them is 6 mm, and its heat transfer coefficient is W/m2K3/3.
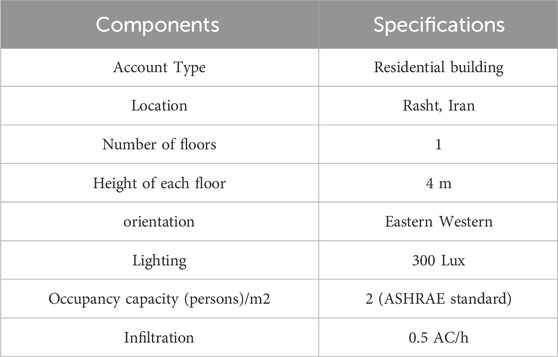
Table 1. Characteristics of the studied building.
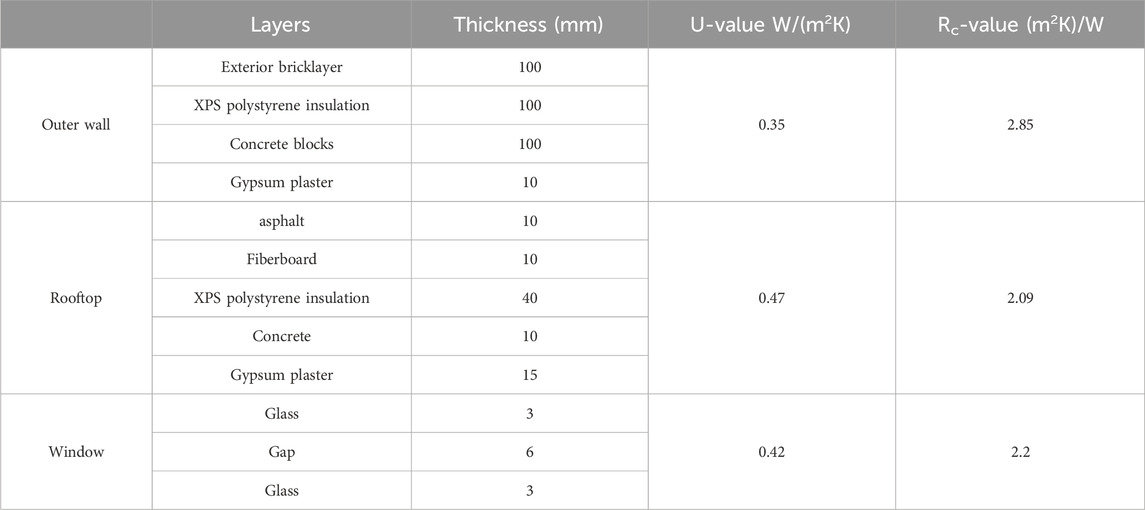
Table 2. Specifications of the materials of the simulated sample space in the Design-Builder software (based on the ASHRAE standard).
3.2 Validation software
Design Builder is a reputable commercial software for building energy simulation, offering comprehensive and dynamic capabilities. Its credibility is validated through the BESTest method, developed by the International Energy Agency to evaluate the accuracy and validity of energy simulation tools. The BESTest protocol is recognized as a standard benchmark for assessing building energy simulation capabilities. Design Builder is widely cited in scientific papers as a reliable energy simulation tool and is based on the extensively optimized EnergyPlus computational engine. Simulation results with EnergyPlus have been validated according to the “Industrial Test Standards” of the U.S. Department of Energy (Ilbeigi et al., 2020; Taleb and Sharples, 2011).
In this research, Ladybug software is used as a complementary tool to evaluate and compare simulation results with Design Builder. Initial modeling was conducted using Rhino software with dimensions of 4 m*6 m, as detailed in Table 1, followed by adjustments according to Table 2. The primary objective of the study is to optimize building window dimensions. For this purpose, 11 different scenarios of window-to-wall ratios were simulated and analyzed. The results show that the average cooling load calculated by Ladybug (78.98 kWh) and Design-Builder (71.49 kWh) differ by approximately 9.4%. Design Builder recorded 12.14 kWh for heating load calculations, while Ladybug recorded 12.44 kWh, resulting in a 2.5% difference. Electrical energy consumption also varied, with Design Builder recording 20.94 kWh and Ladybug 21.64 kWh, showing a 3.2% difference (Figure 7). These variations in results between the two software tools highlight their accuracy and reliability in simulations. The capability of these tools to optimize design and reduce energy consumption can be trusted for this research and similar projects, providing reliable results that enable more precise analysis and better decision-making for enhancing building energy performance.
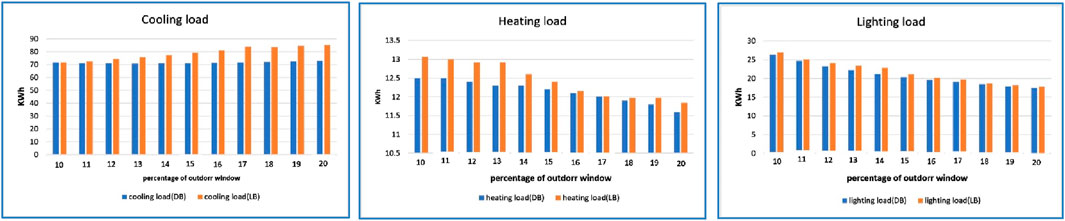
Figure 7. A comparison of energy consumption results using DesignBuilder and Ladybug tools.
3.3 Simulation modes
A parametric analysis using DesignBuilder software was conducted to determine the optimal percentage of exterior windows on all four sides of residential buildings in Rasht: south, north, east, and west. Initially, a building with dimensions of 4 m * 6 m was simulated using input data such as Rasht’s climatic file, building materials, occupancy rates, lighting, and other building-specific details. The parameters for the analysis were configured accordingly.
The first simulation was carried out on the building’s south-facing side, where the window-to-wall ratio was varied from 10% to 100%. Annual cooling, heating, and lighting loads were measured for each percentage of windows. This process was repeated for the north, east, and west facades, and the corresponding data was gathered. By comparing the results, the optimal window percentage for each facade was identified. Finally, to achieve the objective of studying the correlation between energy loads (cooling, heating, and lighting) and the percentage of exterior windows, a correlation coefficient was calculated. This analysis helps predict energy consumption in both existing and planned buildings, guiding sustainable design solutions.
4 Data analysis and results
After simulating the desired building, the amount of solar gain, cooling load, heating load, and annual lighting consumption of the building was calculated for different percentages of windows in the four sides of the office building for Bushehr, Shiraz, and Tabriz.
4.1 Solar gain
The increase in temperature in an object, building, or space caused by the sun’s radiation is called solar gain, which is one of the critical factors in the cooling load of the building. In addition, the solar gain coefficient is one of the essential characteristics of the exterior windows of the building, which refers to the transmission of solar energy by the window with all its components, including the materials used in the frame and glass (Baenas and Machado, 2017; Sharbafian et al., 2024). The amount of solar gain received annually in the studied space for different window percentages on four sides of residential buildings in Rasht City is shown in Figure 8. To determine the amount of solar gain of the building with 10% exterior windows on the south side of the studied space, it is 18.28 kWh/m. This value has reached 101/27 kWh/m with a window percentage of 50%. The amount of solar gain with 10% of the outer window on the north side of the building is also 21.8 kWh/m, and with 100% of the window, it reaches 87.26 kWh/m, which experiences a 90.7% increase in solar gain (Figure 8). The amount of solar gain for the percentage of western and eastern windows is almost the same. According to Figure 8, the amount of solar gain of the building with 10% and 100% windows on the east side is 7.27 kWh/m and 82.29 kWh/m, respectively.
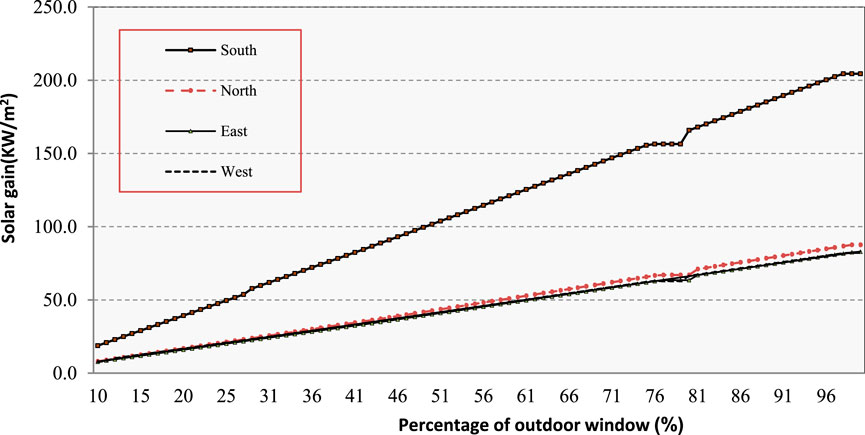
Figure 8. The amount of annual solar gain with the percentage of different windows on different fronts of residential buildings in Rasht.
4.2 Cooling load
Figure 9 shows the cooling times with the percentage of different windows on the four sides of the building in Rasht. On the south front, the window with a ratio of 15%–20% with an average consumption of 71.25 kWh/m has the lowest cooling load due to the low solar gain with this window percentage (Figure 8). The north front of the building, with 22%–24% of the external window, has the lowest amount of cooling load with 62.22 kWh/m2, and the highest amount of cooling load belongs to 100% of the external window with the amount of 91.24 kWh/m2. Also, according to Figure 9, For Rasht, the east side of the window has the lowest consumption with a ratio of 17%–21% with a consumption of 78.23 kWh/m. This amount for the west front of the building is a ratio of 19%–22% and an average amount of 77.26 kWh/m.
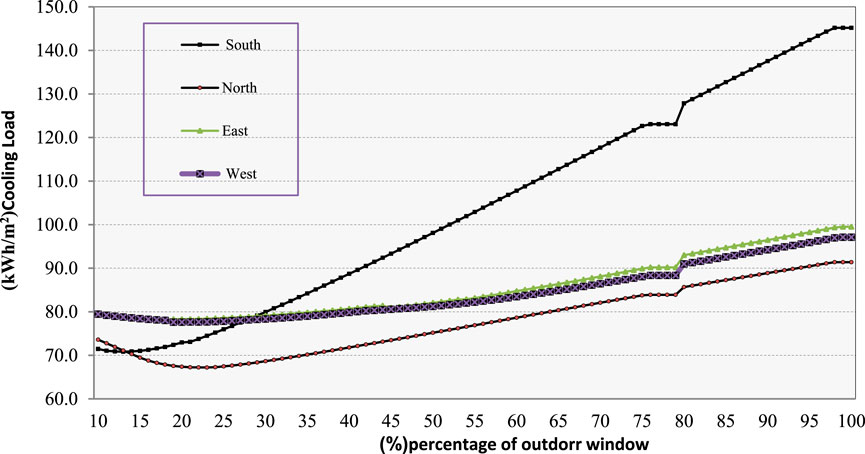
Figure 9. Annual cooling load with the percentage of different windows on different fronts of residential buildings in Rasht.
4.3 Heating load
Figure 10 shows the annual heating load of a residential building per square meter with the percentage of different windows for Rasht. On the south side of the building, with the increase in the percentage of windows, the heating load has decreased due to receiving direct sunlight and increasing solar gain (Figure 7), which helps to increase the room’s temperature. The southern front of the building has the lowest heating load at over 80%, with a consumption of 8.29 kWh/m2. The east and west facades behaved almost the same, and with the increase in the percentage of windows, the heating load also increased. The cause of this issue is the increase in the window area, which has led to the wastage of energy.
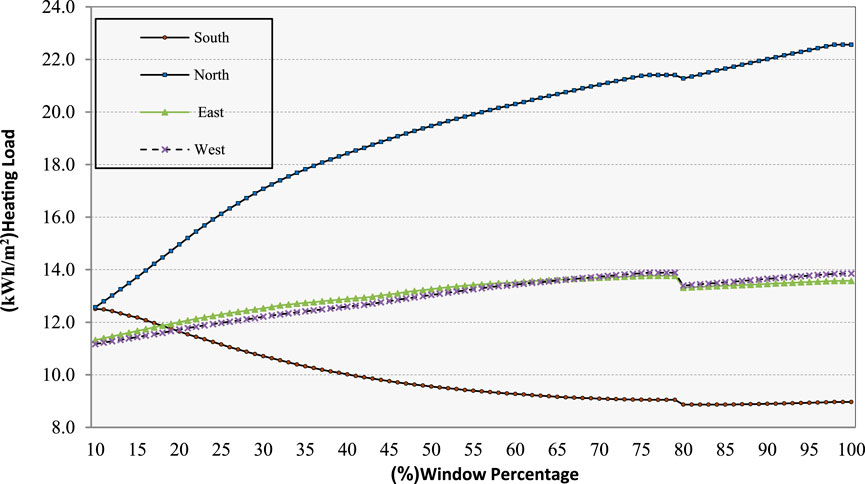
Figure 10. The amount of annual solar gain with the percentage of different windows on different fronts of residential buildings in Rasht.
On the other hand, the indirect reception of sunlight on these fronts helps increase the room’s temperature, which is more suitable for lighting and daylight. That also applies to the northern front, shown in Figure 10. On the north front of the building, the heating load of the studied space with 10% of the external window is 12.26 kWh/m2, which is 22.26 kWh/m2 with 100% window.
4.4 Lighting load
The annual lighting consumption of the residential building for different window percentages for Rasht is shown in Figure 11. According to Figure 11, with the increase in the percentage of windows in all fronts, the lighting load has decreased because more natural light has entered the interior space, which has led to a decrease in lighting load. In Rasht, the annual lighting load of the building with 10% windows on the south and north fronts is 47.21 kWh/m2, which is 17.21 kWh/m2 with 70% exterior windows (Figure 11). Also, the annual lighting of the building with a 10% exterior window percentage on the east side is approximately 39.22 kWh/m2, which is 12.25 kWh/m2 with a 70% window, which has decreased by 68%. Also, on the west side of the building, the lighting load for 10% and 100% of the outer window is 26.23 kWh/m and 11.25 kWh/m, respectively.
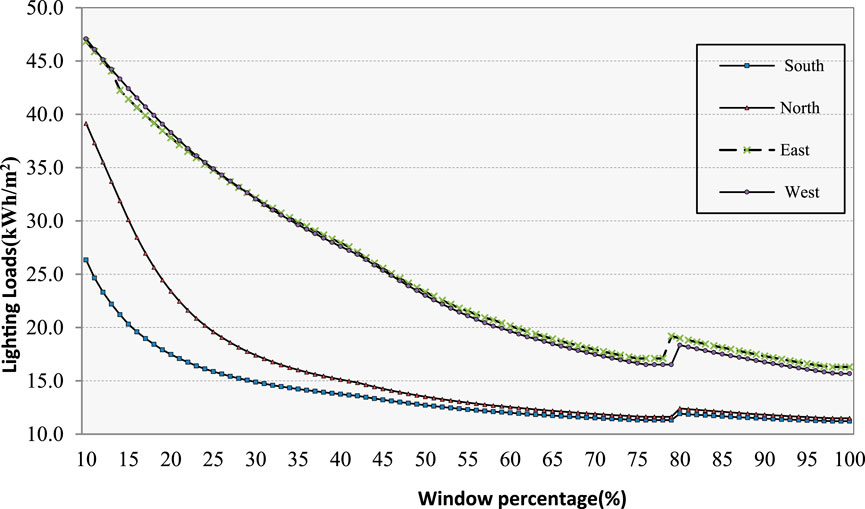
Figure 11. The amount of annual solar gain with the percentage of different windows on different fronts of residential buildings in Rasht.
4.5 A total load of cooling, heating, and lighting
The total load of cooling, lighting, and cooling with different percentages of windows in the outer wall on the four sides of North, South, East, and West for a residential building in Rasht is shown in Figure 12. According to Figure 12, the residential building with 21%–25% windows on the south front of the residential building had the lowest energy consumption, which was 2,102 kWh/m2. Also, for the northern front of the building, this amount was 2,103 kWh/m, which is 26%–33%. Also, it has been the most optimal in the eastern front, with 54%–57% with an annual energy consumption of 2,103 kWh/m. Also, the most optimal energy consumption mode on the west side is related to 58% of the outer window, 116.24 kWh/m2.
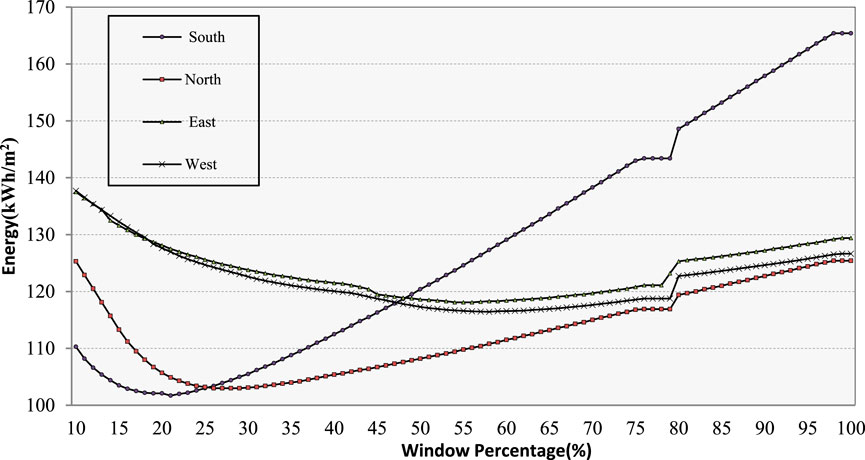
Figure 12. Annual energy consumption with the percentage of different windows on different fronts of residential buildings in Rasht.
4.6 Correlation coefficient between energy consumption and the window-to-wall ratio (WWR)
The correlation coefficients between the energy consumption of buildings with south, north, east, and west orientations and the optimal percentage of exterior windows (WWR) are presented in Table 3 and Figure 13. According to Table 3, the energy consumption of the building with south-facing windows is highly correlated with the window-to-wall ratio (p < 0.0001). Additionally, the energy consumption of the building with north-facing windows shows a significant correlation with the WWR, with a correlation coefficient of r = 0.72 and a slope of 0.19. The correlation coefficients for the energy consumption of buildings with east-facing and west-facing windows relative to the WWR are 0.17 and 0.33, respectively (Table 3). Regression lines and scatterplots illustrating the relationship between building energy consumption and the exterior window-to-wall ratio are shown in Figure 13.
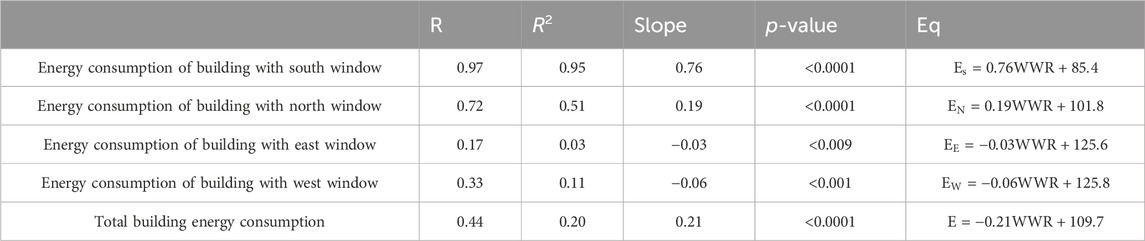
Table 3. Correlation results between building energy consumption and exterior window-to-wall ratio.
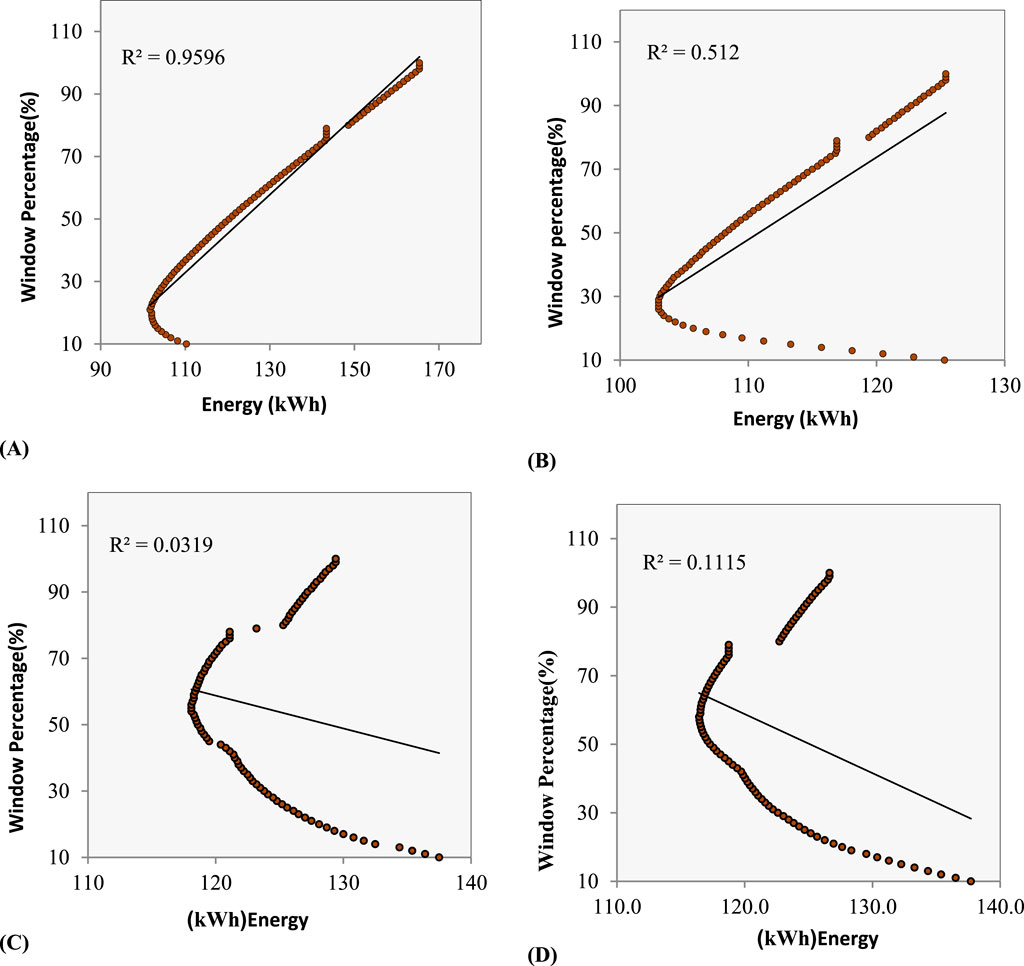
Figure 13. Regression lines and scatter plot for building energy consumption with exterior window-to-wall ratio; (A) Regression and scatterplot between building energy consumption with south window and exterior window-to-wall ratio (WWR); (B) regression line and scatterplot between building energy consumption with north window and exterior window-to-wall ratio (WWR); (C) Regression and scatter line between building energy consumption with east window with outer window to wall ratio (WWR) and (D) regression and scatter line between building energy consumption with west window with outer window to wall ratio (WWR).
The correlation coefficient between building energy consumption and the exterior window-to-wall ratio (WWR) for the four building orientations is presented in Table 3 and Figure 13. According to Table 3, building energy consumption (E) is significantly correlated with the WWR (P < 0.0001), with a correlation coefficient of 0.44. This data is valuable for predicting energy consumption in buildings with various facades and provides important insights for architects and designers (Figure 14). Additionally, it is useful for existing buildings, as it can guide redesigns and renovations aimed at enhancing energy efficiency.
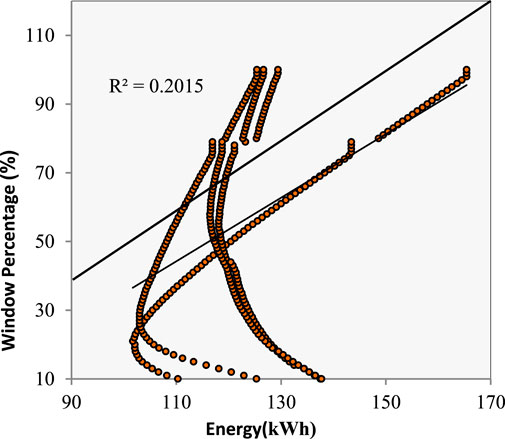
Figure 14. Regression and scatter plot between building energy consumption and exterior window-to-wall ratio (WWR).
5 Conclusion
This research investigated and determined the optimal percentage of windows for the north, south, east, and west facades of residential buildings in Rasht, a city with a moderate climate. By analyzing the correlation between energy consumption and the window-to-wall ratio (WWR), the study aims to predict energy consumption for both existing and new residential structures, contributing to energy efficiency and sustainability.
Simulations were conducted using DesignBuilder software, focusing on solar gain, cooling load, heating, and lighting consumption across various window configurations. The key findings are:
• For the north side, the optimal window percentage was between 26% and 33%, with an energy consumption of 2,103 kWh/m2 per year.
• For the south side, the optimal window percentage was 21%–25%, resulting in the lowest energy consumption of 2,102 kWh/m2 per year.
• On the east side, the optimal window percentage ranged from 54% to 57%, with an annual energy consumption of 2,103 kWh/m2.
• On the west side, the optimal window percentage was 58%, with an energy consumption of 116.24 kWh/m2 per year.
The correlation coefficient between energy consumption and WWR was found to be 0.97 for the south-facing windows, indicating a strong relationship. For north-facing windows, the correlation coefficient was 0.72. The coefficients for the west and east facades were 0.33 and 0.17, respectively. Overall, the correlation coefficient for building energy consumption with WWR was 0.44.
These findings are valuable for predicting and optimizing energy consumption in buildings with various facades, providing useful insights for architects and designers. The research also highlights the potential for redesign and renovation of existing buildings to improve energy efficiency.
Given the significant energy consumption in the building sector, with a substantial portion lost through windows, these results can guide the adoption of optimal window proportions in residential buildings in Rasht and similar climates in Iran. Utilizing these findings contributes to sustainable architecture and reduces environmental impacts associated with greenhouse gas emissions. The methodology applied in this research could also be adapted for use in other climates.
Data availability statement
The raw data supporting the conclusions of this article will be made available by the authors, without undue reservation.
Author contributions
SB: Conceptualization, Data curation, Formal Analysis, Investigation, Resources, Software, Writing–original draft. HM: Conceptualization, Methodology, Project administration, Supervision, Writing–review and editing. MY: Methodology, Validation, Writing–review and editing.
Funding
The author(s) declare that no financial support was received for the research, authorship, and/or publication of this article.
Conflict of interest
The authors declare that the research was conducted in the absence of any commercial or financial relationships that could be construed as a potential conflict of interest.
Publisher’s note
All claims expressed in this article are solely those of the authors and do not necessarily represent those of their affiliated organizations, or those of the publisher, the editors and the reviewers. Any product that may be evaluated in this article, or claim that may be made by its manufacturer, is not guaranteed or endorsed by the publisher.
References
Alamdari, A. H., Daneshjoo, K., and Yeganeh, M. (2022). New algorithms for generating isovist field and isovist measurements. Environ. Plan. B Urban Anal. City Sci. 49 (9), 2331–2344. doi:10.1177/23998083221083680
Albatayneh, A., Juaidi, A., Abdallah, R., and Manzano-Agugliaro, F. (2021). Influence of the advancement in the LED lighting technologies on the optimum windows-to-wall ratio of Jordanians residential buildings. Energies 14 (17), 5446. doi:10.3390/en14175446
Alghoul, S. K., Rijabo, H. G., and Mashena, M. E. (2017). Energy consumption in buildings: a correlation for the in fl uence of window to wall ratio and window orientation in Tripoli, Libya. J. Build. Eng. 11 (April), 82–86. doi:10.1016/j.jobe.2017.04.003
Amaral, A. R., Rodrigues, E., Gaspar, A. R., and Gomes, Á. (2016). A thermal performance parametric study of window type, orientation, size and shadowing effect. Sustain. Cities Soc. 26, 456–465. doi:10.1016/j.scs.2016.05.014
Asfour, O. S. (2020). A comparison between the daylighting and energy performance of courtyard and atrium buildings considering the hot climate of Saudi Arabia. J. Build. Eng. 30, 101299. doi:10.1016/j.jobe.2020.101299
Azizibabani, M., Bemanian, M., and Yeganeh, M. (2021). Investigation of the effects of applying social sustainability components on residential satisfaction. J. Sustain. Archit. Civ. Eng. 29 (2), 49–61. doi:10.5755/j01.sace.29.2.29217
Baenas, T., and Machado, M. (2017). On the analytical calculation of the solar heat gain coefficient of a BIPV module. Energy Build. 151, 146–156. doi:10.1016/j.enbuild.2017.06.039
Bruno, R. (2017). Optimization of glazing systems in non-residential buildings: the role of the optical properties of air-conditioned environments. Build. Environ. 126, 147–160. doi:10.1016/j.buildenv.2017.09.011
Byggregler, B., and Författningssamling, B. (2009). The national board of housing, building and planning. Karlskrona.
Choudhary, S. (2015). Analysis of energy conservation of an institutional building using design builder software. Int. J. Recent Adv. Mech. Eng. 4 (1), 133–139. doi:10.14810/ijmech.2015.4112
Ghanbari, S., Yeganeh, M., and Bemanian, M. (2022). Architecture typology of rural plain houses based on formal features, case study: (talesh, Iran). Front. Built Environ. 8, 856567. doi:10.3389/fbuil.2022.856567
Goharian, A., Daneshjoo, K., Shaeri, J., Mahdavinejad, M., and Yeganeh, M. (2023). A designedly approach to daylight efficiency of central light-well; combining manual with NSGA-II algorithm optimization. Energy 276, 127402. doi:10.1016/j.energy.2023.127402
Goharian, A., Daneshjoo, K., and Yeganeh, M. (2022). Standardization of methodology for optimizing the well aperture as device (reflector) for light-wells; A novel approach using Honeybee and Ladybug plugins. Energy Rep. 8, 3096–3114. doi:10.1016/j.egyr.2022.01.176
Goia, F. (2016). Search for the optimal window-to-wall ratio in office buildings in different European climates and the implications on total energy saving potential. Sol. Energy 132, 467–492. doi:10.1016/j.solener.2016.03.031
Goia, F., Haase, M., and Perino, M. (2013). Optimizing the configuration of a façade module for office buildings by means of integrated thermal and lighting simulations in a total energy perspective. Appl. Energy 108, 515–527. doi:10.1016/j.apenergy.2013.02.063
Halawa, E., Gha, A., Gha, A., Trombley, J., Hassan, N., Baig, M., et al. (2017). A review on energy conscious designs of building façades in hot and humid climates: lessons for (and from) Kuala Lumpur and Darwin. Renew. Sustain. Energy Rev. 82, 2147–2161. doi:10.1016/j.rser.2017.08.061
He, Q., Hossain, M. U., Ng, S. T., and Augenbroe, G. (2021). Identifying practical sustainable retrofit measures for existing high-rise residential buildings in various climate zones through an integrated energy-cost model. Renew. Sustain. Energy Rev. 151, 111578. doi:10.1016/j.rser.2021.111578
Hoseinzadeh, S. (2019). Thermal performance of electrochromic smart window with nanocomposite structure under different climates in Iran. Micro Nanosyst. 11 (2), 154–164. doi:10.2174/1876402911666190218145433
Ilbeigi, M., Ghomeishi, M., and Dehghanbanadaki, A. (2020). Prediction and optimization of energy consumption in an office building using artificial neural network and a genetic algorithm. Sustain. Cities Soc. 61, 102325. doi:10.1016/j.scs.2020.102325
Jahanbani, H., Shui, L. T., Bavani, A. M., and Ghazali, A. H. (2011). Uncertainty of climate change and its impact on reference evapotranspiration in Rasht City, Iran. J. Water Clim. Change 2 (1), 72–83. doi:10.2166/wcc.2011.055
Košir, M., Gostiša, T., and Kristl, Ž. (2017). Influence of architectural building envelope characteristics on energy performance in Central European climatic conditions. J. Build. Eng. 15, 278–288. doi:10.1016/j.jobe.2017.11.023
Kottek, M., Grieser, J., Beck, C., Rudolf, B., and Rubel, F. (2006). World map of the Köppen-Geiger climate classification updated. Meteorol. Z. 15 (3), 259–263. doi:10.1127/0941-2948/2006/0130
Krarti, M., Erickson, P. M., and Hillman, T. C. (2005). A simplified method to estimate energy savings of artificial lighting use from daylighting. Build. Environ. 40, 747–754. doi:10.1016/j.buildenv.2004.08.007
Lee, J. W., Jung, H. J., Park, J. Y., Lee, J. B., and Yoon, Y. (2013). Optimization of building window system in Asian regions by analyzing solar heat gain and daylighting elements. Renew. Energy 50, 522–531. doi:10.1016/j.renene.2012.07.029
Mahiwal, S. G., Bhoi, M. K., and Bhatt, N. (2021). Evaluation of energy use intensity (EUI) and energy cost of commercial building in India using BIM technology. Asian J. Civ. Eng. 22 (5), 877–894. doi:10.1007/s42107-021-00352-5
Mardani, M., Hoseinzadeh, S., and Garcia, D. A. (2024). Developing particle-based models to predict solar energy attenuation using long-term daily remote and local measurements. J. Clean. Prod. 434, 139690. doi:10.1016/j.jclepro.2023.139690
Marino, C., Nucara, A., and Pietrafesa, M. (2017). Does window-to-wall ratio have a signi fi cant e ff ect on the energy consumption of buildings? A parametric analysis in Italian climate conditions. J. Build. Eng. 13 (June), 169–183. doi:10.1016/j.jobe.2017.08.001
Misiopecki, C., Bouquin, M., Gustavsen, A., and Jelle, B. P. (2017). Thermal modeling and investigation of the most energy-efficient window position. Energy and Build. 158, 1079–1086. doi:10.1016/j.enbuild.2017.10.021
Motie, M. R., Yeganeh, M., and Bemanian, M. R. (2023). Assessment of greenery in urban canyons to enhance thermal comfort and air quality in an integrated seasonal model. Appl. Geogr. 151, 102861. doi:10.1016/j.apgeog.2022.102861
Noaman, D. S., Moneer, S. A., Megahed, N. A., and El-Ghafour, S. A. (2022). Integration of active solar cooling technology into passively designed facade in hot climates. J. Build. Eng. 56, 104658. doi:10.1016/j.jobe.2022.104658
Persson, M., Roos, A., and Wall, M. (2006). Influence of window size on the energy balance of low energy houses. Energy Build. 38, 181–188. doi:10.1016/j.enbuild.2005.05.006
Pilechiha, P., Mahdavinejad, M., Pour Rahimian, F., Carnemolla, P., and Seyedzadeh, S. (2020). Multi-objective optimisation framework for designing office windows: quality of view, daylight and energy efficiency. Appl. Energy 261, 114356. doi:10.1016/j.apenergy.2019.114356
Sakhaei, H., Yeganeh, M., and Afhami, R. (2020). Quantifying stimulus-affected cinematic spaces using psychophysiological assessments to indicate enhanced cognition and sustainable design criteria. Front. Environ. Sci. 10, 832537S. doi:10.3389/fenvs.2022.832537
Sharbafian, M., Yeganeh, M., and Baradaran Motie, M. (2024). Evaluation of shading of green facades on visual comfort and thermal load of the buildings. Energy Build. 317, 114303. doi:10.1016/j.enbuild.2024.114303
Spanodimitriou, Y., Ciampi, G., Scorpio, M., Mokhtari, N., Teimoorzadeh, A., Laffi, R., et al. (2022). Passive strategies for building retrofitting: performances analysis and incentive policies for the Iranian scenario. Energies 15 (5), 1628. doi:10.3390/en15051628
Taleb, H. M., and Sharples, S. (2011). Developing sustainable residential buildings in Saudi Arabia: a case study. Appl. Energy 88 (1), 383–391. doi:10.1016/j.apenergy.2010.07.029
Tuhus-Dubrow, D., and Krarti, M. (2010). Genetic-algorithm based approach to optimize building envelope design for residential buildings. Build. Environ. 45 (7), 1574–1581. doi:10.1016/j.buildenv.2010.01.005
Keywords: window-to-wall ratio, optimization, energy consumption, residential building, Rasht
Citation: Bagheri S, Moradinasab H and Yeganeh M (2024) The effect of window proportions in low-rise residential buildings on annual energy consumption in humid temperate climate (case study: Rasht city in Iran). Front. Energy Res. 12:1463678. doi: 10.3389/fenrg.2024.1463678
Received: 12 July 2024; Accepted: 19 September 2024;
Published: 27 September 2024.
Edited by:
Praveen Kumar Balachandran, Universiti Kebangsaan Malaysia, MalaysiaReviewed by:
Aggrey Mwesigye, University of Calgary, CanadaSiamak Hoseinzadeh, Sapienza University of Rome, Italy
Copyright © 2024 Bagheri, Moradinasab and Yeganeh. This is an open-access article distributed under the terms of the Creative Commons Attribution License (CC BY). The use, distribution or reproduction in other forums is permitted, provided the original author(s) and the copyright owner(s) are credited and that the original publication in this journal is cited, in accordance with accepted academic practice. No use, distribution or reproduction is permitted which does not comply with these terms.
*Correspondence: Hossien Moradinasab, bW9yYWRpbmFzYWJfaEB5YWhvby5jb20=; Mansour Yeganeh, eWVnYW5laEBtb2RhcmVzLmFjLmly