 Jifeng Liang1
 Ye Cao
- 1State Grid Hebei Electric Power Research institute, Shijiazhuang, Hebei, China
- 2School of Electronic and Information Engineering, Xi’an Jiaotong University, Xi’an, China
The traditional short circuit ratio index does not consider the impact of energy storage devices (ESDs) and cannot be used for the collaborative optimization of ESDs and renewable energy sources (RESs). Therefore, this paper proposes a novel synergistic capacity short circuit ratio (SCSCR) index, which can reflect the interaction between multiple RESs and ESDs on each bus under different capacities. Based on the proposed SCSCR, a coordinated optimization method of RESs and ESDs is proposed. It ensures system strength while determining the optimal location and capacity proportion of RESs and ESDs. Firstly, the location and capacity proportion of RESs are obtained through optimization method because the system strength is mainly determined by RESs connection points. Secondly, the optimal location and capacity proportion of the ESDs are found under the optimal configuration of the RESs. The proposed optimization method ensures the system strength while obtaining the optimal location and optimal capacity proportion of RESs and ESDs. Finally, the simulation results verify the effectiveness of this method on the IEEE 9 bus and 39 bus systems, providing reference for the site selection and efficient operation of RESs and ESDs.
1 Introduction
Under the background of the rapid development of new energy sources, issues of power system stability have gradually emerged, scholars have conducted extensive research (Wang et al., 2024; Kumar et al., 2013; Wang et al., 2022; Han et al., 2008). The continuous increase in the number of renewable energy sources (RESs), such as photovoltaic and wind power stations, had a significant impact on the stability of power transmission. RESs exhibited uncertainty and variability, with their power generation being influenced by factors like weather and seasons, potentially leading to fluctuations in the frequency and voltage of the power system (Kumar, 2024). This caused greater challenges for the system in terms of dispatching and balancing supply and demand (Kumar et al., 2018; Satapathy and Kumar, 2019a). When a substantial integration of RESs occurs at weak points, it can uncover undesirable stability issues, particularly concerning voltage stability and quality, potentially leading to significant system failures (Wu et al., 2017; Satapathy and Kumar, 2019b).
System strength denotes the capacity of the interconnection point between the power grid and renewable energy sources to maintain voltage stability and quality (IEEE guide for planning DC, 1997). When solar and wind energy are integrated into the grid intermittent, they introduce variability and uncertainty, which can challenge voltage stability and quality. It is crucial to identify and address these vulnerabilities by precisely measuring and assessing system strength to effectively guide power grid planning, operations, and dispatch, thereby ensuring the safe, efficient, and reliable power supply of the new energy grid.
Short circuit ratio (SCR) is an important indicator for evaluating the strength of the power grid, and its simple and intuitive characteristics provide important references for power grid planning and operation (Connection of Wind Farms to, 2016; Wang et al., 2020a). The critical short circuit ratio (CSCR) is defined as the SCR corresponding to the critical stable state of the system voltage, which can be used as a critical value to distinguish weak systems (Yu et al., 2021).
When renewable power plants electrically close, they interact with each other. The impact increases with the increase of RES proportion (Wang et al., 2020b). However, the traditional SCR calculation methods overlook the interactions between renewable energy power plants. In this case, the SCR calculation method may provide inaccurate estimates of system strength at the RES interconnection point (Zhang et al., 2014). A generalized effective short circuit ratio (GESCR) index was proposed to address the contradictions encountered in early indicators in empirical reasoning (Xiao et al., 2019). But this indicator was too complex to be applied to large-scale power systems.
To address the issue of strength assessment in multi-machine systems, the weighted short-circuit ratio (WSCR) method developed by ERCOT (IEEE guide for planning DC, 1997) and (Schmall et al., 2015), and the composite short circuit ratio method developed by GE (Fernandes et al., 2015) and (Minnesota Renewable Energy Integration and, 2014) considered the impact of RES interactions on system strength. However, the above-mentioned SCR assumed that all power electronic devices are connected to the same bus, which can not reflect the true characteristics of power systems. To address the above issues, the SCR was generalized in Dong et al., (2018); Weifang et al., (2010), multi-infeed short circuit ratio (MSCR), generalized short circuit ratio (gSCR), and Critical generalized short circuit ratio (CgSCR) were defined to quantify the system strength of multi-infeed systems. In Wu et al. (2017), considering the impact of interactions between multiple RESs at different buses on system strength, a site-dependent short circuit ratio (SDSCR) was proposed, which can more accurately evaluate system strength based on distance. However, the SCR evaluation in the above literature mainly focused on the interaction between RESs, ignoring the impact of energy storage devices (ESDs), electric vehicles, etc., on system strength. There are a large number of ESDs in the new power system, and their interaction with RESs will affect system stability. Especially for electric vehicles, their charging and discharging times are more variable and uncontrolled, which has a greater impact on system stability (Kumar et al., 2023a; Kumar et al., 2023b).
Planning and evaluation are two important parts for the investment, operations and benefits of the renewable energy power projects (Li et al., 2019; Kumar et al., 2016). Wen et al. (2015) proposed a novel method for transmission network expansion planning taking into account uncertainties of both loads and renewable generations. Yu et al. (2009) proposed a chance constrained formulation to tackle the uncertainties of load and wind turbine generator in transmission network expansion planning, which can calculate the uncertainty in transmission grid expansion planning more efficiently. But most of the above work focused on the perspective of economic dispatch. There is little research on how to use SCR index for collaborative optimization allocation of RESs and ESDs in the system.
Base on SDSCR, (Li et al., 2024) expanded the SCR by considering the interaction between ESDs and RESs, and proposed integrated short circuit ratio (ISCR). However, ISCR did not obtain the optimal capacity from the perspective of RESs and ESDs capacity proportion. Therefore, based on this, this paper considers the impact of different capacity proportion on system strength and proposes SCSCR. Based on SCSCR, a coordinated optimization method of RESs and ESDs is proposed, which can determine the optimal capacity proportion and optimal installation location simultaneously.
The main contributions of this paper are listed as follows:
(1) A novel system strength evaluation index SCSCR is proposed, which considers the interaction between RESs and ESDs at different capacities in the system, making it more accurate for evaluating weak points in the system.
(2) A coordinated optimization method based on SCSCR is proposed to obtain the optimal location and capacity of RESs and ESDs while ensuring the system strength of RES buses.
The rest of the paper is organized as follows. Section 2 proposes SCSCR for system strength assessment of multi RESs and ESDs system. Section 3 proposed a coordinated optimization method of RES and ESDs based on SCSCR. Conclusions are drawn in Section 4.
2 Proposed SCSCR
2.1 Traditional SCR
The strength of the power grid system on one bus can be evaluated using SCR. When RES is connected to the grid system at the bus i, the SCR at the bus can be defined in (1) (IEEE guide for planning DC, 1997). The tradition SCR is suitable for measuring the system strength of a single machine grid connected system, but it cannot accurately evaluate the system strength of a multi machine system because it does not consider the mutual influence between each grid connected unit (Xiao et al., 2019).
where
When the reference voltage in the system is the rated voltage
Substituting
Generally speaking, the larger the
The SCR defined in (1) only considers the impact of a single RES output power, but the interaction between multiple RESs in the system can affect the system strength. SDSCR was proposed in (Wu et al., 2017) to consider the effects of interactions between multiple RESs. SDSCR is defined as:
where
SDSCR considers the interaction between RESs, expanded the definition of SCR to make it more accurate in evaluating system strength, and provides reference for optimizing the location and capacity of RESs. However, SDSCR did not consider the interaction between ESDs and RESs, and can only reflect the system strength when the power of the power equipment in the system is given. It cannot dynamically reflect the impact of changes in power equipment capacity on the system strength. Therefore, this paper proposes a novel SCSCR index that considers the impact of power devices with different capacity proportions on the strength of the bus in the system.
2.2 Proposed synergistic capacity short circuit ratio (SCSCR)
The multiple RESs and ESDs are connected to the grid as shown in Figure 1. ESD plays an important role in flexible adjustment of RESs (Wang et al., 2021). When ESD operates in the discharged state, it can output energy to the system and can be considered as a power source. The network equation can be expressed as:
where
where the

Figure 1. Multiple RESs and ESDs-connected grid system.
Equation 2 can be transformed into
where
Equation 3 is the same power flow equation for a dual bus system, as shown in Figure 1.
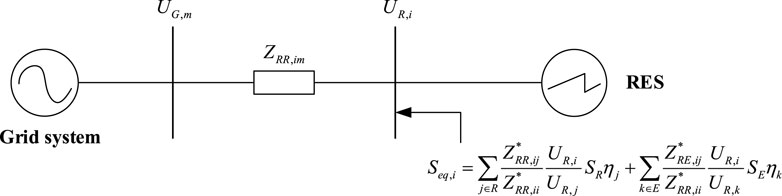
Figure 2. Equivalent model of system with multiple RESs and ESDs connected.
According to Wu et al. (2017), the boundary conditions for voltage stability in power systems can be derived as
where
In the distribution network with multiple new energy sources connected, we defined the SCSCR based on Equation 6 to quantify the strength of the system. SCSCR can reflect the distance to the voltage stability boundary.
When ESD operates in a discharge state, SCSCR is represented as:
where
It can be seen from (7) that SCSCR is a generalized form of SCR defined in (1), when only one RES is connected to the power system, the power of other RESs and ESDs in the equation is zero. At this time, the expression of SCSCR is simplified to the same expression as SCR in (1), which means that SCR is actually a special case of SCSCR in the case of a single RES connection. In addition, SCSCR retains the same physical interpretation as SCR, which evaluates system strength based on the distance between the system and the voltage stability limit.
3 The proposed coordinated optimization method of RESs and ESDs
The coordinated deployment of RES and ESD can significantly enhance the flexibility and efficiency of resource utilization. However, the integration of a substantial number of RES and ESD into weak power grids may lead to voltage stability issues. System strength is highly correlated with the installation locations and capacities of RES and ESD. Therefore, there is a necessity to optimize the configuration of these, identifying the ideal locations and proportions to ensure adequate system strength.
RESs serve as the primary power output within the distribution network, characterized by their relatively fixed quantity and location. In contrast, ESD predominantly fulfill an auxiliary regulatory function, typically featuring smaller capacities and installation locations that are less constrained by geographical considerations (Li et al., 2024). So we evaluate the system strength by calculating the SCSCR of RES buses.
A coordinated optimization method based on the SCSCR is proposed. Firstly, at the upper level, the focus is on optimizing the location and capacity of RES. Secondly at the lower level, the optimization process is applied to the location and capacity of ESD. This ensures that the SCSCR value at the RES buses is maximized, thereby determining the optimal location and capacity proportion that enhances the overall system strength of the bus.
In terms of upper-level optimization, the influence of ESD is not considered, given that ESD can be flexibly configured and typically have a smaller capacity compared to RES. Additionally, the number of RES installations is generally fixed. It is also assumed that the system operates under normal working conditions, leading to voltages at each bus being close to their nominal values. The SCSCR, as defined in Equation 7, has been reformulated as presented in Equation 8. For the lower level optimization of ESD, the impact of these devices is taken into account, and the SCSCR value at the RES bus should be computed using Equation 7.
The optimal location and optimal proportion standards for RESs and ESDs should follow the following principles:
Firstly, when RES or ESD are installed at different buses, the total capacity of several RES and ESD in the system is kept constant, while the capacity proportions are changed to calculate the SCSCR. This process determines the minimum value of SCSCR (MSCSCR) at the RES bus for each installation case. The optimal installation configuration corresponds to the case where the MSCSCR reaches its maximum value. The maximization expression for MSCSCR is presented in Equation 9, where
The multi-source coordinated optimization method flowchart and steps are described in Figure 3 and Algorithm 1, respectively. The installation case is obtained from Equation 10
where
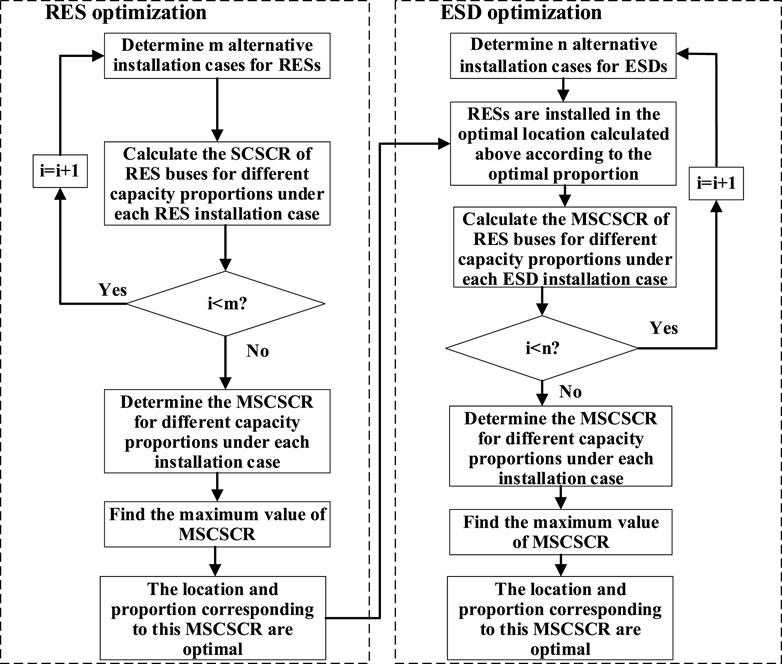
Figure 3. Optimization flowchart of the proposed method for RESs and ESDs.
Algorithm 1.Optimization process.
1. Determine m alternative installation cases for RESs
2. Iteration:i ≤ m
Calculate the SCSCR of RES buses for different capacity proportions under each RES installation case i = i+1
3. Determine the MSCSCR for different capacity proportions under each installation case
4. Find the maximum value of MSCSCR
5. The location and proportion corresponding to this MSCSCR are optimal
6. Determine n alternative installation cases for ESDs
7. Iteration:i ≤ n
RESs are installed in the optimal location calculated above according to the optimal proportion
Calculate the MSCSCR of RES buses for different capacity proportions under each ESD installation case i = i+1
8. Determine the MSCSCR for different capacity proportions under each installation case
9. Find the maximum value of MSCSCR
10. The location and proportion corresponding to this MSCSCR are optimal
4 Case studies
4.1 IEEE 9 bus system
To validate the efficacy of the multi-source collaborative optimization technique proposed for distribution network planning utilizing SCSCR, we employed the IEEE 9 bus model to simulate a RES and ESD integrated distribution network. As depicted in Figure 4, bus 1 serves as an idealized voltage source, replicating the power system with adjustable frequency and voltage capabilities. The branch parameters are presented in per-unit values, the base voltage
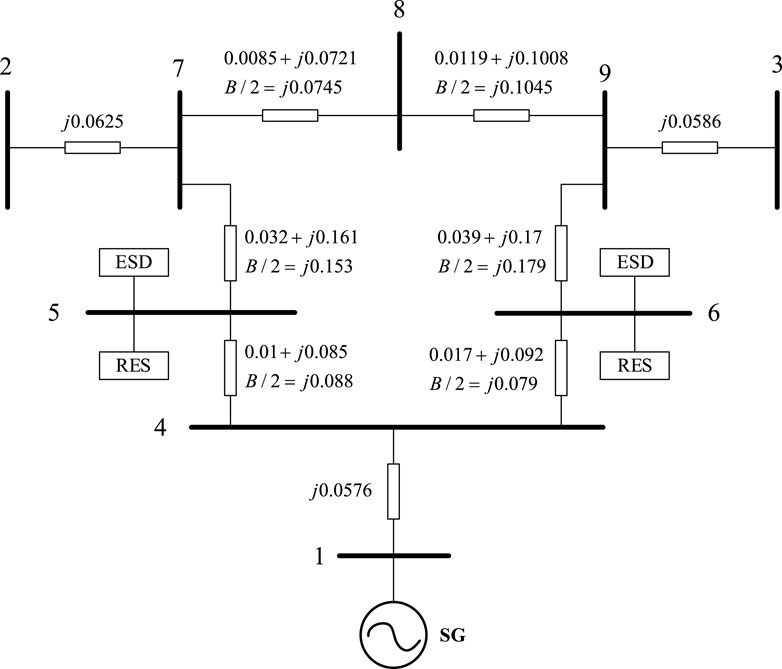
Figure 4. Modified IEEE 9 bus system.
4.1.1 The optimization of two RESs
The total capacity of two RES is 40 MW.When the total capacity of two RESs is constant and RESs are installed at different proportions on different buses, the value of MSCSCR is shown in Figure 5. As shown in Figure 5, the x-axis represents the percentage of RES1 in the total capacity of the two RESs. It can be seen that under different installation cases, as the capacity of RES1 changes, the MSCSCR in the RES bus changes, which indicates that the capacity of RES can affect the system strength. When two RESs are installed at bus 5 and 6 with the capacity proportion of
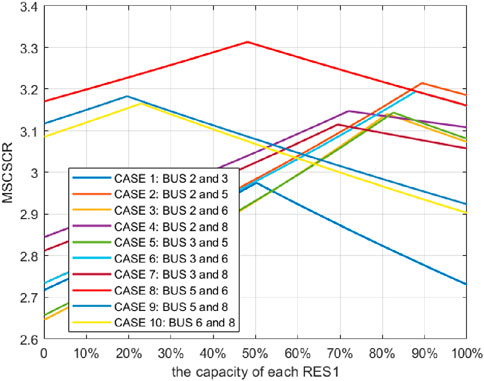
Figure 5. MSCSCR when changing RES1 capacity under different installation conditions.
4.1.2 The optimization with one ESD
We consider different cases of ESDs integration including the integrations of one ESD and two ESDs into system. Keep the total capacity of RESs and ESDs at 40 MW, and install RES1 and RES2 on bus 5 and 6 respectively with the capacity proportion of
Changing the ESD capacity proportion in each installation case, it can be seen from Table 1 that when ESD is installed at bus 6 with
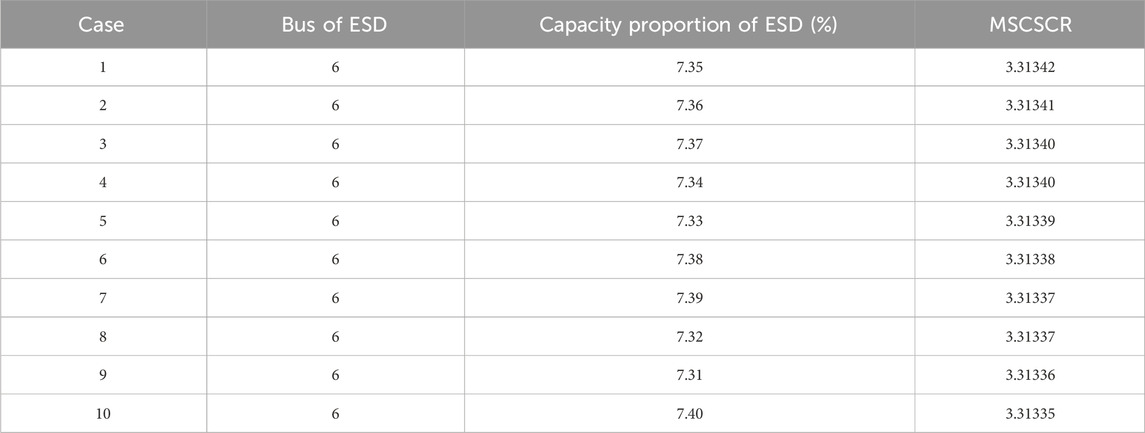
Table 1. MSCSCR for changing the proportion of one ESD capacity when ESD is installed at bus 6.
4.1.3 The optimization with two ESDs
Assuming RESs account for 80% of the total capacity and two ESDs account for 20%, changing the ESD capacity proportion under different installation cases, as shown in Table 2, when two ESDs are installed at bus 5 and 6 with
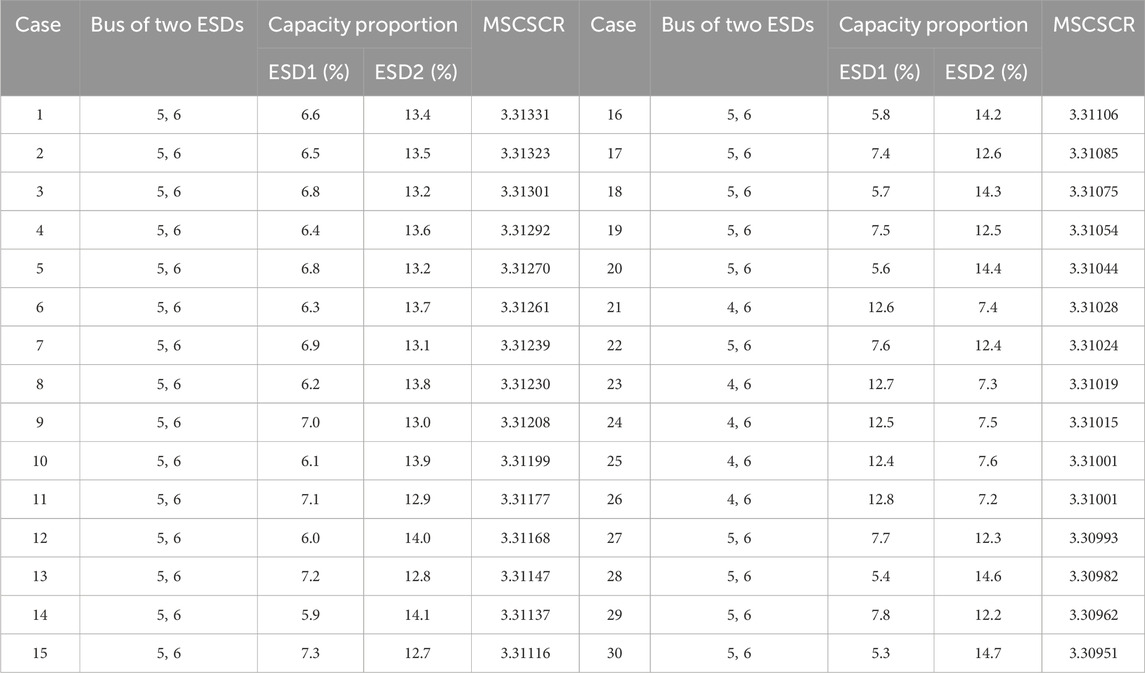
Table 2. MSCSR for changing the proportion of two ESDs capacity at different buses.
4.2 IEEE 39 bus system
This section further validates the effectiveness of the proposed method using the IEEE39 bus system, as shown in Figure 6. The system is divided into two regions for optimization, and bus 30 is used as the interconnection point with the power grid. The interaction between power devices clustered in the two regions is considered, and the optimal locations and capacities of RESs and ESDs in the two regions are obtained. The potential buses for RESs are 8, 31, 32, and39 in region 1 and 33, 34, 35, and 36 in region 2. The potential buses for ESDs are 8, 10, 11, 13, 31, and 33 in region 1 and 16, 19, 21, 22, 23, 33, and 35 in region 2.
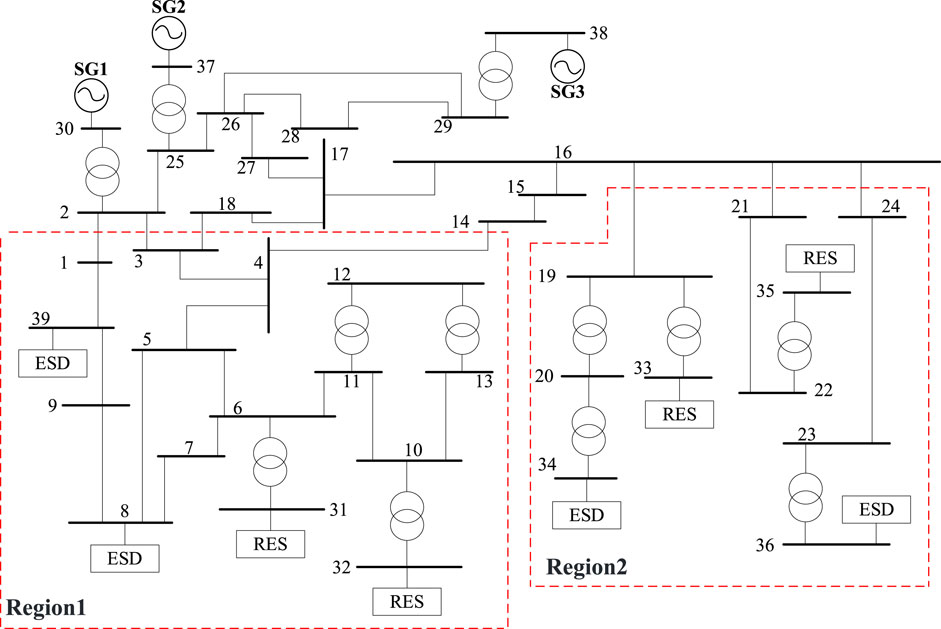
Figure 6. Modified IEEE 39 bus system.
When the total capacity of four RESs is fixed at 200 MW, RESs can be installed at different buses with different capacity proportions. The values of MSCSCR are shown in Table 3, and MSCSCR has the highest value in case 1, indicating that the optimal proportion of the four RESs is
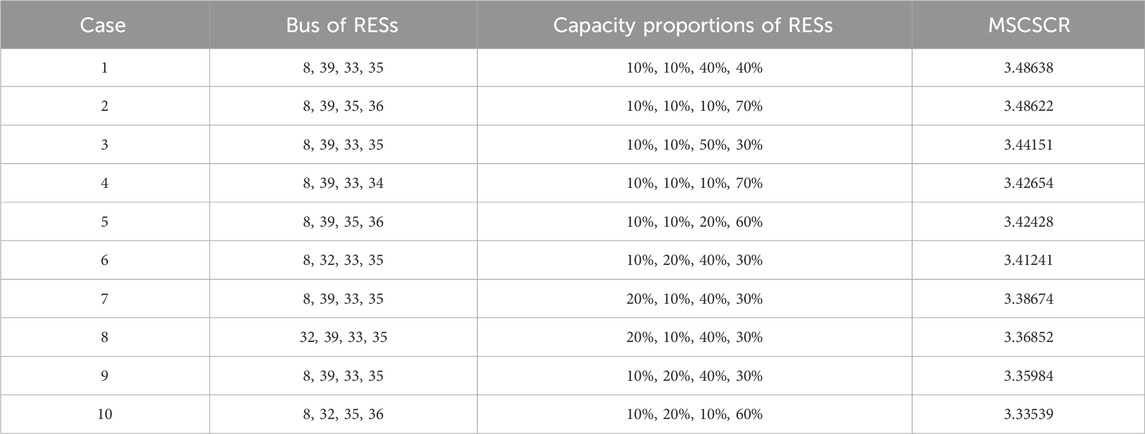
Table 3. MSCSCR for changing the proportion of four RESs capacity at different buses.
Assuming that RES accounts for 80% of the total capacity and two ESDs accounts for 20%, four RESs are installed at bus 8, 39, 33, and 35 with a capacity proportion of
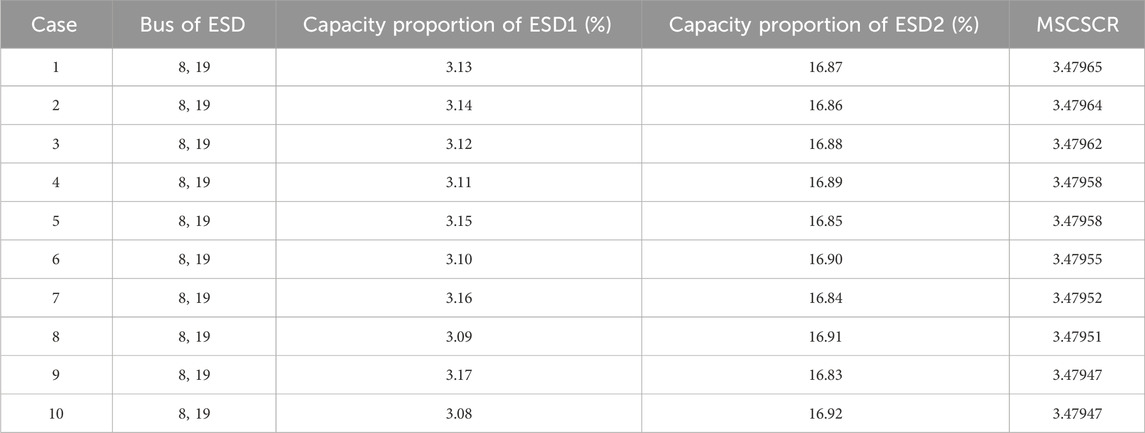
Table 4. MSCSR for changing the proportion of two ESDs capacity at different buses.
5 Conclusion
The traditional optimization of RESs and ESDs is based on economy dispatch, while for the power system, system stability is the most important. Therefore, this paper optimizes the location and capacity of RESs and ESDs based on a new system strength indicator. Based on theoretical analysis and simulation results, the following conclusions can be drawn:
1) A novel system strength evaluation index SCSCR has been proposed, which considers the interaction between RESs and ESDs of different capacities.
2) A coordinated optimization method has been proposed, which can maintain the system strength while obtaining the optimal location and capacity ratio in the optimized configuration of RESs and ESDs.
3) The simulation results have been provided to verify the effectiveness of the proposed method verified through IEEE 9 bus and 39 bus system simulations.
Data availability statement
The original contributions presented in the study are included in the article/supplementary material, further inquiries can be directed to the corresponding author.
Author contributions
JL: Writing–original draft. SR: Writing–original draft. YL: Writing–original draft. YC: Writing–review and editing.
Funding
The author(s) declare that financial support was received for the research, authorship, and/or publication of this article. This work was supported in part by the State Grid Hebei Electric Power Co., LTD. under the Science and Technology Project (Grant No. kj2023-068); and in par by the National Natural Science Foundation of China (Grant No. 62103322).
Conflict of interest
The authors declare that the research was conducted in the absence of any commercial or financial relationships that could be construed as a potential conflict of interest.
The authors declare that this study received funding from State Grid Hebei Electric Power Co., LTD. The funder had the following involvement in the study: study design, data collection and analysis.
Publisher’s note
All claims expressed in this article are solely those of the authors and do not necessarily represent those of their affiliated organizations, or those of the publisher, the editors and the reviewers. Any product that may be evaluated in this article, or claim that may be made by its manufacturer, is not guaranteed or endorsed by the publisher.
References
Dong, W., Xin, H., Wu, D., and Huang, L. (2018). Small signal stability analysis of multi-infeed power electronic systems based on grid strength assessment. IEEE Trans. Power Syst. 34, 1393–1403. doi:10.1109/TPWRS.2018.2875305
Fernandes, R., Achilles, S., and MacDowell, J. (2015). Report to NERC ERSTF for composite short circuit ratio (CSCR) estimation guideline. United States: GE Energy Consulting.
Hadavi, S., Mansour, M. Z., and Bahrani, B. (2021). Optimal allocation and sizing of synchronous condensers in weak grids with increased penetration of wind and solar farms. IEEE J. Emerg. Sel. Top. Circuits Syst. 11, 199–209. doi:10.1109/JETCAS.2021.3053554
Han, C., Huang, A. Q., Baran, M. E., Bhattacharya, S., Litzenberger, W., Anderson, L., et al. (2008). STATCOM impact study on the integration of a large wind farm into a weak loop power system. IEEE Trans. Energy Convers. 23, 226–233. doi:10.1109/TEC.2006.888031
IEEE guide for planning DC links terminating at AC location having low short-circuit capacity, IEEE Standards Board, 1997.
Kim, Y. K., Lee, G. S., Yoon, J. S., and Moon, S. I. (2022). Evaluation for maximum allowable capacity of renewable energy source considering ac system strength measures. IEEE Trans. Sustain. Energy 13, 1123–1134. doi:10.1109/TSTE.2022.3152349
Kumar, N. (2024). EV charging adapter to operate with isolated pillar top solar panels in remote locations. IEEE Trans. Energy Convers. 39, 29–36. doi:10.1109/TEC.2023.3298817
Kumar, N., Mulo, T., and Verma, V. P. (2013) “Application of computer and modern automation system for protection and optimum use of High voltage power transformer,” in 2013 international conference on computer communication and informatics. Coimbatore, India, 1–5. doi:10.1109/ICCCI.2013.6466257
Kumar, N., Panigrahi, B. K., and Singh, B. (2016). A solution to the ramp rate and prohibited operating zone constrained unit commitment by GHS-JGT evolutionary algorithm. Int. J. Electr. Power and Energy Syst. 81, 193–203. doi:10.1016/j.ijepes.2016.02.024
Kumar, N., Saxena, V., Singh, B., and Panigrahi, B. K. (2018). Intuitive control technique for grid connected partially shaded solar PV-based distributed generating system. IET Renew. Power Gener. 14, 600–607. doi:10.1049/iet-rpg.2018.6034
Kumar, N., Saxena, V., Singh, B., and Panigrahi, B. K. (2023b). Power quality improved grid-interfaced PV-assisted onboard EV charging infrastructure for smart households consumers. IEEE Trans. Consumer Electron. 69, 1091–1100. doi:10.1109/TCE.2023.3296480
Kumar, N., Singh, H. K., and Niwareeba, R. (2023a). Adaptive control technique for portable solar powered EV charging adapter to operate in remote location. IEEE Open J. Circuits Syst. 4, 115–125. doi:10.1109/OJCAS.2023.3247573
Li, D., Sun, Q., and Hu, J. (2024). Bi-level optimal allocation of virtual power plants considering grid strength using integrated short-circuit ratio. CSEE J. Power Energy Syst. doi:10.17775/CSEEJPES.2022.08040
Li, Y., Chi, Y., Wang, X., Tian, X., and Jianqing, J. (2019). “Practices and challenge on planning with large-scale renewable energy grid integration,” in 2019 IEEE 3rd conference on energy internet and energy system integration (EI2), 118–121. doi:10.1109/EI247390.2019.9062091
Minnesota renewable energy integration and transmission study final report, GE Energy Consulting, Schenectady, NY, USA, 2014. Available at: http://www.minnelectrans.com/documents/mritsreport.pdf
Satapathy, S. S., and Kumar, N. (2019a). Framework of maximum power point tracking for solar PV panel using WSPS technique. IET Renew. Power Gener. 14. doi:10.1049/iet-rpg.2019.1132
Satapathy, S. S., and Kumar, N. (2019b). “Modulated perturb and observe maximum power point tracking algorithm for solar PV energy conversion system,” in 2019 3rd International Conference on Recent Developments in Control, Automation and Power Engineering (RDCAPE). Noida, India, 345–350. doi:10.1109/RDCAPE47089.2019.8979025
Schmall, J., Huang, S. H., Li, Y., Billo, J., Conto, J., and Zhang, Y. (2015). Voltage stability of large-scale wind plants integrated in weak networks: an ERCOT case study. 2015 IEEE Power and Energy Society General Meeting, 1–5. doi:10.1109/PESGM.2015.7286224
Wang, R., Sun, Q., Hu, W., Li, Y., Ma, D., and Wang, P. (2021). SoC-based droop coefficients stability region analysis of the battery for stand-alone supply systems with constant power loads. IEEE Trans. Power Electron. 36, 7866–7879. doi:10.1109/TPEL.2021.3049241
Wang, R., Sun, Q., Ma, D., and Hu, X. (2020a). Line impedance cooperative stability region identification method for grid-tied inverters under weak grids. IEEE Trans. Smart Grid 11, 2856–2866. doi:10.1109/TSG.2020.2970174
Wang, R., Sun, Q., Zhang, P., Gui, Y., Qin, D., and Wang, P. (2020b). Reduced-order transfer function model of the droop-controlled inverter via Jordan continued-fraction expansion. IEEE Trans. Energy Convers. 35, 1585–1595. doi:10.1109/TEC.2020.2980033
Wang, R., Yu, X., Sun, Q., Li, D., Gui, Y., and Wang, P. J. (2024). The integrated reference region analysis for parallel DFIGs’ interfacing inductors. IEEE Trans. Power Electron. 39, 7632–7642. doi:10.1109/TPEL.2024.3361091
Wang, T., Wang, S., Ma, S., Guo, J., and Zhou, X. (2022). An extended continuation power flow method for static voltage stability assessment of renewable power generation-penetrated power systems. IEEE Trans. Circuits Syst. II Express Briefs 71, 892–896. doi:10.1109/TCSII.2022.3209335
Weifang, L., Yong, T., Guangquan, B., and Yao, S. (2010). “Voltage stability analysis of multi-infeed AC/DC power system based on multi-infeed short circuit ratio,” in 2010 international conference on power system Technology, 1–6. doi:10.1109/POWERCON.2010.5666123
Wen, J., Han, X., Li, J., Chen, Y., Yi, H., and Lu, C. (2015). Transmission network expansion planning considering uncertainties in loads and renewable energy resources. CSEE J. Power Energy Syst. 1, 78–85. doi:10.17775/CSEEJPES.2015.00010
Wu, D., Li, G., Javadi, M., Hong, M., and Jiang, J. N. J. (2017). Assessing impact of renewable energy integration on system strength using site-dependent short circuit ratio. IEEE Trans. Sustain. Energy 9, 1072–1080. doi:10.1109/TSTE.2017.2764871
Xiao, H., Li, Y., Shi, D., Chen, J., and Duan, X. (2019). Evaluation of strength measure for static voltage stability analysis of hybrid multi-infeed DC systems. IEEE Trans. Power Deliv. 34 (3), 879–890. doi:10.1109/TPWRD.2019.2901831
Yu, H., Chung, C. Y., Wong, K. P., and Zhang, J. H. (2009). A chance constrained transmission network expansion planning method with consideration of load and wind farm uncertainties. IEEE Trans. Power Syst. 24, 1568–1576. doi:10.1109/TPWRS.2009.2021202
Yu, L., Sun, H., Xu, S., Zhao, B., and Zhang, J. (2021). A critical system strength evaluation of a power system with high penetration of renewable energy generations. CSEE J. Power Energy Syst. 8, 710–720. doi:10.17775/CSEEJPES.2021.03020
Keywords: synergistic capacity short circuit ratio (SCSCR), system strength, coordinated optimization, renewable energy source (RES), energy storage device (ESD)
Citation: Liang J, Rong S, Liu Y and Cao Y (2024) Coordinated optimization method of renewable energy sources and energy storage devices based on synergistic capacity short circuit ratio. Front. Energy Res. 12:1467624. doi: 10.3389/fenrg.2024.1467624
Received: 20 July 2024; Accepted: 17 September 2024;
Published: 30 September 2024.
Edited by:
Xiao-Kang Liu, Huazhong University of Science and Technology, ChinaReviewed by:
Shichang Cui, Huazhong University of Science and Technology, ChinaMian Hu, Wuhan University of Science and Technology, China
Xiaoyuan Zheng, Hebei University of Technology, China
Copyright © 2024 Liang, Rong, Liu and Cao. This is an open-access article distributed under the terms of the Creative Commons Attribution License (CC BY). The use, distribution or reproduction in other forums is permitted, provided the original author(s) and the copyright owner(s) are credited and that the original publication in this journal is cited, in accordance with accepted academic practice. No use, distribution or reproduction is permitted which does not comply with these terms.
*Correspondence: Ye Cao, Y2FveWU2MkAxMjYuY29t