 Misganaw Abebe1
 Bonyong Koo
 Min-Geun Kim
- 1Department of Mechanical Engineering, Kunsan National University, Gunsan, Republic of Korea
- 2Department of Mechanical and Automotive Engineering, Seoul National University of Science and Technology, Seoul, Republic of Korea
- 3Alternative Fuels and Power System Research Center, Korea Research Institute of Ships and Ocean Engineering (KRISO), Daejeon, Republic of Korea
- 4University of Science and Technology, Daejeon, Republic of Korea
In a fuel cell, flow channels are crucial components responsible for various essential functions that enable the system to operate effectively. The design of a directly coupled flow channel in a Proton Exchange Membrane Fuel Cell (PEMFC) system, assuming deterministic parameters, has been extensively studied. However, this deterministic approach neglects the inherent uncertainties in system performance during real-life operation, resulting in potentially unreliable and suboptimal performance. To address this issue, we propose a reliability-based design optimization (RBDO) of the PEMFC’s channel structure, considering uncertainties in operating parameters. This paper presents a numerical model of the PEMFC in COMSOL, deterministic designs, reliability-based designs and a global sensitivity analysis on the PEMFC cell’s potential output and average water activity on the membrane. Although the RBDO approach shows a reduction in cell efficiency compared to the deterministic design, it significantly improves reliability, with increases from 60.92% to 95.10% for cell potential and from 79.31% to 96.85% for water activity.
1 Introduction
Fuel cells are a type of alternative energy technology that generates electricity by utilizing the reaction between hydrogen and oxygen. Because of their great efficiency in comparison to conventional combustion engines and their negligible emissions, these devices are particularly intriguing. The only waste products that they generate are heat and water, however, several challenging issues stand in the way of the extensive implementation of the PEMFC (Raj and Shamim, 2014; Hu et al., 2014). This calls for an improvement in PEMFC performance. A significant number of scholars have been working to improve the performance of PEMFCs throughout the last few decades. Two different approaches for PEMFC optimization were suggested such as the operating situation and the geometric structure of the device considering a single or multiple performance of the PEMFC.
Considering a single objective optimization (single performance), Peng et al. (2017) suggested a deterministic optimization algorithm to find the best operating configuration for PEMFC that would maximize its power density using a support vector machine surrogate model. Li et al. (2020) proposed an optimization approach that pairs a genetic algorithm with a three-dimensional, two-phase PEMFC model to optimize the partially blocked channel design for a PEMFC with a parallel flow field. The purpose of this study was to explore the impact that a blocked channel design with an increasing height arrangement has on the overall performance of the PEMFC as well as the local distributions. Fathy et al. (2021) suggested a new maximum power tracker configuration for PEMFC based on a proportional-integral-derivative controller tuned using a recent metaheuristic method of the salp swarm algorithm. Furthermore, they proposed a new formulation for the constraint objective function of the error between the fuel cell’s real input voltage and the voltage at maximum power. Al-Baghdadi and Al-Janabi (2007) introduced an algorithm that accurately computes local activation overpotentials, leading to an improved prediction of the local current density distribution. Wang et al. (2021) also offers a real-time power optimization technique based on active temperature control to maximize PEMFC output power under varying ambient circumstances. They also develop an enhanced temperature perturb and observe (P&O) system to consistently obtain maximum power while maintaining an appropriate temperature reference.
Furthermore, in various responses to system performance evaluations, researchers proposed a multi-objective optimization of the PEMFC system. Such as, Li et al. (2021), developed a framework for multi-objective optimization that can improve three PEMFC performance indicators at the same time: power density, system efficiency, and O2 distribution uniformity on the catalyst layer. A multi-objective genetic algorithm was also proposed by Liu et al. (2017) to optimize the operating conditions and channel structure of PEMFC. Liu et al. (2023) also used NSGA-II to find the optimal three PEMFC performance indicators: reactant flow uniformity, diffusion flux, and ohmic resistance, while considering both operating and geometric parameters. This study also developed a neural network as a surrogate model to replace PEMFC’s numerical model in COMSOL. Sohani et al. (2016) defined different optimization scenarios for a PEMFC, considering efficiency, power density, the levelized cost, and size as key performance criteria, and compared the optimum results together. This study then employed a proposed approach to find the best optimization scenario, considering the preferences for both transportation and stationary applications. Wu and Luo, 2023 developed a gray correlation analysis and response surface approach for a multi-objective PEMFC performance optimization design. Optimization goals for this approach included current density, oxygen distribution homogeneity, and system efficiency. Compared to the basic model, the three-performance metrics improve significantly with optimal operating conditions. Xu et al. (2024) also introduced a comprehensive performance assessment of a high-power PEMFC system that considers the diffusion of substances in the catalyst layer under variable loading. They also proposed an NSGA-based strategy to optimize the PEMFC system’s comprehensive performance.
Numerous researches also attempt to find an optimized channel structure to improve the geometric structure. Such as, Manso et al. (2011) investigated the performance of a PEMFC with a serpentine flow field design to determine how the channel cross-section aspect ratio, defined as the ratio of height to width, affects operation (performance). Furthermore, the results demonstrate that a higher channel cross-section aspect ratio leads to improved performance capabilities. To improve the cell performance of a PEMFC, Perng et al. (2009) also look into installing a transverse rectangular cylinder along the gas diffusion layer in the flow channel. The PEMFC effectiveness was investigated concerning the width of the cylinder and varying gap sizes. In summary, all the above studies investigated different ways to improve PEMFC’s performance in a deterministic manner without considering the uncertainty effect of the operating parameters. However, there were also a few studies conducted to examine the effect of operational parameter uncertainty on PEMFC performance.
Kannan et al. (2020) investigated the impact of a wide variety of input parameters, including electrochemical, physical, material, operating, and design parameters, on the performance of the PEMFC cell, as well as the management of water and thermal energy in all three regions of PEMFC operation: the activation loss region, the ohmic loss region, and the concentration loss region. Mawardi and Pitchumani (2006) also described a way to simulate how a fuel cell works when there is uncertainty, using a one-dimensional, non-isothermal description of the physical processes that control it. This study also created a sampling-based stochastic model and showed a parametric analysis to show how uncertainty in several operating parameters affects the fuel cell’s power density variation. Zhu et al. (2023) proposed a model that integrates Bayesian theory and the Gated Recurrent Unit (GRU) to determine how the fuel cell voltage decay trend varies according to operating parameter uncertainty. The results show that the proposed uncertainty quantification prediction method can help hydrogen energy devices to make better decisions. These studies show that the operating parameter’s uncertainties of PEMFC have a significant effect on the fuel cell’s performance.
This study suggests a reliability-based design optimization for the PEMFC channel structure, considering the operating parameter’s uncertainty. The cell potential is one of the most quantified effects of PEMFC due to the variability of the input parameters. In addition, this study considered investigating water management variability. As known, PEMFCs are categorized as high-temperature and low-temperature (LT) PEMFCs based on the membrane materials. In the LT-PEMFC, the oxygen reduction reaction has the slowest electrochemical kinetics. The LT-PEMFC’s cell voltage losses are caused by the overpotential at the cathode as a result of the sluggish reaction kinetics. A dual-phase water system is also presented in the fuel cell while it is running at a lower temperature and atmospheric pressure. This dual-phase water system must be tightly controlled due to the membrane’s stringent humidification needs, making water management complex. Flooding may also occur at this stage. Therefore, in addition to the cell potential, this study investigates the uncertain effect of operating parameters on the average water activity at the membrane during LT-PEMFC operation.
First, we developed the numerical model of the serpentine flow channel PEMFC in the COMSOL Multi-physics 6.1 version software and validated it using an experimental case, and the RBDO framework was developed. The primary contribution or novelty in this study takes the following form: (i) Gaussian processing regression (GPR) surrogate model is utilized to replace the computationally expensive COMSOL’s numerical model of PEMFC. This model could be used for each response, such as cell potential, efficiency, and the average amount of water in the membrane. (ii) Sobol’s global sensitivity analysis method is performed to identify and select the significant operating parameters. (iii) Using a genetic algorithm (GA), the optimal settings of the design variables are determined, and Monte Carlo simulations (MCS) are performed to determine how the input uncertain parameters affect PEMFC performance (cell potential and average water activity in the membrane). Furthermore, employing the GPR surrogate model will reduce the computational time while performing an MCS in the reliability analysis. When compared to the deterministic optimization, the proposed RBDO model shows more significant improvements in the performance reliability of the PEMFC due to the modification of the design variables.
The rest of the manuscript is also structured as follows: Section 2 discusses the numerical model in COMSOL, along with the governing equation. In Section 3, the proposed methods, including the surrogate model, sensitivity analysis, and RBDO formulation, have been explained. The results are discussed in Section 4, and finally, the conclusion is given in Section 5.
2 Materials and methods
2.1 Physical model
In this study, a three-dimensional geometry of a four-serpentine channel PEMFC is built in COMSOL (Figure 1). The geometric parameters are presented in Table 1. The model includes seven components, i.e., cathode gas channel, anode gas channel, gas catalytic layer, GDL, and proton exchange membrane. In the anode catalytic layer, hydrogen is catalytically decomposed into protons, which reach the cathode through the proton exchange membrane. The electrons generated by hydrogen decomposition go to the cathode through the load, which can generate electric power.
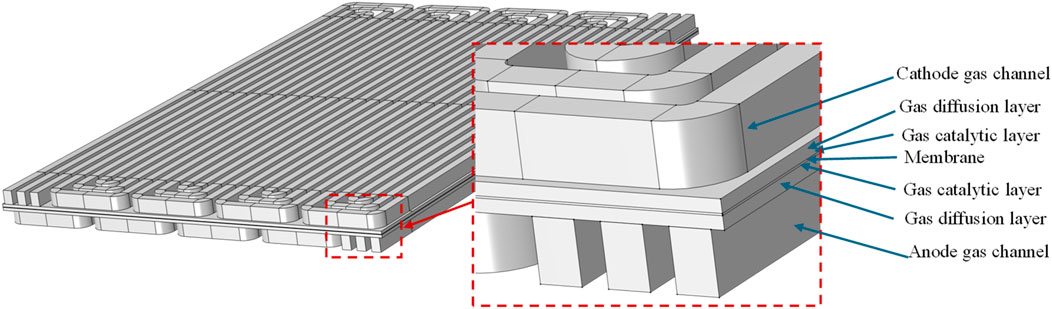
Figure 1. PEMFC 3D model.
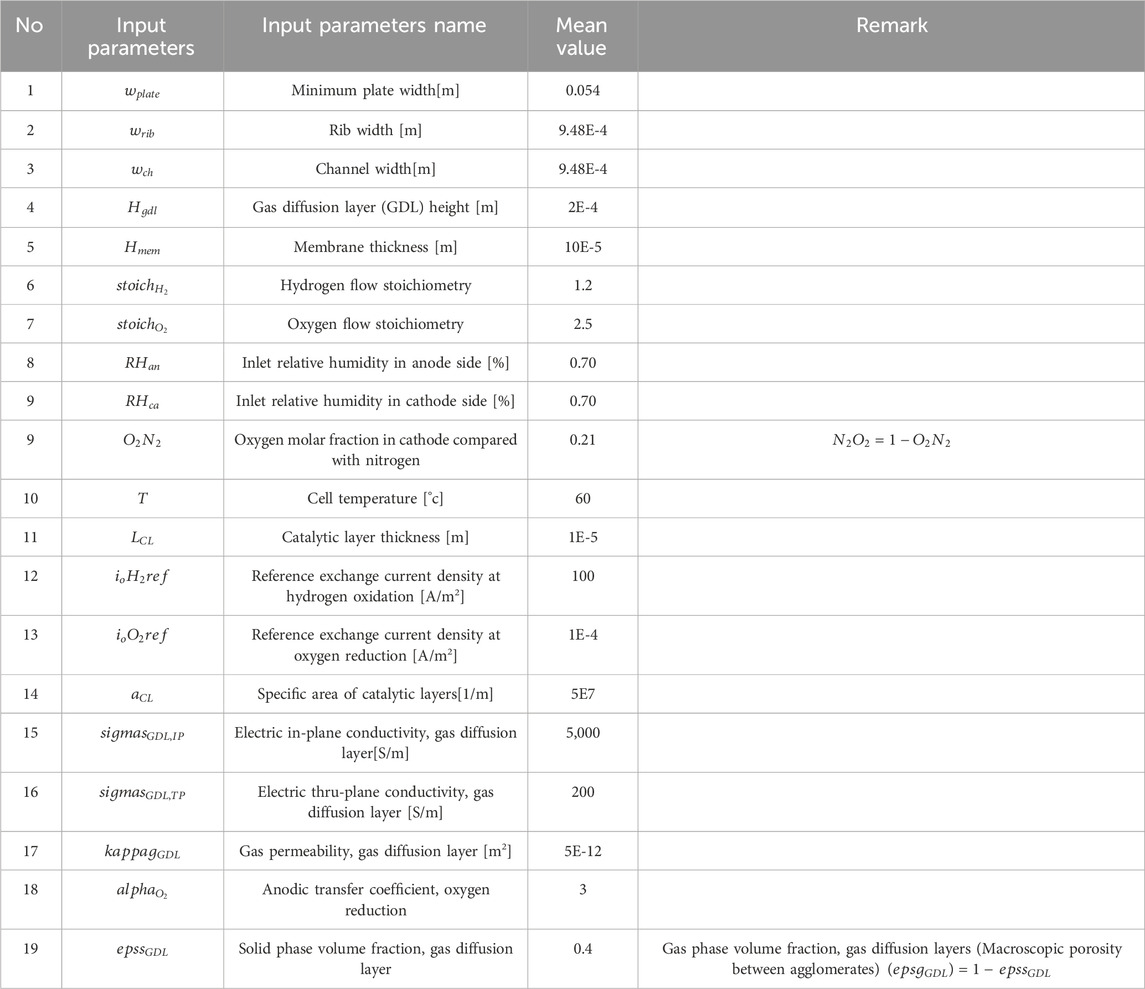
Table 1. List of the investigated parameters.
2.2 Governing equations
The models are assessed using the Batteries and Fuel Cells Module of COMSOL Multiphysics 6.1, and physical fields, such as Secondary Current Distribution, and Transportation of Concentrated Species, are used for the computational analysis. First, the model introduces several simplification assumptions. 1) All processes operate under steady-state conditions; 2) The gas phase adheres to the ideal gas law; 3) Anisotropic electronic conductivities are used in gas diffusion layers, which have conductivities that are about an order of magnitude larger in the in-plane (x and y) directions than in the through-plane (z); 4) We assume a laminar and incompressible flows in the channels and porous layers; 5) The solid-phase electronic potential and membrane ionic potential, respectively, control the transportation of electrons and protons. The Governing equations of the model in Equations 1–16 are discussed as follows:
The convection and diffusion terms for the gaseous species in the channels, gas diffusion layers, and catalyst layers are given as:
where
The diffusion coefficient of gaseous species in the diffusion layer is expressed as:
where the subscript
Momentum equation for the gaseous species in channels, gas diffusion layers, and catalyst layers:
where
A continuous function that is based on Darcy’s law is used to compute the average velocity of phase
where
Since there is no electrochemical reaction occurring in the gas diffusion layers, the source term of the electronic current has been set to zero, and it is expressed as:
where
In the same way, the source term for the ionic current in PEMFC is also zero, which is also given as follow:
The catalyst layer is the region in which the reaction takes place, and the ionic balance and electron balance can be defined in the following way:
where
where
where
In polymer electrolytes, there is an interconnection between ion transport and water transport. Because of this intercoupling, water content affects polymer electrolyte conductivity. When modeling the water-ion-polymer system, the transport equations for both ions and water molecules must also consider the water-ion friction forces. COMSOL used Weber-Newman’s (2004) concentrated solution theory to show how the three pairs of water molecules, the charge-carrying ion, and the immobilized polymer matrix talk to each other. The model uses the chemical potential of water in the polymer
where
2.3 The study’s objective functions
2.3.1 Cell potential
The cell potential (voltage) can be conveyed as the difference between the thermodynamically reversible cell voltage and the losses caused by overpotential,
where R is a gas constant (
2.3.2 Water activity
The water activity on either side of the membrane is computed by dividing the partial pressure by the corresponding saturation vapor pressure, which depends on the cell’s temperature.
where
2.3.3 System efficiency
Efficiency is one of the key characteristics of a fuel cell used to evaluate its performance. The system efficiency is defined as follows:
where
Where
where
where
where
The fuel inherent power (
where
2.4 Proposed methods
The proposed methods involved four main procedures, as shown in the flow chart of Figure 2. Initially, we created a numerical model for the serpentine PEMFC using COMSOL multi-physics software. To confirm the accuracy of this model, we conducted an actual experiment using the same variables. The study’s main goal is to develop a reliability-based design optimization model for the serpentine PEMFC flow channel, considering the fuel cell’s efficiency as an objective function, cell potential (voltage), and average water activity in the membrane as a constraint function. We initially examined 17 uncertain variables to identify the most significant ones for cell potential and water activity and then employed the surrogate-based Sobol’s sensitivity method. After selecting the significant uncertainty parameter for the respective constraint functions, the study conducted reliability-based design optimization using Monte Carlo simulation. The next section discusses the theory behind the proposed methods.
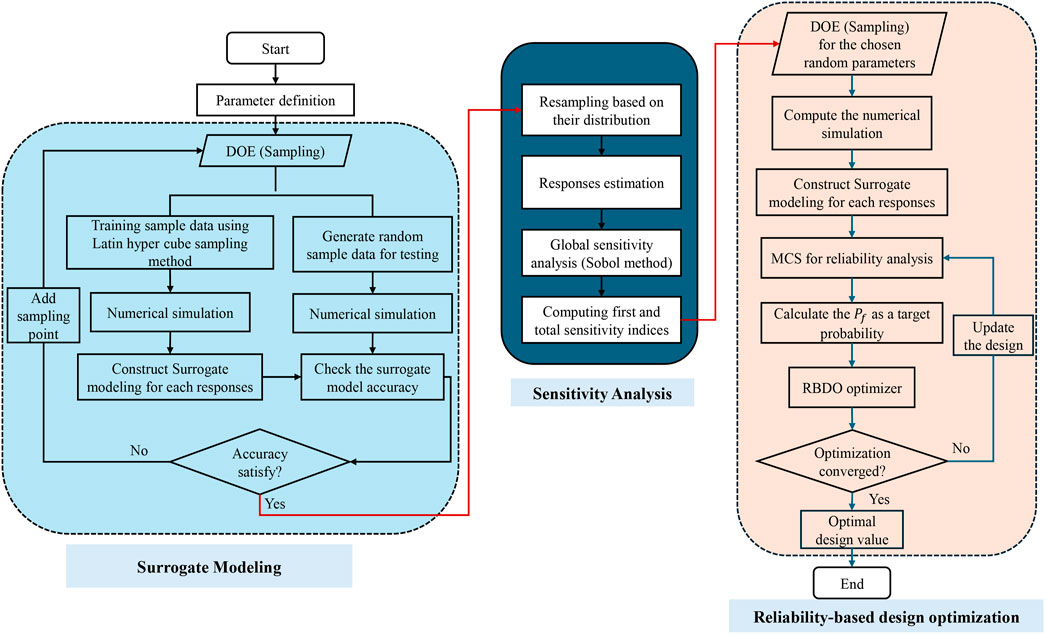
Figure 2. RBDO flow chart.
A surrogate model is an estimation of a high-fidelity model that is computationally accurate. Using a surrogate model, you can estimate the response for a given input without needing to carry out any additional experiments or run a high-fidelity simulation model. In other words, it can be used to estimate the output for a given set of inputs. It is also essential that the surrogate model be computationally effective. Gaussian processes (Rasmussen, 2003; Chen et al., 2023), neural network (Tripathy and Bilionis, 2018), and support vector machines (Xiang et al., 2017) are some of the most common approaches to developing a surrogate model. In this study, a Gaussian Process Regression (GPR) was employed as a surrogate model to replace the computationally expensive numerical model of PEMFC in COMSOL. We also used GPR to determine the feasibility of estimating the propagation of uncertain responses with different sets of uncertain operating parameters.
GPR is a type of supervised machine learning technique that requires only a few parameters to yield a prediction. A Gaussian process is defined as an endless extension of the multivariate normal distribution. The relationship between the input vector and the output parameter can be expressed as:
where
where the hyper-parameter
where
Out of the three hyper-parameters, we can use analysis to find the maximum likely values for μ and
By substituting Equations 32, 33 into Equation 31, the likelihood function becomes dependent only on hyper-parameter
We can now generate the prediction of
and its mean square error can be obtained using the following equation:
Based on this, the GPR models can predict
To check that the approximation model is accurate/precise enough, we use numerical measures of the root mean square error (RMSE) and coefficient of determination (
The RMSE formulation is given as:
where
The formulation for the
where
The impact of uncertain input parameters on the cell potential and water content on the membrane is measured by Sobol’ indices. Sobol global sensitivity analysis method is a variance-based sensitivity metrics (Sobol, 1993; Bergamini et al., 2019), which can be easily derived from the surrogate model that casts the input-output relationship. The Sobol’ indices simply represents the ratio of partial variances to the total variance of
where
The total effect is also derived as:
The total Sobol’s index,
2.5 Formulation of reliability-based design optimization
When there are uncertainties, the design optimization problem may involve both probabilistic and deterministic design criteria. Probabilistic criteria are frequently incorporated as constraints to limit the likelihood of failure. However, one can also employ them to establish objectives, like minimizing the cost’s function or maximizing the probability of achieving a specific value.
Given a set of optimization design variables
where,
The probability of failure,
where
The MCS approach provides for the estimation of the probability of failure, which is provided by:
where
According to Equation 41,
where
3 Results and discussion
3.1 Numerical model
The numerical model of the PEMFC was developed in COMSOL 6.1 Multiphysics software, Figure 3 shows a

Figure 3. (A) PEMFC 3D Model; (B) Bipolar plate used in PEMFC stack.
This model solves for the electrode and electrolyte phase potentials in the gas diffusion layers and the membrane, furthermore, it solves for the molar fractions, the gas pressure and the flow velocity on each side of the membrane. In addition, the model incorporates the permeability and electroosmotic drag mechanisms that are responsible for the transport of water through the membrane. We ran a single simulation to demonstrate the numerical model result based on the initial operating parameter value shown in Table 1.
3.1.1 Boundary conditions
The gas flow channel inlet boundary conditions are set to mass-flow rate at the anode and cathode inlets, as indicated in Figure 3, and the inlet mass flow rate is determined using Equations 14, 15. The pressures at the anode and cathode outlets have been set to the operating pressure. In the case of the other variables, the gradients are required to be zero. It is also assumed that all of the outer walls are non-slip walls with zero fluxes.
In addition, as shown in Table 1, we set the cell temperature as 60 °C, with the relative humidities of the hydrogen and air inlet streams humidified at 40% and 60%, respectively. We also set the molar flow rates of hydrogen and oxygen proportionate to the total current, with a 20% excess of hydrogen and a 150% excess of oxygen. This resulted in a stoichiometry for the flow of hydrogen that was 1.2 and a stoichiometry for the flow of oxygen that was 2.5. In addition to the operational parameters that are shown in Table 1, the boundary conditions and operating conditions of the model are summarized in Table 2.

Table 2. Summary of the boundary and operating conditions.
3.1.2 Mesh independency study
Firstly, we conducted a convergence study to assess the mesh independence of the developed numerical model. We examined five different mesh element size models with an operating current density of 0.6 A/cm2. The number of mesh elements employed was 66,685, 184,754, 231,472, 324,857, and 414,841, as depicted in Figure 4. As the result shows, the cell potential (voltage) values do not show a significant change between 324,857 and 414,841 mesh elements, so this study used 324,857 mesh elements for the simulation. The computational time for a single simulation requires about 4 min on an AMD Ryzen Threadripper 1950X 16-Core Processor with 3.40 GHz and 64.0 GB of RAM.

Figure 4. Mesh independency study of the numerical model.
3.1.3 Numerical model result discussion
Figure 5A shows the contour plot of water activity across the membrane while giving a 0.6 A/cm2 current density. As demonstrated, the water activity rises as it approaches the outflow. On the oxygen side, the increased water activity is a direct result of the water that is being created within the cell. Hydrogen depletion is the primary factor contributing to the increase in water activity on the hydrogen side. The contour plot of Figure 5A also shows that certain regions exhibit a water activity (relative humidity) value greater than one, which indicates the existence of condensation on the membrane. The membrane water flux in the z-direction is also shown in Figure 5B, As was seen, the flux is positive near the oxygen intake and the hydrogen outlet. This is because the hydrogen side is more humidified than the oxygen side, which indicates that water is carried from the hydrogen side to the oxygen side. When the oxygen input and hydrogen outlet are located near one another, the water is carried across the membrane in the negative z-direction.
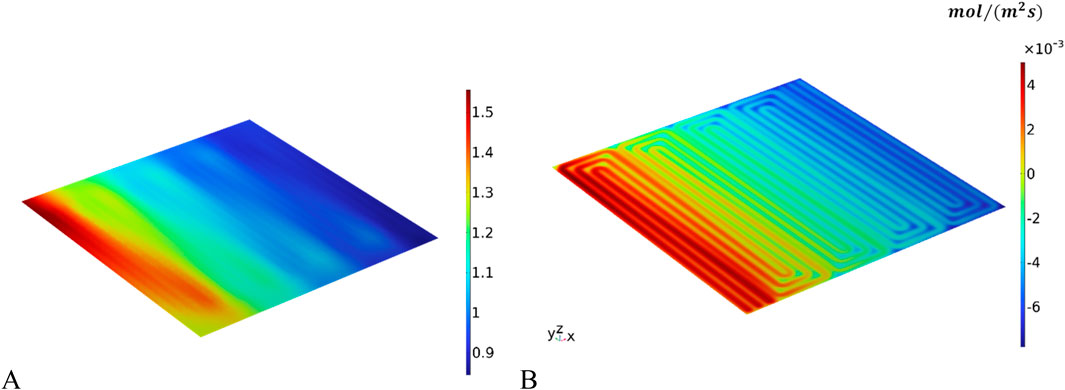
Figure 5. Water activities: (A) water activity (relative humidity) in the membrane; (B) water flux in the z-direction of the membrane.
3.1.4 Model validation
We performed three operating conditions under different temperatures and compared the numerical simulation results with the experimental data under the same working conditions. We evaluated the model for an initial case corresponding to a stack with a MEA total active area of
Figure 6 displays the effects of current density for both experimental and numerical results on the polarization and power density curves. The polarization curve, a widely used performance indicator for fuel cell systems, has a direct relationship between system efficiency and current density. As the current density goes up, the voltage and efficiency go down because of the irreversible effects of activation, ohmic, and concentration overpotentials. On the other hand, the power density reaches a maximum at a specific current density value and rises with increasing current density. Overall, we observe that the simulation results under three different working conditions are all in good agreement with the experimental data. Given that the error falls within an acceptable range, the model appears feasible in this case, leading to the use of a numerical model for this study.
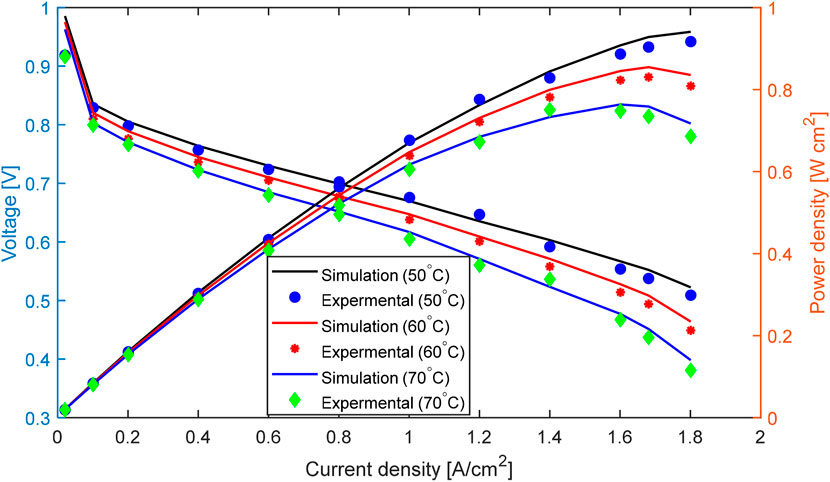
Figure 6. Comparison of simulation and experimental results for polarization and power density curves at three operating temperatures.
3.2 Sensitivity analysis
To investigate the uncertain effect and to choose the most significant noise (random) parameters for cell potential and average water activity at the membrane, first we developed a GPR model for each response. To train the model 100 simulations were conducted by applying a Latin hypercubic sampling method (Johnson et al., 1990). For testing 30 simulations were also conducted by generating a random sample dataset. The GPR model was developed for both cell potential and water activity. We calculated the R2 and RMSE values to assess the accuracy of the model. The results showed that the cell potential model had an R2 of 0.9909 and an RMSE of 0.0045, while the average water activity at the membrane model had an R2 of 0.9896 and an RMSE of 0.0134. Figure 7 displays the Actual vs. Prediction plot, which demonstrates a perfect match between the predicted and actual values of both cell potential and water activity. In addition, when we use the numerical simulation, the computing time for a single simulation takes approximately 4 min to yield the cell potential and water activity results. However, the GBR model will return the result in 0.001 s for a single run.
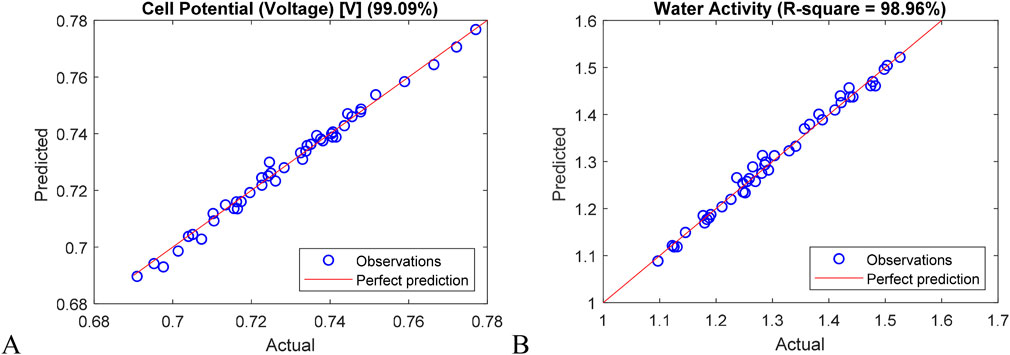
Figure 7. Actual vs. Prediction result comparison: (A) cell potential; (B) water activity at the membrane.
As discussed in Section 3, for sensitivity analysis, the study applied the Sobol method, which is one of the global variance-based sensitivity analysis methods. Figure 8 also displays the computed Sobol indices, demonstrating that parameters such as cell temperature (T), exchange current density at reference oxygen reduction (
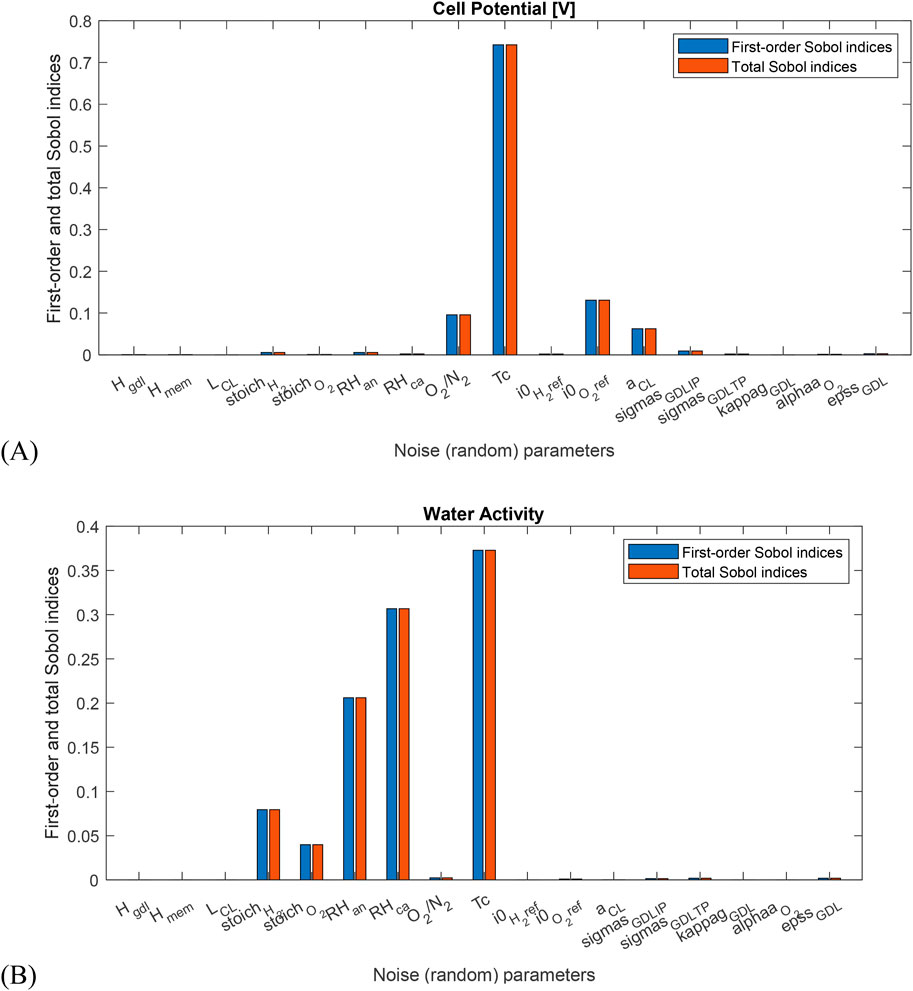
Figure 8. Sensitivity analysis with Sobol indices: (A) cell potential; (B) water activity.
3.3 Deterministic optimization
Deterministic optimization has been carried out after the selection of the most significant random (uncertain) variables for the respective target responses. The mean operating parameters are applied in addition to the design variables in deterministic optimization. The PEMFC’s channel structure is then optimized using a multi-objective optimization technique. Genetic algorithms and numerical simulation are combined in the multi-objective optimization method. The height of the channel
where
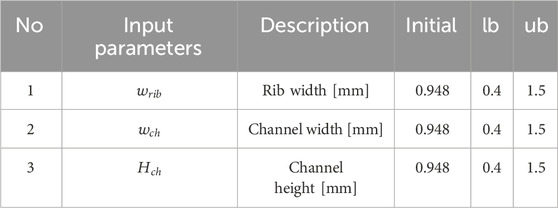
Table 3. Design variables information.
Based on the selected random and design variables the surrogate model has been developed for each objective function which is cell potential, average water activity at the membrane and efficiency. Firstly, we developed the GPR surrogate mode for each objective function by generating 100 training sample datasets using the hyper-Latin cube sampling method. Additionally, we generated 30 random datasets for model testing. Figure 9 shows the actual and prediction correlation plots for the testing dataset, along with the R2 value, demonstrating the accurate fitting of all three surrogate models.
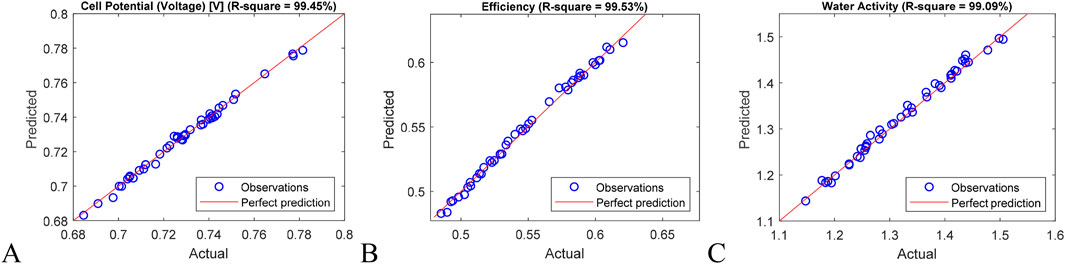
Figure 9. Actual vs. Predicted correlation for the selected parameters: (A) Cell potential; (B) Efficiency; (C) Water activity.
As shown in Equation 45, the goal is to maximize cell potential output and efficiency while minimizing the average water activity at the membrane. In this investigation, we employed the multi-objective genetic algorithm to determine the Pareto front among the three objective functions. In this study, we utilize the Pareto fraction and the distance function to regulate the elitism of the genetic algorithm. By giving preference to candidates which are placed relatively far away from the front, the Pareto fraction option and the distance function both help to preserve variety on the front. This is accomplished by giving preference to candidates which are located at a distance. The Pareto fraction option places a limit on the number of candidates which are located on the Pareto front. In this study, we used a population size of 500 individuals, a Pareto percentage of 0.3 (which is thirty percent of the population size) and applied to 100 generations.
Several multiple-criteria decision-making methods have been suggested for different fields to find the best combination to choose from the Parato front result. Such as the analytical hierarchy process (AHP), the technique for order of preference by similarity to the ideal solution (TOPSIS), and the multi-level linguistic decision-making methodology (multi-level LDM). Various studies have also compared these methods from different perspectives (Kolios et al., 2016). This specific study employs the TOPSIS method, which is a widely used methodology in numerous fields that offers faster computational time compared to other methods (Tzeng and Huang, 2011). For the same weight the result shows that, compared to the initial (mean value), the efficiency and cell potential have increased from 0.5510 to 0.5796 and from 0.7273 to 0.7572 V, respectively. Additionally, the average water content at the membrane has decreased from 1.3416 to 1.2872. Table 4 also summarizes the TOPSIS result for different weight of weights of efficiency, cell potential, and average water activity at the membrane.
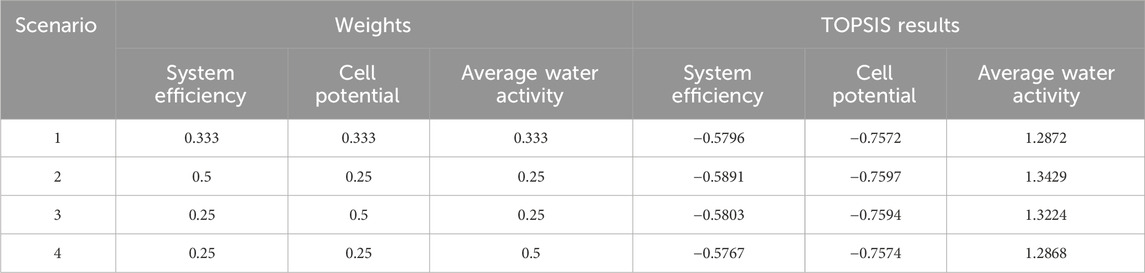
Table 4. TOPSIS results at different weights.
3.4 Reliability-based design optimization
Following the completion of the sensitivity analysis and deterministic optimization, we performed the RBDO by utilizing the significant random variables for each constraint function. Here we also employed the same surrogate model from the deterministic optimization. The study’s RBDO formulation is also given as follows:
where
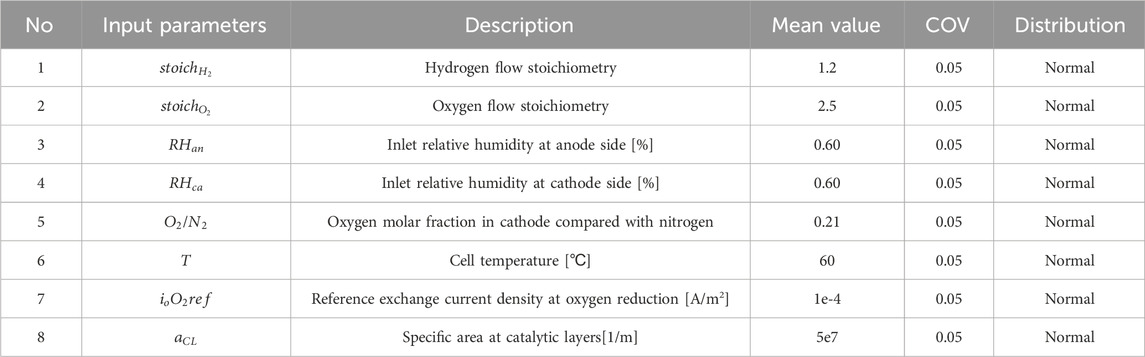
Table 5. Information on the significant uncertain variables.
To determine the reliability index for the average water activity in the membrane and the cell potential constraint, we used an MCS method, which involves generating 10,000 samples based on their distribution. For the objective function optimization, the study applied a genetic algorithm. In this investigation, we employed a maximum of 200 generations, a population size of 100, and a function tolerance of
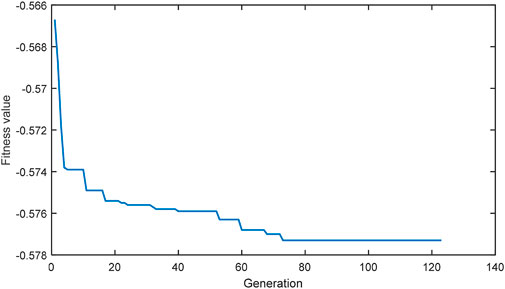
Figure 10. History of the generation of the best fitness value.
Table 6 also summarizes the results for the deterministic and reliable optimal design variable, while Table 7 compares the optimal results of the deterministic optimization and RBDO with the initial values. The result demonstrates that the deterministic optimization yields higher efficiency, however, the reliability for cell potential is 60.92% and 79.31% for water activity at the membrane. The optimal system efficiency values obtained by RBDO are less than those obtained by DO; However, the reliability for cell potential is 95.01% and for water activity at the membrane is 96.85%, which is higher than the deterministic or the initial values. This suggests that the proposed RBDO provides a more reliable and robust design of the serpentine flow channel cross-section.

Table 6. Optimal design variable results.

Table 7. Result comparison.
Figure 11 also shows the histograms of constraints (cell potentials and water activities) to show that the RBDO procedure determines a feasible, reliable design. As shown in the figure, the safe regions of the constraints are denoted by dashed black lines and an arrow, which represent the areas where the design is feasible due to the constraints being met. The histograms also demonstrate that the RBDO approach successfully preserves the system’s level of reliability despite randomness (uncertainty), which may occur at any point in the system’s operation.
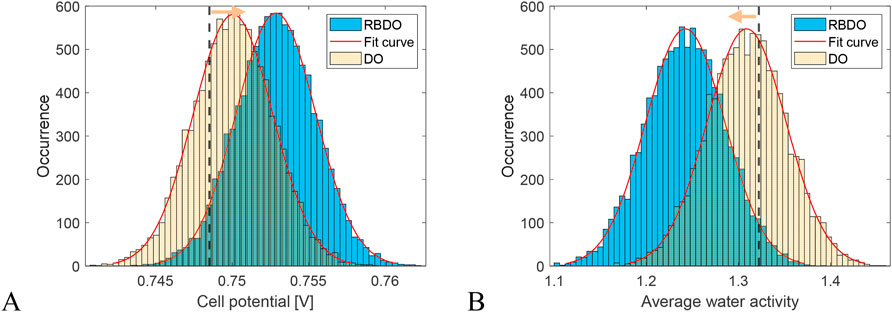
Figure 11. The constraint’s result frequency in RBDO: (A) cell potential; (B) average water activity in the membrane.
4 Conclusion
RBDO of the PEMFC was performed by applying an uncertainty model to enhance the performance efficiency. It was assumed that uncertainty models of the operating parameters for the cell potential and average water activity in the membrane calculation are statistical models with normal distributions. First, we developed a numerical PEMFC model in COMOSL, followed by a surrogate model to replace the computationally expensive model. The GBR model demonstrates an efficient technique to solve the problems of performance nonlinearity and relatively high computing costs using numerical simulations, which demonstrate that with the GBR model, the computation time has been reduced from 4 min to 0.001 s. Then, a sensitivity analysis was conducted to identify and select the most significant operating parameters for the cell potential and average water activity at the membrane responses. MCS was executed to calculate the probability of failure of cell potential and average water activity in the membrane. In addition, the GPR model was adopted to determine the efficient performance levels of MCS and RBDO. We also utilize the genetic algorithm to exploit its advantages in the global optimization search process, making it particularly well-suited for the optimization problem of PEMFC.
The result of RBDO for the PEMFC system efficiency was compared with the result of deterministic optimization and the initial design variables. Based on the result, RBDO serves as a good alternative approach for nonlinear and uncertain design problems like PEMFC design optimization. Moreover, RBDO can improve the results of the initial channel cross-section and make up for the weak points of deterministic optimization by considering the uncertainty property of the serpentine PEMCF channel cross-section design. The results show that the deterministic optimization yields higher efficiency; however, the reliability for cell potential is 60.92% and 79.31% for water activity at the membrane. The RBDO gives us a cell potential reliability of 95.01% and an average water activity at the membrane of 96.85%, which is better than the initial or deterministic values. As a result, RBDO with an uncertainty model can be a useful and practical technique for obtaining a reliable and robust PEMFC design. This method can also be used to investigate and design reliability for any other fuel cell type by choosing the appropriate objective functions (parameters). Further, in this study, water management and cell potential were considered as objective functions (parameters), but other parameters also need to be considered when designing PEMFCs, so a future study can be conducted to implement this study’s proposed method considering other parameters, such as oxygen concentration in the catalytic layer and pressure drop in the channel.
Data availability statement
The raw data supporting the conclusions of this article will be made available by the authors, without undue reservation.
Author contributions
MA: Formal Analysis, Investigation, Software, Visualization, Writing–original draft. BK: Conceptualization, Funding acquisition, Resources, Supervision, Writing–review and editing. M-GK: Validation, Writing–review and editing. H-SK: Project administration, Resources, Writing–review and editing.
Funding
The author(s) declare that financial support was received for the research, authorship, and/or publication of this article. This research was supported by Korea Research Institute of Ships and Ocean engineering a grant from Endowment Project of “Development of Basic Technologies in Eco-friendly Ship Fuel Reliability and Safety Evaluation” funded by Ministry of Oceans and Fisheries (1525014866).
Conflict of interest
The authors declare that the research was conducted in the absence of any commercial or financial relationships that could be construed as a potential conflict of interest.
Publisher’s note
All claims expressed in this article are solely those of the authors and do not necessarily represent those of their affiliated organizations, or those of the publisher, the editors and the reviewers. Any product that may be evaluated in this article, or claim that may be made by its manufacturer, is not guaranteed or endorsed by the publisher.
References
Al-Baghdadi, M. A. S., and Al-Janabi, H. A. S. (2007). Parametric and optimization study of a PEM fuel cell performance using three-dimensional computational fluid dynamics model. Renew. energy 32 (7), 1077–1101. doi:10.1016/j.renene.2006.04.018
Ang, S. M. C., Brett, D. J., and Fraga, E. S. (2010). A multi-objective optimisation model for a general polymer electrolyte membrane fuel cell system. J. Power Sources 195 (9), 2754–2763. doi:10.1016/j.jpowsour.2009.10.095
Bergamini, R., Nguyen, T. V., and Elmegaard, B. (2019). Simplification of data acquisition in process integration retrofit studies based on uncertainty and sensitivity analysis. Front. Energy Res. 7, 108. doi:10.3389/fenrg.2019.00108
Chen, Y., Wang, L., and Huang, H. (2023). An effective surrogate model assisted algorithm for multi-objective optimization: application to wind farm layout design. Front. Energy Res. 11, 1239332. doi:10.3389/fenrg.2023.1239332
Fathy, A., Abdelkareem, M. A., Olabi, A. G., and Rezk, H. (2021). A novel strategy based on salp swarm algorithm for extracting the maximum power of proton exchange membrane fuel cell. Int. J. Hydrogen Energy 46 (8), 6087–6099. doi:10.1016/j.ijhydene.2020.02.165
Golbert, J., and Lewin, D. R. (2004). Model-based control of fuel cells:. J. power sources 135 (1-2), 135–151. doi:10.1016/j.jpowsour.2004.04.008
Hu, G., Li, G., Zheng, Y., Zhang, Z., and Xu, Y. (2014). Optimization and parametric analysis of PEMFC based on an agglomerate model for catalyst layer. J. Energy Inst. 87 (2), 163–174. doi:10.1016/j.joei.2014.03.004
Johnson, M. E., Moore, L. M., and Ylvisaker, D. (1990). Minimax and maximin distance designs. J. Stat. Plan. inference 26 (2), 131–148. doi:10.1016/0378-3758(90)90122-b
Kolios, A., Mytilinou, V., Lozano-Minguez, E., and Salonitis, K. (2016). A comparative study of multiple-criteria decision-making methods under stochastic inputs. Energies 9 (7), 566. doi:10.3390/en9070566
Kannan, V., Xue, H., Raman, K. A., Chen, J., Fisher, A., Birgersson, E., et al. (2020). Quantifying operating uncertainties of a PEMFC–Monte Carlo-machine learning based approach. Renewable Energy 158, 343–359.
Li, H., Xu, B., Lu, G., Du, C., and Huang, N. (2021). Multi-objective optimization of PEM fuel cell by coupled significant variables recognition, surrogate models and a multi-objective genetic algorithm. Energy Convers. Manag. 236, 114063. doi:10.1016/j.enconman.2021.114063
Li, W. Z., Yang, W. W., Wang, N., Jiao, Y. H., Yang, Y., and Qu, Z. G. (2020). Optimization of blocked channel design for a proton exchange membrane fuel cell by coupled genetic algorithm and three-dimensional CFD modeling. Int. J. Hydrogen Energy 45 (35), 17759–17770. doi:10.1016/j.ijhydene.2020.04.166
Liu, S., Tan, J., Hu, H., Lu, C., and Xuan, D. (2023). Multi-objective optimization of proton exchange membrane fuel cell geometry and operating parameters based on three new performance evaluation indexes. Energy Convers. Manag. 277, 116642. doi:10.1016/j.enconman.2022.116642
Liu, Z., Zeng, X., Ge, Y., Shen, J., and Liu, W. (2017). Multi-objective optimization of operating conditions and channel structure for a proton exchange membrane fuel cell. Int. J. heat mass Transf. 111, 289–298. doi:10.1016/j.ijheatmasstransfer.2017.03.120
Manso, A. P., Marzo, F. F., Mujika, M. G., Barranco, J., and Lorenzo, A. (2011). Numerical analysis of the influence of the channel cross-section aspect ratio on the performance of a PEM fuel cell with serpentine flow field design. Int. J. Hydrogen Energy 36 (11), 6795–6808. doi:10.1016/j.ijhydene.2011.02.099
Mawardi, A., and Pitchumani, R. (2006). Effects of parameter uncertainty on the performance variability of proton exchange membrane (PEM) fuel cells. J. power sources 160 (1), 232–245. doi:10.1016/j.jpowsour.2006.01.017
Nguyen, T. V., and White, R. E. (1993). A water and heat management model for proton-exchange-membrane fuel cells. J. Electrochem. Soc. 140 (8), 2178–2186. doi:10.1149/1.2220792
Peng, X., Wu, W., Zhang, Y., and Yang, W. (2017). Determination of operating parameters for PEM fuel cell using support vector machines approach. J. Energy Storage 13, 409–417. doi:10.1016/j.est.2017.09.005
Perng, S. W., Wu, H. W., Jue, T. C., and Cheng, K. C. (2009). Numerical predictions of a PEM fuel cell performance enhancement by a rectangular cylinder installed transversely in the flow channel. Appl. Energy 86 (9), 1541–1554. doi:10.1016/j.apenergy.2008.11.011
Raj, A., and Shamim, T. (2014). Investigation of the effect of multidimensionality in PEM fuel cells. Energy Convers. Manag. 86, 443–452. doi:10.1016/j.enconman.2014.04.088
Rasmussen, C. E. (2003). “Gaussian processes in machine learning,” in Summer school on machine learning (Berlin, Heidelberg: Springer Berlin Heidelberg), 63–71.
Sobol, M. (1993). Sensitivity estimates for nonlinear mathematical models. Math. Model. Comput. Exp. 1, 407–414.
Sohani, A., Naderi, S., and Torabi, F. (2019). Comprehensive comparative evaluation of different possible optimization scenarios for a polymer electrolyte membrane fuel cell. Energy Convers. Manag. 191, 247–260. doi:10.1016/j.enconman.2019.04.005
Squadrito, G., Maggio, G., Passalacqua, E., Lufrano, F., and Patti, A. (1999). An empirical equation for polymer electrolyte fuel cell (PEFC) behaviour. J. Appl. Electrochem. 29 (12), 1449–1455. doi:10.1023/a:1003890219394
Tripathy, R. K., and Bilionis, I. (2018). Deep UQ: learning deep neural network surrogate models for high dimensional uncertainty quantification. J. Comput. Phys. 375, 565–588. doi:10.1016/j.jcp.2018.08.036
Tzeng, G. H., and Huang, J. J. (2011). Multiple attribute decision making: methods and applications. New York: CRC Press.
Wang, Y. X., Chen, Q., Zhang, J., and He, H. (2021). Real-time power optimization for an air-coolant proton exchange membrane fuel cell based on active temperature control. Energy 220, 119497. doi:10.1016/j.energy.2020.119497
Weber, A. Z., and Newman, J. (2004). Modeling transport in polymer-electrolyte fuel cells. Chemical reviews 104 (10), 4679–4726.
Wu, G., and Luo, N. (2023). Multi-objective optimization of PEMFC performance based on grey correlation analysis and response surface method. Front. Energy Res. 11, 1206418. doi:10.3389/fenrg.2023.1206418
Xiang, H., Li, Y., Liao, H., and Li, C. (2017). An adaptive surrogate model based on support vector regression and its application to the optimization of railway wind barriers. Struct. Multidiscip. Optim. 55, 701–713. doi:10.1007/s00158-016-1528-9
Xu, K., Fan, L., Sun, J., Chen, A., and Xu, C. (2024). Comprehensive performance assessment and multi-objective optimization of high-power proton exchange membrane fuel cell system under variable load. Fuel 363, 130942. doi:10.1016/j.fuel.2024.130942
Keywords: proton exchange membrane fuel cell, reliability-based design optimization, surrogate model, sobol sensitivity analysis, flow channel
Citation: Abebe M, Koo B, Kim M-G and Kim H-S (2024) Surrogate-assisted reliability-based design optimization of PEMFC serpentine flow channel. Front. Energy Res. 12:1468702. doi: 10.3389/fenrg.2024.1468702
Received: 22 July 2024; Accepted: 05 September 2024;
Published: 20 September 2024.
Edited by:
Giuseppe De Lorenzo, University of Calabria, ItalyReviewed by:
Zhiming Bao, Tianjin University, ChinaGuilin Hu, Zhejiang University of Science and Technology, China
Copyright © 2024 Abebe, Koo, Kim and Kim. This is an open-access article distributed under the terms of the Creative Commons Attribution License (CC BY). The use, distribution or reproduction in other forums is permitted, provided the original author(s) and the copyright owner(s) are credited and that the original publication in this journal is cited, in accordance with accepted academic practice. No use, distribution or reproduction is permitted which does not comply with these terms.
*Correspondence: Bonyong Koo, Ynlrb29Aa3Vuc2FuLmFjLmty; Hyun-Seok Kim, aHNraW04NUBrcmlzby5yZS5rcg==