- Electric Power Research Institute of Guangxi Power Grid Co. Ltd., Nanning, China
As the “artery” of the urban power grid, high-voltage cables and their operating status are directly related to grid safety. Cable joint is a weak part of cable line prone to defects, leading to cable failure and jeopardizing the power supply reliability. This study constructs a three-dimensional electromagnetic-thermal multi-physics coupling model of cable joint for the analysis of contact resistance and typical insulation defects. Using an equivalent conductivity model, the thermal loss and temperature distribution of the joint were investigated under different contact coefficients. Subsequently, models for air-gap defect and water tree defect in cable joints were established to simulate the temperature and electric field distribution under these conditions. The simulation results indicate that, at an ambient temperature of 25°C, the contact resistance of a 110 kV high-voltage AC cable joint significantly increases the loss density, raising the joint temperature much higher than cable body, while not altering the temperature gradient distribution. Small air-gap has minimal impact on the temperature distribution of joint insulation but causes significant electric field distortion up to 8 kV/mm. Water tree defect considerably affects both temperature and electric field, causing a 20°C temperature rise and a 30 kV/mm electric field distortion. This research reveals the strong influence of contact resistance and water tree defect on cable joints, quantifying the resulting hazards like loss increase, temperature rise and electric field distortion.
1 Introduction
High-voltage cables, as crucial components in the transmission and distribution of electricity, directly affect the stability and reliability of the entire power system (Hu et al., 2024; Zhou C. et al., 2017; Lou et al., 2024). The insulation structure of cable intermediate joints is complex and requires manual installation. If the construction process is flawed or sealing is inadequate, insulation deterioration is likely to occur under harsh operation conditions, making cable joint the weakest link in the cable line (Hu et al., 2024; Zhao et al., 2024; He et al., 2019). Since the insulation of the intermediate joint is thicker than that of the cable body, the steady-state temperature difference between the cable joint and the body can reach up to 30°C, leading to the cable joint easily overheating (Tang et al., 2019; Aziz and Riege, 1980; Wang et al., 2024). Statistics show that over 64% of cable line failures in high-voltage cable systems occur at the intermediate joints, with more than 97% of joint failures occurring in the insulation layer. Cable failures are often accompanied by explosions, burns, breakdowns, and can cause widespread power outages.
Numerical methods such as finite element method are widely used to simulate and analyze cable intermediate joints, providing great significance to understand the failure mechanisms and influence factors of cables and cable joints. Scholars have achieved certain research results in this field. Regarding the simulation of the cable operation status, Sedaghat and de León analyzed the thermal behavior of cables installed in free air considering surface emissivity, heat dissipation coefficients and induced heating (Sedaghat and de León, 2014). The authors evaluated the IEC standard method for rating power cables against finite-element simulations and laboratory experiments. Luo et al. simulated the cable joint using an electromagnetic-thermal coupling method, discovering that the main heat transfer of the cable joint occurs within a 2 m axial range (Luo et al., 2016). Zhao and Gu established the geometric model of cable intermediate joint using ANSYS and focused on the outer surface temperature of cable joint (Zhao and Gu, 2018). Bragatto et al. (2023) combined simulation and measurement data, finding that the temperature of medium-voltage cable joints is minimally affected by the environment, and the temperature changes during the day are primarily determined by the load current. Regarding the simulation of insulation defects in cable joints, Zhou X. et al. (2017) constructed a three-dimensional model of 110 kV cross-linked polyethylene power cable joint and simulated the electric field distribution around typical defects in cable joint. It is found that a cavity only 0.2 mm in depth in XLPE insulation can cause up to 80% increase in electric field, and the deeper the higher the electric field is. Yang et al. (2019) investigated the impacts of different defects on electric field distribution in cable joints. The simulated defects include needle damage, impurity defect and scratch in insulation. Bhatti et al. established a two-dimensional model of 11 kV XLPE cable joint and studied the influence of artificial particles on cable joint’s temperature behavior (Bhatti et al., 2021). The simulation results determine that each particle and defect’s temperature distribution behavior has a different response, and the temperature effect change as the particles and defect change. Hu et al. (2023) constructed an electromagnetic field defect model of cable composite insulation interface, studied the effect of some kinds of dampness defects on magnetic field and harmonic current in distribution cable accessories, (Hu et al., 2024). Regarding the simulation of contact resistance in cable joints, Yang et al. (2016) established a three-dimensional simulation model of the cable joint, determining the contact coefficient of 2.7 as the boundary of the qualification or failure for cable joints. The simulation results show that the temperature distribution on joint surface is increased and non-uniform when there are defects in cable joint. Yang et al. (2018) proposed a new method for accurately determining the connection resistance of compression conductor in cable joint, which integrated electrical contacts model analysis with finite element analysis in the modeling. Li et al. (2004) proposed an electromagnetic-thermal modeling method for joint resistance of Conductor on Round Core (CORC) cables and explored the influence of Joule heat generated by the joint resistance on the temperature of the CORC cable (Li et al., 2024).
The above studies have focused more on the rating calculation of power cables and single field simulation of cable joint defects, with few scholars simultaneously considering and analyzing the impacts of joint contact resistance and insulation defects on multiple fields. To address these issues, a three-dimensional electromagnetic-thermal multi-physics coupling simulation model of cable joint was established to analyze the operation condition and investigate the effects of contact resistance, air-gap defects and water tree defects on the electric field and temperature field distribution of cable joint.
2 Structure and mathematical model of cable joint
2.1 Physical structure
In this study, the cable of model YJLW03-64/110 1 × 800 mm2 and its intermediate joint were chosen as the research subjects. The axial dimensions of the joint, shown in Table 1, were used as the simulation parameters to establish a three-dimensional electromagnetic-thermal multi-physics coupling model of the cable joint.
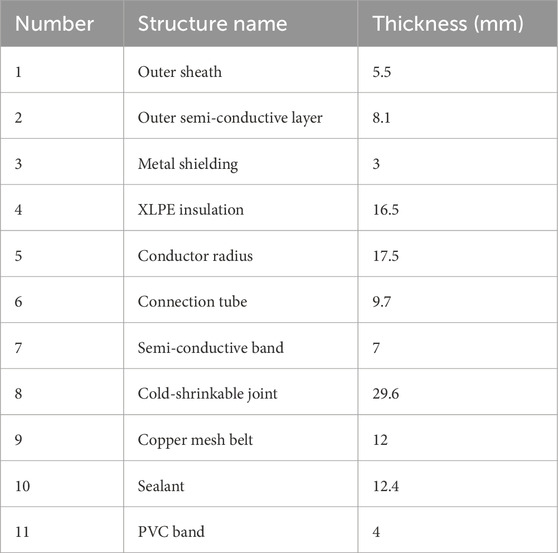
The structure and radial thickness of the YJLW03-64/110 1 × 800 mm2 intermediate joint are shown in Table 2. In the table, XLPE and PVC refer to crosslinked polyethylene and polyvinyl chloride.
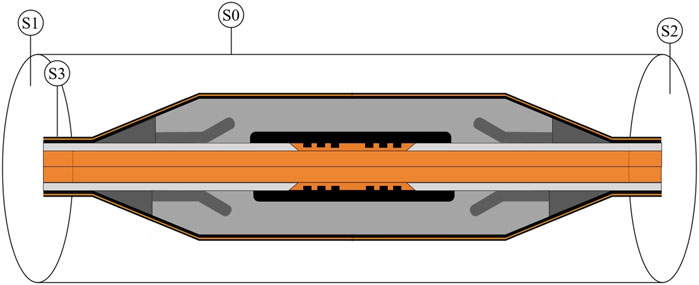
Figure 1 shows the two-dimensional axial cross-sectional view of the cable joint. Tables 3, 4 list the material parameters of electromagnetic field and temperature field respectively for the cable joint model (Xu et al., 2024).
2.2 Mathematical model
To simplify the calculation of the electromagnetic field, the model and analysis in this paper are based on the following assumptions: First, there is no movement of free charges in the magnetic field. Second, except for the copper conductor and the metal shielding, other materials are isotropic and homogeneous. Finally, when the cable operates at the power frequency (50 Hz), the displacement current density is much smaller than the conduction current and can be neglected. Based on these assumptions and Maxwell’s Equations, the magnetic vector potential
where
According to heat transfer theory, the steady-state heat conduction equation can be expressed as Equation 2:
where
For the boundary conditions, the temperature field boundaries must satisfy the effective range of heat transfer, ensuring that the temperature or temperature gradient remains stable. The boundary conditions for the magnetic field must meet the rapid attenuation of the magnetic vector potential. The specific boundary conditions are shown in Figure 2. A cylinder surface forms the boundary of the cable joint. S0 represents the side surface of the cylinder boundary, S1 and S2 represent the top and bottom surface of the cylinder boundary, and S3 represents the outer surface of the cable.
1) Boundary conditions for electromagnetic field
In the air domain, the magnetic vector potential
In the axial direction, the cross-section of the cable body at a distance of 3000 mm from the joint is the magnetic insulation boundary, as shown in Equation 4:
where
2) Boundary conditions for temperature field
Convective heat dissipation consists of two parts: natural convection and thermal radiation. According to the Stefan-Boltzmann law, Equation 5 describes the the thermal radiation for the cable surface:
where
In this article, the calculation of convective heat dissipation is based on Equation 6:
where
It is generally considered that the temperature gradient of the cable is 0°C/mm at a distance of 3000 mm from the joint center, indicating that the cable temperature no longer changes, as shown in Equation 7:
3 Simulation analysis of contact resistance in cable joint
During the installation of high-voltage cables, gaps may exist between the connection tube and the joint conductor due to poor on-site construction environments or operator errors. The resulting contact resistance causes an increase in current density and electromagnetic loss as current flows through the conductor and connection tube. This further increases the temperature, ultimately reducing the lifespan of the cable intermediate joints. Therefore, when simulating the temperature field of cable joints, it is essential to consider not only the heating of the joints themselves but also the impact of contact resistance on the joint’s heating.
3.1 Equivalent conductivity model of contact resistance
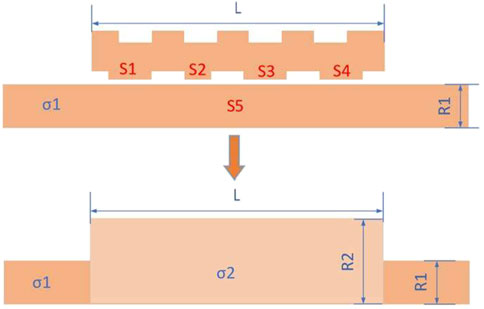
Contact resistance is caused by insufficient mechanical strength during the crimping of the conductor and the connection tube. The specific resistance value cannot be precisely calculated. Therefore, to simplify the calculation, an equivalent conductivity model is used to simulate the actual conductivity between the connection tube and the joint conductor. Furthermore, the equivalent thermal loss of the contact resistance is calculated. The equivalent model of the contact resistance is shown in Figure 3.
S1 to S5 are the contact surfaces between the connection tube and the joint conductor.
According to the equivalent conductivity model, the contact coefficient
The electrical conductivity of the conductor is a function of temperature. Therefore, the expression for the equivalent conductivity
were
The formulas for calculating the current density
By substituting Equation 10 into Equation 12, the expression for the equivalent thermal loss at the conductor connection of the intermediate joint is:
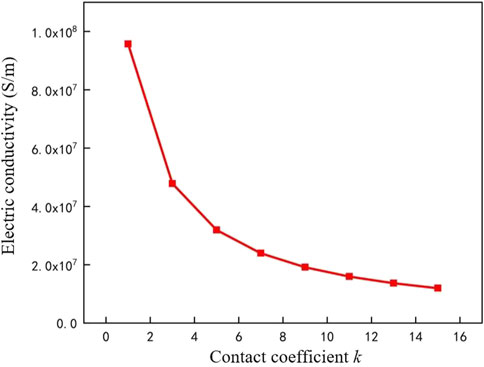
The equivalent conductivity curves corresponding to different contact coefficients
The equivalent conductivity σ2 is related not only to the contact coefficient k but also to the conductor temperature T. The conductivity at the conductor connection is set according to Equation 10. Based on the electromagnetic-thermal coupling model, the equivalent thermal loss for different contact coefficients is calculated. By setting the operation current
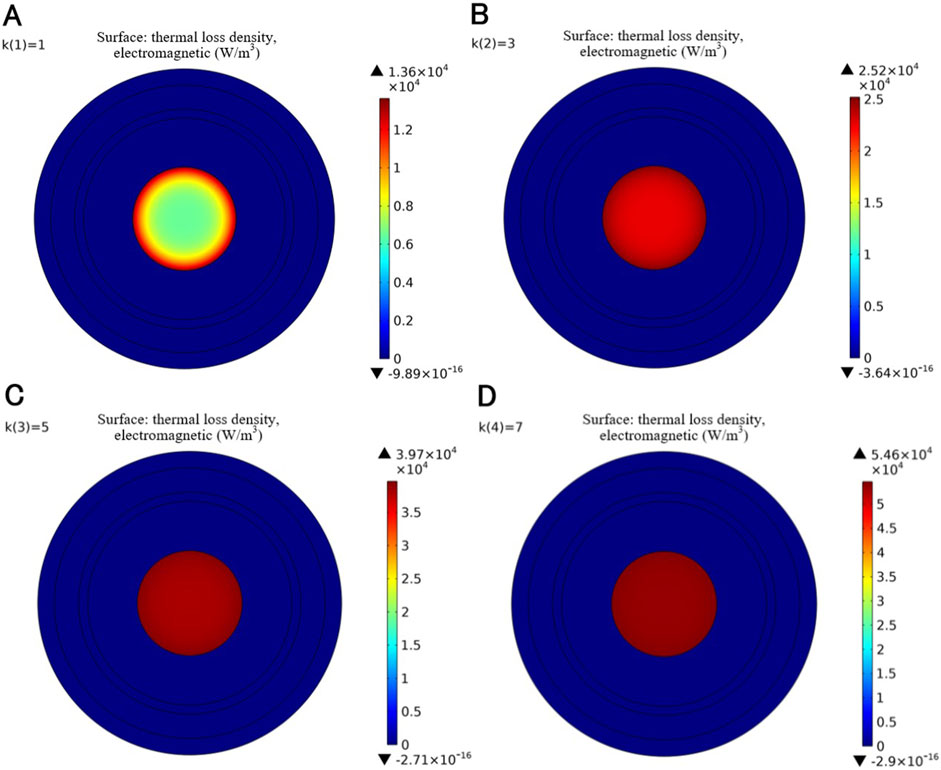
Figure 5. Thermal loss distributions at the joint cross-section with different k. (A) k = 1. (B) k = 3. (C) k = 5. (D) k = 7.
According to the simulation results and Equation 13, the linear conductivity and the operation temperature jointly determine the equivalent thermal loss of the joint conductor. As the contact coefficient
3.2 Temperature field analysis
The temperature simulation results of the cable joint operating without contact resistance are shown in Figure 6. The axial direction follows the conductor center, from the left side to the right side. 0 mm and 6,000 mm correspond to the two ends of the model, and the center of the cable joint is located at 3,000 mm. The radial direction is along the cross-section at the middle of the joint, from the conductor center to the outermost layer. The temperature and temperature gradient distributions without contact resistance exhibit the following characteristics:
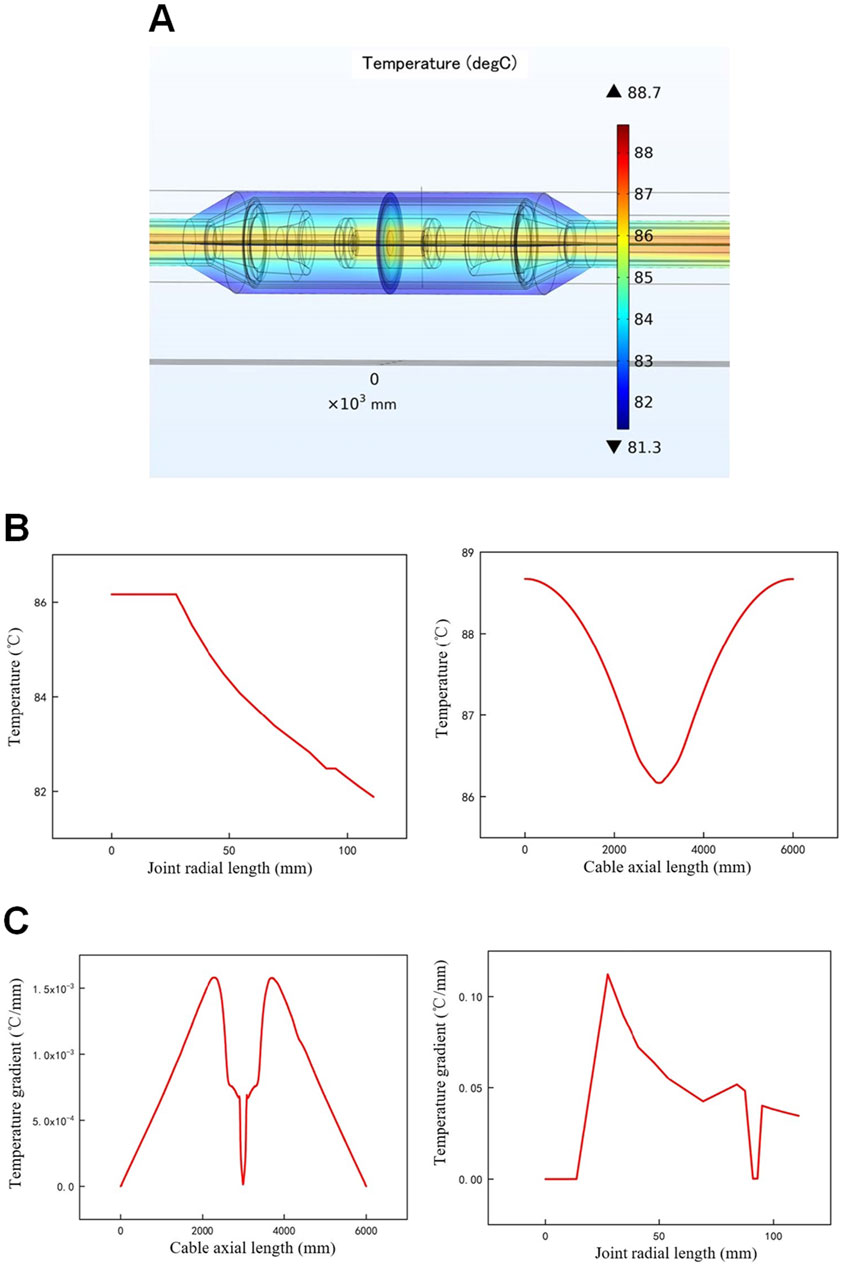
Figure 6. Temperature field distributions of cable joint without contact resistance. (A) Temperature simulation model of the cable joint. (B) Simulation results of joint temperature. (C) Simulation results of joint temperature gradient.
In the radial direction, the conductor temperature of the cable joint is the highest, and it decreases toward the outer layers, which is consistent with the normal operation condition of the cable. The axial temperature distribution of the cable intermediate joint exhibits a “U” shape, with lower temperature at the joint and higher temperature on both sides of the cable body. The axial temperature difference between the joint and the body conductor is 2°C. This indicates that in an ideal joint model, when both the joint and the cable body are made of copper, the temperature rise of the conductor is primarily determined by the cross-sectional area of the conductor. The larger cross-sectional area of the joint conductor results in lower resistance and thus a slightly lower temperature compared to the cable body.
The largest temperature gradient occurs at both ends of the cable joint, reaching 1.5 × 10⁻³ °C/mm, while the temperature gradient of the cable body at 3,000 mm is nearly reduced to zero. The variation in radial temperature gradient of the cable joint is significantly greater than the variation in radial temperature, so the temperature gradient can better reflect the temperature characteristics of the cable joint. Under the same operation current and ambient temperature, the radial temperature variation of the cable joint is at most 4°C, while the temperature gradient increases from 0°C to 0.1°C/mm. This indicates that the sensitivity of the temperature gradient is much higher than that of the temperature. In the joint model, the maximum temperature gradient is located in the insulation layer, followed by the semi-conductive layer, with the minimum value in the metallic part. Moreover, the temperature gradient distribution in the insulation layer is uneven. The radial temperature gradient variation of the intermediate joint is much greater than the axial variation, indicating that the material properties significantly affect the temperature gradient.
In actual operation, there is significant contact resistance at the conductor connection of the cable joint, resulting in a noticeable temperature rise at the cable joint compared to the body. The high temperature, when acting on the cable joint over a long period, can easily lead to overheating and damage, thus limiting the overall operation current of the cable. By setting the contact coefficient
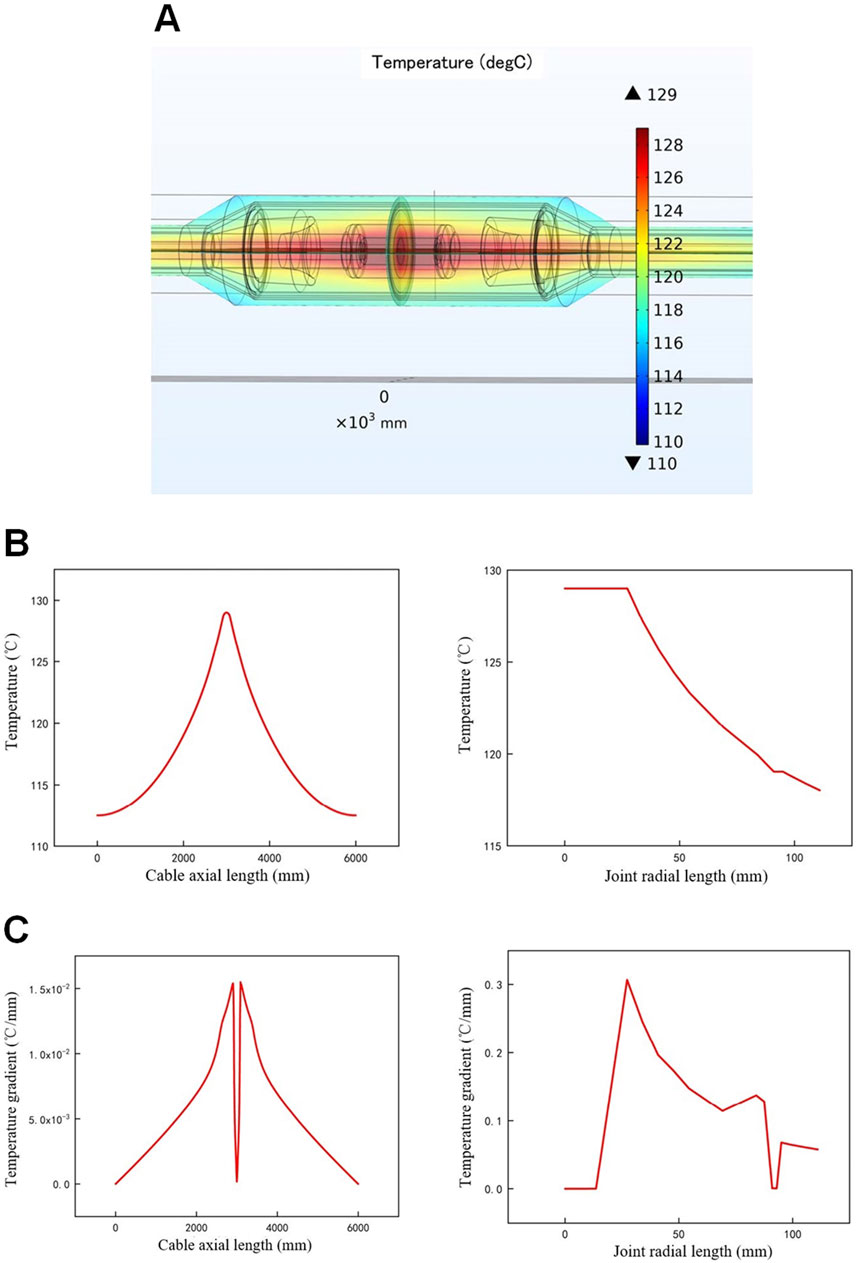
Figure 7. Temperature field distributions of cable joint with contact resistance. (A) Temperature simulation model of the cable joint. (B) Simulation results of joint temperature. (C) Simulation results of joint temperature gradient.
Because of the contact resistance, the joint temperature increases dramatically by 44°C and is much higher than the body temperature. At the same time, the cable body temperature also rises compared to the temperature without contact resistance. The temperature difference between the joint and the body is 20°C, while the radial temperature difference at the joint is 15°C. Both radial and axial temperature differences are much larger than in the case without contact resistance.
The temperature gradient difference between the joint and the cable body is 1.5 × 10⁻²°C/mm, and the radial temperature gradient difference at the joint is 0.3°C/mm. The change of joint temperature gradient in the radial direction is much greater than in the axial direction. As a good thermal conductor, the copper core has a relatively uniform internal temperature gradient, close to 0°C/mm, while the temperature gradient distribution within the insulation layer is uneven. Regardless of the presence of contact resistance, the radial temperature field distribution of the intermediate joint remains essentially the same. This indicates that the contact resistance does not significantly affect the distribution rules of temperature and temperature gradient in the radial direction.
To further analyze the impact of contact resistance at the cable joint on the temperature field of the cable body, radial temperature and temperature gradient distribution graphs for the cable body are plotted. Figures 8, 9 correspond to the distributions without and with contact resistance (
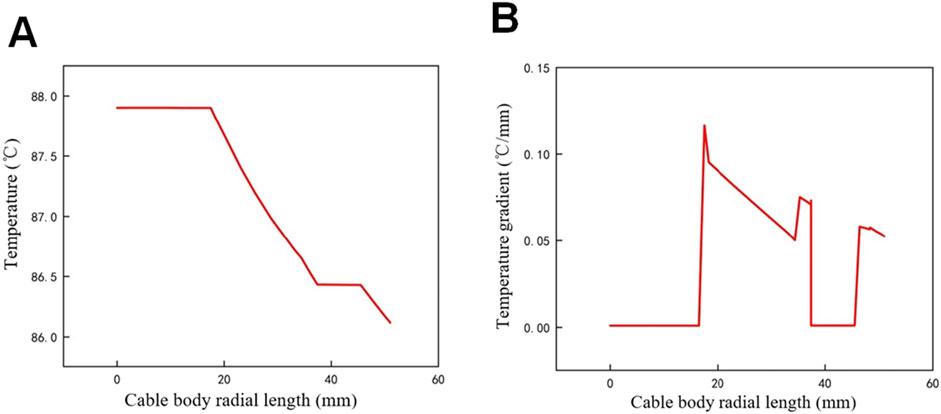
Figure 8. Radial temperature field distributions of cable body without contact resistance. (A) Radial temperature. (B) Radial temperature gradient.
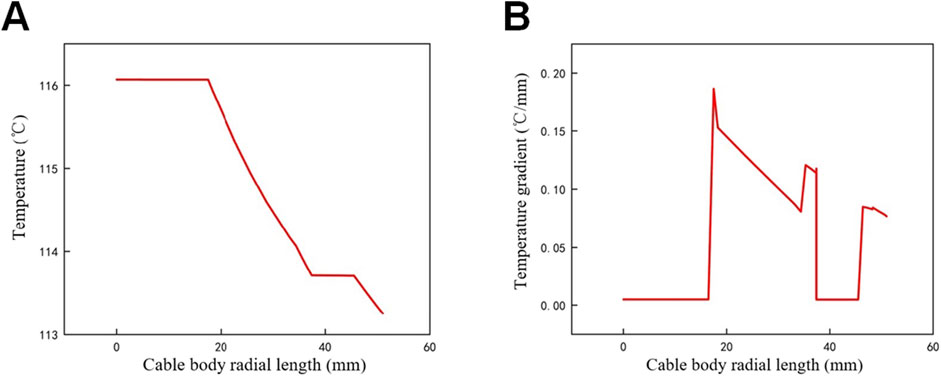
Figure 9. Radial temperature field distributions of cable body with contact resistance. (A) Radial temperature; (B) Radial temperature gradient.
Without the contact resistance, the conductor temperature in the cable body is 2°C higher than that of the conductor in cable joint due to the difference in cross-sectional area. Additionally, the radial temperature gradient in the cable body is 0.1°C/mm higher than that in the joint. The larger temperature difference between the cable body and the environment leads to this phenomenon. Due to thermal conduction, the contact resistance not only affects the temperature distribution in the joint but also causes an increase in the temperature of the cable body near the joint. The conductor temperature gradient in both the cable body and the joint is 0°C/mm, indicating that there is no significant temperature exchange activity within the conductor.
4 Simulation analysis of insulation defects in cable joint
Tiny defects in cable joint are a significant cause of cable failures. These defects predominantly originate in the insulation layer, with air-gap defect and water tree defect being two typical types selected for simulation analysis. Since the temperature rise associated with air-gap defect and water tree defect primarily results from partial discharge. Therefore, the models in this chapter mainly consider the effect of heat sources at defects.
4.1 Air-gap defect
The air-gap defects in cable joint primarily arise from imperfect manufacturing and the prolonged operation. The accumulation of space charges in cable joint continuously enhances the electric field at the air-gap, leading to increased temperature and partial discharge (Zhu et al., 2014). These discharges accelerate chemical reaction rates, causing further degradation of the cable joint.
Focusing on a single micro air-gap within the insulation layer, this study investigates the impact of air-gap defect on the temperature of the cable joint. Based on the previous simulation model of cable joint, an air-gap defect is set up as shown in Figure 10. The air-gap is situated in the joint insulation and is modeled as a cylindrical shape, with a radius of 0.5 mm and a height of 5 mm, and the material is air.
The loss due to the air-gap discharge varies with the air-gap length. As the length increases, the pulse width of the discharge waveform also increases, while the number of discharge pulses in a cycle shows an upward trend. Additionally, the amplitude of the power loss due to the air-gap discharge increases correspondingly.
The thermal loss of the air-gap defect in cable joint mainly originates from plasma chemical reactions, electron discharges, and charge accumulation. Based on the discharge characteristics of the air-gap (Yang et al., 2017), the power loss density is calculated using Equation 14:
where
The average power loss density of the air-gap discharge in a cycle is obtained by:
According to Equation 15, when the air-gap length l is 1 mm, the calculated
where
The average power loss density
By incorporating the thermal loss from Table 5 into the simulation model, the distributions of the electric field, volume loss density, temperature, and temperature gradient in the cable joint are shown in Figure 11, and the following conclusions can be drawn:
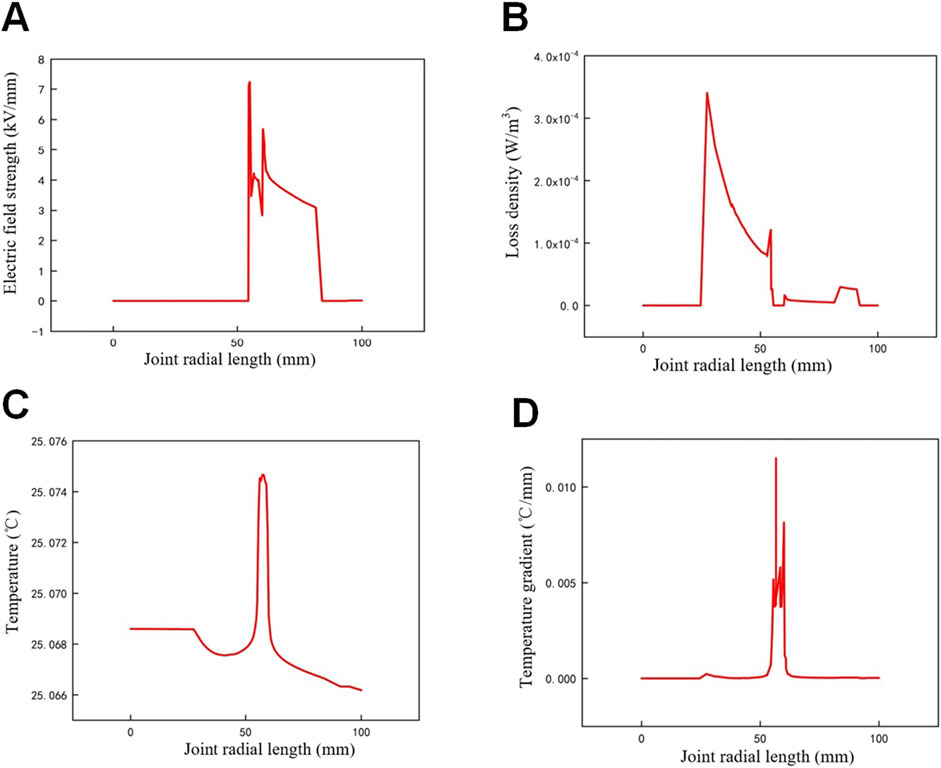
Figure 11. Simulation results of air-gap defect in cable joint. (A) Electric field distribution. (B) Volume loss density distribution. (C) Temperature distribution. (D) Temperature gradient distribution.
When there is an air-gap defect in the intermediate joint, the electric field strength at the defect is distorted to 8 kV/mm. The volume loss density caused by the joint air-gap increases by 4 × 10⁻⁴W/m³, indicating that the loss density of the air-gap is extremely low and cannot be reflected in the temperature simulation.
The temperature change at the air-gap is only 0.01°C, demonstrating that a single micro air-gap has a negligible effect on the insulation temperature. The temperature gradient change is only 0.1°C/mm, almost unaffected by the air-gap defect.
However, during the actual operation of the cable, the high electric field strength at the air-gap can further induce partial discharge. Over time, this can lead to the aging of the insulation material, resulting in a more significant temperature rise at the defect area.
4.2 Water tree defect
When moisture, impurities, and space charges are present in the insulation material, they can form dendritic microchannels under the influence of electric field, referred to as water trees. During cable operation, water molecules gradually accumulate at the defect area under the electric field, causing mechanical damage to the insulation and potentially leading to cable joint failure.
The growth of water trees can occur in two forms: outward growth along the electric field lines and densification growth within the original water tree region. The two growth forms coexist in cables, and the growth rate of water trees increases with the cable aging.
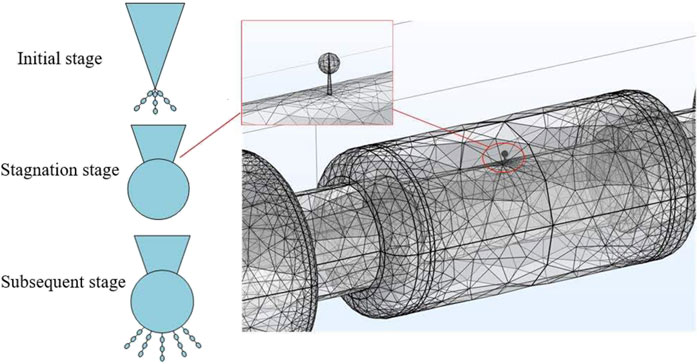
The growth stages of water trees and the constructed defect simulation model are shown in Figure 12. The growth process of water trees can be divided into three stages: the initial stage, the stagnation stage, and the subsequent stage (Zhou et al., 2019; Chen et al., 2016). The stagnation stage differs from the initial and subsequent stages in that the water tree stops extending outward and primarily increases the internal density. This stage is characterized by a significant increase in moisture content within the original water tree region. Due to its stable state and long duration, the stagnation stage is the optimal period for studying water tree defects. Therefore, this paper conducts a simulation study on the water tree model during the stagnation stage. The water tree defect is set in the joint insulation and the material is set as water, with a total height of 5 mm and a spherical densified region radius of 1 mm.
Based on the simulation model of the water tree defect, the results are obtained as shown in Figure 13 and the following conclusions can be drawn:
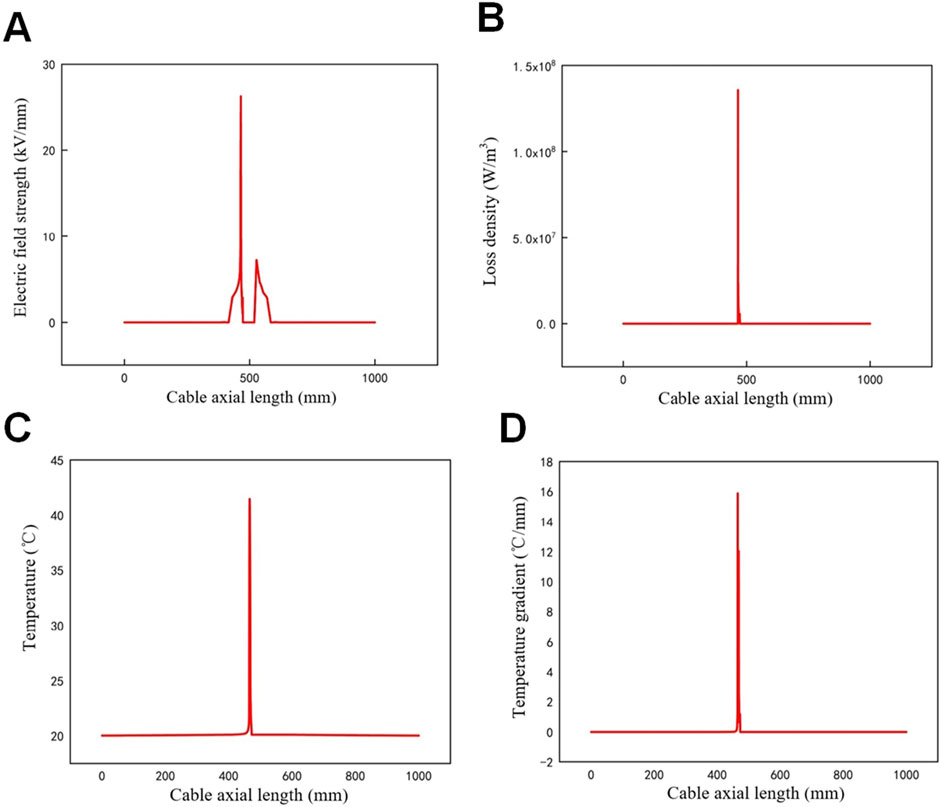
Figure 13. Simulation results of water tree defect in cable joint. (A) Electric field distribution. (B) Volume loss density distribution. (C) Temperature distribution. (D) Temperature gradient distribution.
When a water tree defect is present in the cable joint, the electric field distortion at the defect is the highest, reaching 30 kV/mm, while the electric field distortion in other areas of the joint insulation does not exceed 7 kV/mm. The extremely high electric field strength can easily trigger partial discharge, leading to more severe insulation damage than that caused by air-gap defects. Similarly, the loss density at the water tree defect is the highest, reaching 1.5 × 10⁸W/m³, which is much higher than the loss density in the rest of the joint insulation. The irregular shape of the water tree defect and its high permittivity are the main reasons for the high electric field strength and loss density.
Due to the substantial differences in electric field strength and loss density between the defect area and the surrounding medium, the temperature rise at the defect is more significant. In actual operation, the defect area is more prone to chemical reactions with the surrounding medium, further increasing the temperature at the defect. In the water tree defect model, the highest temperature of the joint is at the water tree defect, reaching 42°C, which is about 20°C higher than in other regions. The maximum temperature gradient of the cable joint is also located at the water tree defect, at 17°C/mm. The impact of the water tree defect on the overall temperature of the cable joint is severe and cannot be ignored.
5 Conclusion
A three-dimensional electromagnetic-thermal multi-physics coupling model of a high-voltage cable joint was established to study the influence of contact resistance and typical insulation defects on cable joint. The loss density, temperature field and electric field distributions were simulated, and the following conclusions are obtained:
1) The equivalent conductivity of the joint conductor and connection tube decreases with the contact coefficient
2) The joint conductor temperature increases with the contact coefficient
3) A small air-gap defect hardly affects the temperature distribution of cable joint insulation, with a temperature rise of only 0.01°C. But an air-gap defect can lead to localized electric field distortion of up to 8 kV/mm.
4) Water tree defects have a significant impact on the cable joint insulation, with loss density of 1.5 × 10⁸W/m³, temperature rise of 20°C and temperature gradient of 17°C/mm. Furthermore, the electric field strength is enhanced by almost 30 kV/mm, greatly increasing the probability of partial discharge.
Data availability statement
The original contributions presented in the study are included in the article/supplementary material, further inquiries can be directed to the corresponding author.
Author contributions
LW: Visualization, Writing–original draft, Writing–review and editing, Supervision. QJ: Conceptualization, Writing–original draft, Writing–review and editing. XY: Project administration, Supervision, Writing–original draft, Writing–review and editing. BZ: Writing–original draft, Writing–review and editing.
Funding
The author(s) declare that financial support was received for the research, authorship, and/or publication of this article. This research was funded by Science and Technology Project of the China Southern Power Gird, grant number GXKJXM20222115.
Acknowledgments
The authors acknowledge the reviewers for providing valuable comments and helpful suggestions to improve the manuscript.
Conflict of interest
Authors LW, QJ, XY, and BZ were employed by Electric Power Research Institute of Guangxi Power Grid Co. Ltd.
Publisher’s note
All claims expressed in this article are solely those of the authors and do not necessarily represent those of their affiliated organizations, or those of the publisher, the editors and the reviewers. Any product that may be evaluated in this article, or claim that may be made by its manufacturer, is not guaranteed or endorsed by the publisher.
References
Aziz, M. M. A., and Riege, H. (1980). A new method for cable joints thermal analysis. IEEE Trans. Power Appar. Syst. PAS- 99, 2386–2392. doi:10.1109/TPAS.1980.319804
Bhatti, A. A., Yang, B., Peng, X., Xia, Z., Dong, L., Wang, H., et al. (2021). “Simulation of temperature distribution behavior of high voltage cable joints with typical defects,” in 2021 6th asia conference on power and electrical engineering (Chongqing, China: ACPEE), 1139–1143. doi:10.1109/ACPEE51499.2021.9436866
Bragatto, T., Cresta, M., Gatta, F. M., Geri, A., Maccioni, M., and Paulucci, M. (2023). Assessing thermal behavior of medium voltage cable joints through simulations and measurements. IEEE Trans. Ind. Appl. 59, 5705–5714. doi:10.1109/TIA.2023.3284413
Chen, J., Zhao, H., Xu, Z., Zhang, C., Yang, J., Zheng, C., et al. (2016). Accelerated water tree aging of crosslinked polyethylene with different degrees of crosslinking. Polym. Test. 56, 83–90. doi:10.1016/j.polymertesting.2016.09.014
He, J., He, K., and Cui, L. (2019). Charge-simulation-based electric field analysis and electrical tree propagation model with defects in 10 kV XLPE cable joint. Energies 12, 4519. doi:10.3390/en12234519
Hu, R., Sun, W., Lu, X., Tang, F., Xu, Z., Tian, J., et al. (2023). Effect of interface defects on the harmonic currents in distribution cable accessories under damp conditions. Coatings 13, 1430. doi:10.3390/coatings13081430
Hu, Z., Ye, X., Li, Q., Luo, X., Zhao, Y., Zhang, H., et al. (2024). Analysis on three-core power cable temperature field and ampacity model under typical laying environment. Front. Energy Res. 12. doi:10.3389/fenrg.2024.1430501
Jang, J.-Y., and Chiu, Y.-W. (2007). Numerical and experimental thermal analysis for a metallic hollow cylinder subjected to step-wise electro-magnetic induction heating. Appl. Therm. Eng. 27, 1883–1894. doi:10.1016/j.applthermaleng.2006.12.025
Li, C., Yang, W., Cai, Y., Li, B., Xin, Y., and Yang, J. (2024). An electromagnetic-thermal modeling method for the joint resistance of the CORC cable. IEEE Trans. Appl. Supercond. 34, 1–5. doi:10.1109/TASC.2023.3343687
Li, H., Zhou, Z., and Chen, P. (2004). Fault analysis for 110 kV and the above HV cross - linking cable system. Electr. Equip. 8, 9–13.
Lou, Z., Wang, K., Kang, M., Zhao, W., Wei, G., Yue, J., et al. (2024). Plugging methods for underground gas extraction boreholes in coal seams: a review of processes, challenges and strategies. Gas. Sci. Eng. 122, 205225. doi:10.1016/j.jgsce.2024.205225
Luo, H., Cheng, P., Liu, H., Kang, K., Yang, F., and Yang, Q. (2016). “Investigation of contact resistance influence on power cable joint temperature based on 3-D coupling model,” in 2016 IEEE 11th conference on industrial electronics and applications (ICIEA), 2265–2268. doi:10.1109/ICIEA.2016.7603968
Sedaghat, A., and de León, F. (2014). Thermal analysis of power cables in free air: evaluation and improvement of the IEC standard ampacity calculations. IEEE Trans. Power Deliv. 29, 2306–2314. doi:10.1109/TPWRD.2013.2296912
Tang, L., Ruan, J., Qiu, Z., Liu, C., and Tang, K. (2019). Strongly robust approach for temperature monitoring of power cable joint. IET Gener. Transm. Distrib. 13, 1324–1331. doi:10.1049/iet-gtd.2018.5924
Wang, F., Zhang, P., Li, J., Li, Z., Zhao, M., Liang, Y., et al. (2024). Multi-feature based extreme learning machine identification model of incipient cable faults. Front. Energy Res. 12. doi:10.3389/fenrg.2024.1364528
Xu, C., Wang, P., Yang, F., Lu, X., Li, X., and Tian, J. (2024). Analysis of multi-physics field and temperature gradient field of crimping defects on intermediate joints on the three-core cable. High. Volt. Eng. 50 (04), 1769–1780. doi:10.13336/j.1003-6520.hve.20230812
Yang, F., Cheng, P., Luo, H., Yang, Y., Liu, H., and Kang, K. (2016). 3-D thermal analysis and contact resistance evaluation of power cable joint. Appl. Therm. Eng. 93, 1183–1192. doi:10.1016/j.applthermaleng.2015.10.076
Yang, F., Yang, Q., Cheng, P., Wang, X., and Yang, Y. (2017). Study of cracking extent for gap discharge in insulating material of power cable joint. Trans. China Electrotech. Soc. 32, 24–32. doi:10.19595/j.cnki.1000-6753.tces.2017.02.003
Yang, F., Zhu, N., Liu, G., Ma, H., Wei, X., Hu, C., et al. (2018). A new method for determining the connection resistance of the compression connector in cable joint. Energies 11, 1667. doi:10.3390/en11071667
Yang, H., Liu, L., Sun, K., and Li, J. (2019). Impacts of different defects on electrical field distribution in cable joint. J. Eng. 2019, 3184–3187. doi:10.1049/joe.2018.8569
Zhao, A., and Gu, L. (2018). “Study on the temperature distribution of the outer surface of the cable intermediate joint based on ANSYS simulation,” in 2018 IEEE 4th information Technology and mechatronics engineering conference (ITOEC), 20–23. doi:10.1109/ITOEC.2018.8740397
Zhao, Z., Liu, Z., Shan, J., Ding, L., Li, T., Jiang, T., et al. (2024). “Expansion and identification of high voltage cable joint defect partial discharge data,” in The proceedings of the 18th annual conference of China electrotechnical society, 353–360. doi:10.1007/978-981-97-1351-6_38
Zhou, C., Yi, H., and Dong, X. (2017a). Review of recent research towards power cable life cycle management. High. Volt. 2, 179–187. doi:10.1049/hve.2017.0037
Zhou, K., Huang, K., Huang, M., Zhang, C., Li, M., and Chen, Z. (2019). Water tree growth characteristics in XLPE power cable insulation. High. Volt. Eng. 45, 3207–3213. doi:10.13336/j.1003-6520.hve.20181121011
Zhou, X., Cao, J., Wang, S., Jiang, Y., Li, T., and Zou, Y. (2017b). “Simulation of electric field around typical defects in 110kV XLPE power cable joints,” in 2017 international conference on circuits, devices and systems (ICCDS), 21–24. doi:10.1109/ICCDS.2017.8120443
Keywords: cable joint, finite element analysis, contact resistance, typical defects, temperature field, electric field
Citation: Wu L, Jin Q, Yu X and Zhang B (2024) Electromagnetic-thermal multi-physics coupling simulation of cable joints: considering contact resistance and typical defects. Front. Energy Res. 12:1475355. doi: 10.3389/fenrg.2024.1475355
Received: 03 August 2024; Accepted: 05 November 2024;
Published: 15 November 2024.
Edited by:
Jasronita Jasni, Putra Malaysia University, MalaysiaReviewed by:
Tongtong He, Fuzhou University, ChinaHaowei Yao, Zhengzhou University of Light Industry, China
Copyright © 2024 Wu, Jin, Yu and Zhang. This is an open-access article distributed under the terms of the Creative Commons Attribution License (CC BY). The use, distribution or reproduction in other forums is permitted, provided the original author(s) and the copyright owner(s) are credited and that the original publication in this journal is cited, in accordance with accepted academic practice. No use, distribution or reproduction is permitted which does not comply with these terms.
*Correspondence: Lifang Wu, MTM1NTcwMTk2NzVAMTYzLmNvbQ==
 Lifang Wu
 Qingren Jin
