 Salman Habib1,2*
 Muhammad Tamoor3
 Muhammad Majid Gulzar1,4
 Sohaib Tahir Chauhdary5Hasnain Ahmad1,6
 Mohammed Alqahtani7
 Muhammad Khalid4,8*
- 1Control and Instrumentation Engineering Department, King Fahd University of Petroleum & Minerals, Dhahran, Saudi Arabia
- 2Interdisciplinary Research Center for Smart Mobility and Logistics, King Fahd University of Petroleum & Minerals, Dhahran, Saudi Arabia
- 3Department of Electrical Engineering and Technology, Government College University Faisalabad, Faisalabad, Pakistan
- 4Interdisciplinary Research Center for Sustainable Energy Systems (IRC-SES), King Fahd University of Petroleum & Minerals, Dhahran, Saudi Arabia
- 5Department of Electrical and Computer Engineering, College of Engineering, Dhofar University, Salalah, Oman
- 6Department of Electrical Engineering, Pakistan Institute of Engineering and Applied Sciences (PIEAS), Islamabad, Pakistan
- 7Department of Industrial Engineering and Center for Engineering and Technology Innovations, King Khalid University, Abha, Saudi Arabia
- 8Electrical Engineering Department, King Fahd University of Petroleum & Minerals (KFUPM), Dhahran, Saudi Arabia
This study aims to investigate the potential of rooftop solar photovoltaic systems for commercial buildings. Helio-Scope software is utilized to perform simulations to determine the ideal rooftop area for photovoltaic panels. The efficiency of photovoltaic systems is impacted by the shading effects of photovoltaic modules installed in parallel rows. To enhance energy output, the optimal distance between rows is determined, and it is found that 5-feet inter-row spacing provides the best results. The simulation results indicate that with 5-feet inter-row spacing, photovoltaic system has an energy generation of 371.6 MWh, specific yield of 1508.0 kWh/kWp, performance ratio of 82.1%, solar access rate of 98.9%, total solar resource fraction of 96.3% and a total irradiance of 1655.9 kWh/m2. The annual nameplate energy is 425.1 MWh, output energy at irradiance levels is 423.1 MWh, optimal DC output is 378.5 MWh, inverter output is 373.5 MWh, and total energy delivered to the national power grid is 371.6 MWh. The average daily DC inverter input power is 158881.5110 W and the average daily AC inverter output power is 152231.6311 W, showing an inverter efficiency of approximately 95.93%. Moreover, detailed testing of the installed PV system is performed on-site to make sure that equipment’s performance guarantees are achieved, the system is properly installed and its configuration is suitable for commercial operations. The maximum daily output energy generation of an installed photovoltaic (PV) system is 1.33 MWh, and its average energy generation is 1.09 MWh. The voltage of all strings is within the rated range of the inverter, with a maximum voltage of 835 V and a minimum of 698 V, as tested by PV string open-circuit voltage. The inverter efficiency test is also performed, with a maximum efficiency of 98.83% and fill factors ranging from 81.37% to 82.34%. The payback period of a photovoltaic system is 4.22 years and LCOE is 0.0229$/kWh. PV system saved 215569.818 metric tons of CO2 in the first year and a total of approximately 5068976.99 metric tons in 25 years.
1 Introduction
With the advancement of industrialization and urbanization, the world’s energy consumption continues to increase. Every day more people are migrating to cities, where they live in a society confined to buildings. As a result, the daily energy consumed by buildings grows exponentially and increases the emissions of greenhouse gases (GHG) (Musa et al., 2024). Buildings are among the priorities for climate change mitigation strategies since they account for one-third of the world’s final energy consumption and one-fifth of its greenhouse gas (GHG) emissions (Lang et al., 2016). Approximately 74% of the worldwide energy needs are met by fossil fuels (International Energy Agency, 2020). As the main source of energy generation, fossil fuels especially natural gas, coal, and diesel pose significant problems to global warming and GHG. There is an increase in the development and integration of sustainable energy sources to fulfill energy demands in order to lessen these issues (Habib et al., 2023a; Ehsan et al., 2024; Bashir et al., 2024; Habib et al., 2023b).
Photovoltaic (PV) offers a promising technology to achieve this goal because of its significant and prominent environmental benefits as that of a low-carbon energy source and its substantial potential for economic development (Liu et al., 2022; Tamoor et al., 2022a; Nguyen et al., 2024; Bhatti et al., 2024; Wen et al., 2022). After a significant reduction in photovoltaic manufacturing costs due to large-scale deployment, photovoltaics has become economically competitive with alternative energy sources around the world (Zander et al., 2019; Tamoor et al., 2022b; Sinha and Ghosh, 2024; Tamoor et al., 2022c; Tamoor et al., 2020). The main factors behind the constant growth of this technology are its significant cost reduction and the environmental problems associated with fossil fuels. The global cumulative photovoltaic installed capacity has increased exponentially from nearly 0 GW in 1990 to 505.0 GW in 2018 (Appavou et al., 2019). Additionally, 102.4 GW of new PV systems were installed globally in 2018 (Muteri et al., 2020). In contrast to concentrated solar power (CSP) systems, photovoltaic technology can generate energy also in regions with moderate levels of solar irradiance. As a result, this technology has the potential to be utilized (i.e., at the commercial or residential level), and the idea of the solar city has captured the interest of many engineers and researchers (Bouramdane et al., 2021; Tamoor et al., 2021a; Huda et al., 2024; Alshehri et al., 2024; Miran et al., 2022; Tamoor et al., 2021b).
The energy consumption of buildings is increasing rapidly every day in both hot and cold regions (Huang and Zheng, 2018; Kang et al., 2021; Habib et al., 2023c). Office buildings contribute considerably more to this high consumption of energy, consuming 17% of all energy globally (EIA, 2016; EIA, 2006). Energy consumption in Asian countries is extremely high during the summer solstice (Ramli et al., 2017; Liu et al., 2021). The high load during the summer is a result or consequence of the energy required for cooling in both commercial and residential buildings. In the upcoming years, global warming will increase the load even more (Prieto et al., 2018; Van Ruijven et al., 2019). In Asian countries, buildings account for 80.0% of the total energy consumed (Asif, 2016; Shaahid and Elhadidy, 2008), but in European countries, this share is only 40.0% (Machete et al., 2018). In particular for office buildings, photovoltaic installations can be a suitable option to meet the high summer energy demands as the energy generation pattern of photovoltaic systems matches the load pattern of office buildings because primary loads of buildings are high during office time i.e., daytime.
Rooftop PV is an excellent option to integrate renewable energy into the national grid without changing the use of land or adding more distribution or transmission lines (Wiginton et al., 2010; Palmer-Wilson et al., 2019). Rooftops of urban buildings offer potential and suitable sites for photovoltaic (PV) installations. However, an effective approach to harvesting rooftop solar potential by identifying suitable and appropriate roofs to optimize photovoltaic (PV) installations still seems to be challenging (Mohajeri et al., 2018; Mountain and Szuster, 2015). Research on optimizing photovoltaic (PV) installations has started to progress mainly in developed countries in Europe and America, however, there is a shortage of maps showing the potential of solar energy generation for future solar urban planning (Huang et al., 2019). The size of the research area is one of the most crucial factors in assessing the potential of rooftop photovoltaic systems (Schallenberg-Rodríguez, 2013). Applying the same methodologies on a local, regional, or continental scale is often not possible because of the time-consuming procedures, the substantial cost of obtaining the information from various sources, and the lack of diversity in some sections of the data.
Studies investigating PV self-consumption have primarily examined case-specific building types, such as single-family homes (Lang et al., 2015; Chwieduk and Chwieduk, 2021), large-size office buildings (Prajapati and Fernandez, 2019), university campuses (Ali and Alomar, 2022; Tarigan, 2018), or multiple buildings (Ahsan et al., 2020). The utility-scale rooftop photovoltaic system installed in Switzerland was analyzed by Assurin et al. (Assouline et al., 2018) using random forests to determine its generation capability. They proposed a method for calculating roof areas that are available for installing photovoltaic modules and assessed the shading losses brought on by surrounding buildings and trees, without accounting for the losses brought on by mutual shade of the tilted photovoltaic modules. Fina et al. (2020) developed a method to evaluate the economic viability of roof-top photovoltaic systems depending on neighboring energy communities and expanded roof-top photovoltaic potential to analyze the renewable energy-related policy goals of Austria. Shukla et al. (2016) designed and installed a stand-alone 110-kW photovoltaic system on the flat roof of an Indian hostel. The authors thoroughly examined the technical as well as financial aspects of the proposed photovoltaic system; however, the shading losses were not taken into account. The technical performance of a 5-kW roof-top photovoltaic system was assessed by Yadav and Bajpai (2018). They examined the array efficiency, CUF, average daily energy output, and energy yield of PV systems, but they did not analyze the shading losses. A 200-kW roof-mounted photovoltaic system was studied by Kumar et al. (2019) by using PVSyst simulation software to calculate approximate output energy generation and energy loss and analyze the performance ratio, efficiency of the system, and CUF.
Satpathy et al. (2021a) designed a 19.2 kW grid-connected PV system using PVsyst software, taking into account the site’s meteorological data, available components, and numerous loss characteristics for residential buildings. The 3D modeling of the roof is performed in the Sketchup Skelion environment to ensure optimal module placement and prevent unexpected shading during operational hours. The analysis indicates that the estimated system size suggested by both software tools matches closely, with the maximum output of the proposed system estimated at 25 MWh/year. Additionally, the system and maximum array losses are determined to be 0.44 and 0.93 kWh/kWp/day, respectively. Another research examines a comprehensive examination of a 100 kW grid-connected photovoltaic system, including its location, system design, module orientation, selection of components, loss analysis, and energy yield. This research has been utilizing the most efficient PVsyst software for determining acceptable parameters for the optimum planning and designing of a 100 kWp PV system (Satpathy et al., 2021b). In order to determine the prospective benefits of rooftop PV systems, several researchers (Singh, 2020; Mohamed et al., 2024; Tamoor et al., 2023; Al-Amin et al., 2024; Monna et al., 2020; Vargas-Salgado et al., 2024; Yang et al., 2024; Thotakura et al., 2020; Abd Elsadek et al., 2024) utilized simulation software like PVSyst, HelioScope, Homer Pro, Solmetric SunEye, PVGIS, and PV*Sol.
The RETScreen software has been employed to conduct techno-economic, and environmental analyses for a 10.0 MW utility-scale grid-connected PV system across seven cities in Benin. According to the assumptions described in this research, the photovoltaic system generates approximately 13,222 MWh per year of electricity that can be exported to the grid. This results in a PR of approximately 67.3% and a capacity factor of 15.1%. The project produces an LCOE that ranges from 0.110 USD/kWh to 0.125 USD/kWh. In comparison to the utility grid, the utility-scale PV system reduces CO2 emissions by approximately 76.0% (Akpahou et al., 2024). Boruah and Chandel (2024) conducted a technical and economic feasibility study on five commercial grid-connected PV systems with battery energy storage under both net-metering and without net-metering regimes. The Solar Labs and PVSyst software have been used for system design and energy generation calculation, proceeded by HOMER grid software and Excel-based financial simulations for optimization of systems and cost-benefit analysis. The analysis indicated a 200 kWp PV system integrated with a 250 kWh energy storage under net metering as the most optimized solution, with an energy generation cost of 4.21 INR/kWh and a payback period of 6.15 years.
Another research intended to assess the technical, economic, and environmental performances of grid-connected and stand-alone hybrid systems across 21 provinces in seven regions of Turkey, taking into account variations in regional solar irradiations and wind speed. Hybrid systems have been designed and simulated utilizing the HOMER PRO to supply the daily energy demand of 13.2 kWh/day for a home. The results indicated that the most suitable configurations are PV/WT/Grid for a grid-connected hybrid system and PV/WT/DG/BESS for a stand-alone hybrid system. The NPC value ranges from $2,540 to $8,951 for grid-connected and from $23,372 to $40,858 for stand-alone systems (Ayan and Turkay, 2023). This research presents a techno-economic evaluation of grid-connected PV systems in arid regions, focusing on the aspect of peak shaving. The impact of a commissioned 102 kW PV system on peak shaving for the waste-management organization building is evaluated as a practical case. The findings confirm that the installed PV system reduces the peak demand of commercial buildings by an average of 40%–50% during summer afternoons. The results indicated that the proposed project is economically feasible, demonstrating an NPV of €43,671 and an IRR of 34.5% (Mousavi and Bakhshi-Jafarabadi, 2024).
The objective of this research is to examine the potential and assess the optimum methods for installing a grid-connected photovoltaic system on the roof of commercial buildings. This research study comprehensively investigates the constraints/challenges on commercial building rooftops in order to evaluate the utilization of rooftop areas for photovoltaic energy systems. The current research work consequently fills a gap in the scientific literature as it aims to determine the potential of photovoltaic installation on commercial buildings. Commercial buildings vary widely in terms of their sizes and purposes. The shopping plaza is the primary building type covered in this study. The range and intensity of various architectural, structural, and service characteristics that limit the usage of photovoltaics on building rooftops are examined using satellite images. Site visits were also conducted to review and understand the condition of the roof in detail and to verify the results of the assessment procedure based on satellite images. Software such as HelioScope, Aurora Solar, and some standard data are used in the design. For this system, PV modules are mounted on a fixed-mount racking system. The grid-connected photovoltaic system is designed with the HelioScope software. The 3D model is designed and shadow loss is analyzed using Aurora Solar. Building a 3D model with appropriate photovoltaic module configurations, such as azimuth angle, tilt angle and inter-row spacing is challenging when using HelioScope software. In order to optimize solar irradiation, the PV modules are installed at 180° azimuth angle and a 15° tilt angle. To maximize the output energy production of the PV system, we examined different Inter-row spacing.
Although ground-mounted photovoltaic systems are easier to operate and require less maintenance, it is difficult to install PV systems in metropolitan areas due to the cost and availability of land. In contrast, rooftop photovoltaic systems involve no land costs and block solar irradiance from making direct contact with the roof’s exterior surface. High temperatures in extremely hot regions, cause building roofs to heat up due to direct sunlight hitting the roof surfaces. In these hot climate regions, solar (PV) modules mounted on building roofs would reduce building cooling energy requirements due to their ability to shade the roof. Utilizing a grid-connected photovoltaic system reduces the electricity bill because it minimizes the need for a 100% electricity supply from the national grid. The shopping plazas will profit from reduced energy bills, the ability to meet load demand, and be friendly to the environment if the rooftop space of the commercial shopping plazas is utilized efficiently. As a result, it would be highly beneficial to assess the performance of roof-top photovoltaic systems installed on commercial shopping plazas. In summary, the contributions of this research work are as follows.
• Detailed solar resources including solar irradiance (kWh/m2), wind speed (m/s), ambient temperature (°C), and hourly PV module temperature (°C) for each month have been analyzed.
• A comprehensive analysis has been conducted to study the impact of solar resources on the efficiency and performance of a photovoltaic energy generation system.
• The majority of current research studies assess rooftop photovoltaic systems in a similar way as ground-mounted photovoltaic systems without taking into consideration the mutual shading between parallel arrays of rooftop PV systems. To optimize the inter-row spacing of parallel PV arrays, this research considers and analyzes both rooftop shading and mutual shading between parallel PV arrays.
• Monthly and annual generation (kWh), as well as hourly input power (DC) and output power (AC) at inverters terminal, were used to analyze the performance of the grid-connected photovoltaic system on a commercial shopping plaza over the period of a year.
• Comprehensive assessment of a photovoltaic system’s losses, including those caused by irradiance, shading, soiling, reflection, mismatch, temperature, clipping and wiring, etc.
• Detailed testing of the installed PV system is performed including photovoltaic string open-circuit voltage test, photovoltaic string short-circuit current test and other parameters, inverter efficiency tests, and earth resistance and insulation test of DC and power cables.
• Annual energy depreciation of installed photovoltaic system for 25 years as well as actual generation of PV system at 100% load and performance ratio were performed at the site to make sure that the equipment’s performance guarantees are met, properly installed, and suitable for commercial operations.
• Finally, indicators related to environmental impact (quantitative information for reducing CO2 emissions), levelized cost of energy, and payback period were evaluated.
2 Methodology
From a methodological point of view, this research uses an empirical and deductive research design to improve the energy generation performance and efficiency of rooftop photovoltaic systems. From an operational and economic perspective, the ultimate objective of this research is to investigate how different design factors affect a rooftop photovoltaic system’s ability to generate energy. These factors such as tilt and azimuth angles, GHI, ambient temperature, and shading from the surrounding obstacles as shown in Table 1.
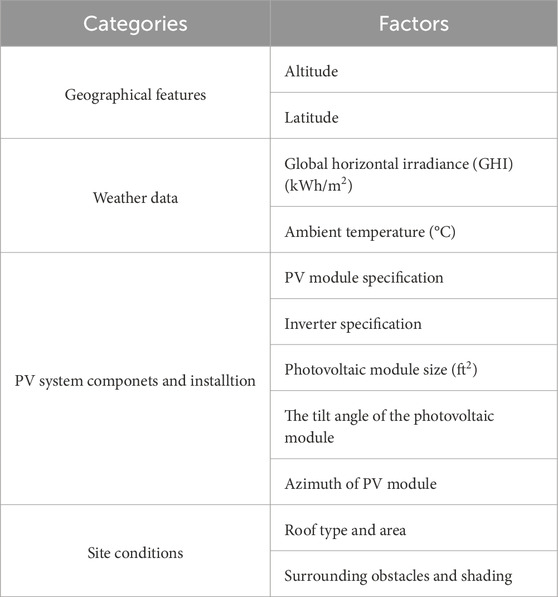
Table 1. Factors influencing PV system performance.
2.1 Performance indices
Several indicators were established in accordance with international standards (IEC--61724) used to examine the performance of roof-mounted grid connected PV systems. In this study, the performance indices taken into consideration are the target, actual and specific yields, performance ratio, system efficiency, and losses in the system.
2.1.1 Target AC yield
Equation 1 is used to compute the target AC yield (Alshehri et al., 2024; Malaysia, 2016).
where
where
where
Commonly, target yields are calculated before the installation of grid-connected photovoltaic systems. The target yields are calculated by adding values of P (array)STC, ηsub_system, PSH, and kderation into Equation 1 and multiplying by the month’s total number of days (for example, 31 days in March). It can be observed that while PSH fluctuates each month due to the fluctuating amounts of solar irradiation, values of P (array)STC, ηsub_system, and kderation are nearly constant. The peak sunshine hours are calculated by using Equation 4 (Alshehri et al., 2024; Malaysia, 2016).
where
2.1.2 Specific yield
Yield is the term used to define how much energy a grid-connected photovoltaic system produces. It is one of the most significant performance indicators for an on-grid PV system because it has direct impact on performance ratio (PR). Equation 5 is used to calculate the measured AC yield produced by a photovoltaic system (Alshehri et al., 2024; Malaysia, 2016).
where EAC is measured AC output energy in kWh at time “t” (month, day, or hour), and N is the number of observations. Equation 6 is used to calculate the measured DC yield (Alshehri et al., 2024; Malaysia, 2016).
where EDC is the measured DC output energy in kWh at time “t” (month, day or hour), and N is the number of observations. The quantity of energy produced (AC) by system per-unit capacity is described as the specific yield and calculated by using Equation 7 (Alshehri et al., 2024; Malaysia, 2016).
2.1.3 Performance ratio
Performance ratio defines an important quality factor that assesses the performance of a photovoltaic system and indicates how close, in practical operations, its performance resembles the ideal performance, regardless of site location, PV module orientation, azimuth angle, tilt angle, and module nominal-rated power capacity. It provides a normalized indicator of the system and contains all design and installation characteristics. The target and measured PR are calculated by using Equation 8 and Equation 9 (Alshehri et al., 2024; Malaysia, 2016).
2.1.4 System efficiencies
The efficiency of the photovoltaic system is divided into three categories: inverter efficiency, photovoltaic array efficiency as well as system efficiency. These efficiencies could be calculated on an annual, monthly, daily, or hourly basis, depending on the available data as well as the desired scale of information. The system efficiency depends on the AC output energy, while the array efficiency depends on the output DC energy. Array efficiency is a measure of the average energy conversion efficiency of photovoltaic arrays and this is the ratio of the daily DC output energy of the array to the product of the daily total solar irradiation in the collector plane and the total surface area of a photovoltaic array. Equation 10 is used for calculating the inverter efficiency (Wittkopf et al., 2012; de Lima et al., 2017).
The photovoltaic array efficiency and system efficiency of a grid-connected photovoltaic system are calculated by using Equations 11 and 12 (Wittkopf et al., 2012; de Lima et al., 2017). The performance of a complete installed solar (PV) system is represented by overall system efficiency.
Where EAC is measured AC output energy, EDC is the measured DC output energy, Hcol. plane is total solar irradiation in collector plane (kilowatt-hour/meter2), and Am is PV module area (m2).
2.1.5 Losses analysis
The grid-connected photovoltaic system experiences energy losses in various forms, however, system and array capture losses are those that are most significant. The system losses are caused by the conversions of DC energy into AC energy through PV inverter and calculated by using Equation 13 (Alshehri et al., 2024; Malaysia, 2016; Kymakis et al., 2009):
The PV array capture losses are losses associated with array operation that show how PV array is unable to completely utilize the available irradiation. PV array capture losses are calculated by using Equation 14.
2.2 Rooftop photovoltaic system description
Photovoltaic modules are installed in parallel rows by connecting them in series to form strings. For impartial and unbiased research of rooftop photovoltaic systems, the system is designed with high-efficiency photovoltaic modules (Tier 1). To do this, the capacity of the roof photovoltaic system is first calculated for available roof surface area and specific inter-row distance. If the photovoltaic module is facing the sun, a module can get more solar irradiation, which can increase its efficiency. Sun changes its trajectory around the horizon. Trajectories are higher in the summer season and lower in the winter season. The sun’s route around the horizon shifts. The path is steep in the summer and low in the winter. To accommodate these seasonal changes in the sun’s trajectory, optimal tilt angles of PV arrays are used, at which the photovoltaic system generates maximum energy for each month. In this research, the Longi Solar Mono PERC Half Cell (LR4-72HPH 435 M) photovoltaic module, Huawei (SUN 2000-60KTL-M0), and Outgoing LT Cabinet with 630A rating are used, and Table 2 shows the basic information of PV Plant.
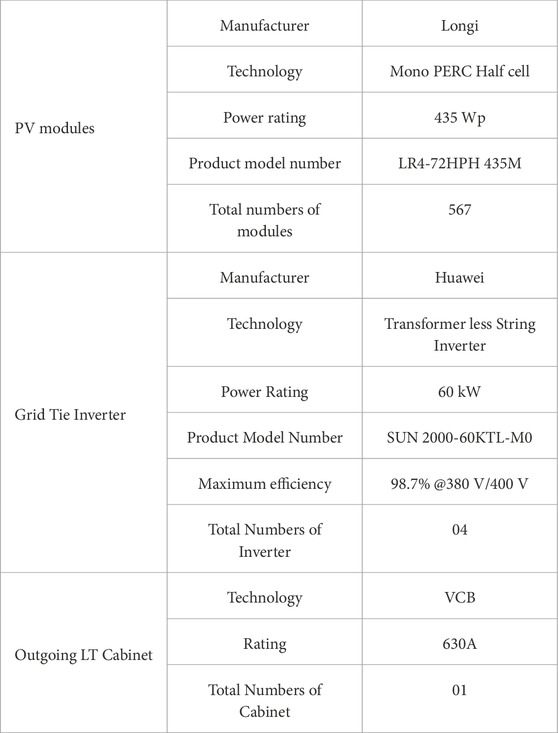
Table 2. Basic information about PV plant.
2.3 Testing of installed PV power system
Detailed testing has been performed at the site before commissioning to make sure that the equipment’s performance guarantees are met, properly installed, correctly adjusted, and suitable for commercial operations. Different testing of installed PV power systems includes.
1. Photovoltaic string open-circuit voltage test
2. Photovoltaic string short-circuit current test and other parameters
3. Inverter efficiency tests
4. Earth resistance and insulation test of DC and power cables
5. Performance ratio
2.4 Installation site
The building of a commercial shopping plaza is taken as the case study for installation of rooftop on-grid photovoltaic system. There is no specific data on the roof type and roof area of the commercial building; therefore, just one commercial building was chosen. The commercial building is located at 31.4635762 and 73.0816969 in Faisalabad, Pakistan. The satellite view and physical layout of the commercial shopping plaza are shown in Figure 1.
The commercial shopping plaza has a flat roof and two buildings. The total construction area of a commercial shopping plaza is 52,641 square feet, and the total area available for the installation of a photovoltaic system is 37,074 square feet.
• Building 1 (Field Segment 1): The first field segment of the commercial shopping plaza has 27,153.5 square feet of roof area for solar (PV) system installation and a flat roof. The photovoltaic (PV) modules are installed on the flat roof at a fixed tilt angle.
• Building 2 (Field Segment 2): The second field segment of the commercial shopping plaza has 9,920.8 square feet of roof area for solar (PV) system installation and a flat roof. The photovoltaic (PV) modules are installed on the flat roof at a fixed tilt angle.
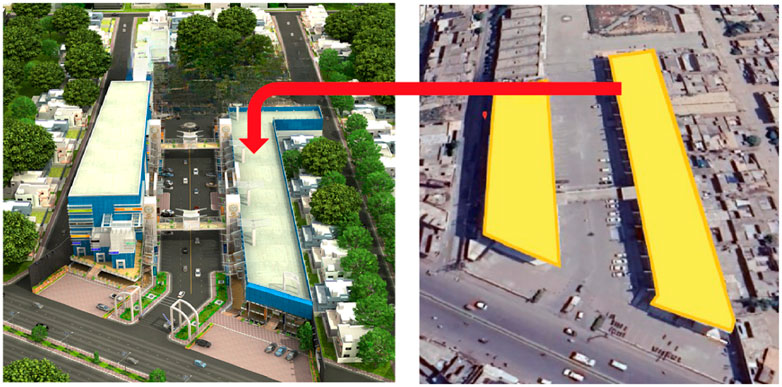
Figure 1. Satellite view and physical layout of a commercial shopping plaza.
A survey of the site was conducted and found that there were no noticeable obstructions (like high-rise surrounding buildings and trees) that create shadows on the installed PV modules. The helioScope model was developed taking into consideration the architectural design of a building, specification of the photovoltaic system (module, inverter, etc.), and shading factors. Physical features are modeled in the system, including system size, PV module type (Si-Mono, Si-Poly), tilt angle, azimuth angles, and frame size. The global map can be used to determine the partition and boundaries of the building. The detailed parameters of the photovoltaic system (such as module type and rating, azimuth and tilt angles, module orientation, structure frame size, and spacing, etc.) are imported into the parameter setting bar. Weather data sets are based on local meteorological conditions at a given location.
2.5 Calculation of appropriate roof area
The primary components of photovoltaic power generation systems, which directly transform solar energy into electric energy are photovoltaic modules. Moreover, since sun’s energy is irregular/sporadic and fluctuates with time, it is crucial to evaluate how much solar irradiance is effectively converted into electrical energy. Simulation Software makes these evaluations using measurements of surface irradiance or satellite data. Helioscope (Şevik, 2022; Tamoor et al., 2022d; Yar et al., 2022) provides benefits like adaptability, sensitivity to the technical aspects of selected PV modules, changeability or modifiability of the orientation and alignment of the photovoltaic modules, and selections of PV inverters and AC/DC wirings. Helioscope simulation software is used for rooftop photovoltaic systems in every field segment. The following Equations 15 –17 are used for each field segment.
Where.
• As: Suitable area (m2)
• Am: Photovoltaic module area (m2)
• A: Roof area of the building (m2)
• Nm: Number of photovoltaic modules settled by Helioscope software
• CS: Suitable area constant (%)
• E: Annual energy generation (MWh/year) of PV system computed by Helioscope
• Eavg/m: Average annual energy generation per PV panel ((MWh/year)/panel)
2.6 Economic analysis
The financial feasibility of an on-grid roof-mounted photovoltaic system is evaluated by considering indicators such as the payback period and levelized cost of electricity (LCOE). The LCOE is a measurement of the average net present cost of PV energy generation during its lifetime, taking into account the CAPEX of the PV power plants as well as operation and maintenance expenses (OPEX). The payback period and the LCOE are calculated using Equation 18 and Equation 19 (Habib et al., 2023d).
2.7 Environmental analysis
An environmental analysis of grid-connected photovoltaic systems was conducted using the quantity of carbon dioxide (CO2) that can be decreased by the installation of photovoltaic system on the roof of a commercial shopping plaza. The average carbon dioxide factor is 0.58 tCO2/MWh. Annual CO2 emission saved in tons is computed by using Equation 20 (Alshehri et al., 2024).
3 Results
3.1 Solar resources
Solar resource data is collected from the Meteonorm (Tamoor et al., 2022e) database. Pakistan has an extremely hot environment; thus, substantial air conditioning is needed in summer. This leads to a very high electric load during this time of year. Peak loads in Pakistan occur in the daytime during the summer solstice due to the substantial cooling loads. As a result, in order to meet high energy demands during the hot summer season, photovoltaic installations could be extremely beneficial. The amount of energy a photovoltaic system produces is directly related to solar irradiance from the sun. The amount of energy produced by photovoltaic modules increases as more solar irradiance is absorbed by photovoltaic modules (Tamoor et al., 2022e). Solar irradiance, wind speed, ambient temperature, and hourly module temperature have a significant influence on photovoltaic energy generation system’s performance. The PV module current has an almost linear relationship with solar irradiance, resulting in an increase in module current with the increase in solar irradiance. The hourly data for global horizontal irradiance (GHI) of the selected site for this research is shown in Figure 2A. According to the Figure, the summer months (April, May, June, July, August, and September) experience the highest levels of global horizontal irradiances. Furthermore, the maximum hourly value of the GHI is 915 W/m2 in May. From 8:00 a.m. until 12:30 p.m., the solar irradiance started to increase. Thereafter, it started to fall until the end of the day.
Figure 2B indicates the monthly global horizontal irradiation for the selected site. The GHI is measured in May at its highest level (188.8 kWh/m2) and in December at its lowest level (82.3 kWh/m2).
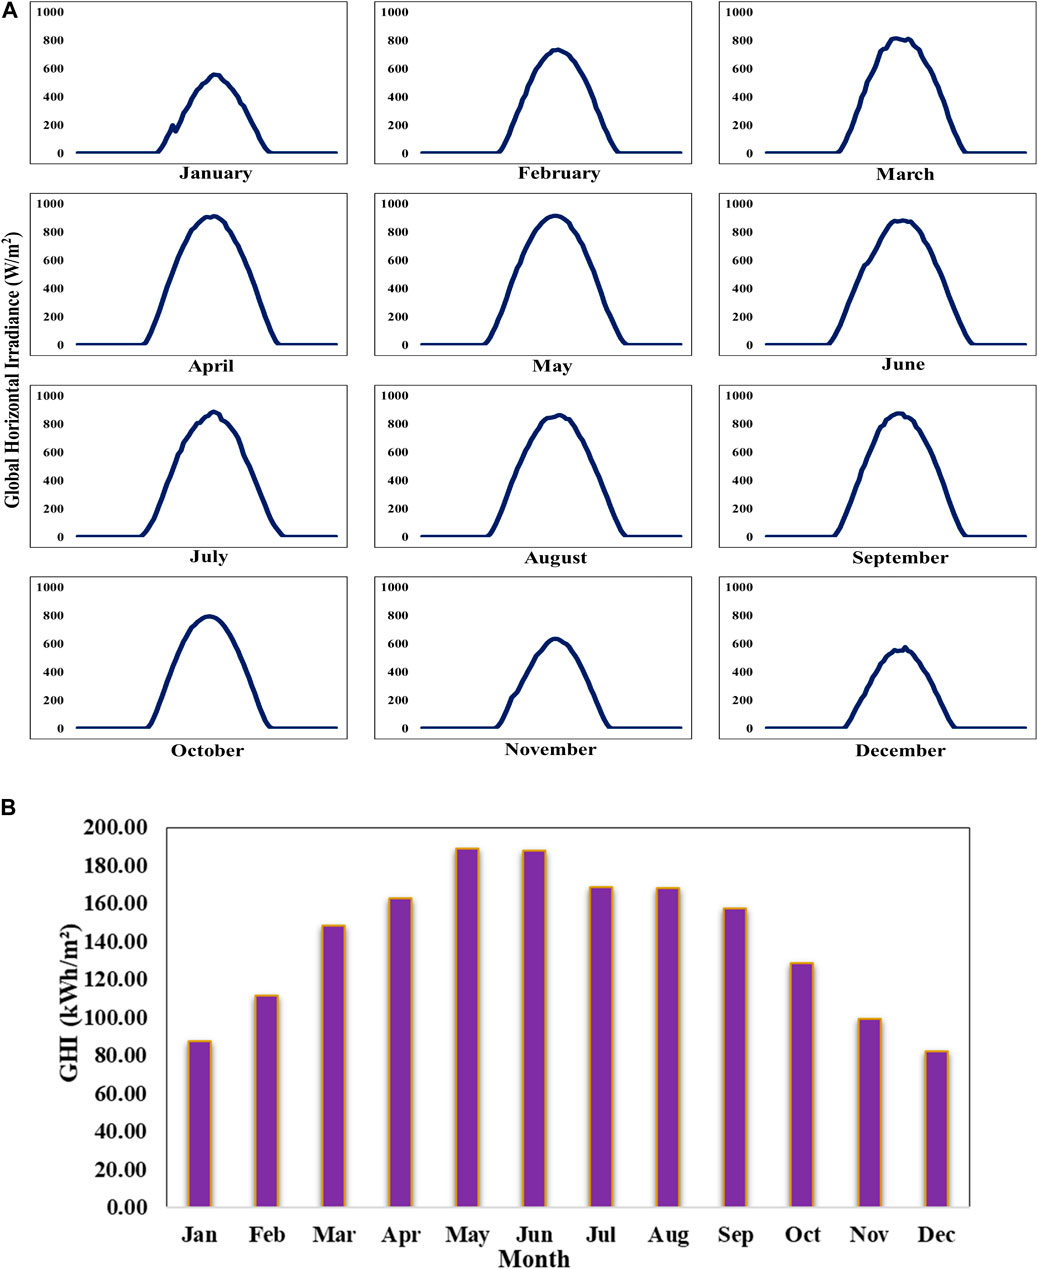
Figure 2. (A) Hourly data for global horizontal irradiance for each month (B). Monthly global horizontal irradiance (GHI) at the proposed site.
Local weather conditions are the main factor affecting wind speed. Particular unusual meteorological conditions such as monsoon season, cyclones, and hurricanes can have an enormous impact on wind speed formation. The wind speed is unstable and variable as can be observed in Figure 3A. The wind speed fluctuates between 0.3 m/s at the lowest point to 7.8 m/s at the highest point. The daily average maximum wind speed is 3.406 m/s, while the average annual wind speed is 2.133 m/s. Since the photovoltaic power generation system does not fully utilize solar irradiance, the remaining is converted to heat, which leads to the overheating of the photovoltaic modules. One of the primary external factors that adversely impact a photovoltaic system’s capability to produce power is ambient temperature. Ambient temperatures range from 5.1°C to 47.6°C, while average annual ambient temperature is 28.49°C as shown in Figure 3B. As was to be predicted, the increases in the ambient temperature are followed by increases in the levels of solar irradiance.
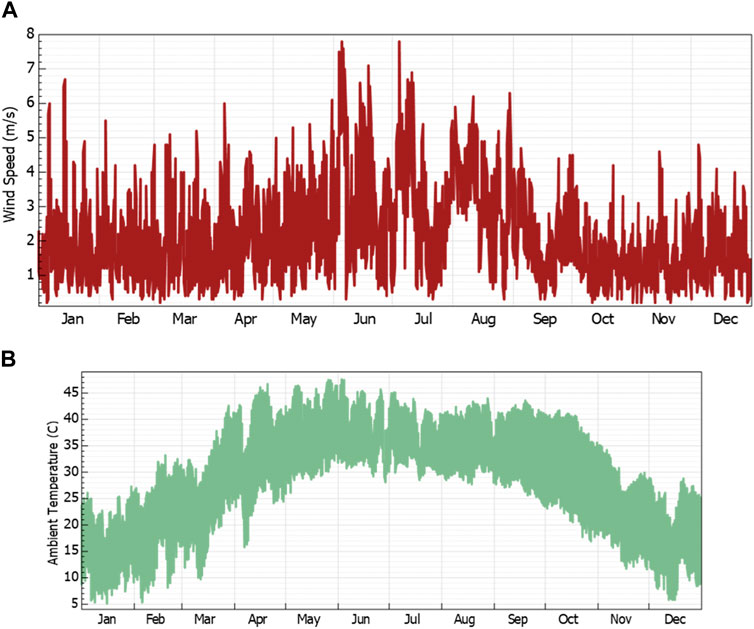
Figure 3. (A) Wind speed at the proposed site. (B) Ambient temperature at the proposed site.
The operating temperature of solar cells is reduced by wind flow over photovoltaic modules. The cooling impact of wind on photovoltaic modules makes higher wind speeds beneficial for photovoltaic module operation. The photovoltaic module’s surface temperature increases as the ambient temperature rises. Therefore, the PV module’s cell temperature will also rise, as a result the operating voltage of the solar cell and output power of the PV system both decrease (Habib et al., 2023e). The maximum hourly operating temperature (°C) of a photovoltaic module is 67.83°C in April, while the minimum hourly operating temperature is 1.22°C in January as shown in Figure 4. Additionally, the average daily maximum operating temperature of a photovoltaic module is 59.70°C, the average daily minimum operating temperature of a solar (PV) module is 4.47°C and the average annual operating temperature of a solar (PV) module is 34.85°C. The daily and annual average module temperature is an average that takes into account both daytime and overnight temperatures. The ambient temperature was consistently lower than PV module temperature, which could be a result of thermal losses that occur during power production.
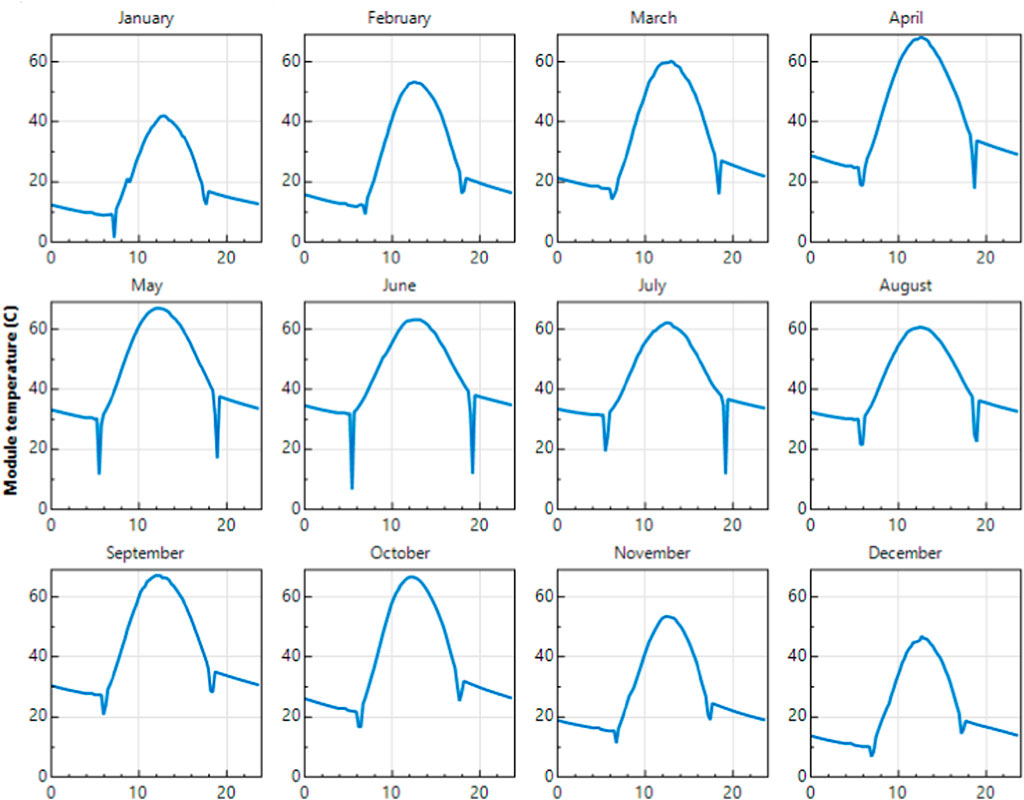
Figure 4. Hourly operating temperature of PV module for each month.
3.2 Optimization of PV systems and inter-row spacing
In order to identify the optimum inter-row spacing for photovoltaic modules and the potential output energy at the proposed site, a series of experiments have been performed. To maximize output energy production of the PV system, we examined different Inter-row spacing. The simulation experiment is divided into five different scenarios. According to research (Habib et al., 2023e), the photovoltaic system generates its maximum energy at a 15° tilt angle and 180° of azimuth in the same city. As a result, in all five scenarios, a 15° tilt angle and 180° azimuth angle are used. In five scenarios, PV module inter-row spacing is 1 foot, 2 feet, 5 feet, 8 feet and 11 feet respectively.
For the purpose of capturing the most intense solar irradiance, the photovoltaic module is tilted at a specific angle so that it faces direct sunlight for the longest duration of a day. The tilt angle of photovoltaic module creates or leads to mutual shading on parallel rows of a photovoltaic array. It is critical to determine the optimum inter-row spacing for the maximum performance of a photovoltaic system because mutual shading impacts the system’s efficiency.
The photovoltaic modules are installed in parallel rows and tested at various inter-row spacings in order to analyze the losses caused by mutual shading of photovoltaic arrays. Because of limited roof space, the total number of photovoltaic modules in the planned layout differs, with different inter-row spacing between parallel rows of PV modules. Table 3 presents the design summary of rooftop photovoltaic systems with different Inter-row spacing.

Table 3. Design Summary of rooftop photovoltaic systems.
The performance comparison of PV system with different inter-row spacing is shown in Table 4. This comparison includes annually energy generation (MWh), performance ratio of the system at different tilt angle, specific yield (kWh/kWp), solar access (%), TOF, and average total solar resource factor (TSRF).
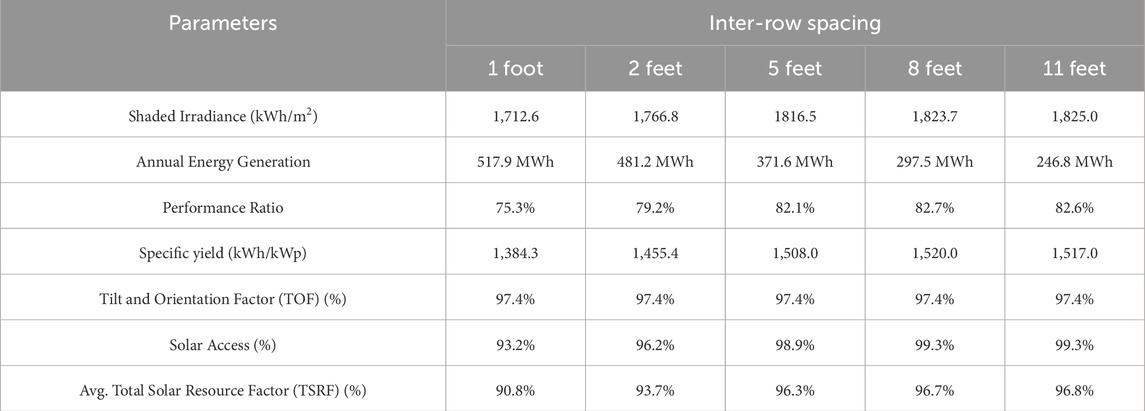
Table 4. Performance comparison of a photovoltaic system with different inter-row spacing.
The photovoltaic energy generation system installed with 1- and 2-feet Inter-row spacing has a maximum number of PV modules but the performance ratio (PR), specific yield (kWh/kWp), solar access and TSRF are low because the efficiency of the system is decreased due to mutual shading effect on photovoltaic modules. In the case of a photovoltaic energy generation system having 8- and 11-feet inter-row spacing, the overall installed capacity of PV system is decreased, but the PR, specific yield (kWh/kWp), solar access, and TSRF are high because there is no mutual shading impact on the photovoltaic modules. Results in Table 4 show that the performance of the rooftop PV system is impacted by inter-row spacing. By increasing inter-row spacing between parallel photovoltaic arrays, the impact of mutual shading on photovoltaic modules is minimized, but the cost of electric wiring and land increases as a result. By comparison analysis, we find that a photovoltaic system installed with 5 feet inter-row spacing is more efficient. With 5 feet inter-row spacing, the results of the simulation indicate that the annual energy generation of the PV system is 371.6 MWh, specific yield (kWh/kWp) is 1,508.0, performance ratio is 82.1%, solar access is 98.9% and TSRF is 96.3%.
3.3 Case study implementation
The building of a commercial shopping plaza is taken as the case study for the installation of a rooftop on-grid photovoltaic system. In accordance with the results discussed in the preceding section, a PV system with a 15° tilt angle and 5 feet inter-row spacing is designed for the commercial shopping plaza. The commercial shopping plaza has a flat roof and two buildings.
3.3.1 Photovoltaic system layout on commercial building
The roof of the commercial shopping plaza has been divided into two segments. The PV system for commercial buildings consists of monocrystalline modules mounted with an L2 structure (2 up x 1 wide) at a 15° tilt angle and 180° azimuth angle. This is because the roof of the building is flat. The photovoltaic module is installed in landscape orientation. The interrow spacing is considered to be 5 feet, a setback is 2.0 feet, and the PV module spacing is 0.040 feet. Photovoltaic modules with a shading rate exceeding 3% have been eliminated.
The schematic configuration of the connection between photovoltaic modules and inverter shows that the 34 photovoltaic strings are connected to 4 Huawei inverters (SUN 2000-125KTL-JPH0). The first two inverters (1 and 2) are each connected to eight strings, the first four strings consist of 18 photovoltaic modules each, while the four remaining strings consist of 17 photovoltaic modules each. The third inverter is connected to eight strings, each string consisting of 17 photovoltaic modules, except one string which has 18 photovoltaic modules. Similarly, ten photovoltaic module strings are connected to the inverter 4, and each string consists of 15 photovoltaic modules. The schematic configuration of the connection between photovoltaic modules and inverters is shown in Figure 5. The system employs two distinct types of disconnectors: DC breaker (2-pole) is used for each PV string and these breakers are installed between PV arrays and ongrid string inverters, while the AC breakers (4-pole) are installed between the ongrid string inverters and the utility grid. The service panel is used to connect PV systems and AC energy from the utility grid.
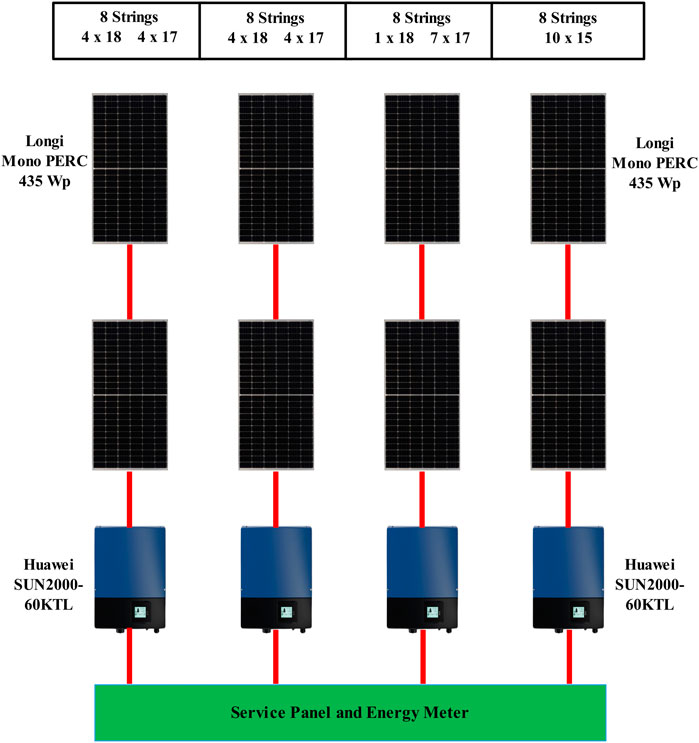
Figure 5. Schematic configuration of the connection between photovoltaic modules and inverters.
3.3.2 Energy generation
In accordance with the simulation findings, the PV system installed on the roof of a commercial shopping plaza has a DC nameplate capacity of 246.645 kW, and the AC nameplate capacity of the inverter is 240 kW with a 1.02 load ratio. The photovoltaic system installed on the commercial shopping plaza has an annual energy generation of 371.4 MWh, a specific power generation (kWh/kWp) of 1,508.4, and a performance ratio (PR) of 82.1%. Figure 6 shows the variation in DC input power (W) and AC output power (W) of all four inverters over the period of a year. The ongrid string inverter transforms input DC power to output AC power with high efficiency, as can be seen by comparing Figures 6A, B. The output power is barely less than input power from PV arrays, showing an inverter efficiency of approximately 95.93%. The maximum daily DC inverter input power is 194614.7417 W, and the average daily DC inverter input power is 158881.5110 W. The maximum daily AC inverter output power is 186698.6914 W, whereas the average daily AC inverter output power is 152231.6311 W. The inverter efficiency in the summer season is shown in Figure 7.
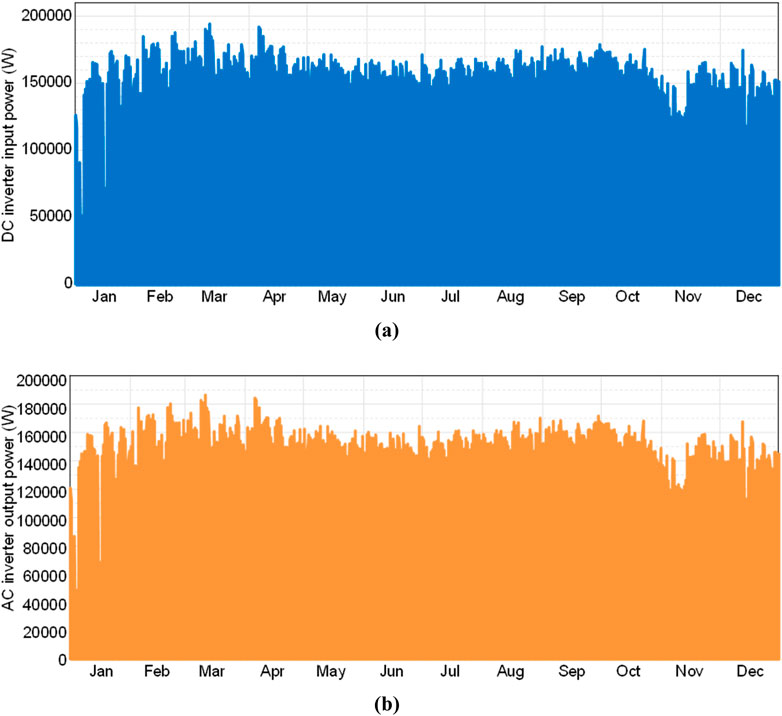
Figure 6. Variation in inverter power (A) DC input power (W) (B) AC output power (W) over a year.
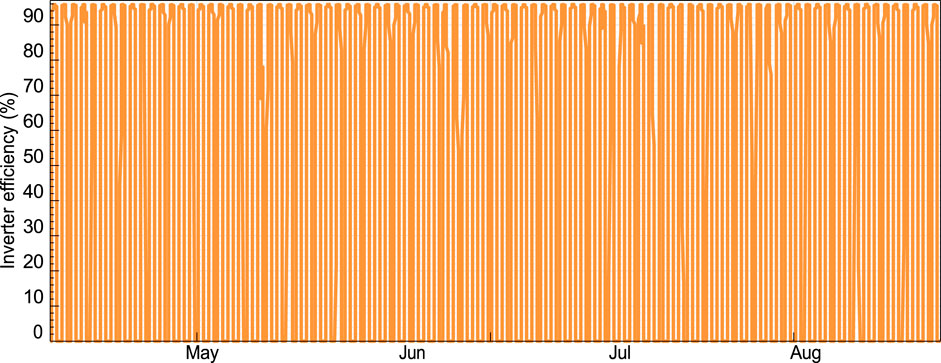
Figure 7. Inverter efficiency in the summer season.
The monthly output energy of a PV system installed with 5 feet of inter-row spacing and the measured plane of array (POA) irradiation is presented in Figure 8. The POA irradiation varied between 189.1 kWh/m2 in May and 105.3 kWh/m2 in December. The lowest values of POA irradiation occur in the winter season, and the highest values occur in the summer season. The lowest monthly energy generation is 22202.80 kWh in December, while the maximum monthly energy generation is 36960.10 kWh in May. A commercial shopping plaza’s roof-mounted photovoltaic system produced 371672.1 kWh during a year, with an average monthly electricity generation of 30972.67 kWh.
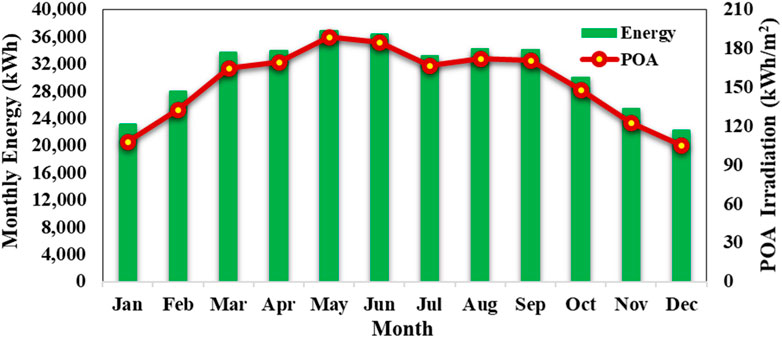
Figure 8. Monthly output energy of a PV system and POA irradiation.
As seen in Figure 8 above, the energy generation of a photovoltaic system is maximum in summer season (May–Jun) and the energy generation is minimal in the winter season (Nov–Jan). According to the simulation results, the total irradiance (kWh/m2) on collector is 1724.9 kWh/m2. Annual nameplate energy of the system is 425017.6 kWh, the output energy at irradiance levels is 423,121.8 kWh, the optimal DC output is 378460.5 kWh, the energy at inverter output is 373539.7, whereas the total amount of energy that is fed into the national power grid is 371672.1 kWh as can be seen in Table 5.
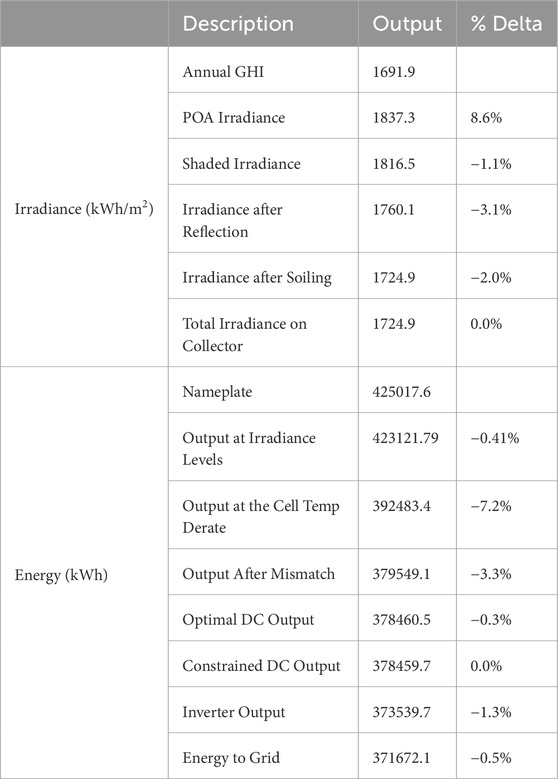
Table 5. The annual generation of installed system with 5 feet inter-row spacing.
Due to prolonged field exposure and environmental factors including temperature and humidity, photovoltaic modules are vulnerable to degradation when exposed to outside conditions. The output power of photovoltaic modules decreases due to degradation, which also affects the efficiency of solar photovoltaic systems. Manufacturers of photovoltaic modules provide performance warranties to ensure the durability and reliability of photovoltaic modules. The photovoltaic module’s performance warranty period was 5 years in the 1980s and extended to 10–20 years in the 1990s. Currently, the peak power of photovoltaic modules should not decrease to 80% of the original peak power during the 25-year performance warranty period (Jordan and Kurtz, 2013). This indicates that the power degradation rate should not be more than 0.8% per year. The annual production of roof-mounted PV system installed on a commercial shopping plaza in the first year is 371672.1 kWh, in the second year, the annual production is 369760.1 kWh, while in the twenty-fifth year, the annual production is 328329.1 kWh and total annual production of PV system in 25 years is 8739615.5 kWh as shown in Figure 9. This means that the installed photovoltaic system depreciates energy at a rate of 0.88% per year and falls in the standard warranty rate of 0.8% per year.
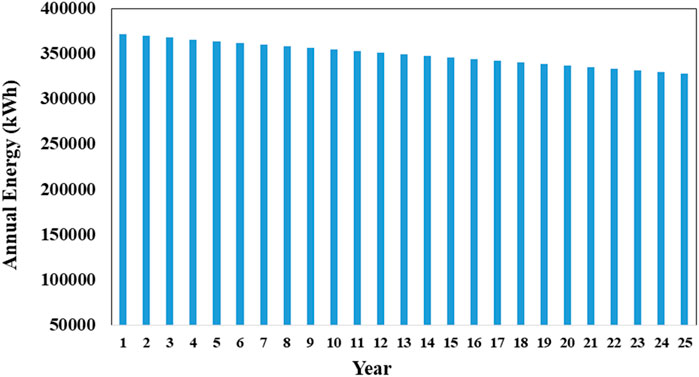
Figure 9. Annual energy depreciation of installed photovoltaic system.
The degradation rate calculated in this research study provides better results compared to previous research studies, Malvoni et al. (2020) conducted research in similar conditions and found that the degradation rate is estimated at 0.50%/year and 0.32%/year respectively, after a 50-month operational period. The research study conducted by Daher et al. (2023) indicates that the degradation rates for maximum power are 0.84% per year throughout the operational period of the system. Hasan et al. (2022) demonstrated that the performance of photovoltaic modules degrades as the temperature of the modules increases. Efficiency decreases by 0.03%–0.05% for each 1°C increase in temperature without cooling, and a decline of up to 69% at an operating temperature of 64°C.
3.3.3 Losses in PV system
The efficiency, performance, and output energy of a PV array are significantly impacted by losses in a photovoltaic system. Figure 10 demonstrates various losses of the photovoltaic system installed with 5 feet Inter-row spacing. The temperature, wiring, mismatch, clipping, AC system, inverters, reflection, shading, soiling, and irradiance are some of the system losses shown in this figure. These losses are directly correlated with the output of the PV system. In the designed system installed on a commercial shopping plaza, the system has 7.2% temperature losses, 3.3% mismatch losses, 0.40% wiring losses, 0.0% clipping losses, 0.5% AC system losses, 1.3% inverters losses, 3.1% reflection losses, 1.1% shading losses, 2.0% soiling losses and 0.41% irradiance losses.
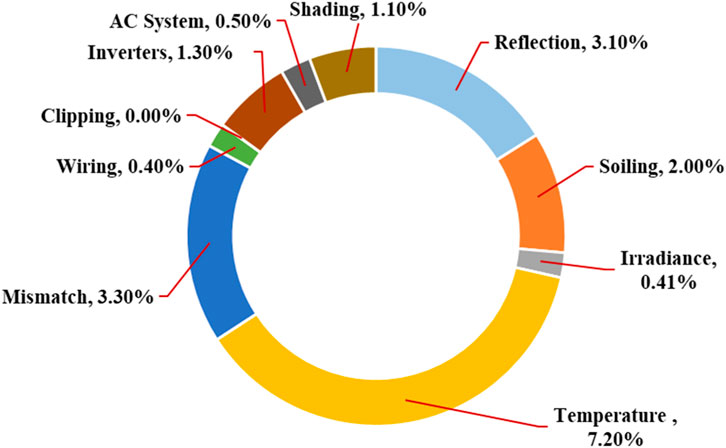
Figure 10. Losses of a photovoltaic system installed with 5 feet Inter-row spacing.
3.3.4 Monitoring and inspection of installed PV power system
Detailed testing has been performed at the site before commissioning to make sure that the equipment’s performance guarantees are met, properly installed, correctly adjusted, and suitable for commercial operations. All steps of PV module installation, inverter installation as, and cabinet installation as shown in Table 6 have been meticulously checked.
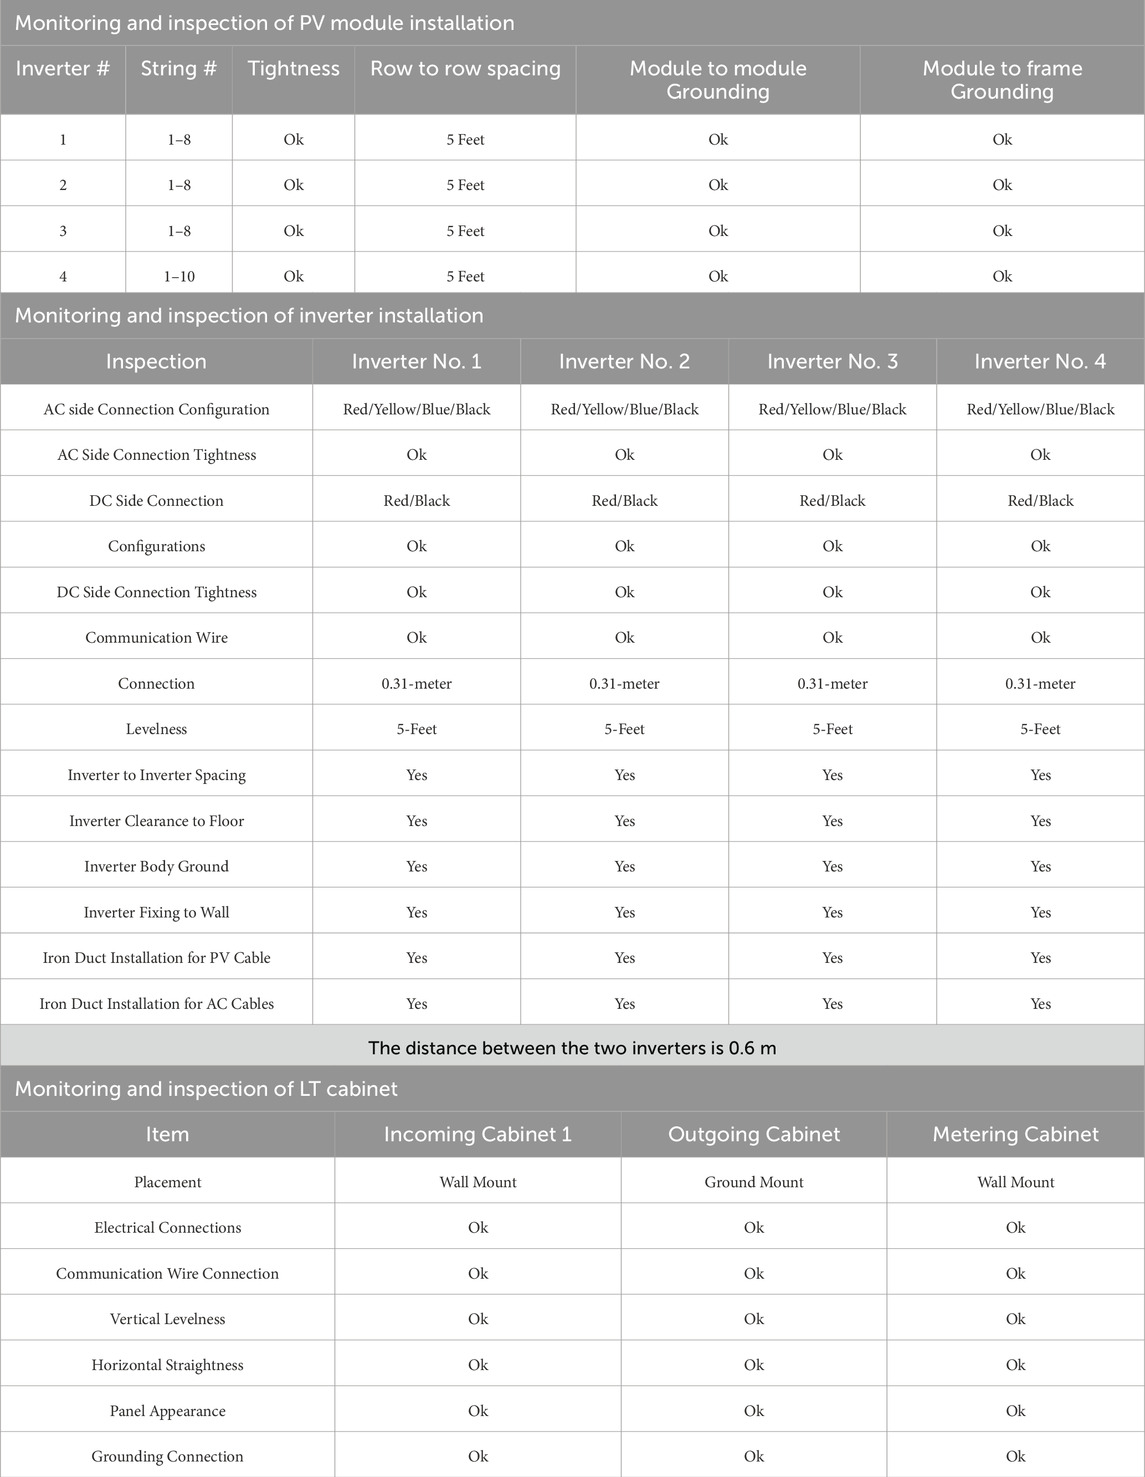
Table 6. Monitoring and inspection of Installed PV Power System.
3.3.5 Performance analysis of installed PV system
The on-grid solar (PV) system was installed on a commercial shopping plaza with a 15° tilt angle, 5 feet Inter-row spacing, and 180° azimuth angle as shown in Figure 11.
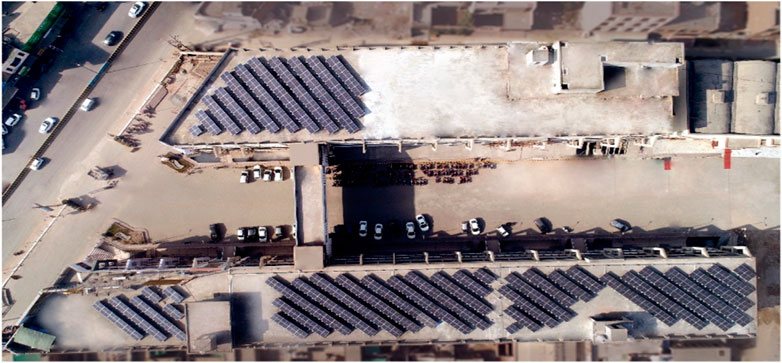
Figure 11. Installed PV system.
Test results of the installed photovoltaic system were taken for 30 days to evaluate and investigate the output generated energy (kWh) and performance of the photovoltaic (PV) system. We analyzed the experimental system in May because simulation results indicated that photovoltaic system produced the most energy during that month. Figure 12 displays the daily actual generation of the photovoltaic system and the daily irradiation level. The figure shows that the average amount of irradiation is 4.83 kWh/m2. The daily maximum output energy generation of installed PV system (1333.676 kWh) was recorded on day 23, and its average energy generation was 1091.56 kWh. Due to a faulty transformer on days 2 and 8, energy production is zero. The system is shut down for diagnostic tests from day 14 to day 16.

Figure 12. The daily actual generation of installed PV system and irradiation level.
3.3.6 Different tests performed during commissioning
1. Photovoltaic string open--circuit voltage test.
2. Photovoltaic string short--circuit current test and other parameters.
3. Inverter efficiency tests.
4. Earth resistance and insulation test of DC and power cables.
5. Performance ratio.
3.3.6.1 PV String open circuit voltage test
The maximum voltage that a solar PV cell can generate is called the open-circuit voltage, or VOC, and it occurs whenever there is no current moving/passing through the cell. Open circuit voltage (VOC) indicates the amount of forward bias of solar cell brought on by junction’s bias with the photogenerated current. For each installed inverter, the voltages of all strings are also shown in Table 7. As shown in the table, the open circuit voltages of all strings are within the rated range (MPPT range of the inverter. The maximum VOC for inverter 1 is 835 V, inverter 2 is 834 V, inverter 3 is 835 V and inverter 4 is 698 V. Similarly, maximum VOC for a string consisting of 18 PV modules is 835 V, VOC for a string consisting of 17 PV modules is 789 V and VOC for string consist of 15 PV modules is 698 V.
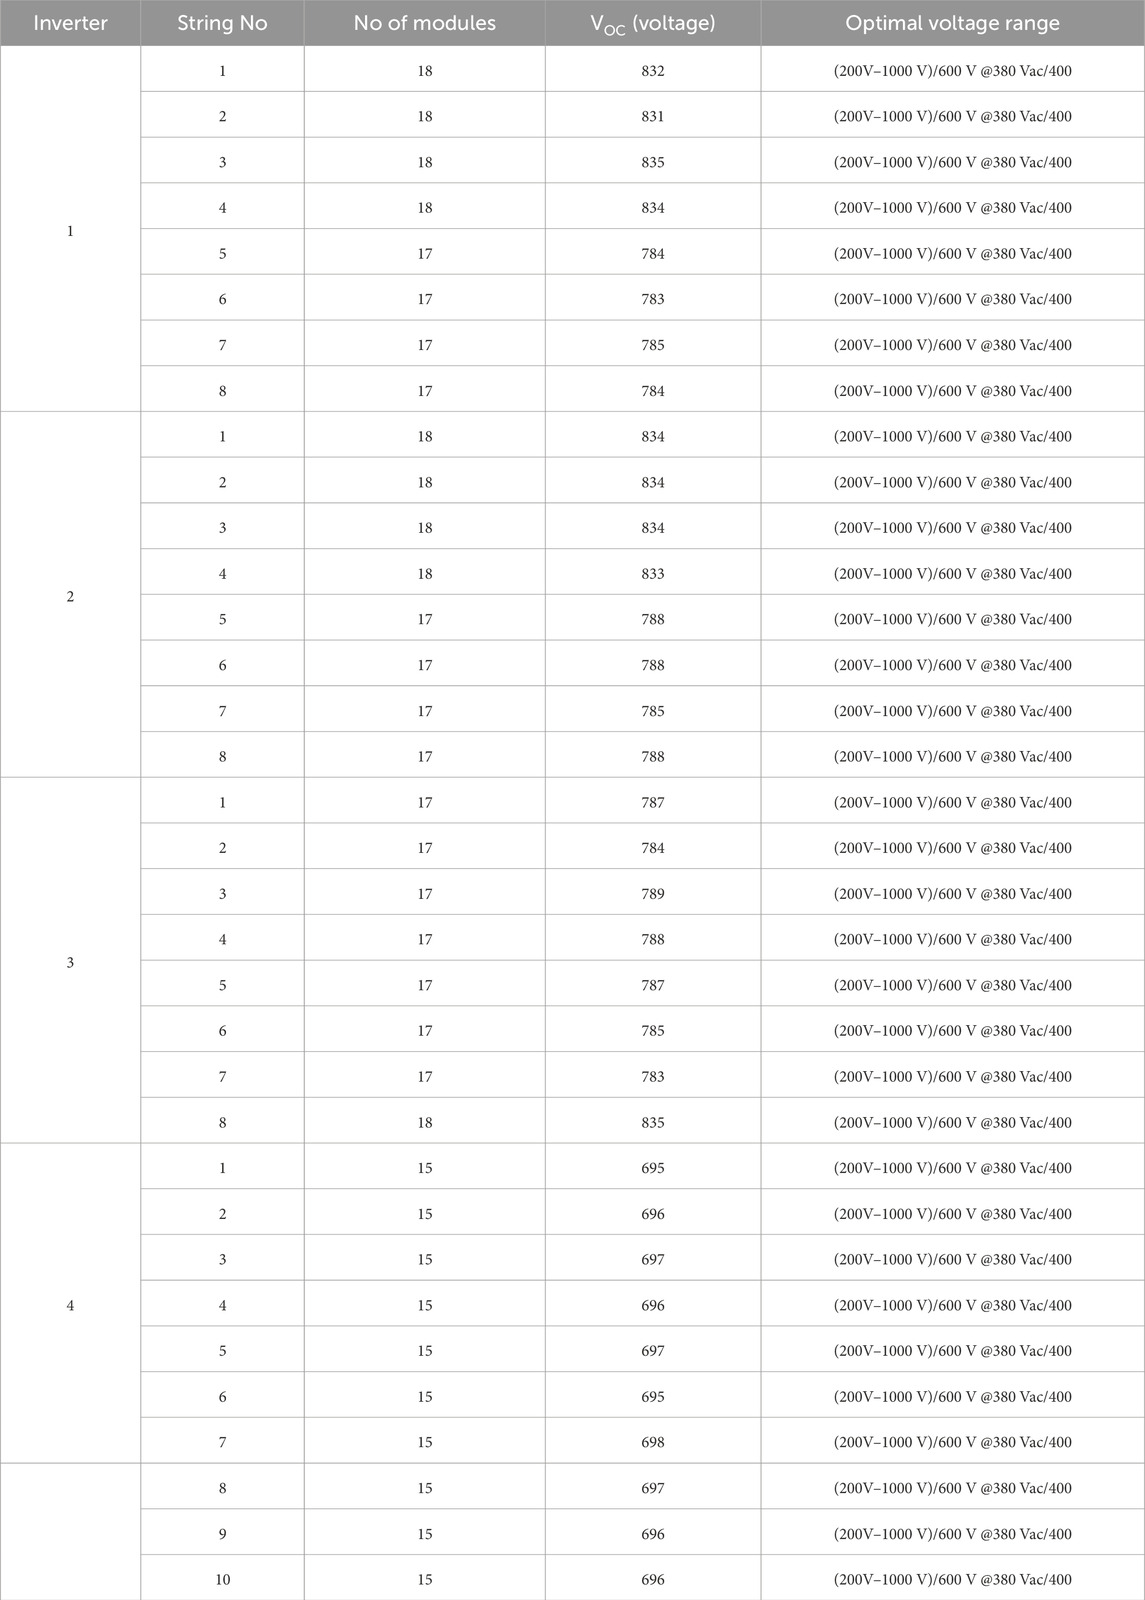
Table 7. PV string open circuit voltage test.
3.3.6.2 PV String Short circuit current test and other parameters
The maximum value of current in a PV string is called short circuit current (ISC), which flows when the positive and negative terminals are shorted together. The ISC value is employed to calculate/determine maximum current that a PV module produces when it is connected to an inverter or solar charge controller. It is extremely difficult to determine the correct current rating since current output fluctuates every second as the intensity of the sun (irradiance) on the PV panel varies. No reverse polarity was detected, and each string’s earthing continuity was apparent enough to function without difficulty. However short circuit current drop in most of the strings in the different inverters is over 5%. The current drop was probably due to low sunlight during the test time, and the shadow of the surrounding objects was also coming on the different strings. Test results of randomly selected one string of each inverter are shown in Table 8. It can be seen from the table that the short-circuit currents of the selected strings of inverters 1, 2, 3, and 4 are 9.99A, 10.0A, 9.81A, and 10.27A, respectively. The measured fill factor of inverters 1, 2 3, and 4 are 81.37%, 82.34%, 81.40%, and 81.91%, respectively.
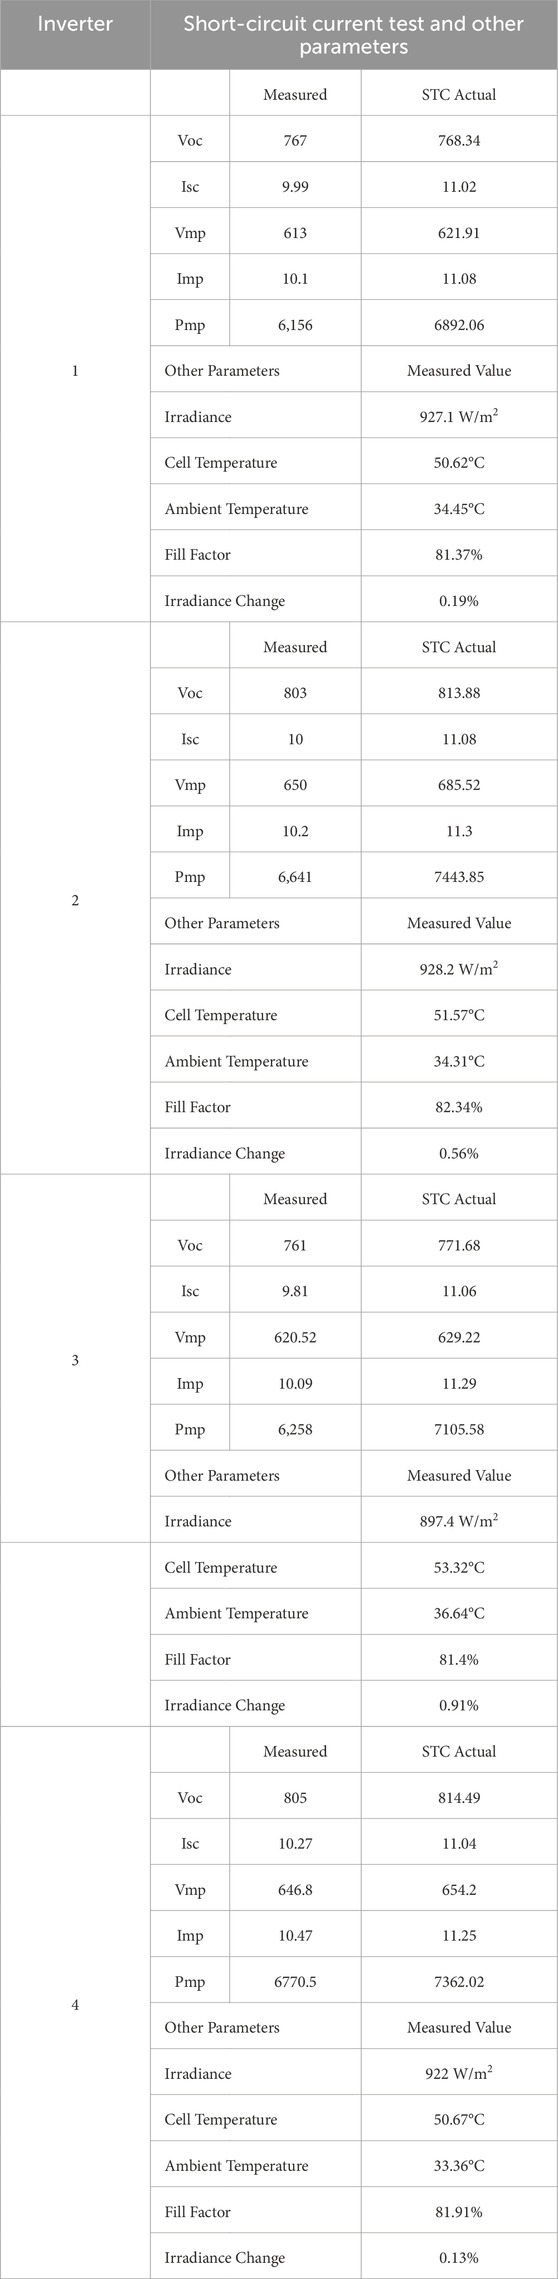
Table 8. Short circuit current test and other parameters for a selected string of all inverters.
3.3.6.3 Inverter efficiency test
The ratio of final output generated AC power to input DC power is known as inverter efficiency. Power level, input voltage, and inverter temperature all have an impact on inverter efficiency. At the inverter terminals, the input DC power and output AC power are simultaneously measured to determine efficiency in the field. The input and output power was measured at the inverter terminal and the efficiency of inverter 1 is calculated to be 98.83%, inverter 2 is calculated to be 98.76%, inverter 3 calculated to be 98.80%, and inverter 4 is calculated to be 98.81%. All inverters passed the inverter efficiency tests because their efficiency values were within the range of the rated inverter efficiency (98.7%). Other tests like the AC input connection test, DC input connection test, and communication connection test were conducted results are in the satisfactory range.
3.3.6.4 Earth resistance and insulation test of DC and AC power cables
Megger is used for earth resistance and insulation tests of DC cables (positive to negative and negative to ground & positive to ground) and AC cables or power cables (Red + Ground, Yellow + Ground, Blue + Ground, Red + Neutral, Blue + Neutral and yellow + Neutral).
It has ensured that all wire sequences have good insulation and high resistance among each other and there is not any major breakage in insulation during installation which may cause short circuit faults later on. The values of the earth resistance test of DC cables (string cables) are given in Table 9 and the Insulation test of DC cables (string cables) is given in Table 10. The value of resistance of DC cables (positive to negative and negative to ground & positive to ground) varies between 1.6 GΩ and 1.9 GΩ for all strings. These values show that there is high resistance among each other. The insulation of DC cables is the same for all strings and has a very high value (11 GΩ).
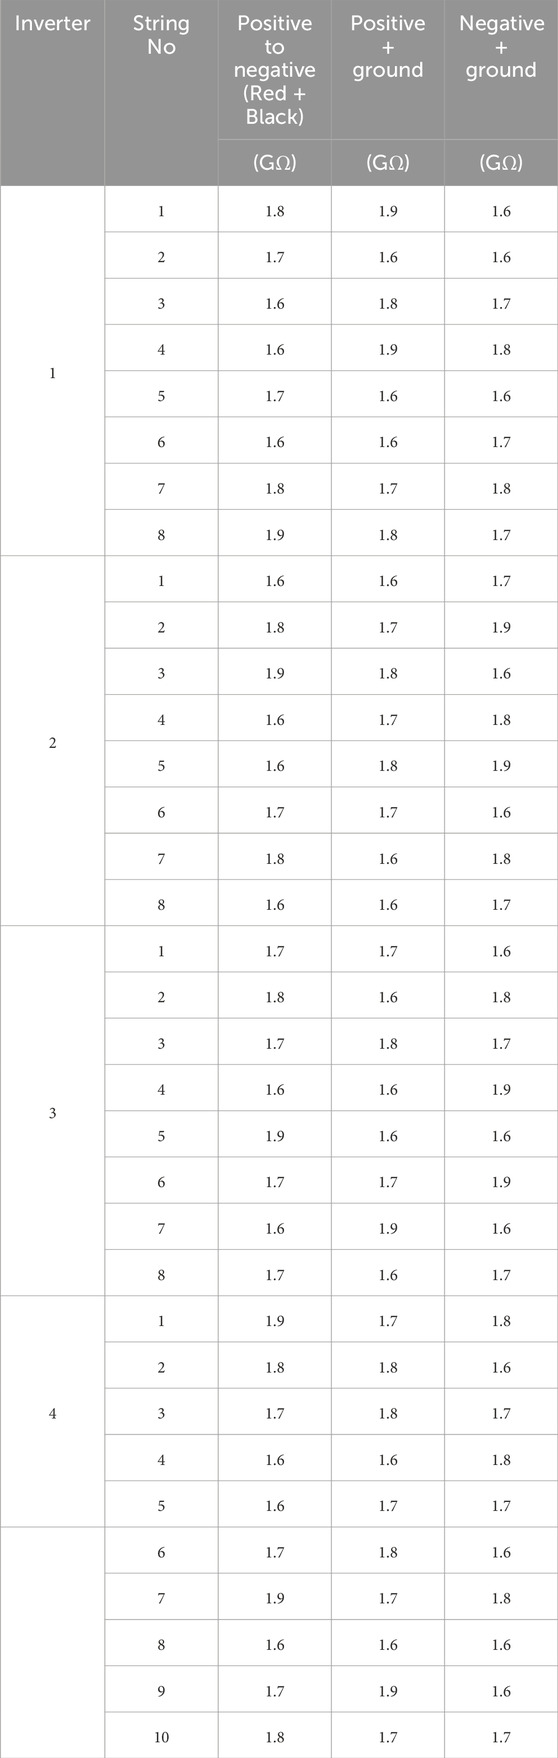
Table 9. Earth resistance test of DC cables (string cables).
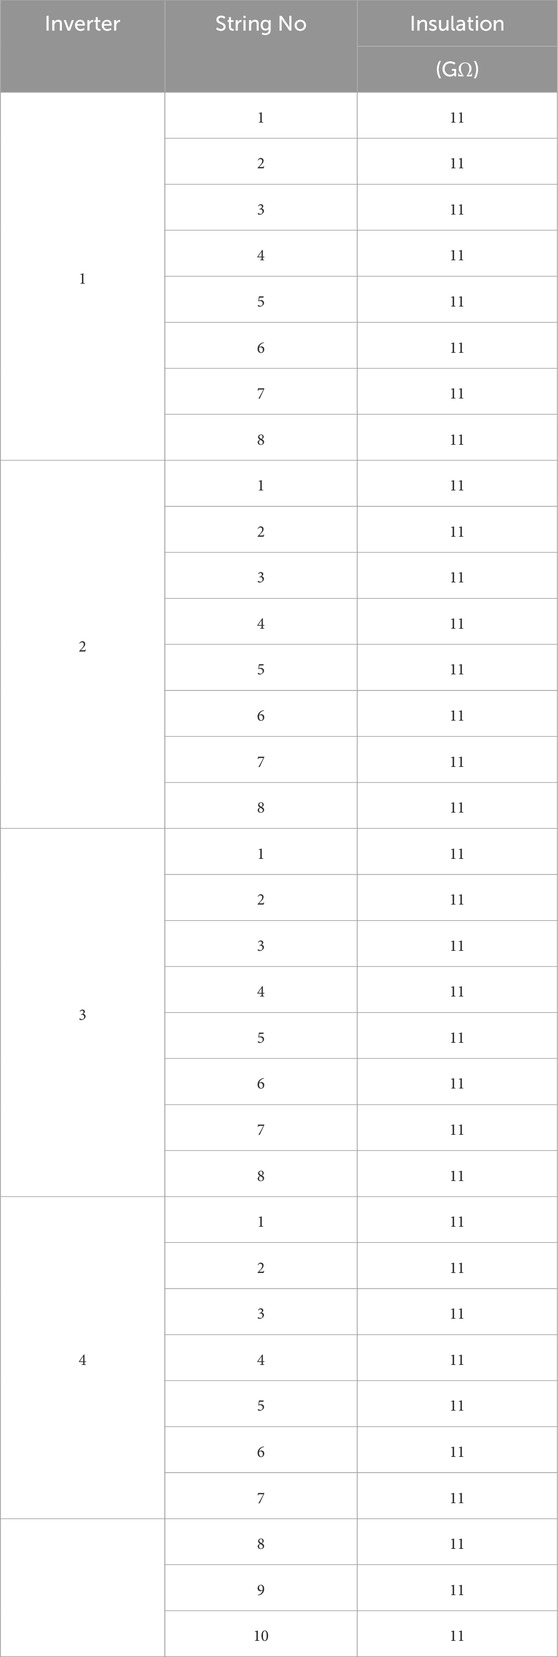
Table 10. Insulation test of DC cables (string cables).
Earth resistance and insulation tests of AC cables for all inverters are shown in Table 11. The highest measured resistance of AC cables for inverter 1 is 3.9 GΩ between Red-Ground and Yellow-Neutral. The lowest measured resistance of AC cables for inverter 1 is 2.8 GΩ between Blue-Ground. The highest measured resistance of AC cables for inverter 2 is 3.8 GΩ, for inverter 3 is 3.8 GΩ and for inverter 4 is 3.9 GΩ. The insulation of AC cables for all inverters is 11 GΩ.
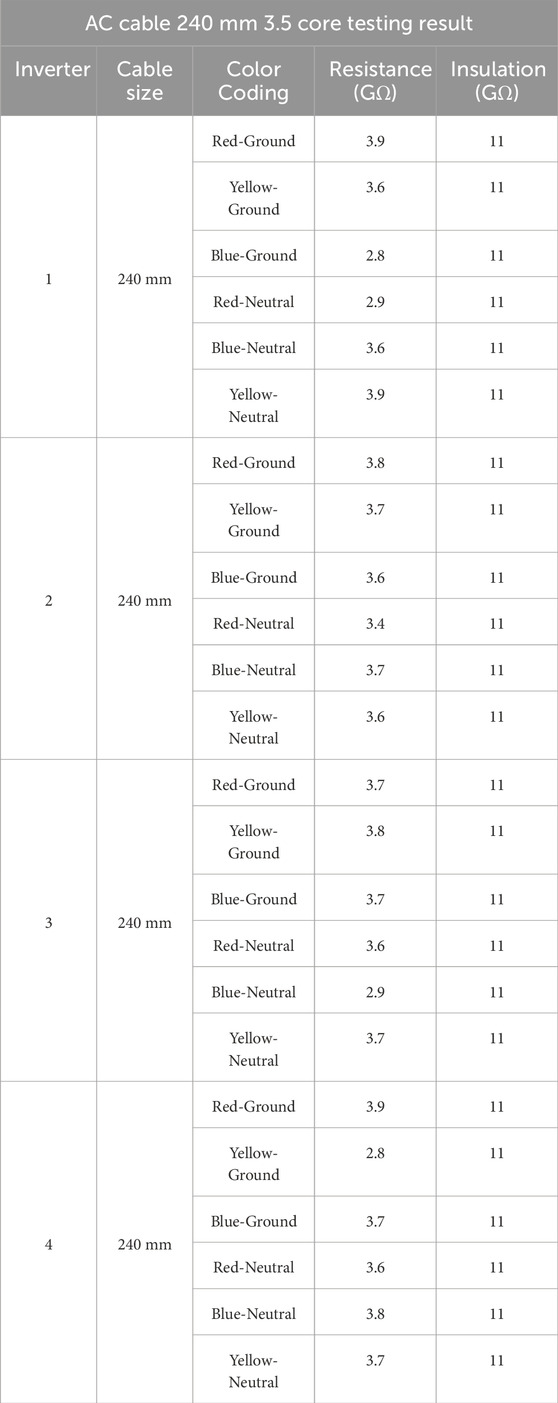
Table 11. Earth resistance and insulation test of AC cables for all inverters.
3.3.6.5 Performance ratio
The performance ratio is a measure of the performance of the photovoltaic system, taking into consideration environmental conditions (solar irradiance, temperature, etc.). Table 12 shows PR of installed PV system on 100% load. The average measured irradiation is 4.83 kWh/m2, the maximum daily energy generation of installed photovoltaic system (1333.676 kWh) was recorded on day 23, and its average energy generation was 1091.56 kWh. The maximum performance ratio (80.90%) was recorded on day 6 and the average daily PR of the installed system was 75.70%.
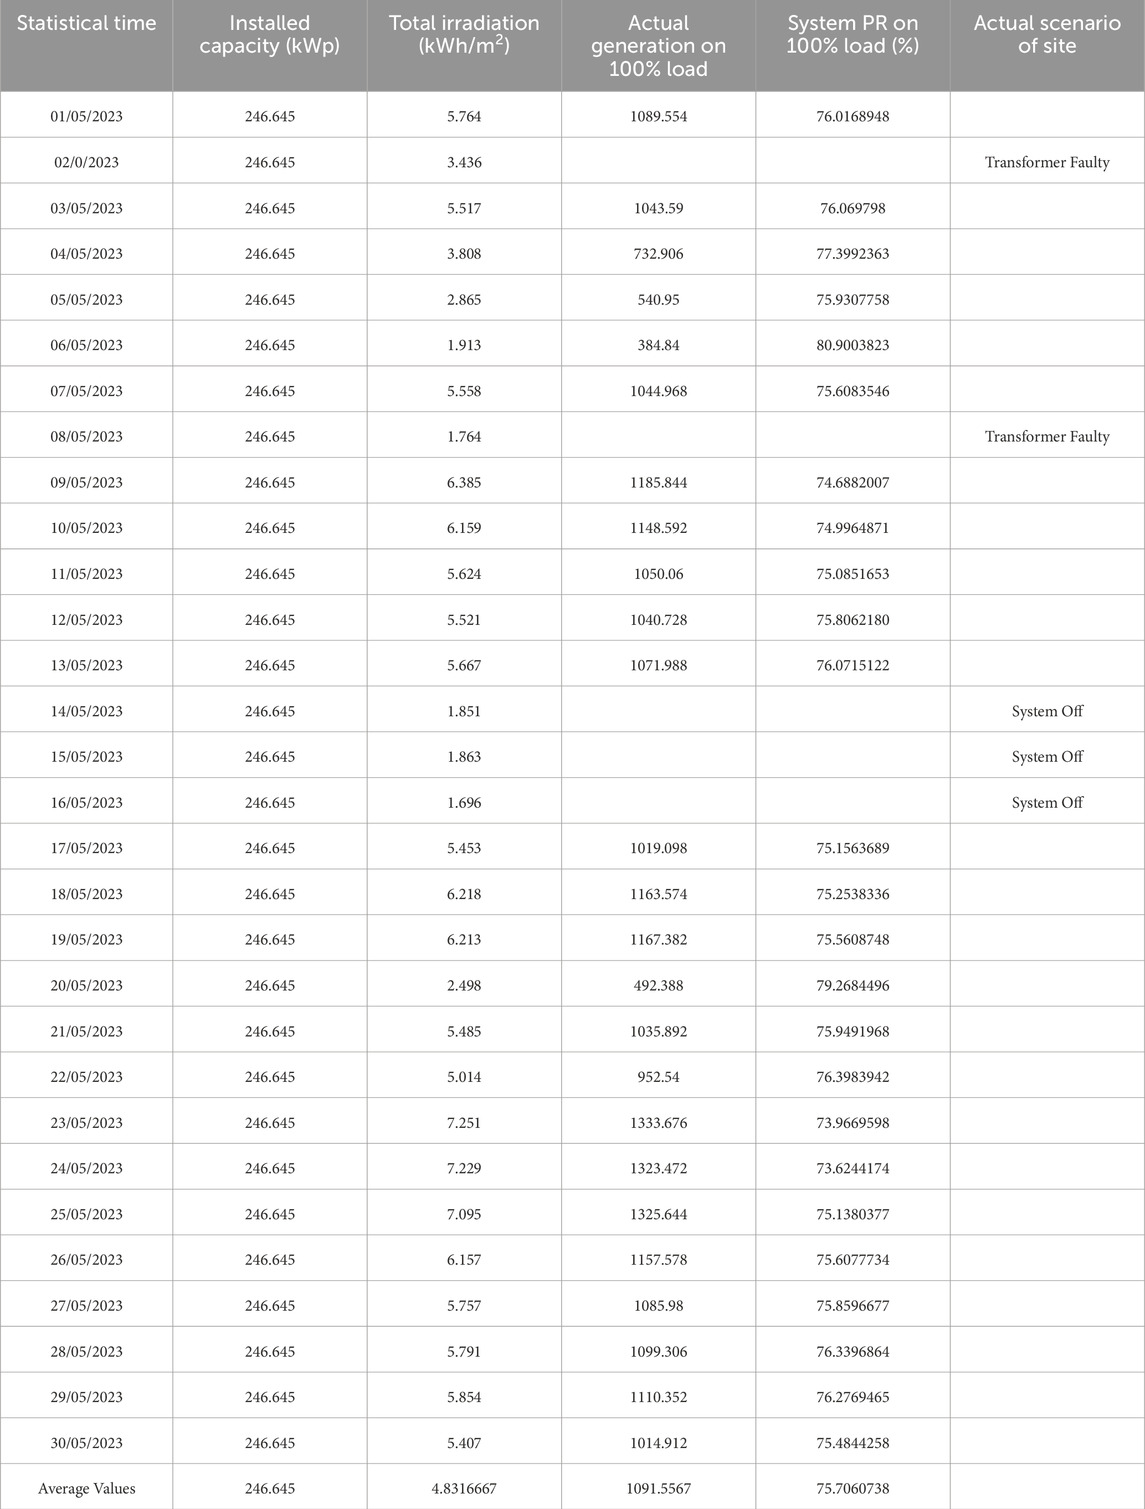
Table 12. Measured performance ratio of the installed system.
3.4 LCOE and payback period of PV system
The CAPEX of a PV system installed on the roof of a commercial shopping plaza is 160319.25$ as shown in Table 13, and the total revenue that is generated by the installed PV system is 37910.55$ considering a 0.102 $/kWh grid tariff (Habib et al., 2023d). The payback period of the installed photovoltaic system is 4.22 years and the levelized cost of electricity of the photovoltaic system is 0.0229 $/kWh, these are calculated using Equations 18 and 19. The payback period of this research is lower than that of Boruah and Chandel (2024) which has a payback period of 6.15 years. Similarly, LCOE is also lower than research conducted by Akpahou et al. (2024) with an LCOE ranging from 0.110 USD/kWh to 0.125 USD/kWh.
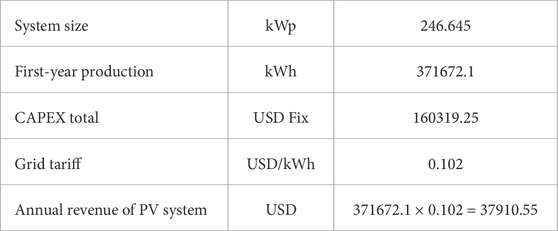
Table 13. CAPEX and grid tariff.
OPEX = 1,603.19$ (at 1% CAPEX/year (assumption))
OPEX for 25 years = 40,079.81$
The total annual production of PV systems in 25 years is 8739615.5 kWh with an energy depreciated rate of 0.88% per year as shown in Figure 9.
The following section present sensitivity analyses concentrating on potential fluctuations in local energy tariffs and market costs.
3.4.1 Optimistic case
• CAPEX decreases by 15%
Photovoltaic system’s cost (CAPEX) = 136271.36$
• Grid tariff increases by 10%
New grid tariff = 0.1122 $/kWh
Annual revenue of PV system = 371672.1 × 0.1122 = 41701.61 $
OPEX = 1362.71$ (at 1% CAPEX/year (assumption))
OPEX for 25 years = 34067.84$
The total annual production of PV systems in 25 years is 8739615.5 kWh with an energy depreciated rate of 0.88% per year.
3.4.2 Pessimistic case
• CAPEX increases by 15%
• Grid tariff decreases by 10%
OPEX = 1843.67$ (at 1% CAPEX/year (assumption))
OPEX for 25 years = 46091.78$
The total annual production of PV systems in 25 years is 8739615.5 kWh with an energy depreciated rate of 0.88% per year.
3.5 Carbon dioxide saving
The photovoltaic system installed on the roof of the commercial shopping plaza produced 371672.1 kWh of energy annually in the first year of installation, with an average monthly electricity generation of 30972.67 kWh. By using Equation 20, the CO2 in the first year is
Approximately 215569.818 metric tons of CO2 were saved in the first year by considering the annual production (301554.2 kWh) of a photovoltaic system installed on the roof of the commercial shopping plaza. The average monthly electricity generation of the system is 30972.67 kWh and approximately 215569.818 metric tons of CO2 were saved monthly. The total annual production of PV systems in 25 years is 8739615.5 kWh with an energy depreciated rate of 0.88% per year. Hence, a total of approximately 5068976.99 metric tons of CO2 were saved by the PV system in 25 years.
4 Discussion and conclusion
Energy demand rises as a result of economic expansion and urbanization. Pakistan, a high-energy-demand nation, fills the shortfall in its energy supply by importing fossil fuels. Pakistan has to modify its energy policy to emphasize sustainable, clean, and renewable energy resources, like other developed nations. Pakistan has enormous solar potential with a 1691.9 kWh/m2 annual global horizontal solar irradiance. Pakistan has currently made the transition to sustainable energy and developed new regulations for renewable energy systems, including the installation and commercialization of a rooftop photovoltaic system. Therefore, this requires detailed evaluation to determine the capabilities of the PV system and convince decision-makers. To achieve this goal and calculate the appropriate rooftop area for photovoltaic modules, simulations are carried out using HelioScope software.
The objective of this research is to examine the potential of a rooftop photovoltaic system for commercial buildings. This research examines the effects of different design factors on the efficiency and performance of a rooftop photovoltaic system. These factors such as tilt and azimuth angles, GHI, ambient temperature, and shading from the surrounding obstacles. The summer months experience the highest levels of global horizontal irradiance. Furthermore, the maximum hourly value of the GHI is 915 W/m2 in May. The GHI is measured in May at its highest level (188.8 kWh/m2) and in December at its lowest level (82.3 kWh/m2). The wind speed fluctuates between 0.3 m/s at the lowest point to 7.8 m/s at the highest point. The daily average maximum wind speed is 3.406 m/s, while the average annual wind speed is 2.133 m/s. Ambient temperatures range from 5.1°C to 47.6°C, while average annual ambient temperature is 28.49°C. The maximum hourly operating temperature (°C) of photovoltaic module is 67.83°C in April, while the minimum hourly operating temperature is 1.22°C in January. Additionally, average daily maximum operating temperature of a photovoltaic module is 59.70°C, the average daily minimum operating temperature of a solar (PV) module is 4.47°C and the average annual operating temperature of a solar (PV) module is 34.85°C.
The commercial shopping plaza has a flat roof and two buildings. The photovoltaic module is tilted to capture the most intense solar irradiation. An optimal row-to-row distance is calculated with the aim of maximizing energy yield. By simulation analysis, it is found that a photovoltaic system installed with 5 feet Inter-row spacing is more efficient. With 5 feet inter-row spacing, the results of simulation indicate that annually energy generation of PV system is 371.6 MWh, specific yield (kWh/kWp) is 1508.0, performance ratio is 82.1%, solar access is 98.9% and TSRF is 96.3%. The maximum daily DC inverter input power is 194614.7417 W, and the average daily DC inverter input power is 158881.5110 W. The maximum daily AC inverter output power is 186698.6914 W, whereas the average daily AC inverter output power is 152231.6311 W. The output power (AC) is barely less than the input power from PV arrays, showing an inverter efficiency of approximately 95.93%.
According to the simulation results, the total irradiance (kWh/m2) on the collector is 1724.9 kWh/m2. The annual nameplate energy of the system is 425017.6 kWh, the output energy at irradiance levels is 423121.8 kWh, the optimal DC output is 378460.5 kWh, the energy at inverter output is 373539.7, whereas the total amount of energy that is fed into the national power grid is 371672.1 kWh. The annual production of roof-mounted PV system installed on a commercial shopping plaza in the first year is 371672.1 kWh, in the second year, the annual production is 369760.1 kWh, while in the twenty-fifth year, the annual production is 328329.1 kWh and total annual production of PV system in 25 years is 8739615.5 kWh. This means that the installed photovoltaic system depreciates energy at a rate of 0.88% per year and falls in the standard warranty rate of 0.8% per year. In the designed system installed on a commercial shopping plaza, the system has 7.2% temperature losses, 3.3% mismatch losses, 0.40% wiring losses, 0.0% clipping losses, 0.5% AC system losses, 1.3% inverters losses, 3.1% reflection losses, 1.1% shading losses, 2.0% soiling losses and 0.41% irradiance losses.
After the Simulation study, detailed testing was performed at the site before commissioning to make sure that the equipment’s performance guarantees were met, properly installed, correctly adjusted, and suitable for commercial operations. Test results of installed photovoltaic system were taken for 30 days to evaluate and investigate the output generated energy (kWh) and performance of the photovoltaic (PV) system. We analyzed the experimental system in May because simulation results indicated that photovoltaic system produced the most energy during that month. The daily maximum output energy generation of installed PV system (1333.676 kWh) was recorded on day 23, and its average energy generation was 1091.56 kWh. Due to a faulty transformer on days 2 and 8, energy production is zero. The system is shut down for diagnostic tests from day 14 to day 16. By PV string open circuit voltage test, the maximum VOC for inverter 1 is 835 V, inverter 2 is 834 V, inverter 3 is 835 V and inverter 4 is 698 V. Similarly, maximum VOC for a string consisting of 18 PV modules is 835 V, VOC for string consist of 17 PV modules is 789 V and VOC for string consist of 15 PV modules is 698 V. It is found that voltages of all strings are within the rated range. PV String Isc Current Test shows that no reverse Polarity was detected, and each string’s earthing continuity was apparent enough to function without difficulty. The short circuit currents of the selected strings of inverters 1, 2, 3, and 4 are 9.99A, 10.0A, 9.81A, and 10.27A, respectively. The measured fill factor of inverters 1, 2 3, and 4 are 81.37%, 82.34%, 81.40%, and 81.91%, respectively.
To perform the inverter efficiency test, the input and output power was measured at the inverter terminal. The efficiency of inverter 1 is calculated to be 98.83%, inverter 2 is calculated to be 98.76%, inverter 3 is calculated to be 98.80%, and inverter 4 is calculated to be 98.81%. All inverters passed the inverter efficiency tests because their efficiency values are within the range of the rated inverter efficiency (98.7%). Megger is used for earth resistance and insulation tests of DC cables (Positive to Negative and negative to ground & positive to ground) and AC cables. The value of resistance of DC cables (positive to negative and negative to ground & positive to ground) varies between 1.6 GΩ and 1.9 GΩ for all strings. These values show that there is high resistance among each other. The insulation of DC cables is the same for all string and have a very high value (11 GΩ). The highest measured resistance of AC cables for inverter 1 is 3.9 GΩ between Red-Ground and Yellow-Neutral. The lowest measured resistance of AC cables for inverter 1 is 2.8 GΩ between Blue-Ground. The highest measured resistance of AC cables for inverter 2 is 3.8 GΩ, for inverter 3 is 3.8 GΩ and for inverter 4 is 3.9 GΩ. The insulation of AC cables for all inverters is 11 GΩ. All wire sequences have good insulation and high resistance among each other and there is not any major breakage in insulation during installation which may cause short circuit faults later on. The maximum performance ratio (80.90%) was recorded on day 6 and the average daily PR of the installed photovoltaic system was 75.70%. The installed PV system operates more efficiently because it has a high-performance ratio. The payback period of a solar (PV) system is 4.22 years and the LCOE of the photovoltaic system is 0.0229 $/kWh. The PV system saved 215569.818 metric tons of CO2 in the first year and a total of approximately 5068976.99 metric tons in 25 years.
Data availability statement
The original contributions presented in the study are included in the article/supplementary material, further inquiries can be directed to the corresponding authors.
Author contributions
SH: Writing–original draft. MT: Writing–original draft. MG: Writing–review and editing. SC: Writing–review and editing. HA: Writing–review and editing. MA: Writing–review and editing. MK: Writing–review and editing.
Funding
The author(s) declare that financial support was received for the research, authorship, and/or publication of this article. The author MA would like to acknowledge the support by the Deanship of Scientific Research through King Khalid University, Saudi Arabia funded by the Large Group Research Project RGP2/392/45.
Conflict of interest
The authors declare that the research was conducted in the absence of any commercial or financial relationships that could be construed as a potential conflict of interest.
Publisher’s note
All claims expressed in this article are solely those of the authors and do not necessarily represent those of their affiliated organizations, or those of the publisher, the editors and the reviewers. Any product that may be evaluated in this article, or claim that may be made by its manufacturer, is not guaranteed or endorsed by the publisher.
References
Abd Elsadek, E. M., Kotb, H., Abdel-Khalik, A. S., Aboelmagd, Y., and Abdelbaky Elbatran, A. H. (2024). Experimental and techno-economic analysis of solar PV system for sustainable building and greenhouse gas emission mitigation in harsh climate: a case study of aswan educational building. Sustainability 16 (13), 5315. doi:10.3390/su16135315
Ahsan, S. M., Khan, H. A., Hassan, N. U., Arif, S. M., and Lie, T. T. (2020). Optimized power dispatch for solar photovoltaic-storage system with multiple buildings in bilateral contracts. Appl. Energy 273, 115253. doi:10.1016/j.apenergy.2020.115253
Akpahou, R., Odoi-Yorke, F., and Osei, L. K. (2024). Techno-economic analysis of a utility-scale grid-tied solar photovoltaic system in Benin republic. Clean. Eng. Technol. 13, 100633. doi:10.1016/j.clet.2023.100633
Al-Amin, M., Hassan, M., and Khan, I. (2024). Unveiling mega-prosumers for sustainable electricity generation in a developing country with techno-economic and emission analysis. J. Clean. Prod. 437, 140747. doi:10.1016/j.jclepro.2024.140747
Ali, O. M., and Alomar, O. R. (2022). Technical and economic feasibility analysis of a PV grid-connected system installed on a university campus in Iraq. Environ. Sci. Pollut. Res. 30, 15145–15157. doi:10.1007/s11356-022-23199-y
Alshehri, A., James, P., and Bahaj, A. (2024). Pathways to the large-scale adoption of residential photovoltaics in Saudi Arabia. Energies 17 (13), 3180. doi:10.3390/en17133180
Appavou, F., Brown, A., Epp, B., Murdock, H. E., and Skeen, J. (2019). Renewables 2019 global status report. Paris, France: REN21.
Asif, M. (2016). Growth and sustainability trends in the buildings sector in the GCC region with particular reference to the KSA and UAE. Renew. Sustain. Energy Rev. 55, 1267–1273. doi:10.1016/j.rser.2015.05.042
Assouline, D., Mohajeri, N., and Scartezzini, J. (2018). Large-scale rooftop solar photovoltaic technical potential estimation using Random Forests. Appl. Energy 217, 189–211. doi:10.1016/j.apenergy.2018.02.118
Ayan, O., and Turkay, B. E. (2023). Techno-Economic comparative analysis of grid-connected and islanded hybrid renewable energy systems in 7 climate regions, Turkey. IEEE Access 11, 48797–48825. doi:10.1109/access.2023.3276776
Bashir, M. F., Shahbaz, M., Ma, B., and Alam, K. (2024). Evaluating the roles of energy innovation, fossil fuel costs and environmental compliance towards energy transition in advanced industrial economies. J. Environ. Manag. 351, 119709. doi:10.1016/j.jenvman.2023.119709
Bhatti, A. R., Tamoor, M., Liaqat, R., Rasool, A., Salam, Z., Ali, A., et al. (2024). Electric vehicle charging stations and the employed energy management schemes: a classification based comparative survey. Discov. Appl. Sci. 6 (10), 503. doi:10.1007/s42452-024-06190-9
Boruah, D., and Chandel, S. S. (2024). Techno-economic feasibility analysis of a commercial grid-connected photovoltaic plant with battery energy storage-achieving a net zero energy system. J. Energy Storage 77, 109984. doi:10.1016/j.est.2023.109984
Bouramdane, A. A., Tantet, A., and Drobinski, P. (2021). Utility-scale PV-battery versus CSP-thermal storage in Morocco: storage and cost effect under penetration scenarios. Energies 14 (15), 4675. doi:10.3390/en14154675
Chwieduk, B., and Chwieduk, D. (2021). Analysis of operation and energy performance of a heat pump driven by a PV system for space heating of a single family house in polish conditions. Renew. Energy 165, 117–126. doi:10.1016/j.renene.2020.11.026
Daher, D. H., Aghaei, M., Quansah, D. A., Adaramola, M. S., Parvin, P., and Ménézo, C. (2023). Multi-pronged degradation analysis of a photovoltaic power plant after 9.5 years of operation under hot desert climatic conditions. Prog. Photovoltaics Res. Appl. 31 (9), 888–907. doi:10.1002/pip.3694
de Lima, L. C., de Araújo Ferreira, L., and de Lima Morais, F. H. B. (2017). Performance analysis of a grid connected photovoltaic system in northeastern Brazil. Energy Sustain. Dev. 37, 79–85. doi:10.1016/j.esd.2017.01.004
Ehsan, F., Habib, S., Gulzar, M. M., Guo, J., Muyeen, S. M., and Kamwa, I. (2024). Assessing policy influence on electric vehicle adoption in China: an in-depth study. Energy Strategy Rev. 54, 101471. doi:10.1016/j.esr.2024.101471
EIA (2006). The annual energy review 2006. Washington, DC, USA: Energy Information Administration EIA.
Fina, B., Auer, H., and Friedl, W. (2020). Cost-optimal economic potential of shared rooftop PV in energy communities: evidence from Austria. Renew. Energy 152, 217–228. doi:10.1016/j.renene.2020.01.031
Habib, S., Aghakhani, S., Nejati, M. G., Azimian, M., Jia, Y., and Ahmed, E. M. (2023b). Energy management of an intelligent parking lot equipped with hydrogen storage systems and renewable energy sources using the stochastic p-robust optimization approach. Energy 278, 127844. doi:10.1016/j.energy.2023.127844
Habib, S., Ahmarinejad, A., and Jia, Y. (2023a). A stochastic model for microgrids planning considering smart prosumers, electric vehicles and energy storages. J. Energy Storage 70, 107962. doi:10.1016/j.est.2023.107962
Habib, S., Jia, Y., Tamoor, M., Zaka, M. A., Shi, M., and Dong, Q. (2023d). Modeling, simulation, and experimental analysis of a photovoltaic and biogas hybrid renewable energy system for electrification of rural community. Energy Technol. 11, 2300474. doi:10.1002/ente.202300474
Habib, S., Liu, H., Tamoor, M., Zaka, M. A., Jia, Y., Hussien, A. G., et al. (2023c). Technical modelling of solar photovoltaic water pumping system and evaluation of system performance and their socio-economic impact. Heliyon 9 (5), e16105. doi:10.1016/j.heliyon.2023.e16105
Habib, S., Tamoor, M., Zaka, M. A., and Jia, Y. (2023e). Assessment and optimization of carport structures for photovoltaic systems: a path to sustainable energy development. Energy Convers. Manag. 295, 117617. doi:10.1016/j.enconman.2023.117617
Hasan, K., Yousuf, S. B., Tushar, M. S. H. K., Das, B. K., Das, P., and Islam, M. S. (2022). Effects of different environmental and operational factors on the PV performance: a comprehensive review. Energy Sci. and Eng. 10 (2), 656–675. doi:10.1002/ese3.1043
Huang, L., and Zheng, R. (2018). Energy and economic performance of solar cooling systems in the hot-summer and cold-winter zone. Buildings 8 (3), 37. doi:10.3390/buildings8030037
Huang, Z., Mendis, T., and Xu, S. (2019). Urban solar utilization potential mapping via deep learning technology: a case study of Wuhan, China. Appl. Energy 250, 283–291. doi:10.1016/j.apenergy.2019.04.113
Huda, A., Kurniawan, I., Purba, K. F., Ichwani, R., and Fionasari, R. (2024). Techno-economic assessment of residential and farm-based photovoltaic systems. Renew. Energy 222, 119886. doi:10.1016/j.renene.2023.119886
International Energy Agency (2020). Renewables. Available at: https://www.iea.org/fuels-and-technologies/renewables (Accessed January 20, 2024).
Jordan, D. C., and Kurtz, S. R. (2013). Photovoltaic degradation rates—an analytical review. Prog. photovoltaics Res. Appl. 21 (1), 12–29. doi:10.1002/pip.1182
Kang, H., An, J., Kim, H., Ji, C., Hong, T., and Lee, S. (2021). Changes in energy consumption according to building use type under COVID-19 pandemic in South Korea. Renew. Sustain. Energy Rev. 148, 111294. doi:10.1016/j.rser.2021.111294
Kumar, N. M., Gupta, R. P., Mathew, M., Jayakumar, A., and Singh, N. K. (2019). Performance, energy loss, and degradation prediction of roof-integrated crystalline solar PV system installed in Northern India. Case Stud. Therm. Eng. 13, 100409. doi:10.1016/j.csite.2019.100409
Kymakis, E., Kalykakis, S., and Papazoglou, T. M. (2009). Performance analysis of a grid connected photovoltaic park on the island of Crete. Energy Convers. Manag. 50 (3), 433–438. doi:10.1016/j.enconman.2008.12.009
Lang, T., Ammann, D., and Girod, B. (2016). Profitability in absence of subsidies: a techno-economic analysis of rooftop photovoltaic self-consumption in residential and commercial buildings. Renew. Energy 87, 77–87. doi:10.1016/j.renene.2015.09.059
Lang, T., Gloerfeld, E., and Girod, B. (2015). Don׳ t just follow the sun–A global assessment of economic performance for residential building photovoltaics. Renew. Sustain. Energy Rev. 42, 932–951. doi:10.1016/j.rser.2014.10.077
Liu, H., Deng, S., Habib, S., and Shen, Bo (2022). Emission reduction constrained optimal strategy for refrigeration field: a case study of Ningbo in China. J. Clean. Prod. 379, 134667. doi:10.1016/j.jclepro.2022.134667
Liu, Q., Li, J., Tan, X., Jia, Y., Zhang, Y., and Ji, G. (2021). “Research on the influence of summer temperature on electricity demand,” in 2021 4th International Conference on Energy, Electrical and Power Engineering (CEEPE) (IEEE), 1259–1263. doi:10.1109/ceepe51765.2021.9475693
Machete, R., Paula, A., Gomes, M. G., and Moret Rodrigues, A. (2018). The use of 3D GIS to analyse the influence of urban context on buildings’ solar energy potential. Energy Build. 177, 290–302. doi:10.1016/j.enbuild.2018.07.064
Malaysia, S. E. D. A. (2016). “SEDA Malaysia grid-connected PV system course design,” in SEDA Malaysia. Malaysia.
Malvoni, M., Kumar, N. M., Chopra, S. S., and Hatziargyriou, N. (2020). Performance and degradation assessment of large-scale grid-connected solar photovoltaic power plant in tropical semi-arid environment of India. Sol. Energy 203, 101–113. doi:10.1016/j.solener.2020.04.011
Miran, S., Tamoor, M., Kiren, T., Raza, F., Hussain, M. I., and Kim, J. T. (2022). Optimization of standalone photovoltaic drip irrigation system: a simulation study. Sustainability 14 (14), 8515. doi:10.3390/su14148515
Mohajeri, N., Assouline, D., Guiboud, B., Bill, A., Gudmundsson, A., and Scartezzini, J. L. (2018). A city-scale roof shape classification using machine learning for solar energy applications. Renew. Energy 121, 81–93. doi:10.1016/j.renene.2017.12.096
Mohamed, K., Shareef, H., Nizam, I., Esan, A. B., and Shareef, A. (2024). Operational performance assessment of rooftop PV systems in the Maldives. Energy Rep. 11, 2592–2607. doi:10.1016/j.egyr.2024.02.014
Monna, S., Juaidi, A., Abdallah, R., and Itma, M. (2020). A comparative assessment for the potential energy production from PV installation on residential buildings. Sustainability 12 (24), 10344. doi:10.3390/su122410344
Mountain, B., and Szuster, P. S. (2015). Solar, solar everywhere: opportunities and challenges for Australia's rooftop PV systems. IEEE power energy Mag. 13 (4), 53–60. doi:10.1109/mpe.2015.2416113
Mousavi, S. M. S., and Bakhshi-Jafarabadi, R. (2024). Techno-economic assessment of grid-connected photovoltaic systems for peak shaving in arid areas based on experimental data. Energy Rep. 11, 5492–5503. doi:10.1016/j.egyr.2024.05.035
Musa, M., Gao, Y., Rahman, P., Albattat, A., Ali, M. A. S., and Saha, S. K. (2024). Sustainable development challenges in Bangladesh: an empirical study of economic growth, industrialization, energy consumption, foreign investment, and carbon emissions—using dynamic ARDL model and frequency domain causality approach. Clean Technol. Environ. Policy 26 (6), 1799–1823. doi:10.1007/s10098-023-02680-3
Muteri, V., Cellura, M., Curto, D., Franzitta, V., Longo, S., Mistretta, M., et al. (2020). Review on life cycle assessment of solar photovoltaic panels. Energies 13 (1), 252. doi:10.3390/en13010252
Nguyen, V. G., Sirohi, R., Tran, M. H., Truong, T. H., Duong, M. T., Pham, M. T., et al. (2024). Renewable energy role in low-carbon economy and net-zero goal: perspectives and prospects. Energy and Environ., 0958305X241253772. doi:10.1177/0958305x241253772
Palmer-Wilson, K., Donald, J., Robertson, B., Lyseng, B., Keller, V., Fowler, M., et al. (2019). Impact of land requirements on electricity system decarbonisation pathways. Energy Policy 129, 193–205. doi:10.1016/j.enpol.2019.01.071
Prajapati, S., and Fernandez, E. (2019). “Rooftop solar PV system for commercial office buildings for EV charging load,” in 2019 IEEE international conference on smart instrumentation, measurement and application (ICSIMA) (IEEE), 1–5.
Prieto, A., Knaack, U., Auer, T., and Klein, T. (2018). Passive cooling and climate responsive façade design: exploring the limits of passive cooling strategies to improve the performance of commercial buildings in warm climates. Energy Build. 175, 30–47. doi:10.1016/j.enbuild.2018.06.016
Ramli, M. A., Twaha, S., and Alghamdi, A. U. (2017). Energy production potential and economic viability of grid-connected wind/PV systems at Saudi Arabian coastal areas. J. Renew. Sustain. Energy 9 (6), 065910. doi:10.1063/1.5005597
Satpathy, P. R., Panda, S., Mahmoud, A., and Sharma, R. (2021b). “Optimal design and performance survey of a 100kW P grid-connected PV plant for installation near the top ranked green city of India,” in 2021 1st Odisha International Conference on Electrical Power Engineering, Communication and Computing Technology (ODICON) (IEEE), 1–6. doi:10.1109/odicon50556.2021.9428966
Satpathy, P. R., Sharma, R., and Panda, S. (2021a). “Optimal sizing, placement and shading analysis of a 19.2 kW grid-tied residential roof-top PV system,” in 2021 1st Odisha International Conference on Electrical Power Engineering, Communication and Computing Technology (ODICON) (IEEE), 1–6. doi:10.1109/odicon50556.2021.9428927
Schallenberg-Rodríguez, J. (2013). Photovoltaic techno-economical potential on roofs in regions and islands: the case of the Canary Islands. Methodological review and methodology proposal. Renew. Sustain. Energy Rev. 20, 219–239. doi:10.1016/j.rser.2012.11.078
Şevik, S. (2022). Techno-economic evaluation of a grid-connected PV-trigeneration-hydrogen production hybrid system on a university campus. Int. J. Hydrogen Energy 47 (57), 23935–23956. doi:10.1016/j.ijhydene.2022.05.193
Shaahid, S. M., and Elhadidy, M. A. (2008). Economic analysis of hybrid photovoltaic-diesel-battery power systems for residential loads in hot regions-A step to clean future. Renew. Sustain. Energy Rev. 12, 488–503. doi:10.1016/j.rser.2006.07.013
Shukla, A. K., Sudhakar, K., and Baredar, P. (2016). Design, simulation and economic analysis of standalone roof top solar PV system in India. Sol. Energy 136, 437–449. doi:10.1016/j.solener.2016.07.009
Singh, R. (2020). Approximate rooftop solar PV potential of Indian cities for high-level renewable power scenario planning. Sustain. Energy Technol. Assessments 42, 100850. doi:10.1016/j.seta.2020.100850
Sinha, P., and Ghosh, S. (2024). Resource-efficient manufacturing enables PV supply chain diversity: an industry perspective and case study of CdTe PV manufacturing. Sol. Energy 269, 112310. doi:10.1016/j.solener.2024.112310
Tamoor, M., Bhatti, A. R., Butt, A. D., Miran, S., Kiren, T., Farhan, M., et al. (2022c). Optimal sizing of a centralized hybrid photovoltaic system for efficient operation of street lights. J. Eng. Res., 1–15. doi:10.36909/jer.icepe.19563
Tamoor, M., Bhatti, A. R., Farhan, M., and Miran, S. (2022d). Design of on-grid photovoltaic system considering optimized sizing of photovoltaic modules for enhancing output energy. Eng. Proc. 19 (1), 2. doi:10.3390/ecp2022-12671
Tamoor, M., Bhatti, A. R., Farhan, M., Miran, S., Raza, F., and Zaka, M. A. (2021a). Designing of a hybrid photovoltaic structure for an energy-efficient street lightning system using PVsyst software. Eng. Proc. 12 (1), 45. doi:10.3390/engproc2021012045
Tamoor, M., Bhatti, A. R., Hussain, M. I., Miran, S., Kiren, T., Ali, A., et al. (2023). Optimal sizing and technical assessment of a hybrid renewable energy solution for off-grid community center power. Front. Energy Res. 11, 1283586. doi:10.3389/fenrg.2023.1283586
Tamoor, M., Habib, S., Bhatti, A. R., Butt, A. D., Awan, A. B., and Ahmed, E. M. (2022e). Designing and energy estimation of photovoltaic energy generation system and prediction of plant performance with the variation of tilt angle and Inter-row spacing. Sustainability 14 (2), 627. doi:10.3390/su14020627
Tamoor, M., Hussain, M. I., Bhatti, A. R., Miran, S., Arif, W., Kiren, T., et al. (2022a). Investigation of dust pollutants and the impact of suspended particulate matter on the performance of photovoltaic systems. Front. Energy Res. 10, 1017293. doi:10.3389/fenrg.2022.1017293
Tamoor, M., Tahir, M. A. B., and Zaka, M. A. (2021b). Photovoltaic integrated distributed energy generation system for sustainable energy development considering reliability indices and levelized cost of energy. Int. J. Adv. Trends Comput. Sci. Eng. 10 (3), 2540–2549. doi:10.30534/ijatcse/2021/1461032021
Tamoor, M., Tahir, M. A. B., Zaka, M. A., and Iqtidar, E. (2022b). Photovoltaic distributed generation integrated electrical distribution system for development of sustainable energy using reliability assessment indices and levelized cost of electricity. Environ. Prog. and Sustain. Energy 41, e13815. doi:10.1002/ep.13815
Tamoor, M., Tahir, M. S., Sagir, M., Tahir, M. B., Iqbal, S., and Nawaz, T. (2020). Design of 3 kW integrated power generation system from solar and biogas. Int. J. Hydrogen Energy 45 (23), 12711–12720. doi:10.1016/j.ijhydene.2020.02.207
Tarigan, E. (2018). Simulation and feasibility studies of rooftop PV system for university campus buildings in Surabaya, Indonesia. Int. J. Renew. Energy Res. 8 (2), 895–908. doi:10.20508/ijrer.v8i2.7547.g7377
Thotakura, S., Kondamudi, S. C., Xavier, J. F., Quanjin, M., Reddy, G. R., Gangwar, P., et al. (2020). Operational performance of megawatt-scale grid integrated rooftop solar PV system in tropical wet and dry climates of India. Case Stud. Therm. Eng. 18, 100602. doi:10.1016/j.csite.2020.100602
Van Ruijven, B. J., De Cian, E., and Sue Wing, I. (2019). Amplification of future energy demand growth due to climate change. Nat. Commun. 10 (1). 2762. doi:10.1038/s41467-019-10399-3
Vargas-Salgado, C., Díaz-Bello, D., Alfonso-Solar, D., and Lara-Vargas, F. (2024). Validations of HOMER and SAM tools in predicting energy flows and economic analysis for renewable systems: comparison to a real-world system result. Sustain. Energy Technol. Assessments 69, 103896. doi:10.1016/j.seta.2024.103896
Wen, Y., Chen, Y., Wang, P., Rassol, A., and Xu, S. (2022). Photovoltaic–electric vehicles participating in bidding model of power grid that considers carbon emissions. Energy Rep. 8, 3847–3855. doi:10.1016/j.egyr.2022.03.010
Wiginton, L. K., Nguyen, H. T., and Pearce, J. M. (2010). Quantifying rooftop solar photovoltaic potential for regional renewable energy policy. Comput. Environ. Urban Syst. 34 (4), 345–357. doi:10.1016/j.compenvurbsys.2010.01.001
Wittkopf, S., Valliappan, S., Liu, L., Ang, K. S., and Cheng, S. C. J. (2012). Analytical performance monitoring of a 142.5 kWp grid-connected rooftop BIPV system in Singapore. Renew. Energy 47, 9–20. doi:10.1016/j.renene.2012.03.034
Yadav, S. K., and Bajpai, U. (2018). Performance evaluation of a rooftop solar photovoltaic power plant in Northern India. Energy Sustain. Dev. 43, 130–138. doi:10.1016/j.esd.2018.01.006
Yang, R. J., Zhao, Y., Jayakumari, S. D. S., Schneider, A., Rajan, S. P., Leloux, J., et al. (2024). Digitalising BIPV energy simulation: a cross tool investigation. Energy Build. 318, 114484. doi:10.1016/j.enbuild.2024.114484
Yar, A., Arshad, M. Y., Asghar, F., Amjad, W., Asghar, F., Hussain, M. I., et al. (2022). Machine learning-based relative performance analysis of monocrystalline and polycrystalline grid-tied PV systems. Int. J. Photoenergy 2022 (1), 1–18. doi:10.1155/2022/3186378
Keywords: PV system, solar resources, performance analysis, system losses, energy generation, performance ratio, system testing, building solar potential
Citation: Habib S, Tamoor M, Gulzar MM, Chauhdary ST, Ahmad H, Alqahtani M and Khalid M (2024) Design, techno-economic evaluation, and experimental testing of grid connected rooftop solar photovoltaic systems for commercial buildings . Front. Energy Res. 12:1483755. doi: 10.3389/fenrg.2024.1483755
Received: 20 August 2024; Accepted: 30 October 2024;
Published: 21 November 2024.
Edited by:
Xingshuo Li, Nanjing Normal University, ChinaReviewed by:
Priya Ranjan Satpathy, Universiti Tenaga Nasional, MalaysiaMisri Gozan, University of Indonesia, Indonesia
Copyright © 2024 Habib, Tamoor, Gulzar, Chauhdary, Ahmad, Alqahtani and Khalid. This is an open-access article distributed under the terms of the Creative Commons Attribution License (CC BY). The use, distribution or reproduction in other forums is permitted, provided the original author(s) and the copyright owner(s) are credited and that the original publication in this journal is cited, in accordance with accepted academic practice. No use, distribution or reproduction is permitted which does not comply with these terms.
*Correspondence: Salman Habib, c2FsbWFuLmhhYmliQGtmdXBtLmVkdS5zYQ==; Muhammad Khalid, bWtoYWxpZEBrZnVwbS5lZHUuc2E=