- 1School of Ecomomic and Mangement, Shanghai University of Electric Power, Shanghai, China
- 2Economic and Technological Research Institute of State Grid Fujian Electric Power Co., Ltd., Fuzhou, China
- 3College of Automation and College of Artificial Intelligence, Nanjing University of Posts and Telecommunications, Nanjing, China
Introduction: An innovative methodology is proposed to delve into the pivotal role of regional distribution networks (RDNs) in fostering low-carbon development.
Methods: The methodology first constructs an evaluation framework encompassing various dimensions and then integrates spherical fuzzy sets (SFSs) with the best-worst method (BWM), enabling the precise calculation of indicator weight parameters. Subsequently, we employ the measurement of alternatives and ranking according to compromise solution (MARCOS) with SFSs to process and synthesize decision making information.
Results: Take the Shanghai region as an example, results show that C4 has the highest performance and C10 has the lowest.
Discussion: In conclusion, this research presents a significant step forward in understanding the importance of RDNs in promoting low-carbon development and offers a practical approach for decision-makers to assess and enhance the performance of RDNs.
1 Introduction
With the continuous promotion of the dual-carbon target, the gradual increase in renewable energy penetration in urban power grids has brought about problems of strong intermittency and uncertainty, making urban energy security face severe challenges (Zhang and Kang, 2022). As an important part of the power system, the contribution of the regional distribution network to carbon emission reduction directly affects the low-carbon process of the overall power industry. By optimizing power transmission and distribution, regional distribution networks (RDNs) can effectively reduce the line loss of the power grid and improve energy efficiency (Yue et al., 2024; Cheng et al., 2024). Thus, RDNs bear great responsibility in the process of sustainable development of urban energy. However, the current research on the carbon emission of RDNs mostly focuses on traceability, collaboration, and reduction optimization and thus lacks quantitative determination of the contribution of carbon emission reduction, which weakens the green support capacity of RDNs and makes it difficult to guarantee the effectiveness of new energy production, transmission, and consumption in the urban green development process (Yang et al., 2024; Yang S. et al., 2023; Sang et al., 2024). Therefore, accurately identifying and effectively quantifying the green support capacity of RDNs is a key link to achieving the dual-carbon goal, and the study of the carbon emission reduction contribution of RDNs has become a key research direction in urban green development.
At present, in the field of carbon emission reduction quantification, existing research revolves around the low-carbonized economic operation of integrated energy systems in parks, the analysis of carbon emission reduction benefits on the urban user side, the effectiveness of green energy access, and multi-modal transportation networks aiming at carbon emission minimization. In order to solve the contradiction between the power consumption of carbon capture devices and the demand for carbon capture, Paulino E. Labis proposes a near-end strategy optimization algorithm based on the real-time response to uncertain source loads, which demonstrates the effectiveness and advancement of this method in decarbonized operation (Labis et al., 2011). Yi Xie takes the urban user side as the main body, adopts the marginal carbon emission factor to calculate the expected carbon reduction of user-side energy storage, and analyzes in-depth the influence of user-side energy storage behavior on the total carbon emission of the system, which demonstrates that the carbon-reducing cloud energy storage model can bring better carbon reduction advantages (Xie et al., 2023). Lijuan Yao centers on green energy access work, combines a variety of hierarchical control algorithms to explore the effectiveness of green energy access in the load system, and provides clean energy output tracking services to verify the effectiveness of the method (Yao et al., 2023). For low-carbon multi-modal transport planning problem research, Qin Huang proposed the Harris Hawk optimization algorithm so that the low-carbon objectives and low-cost objectives are optimized, verifying the correctness of the model (Huang et al., 2023). Puliang Du proposed a quantum spherical fuzzy environment decision-making framework for determining the carbon reduction contribution of power companies (Du et al., 2024). Although scholars have carried out some research in the field of carbon emission reduction quantifications, the research for determining the carbon emission reduction contribution of RDNs is still to be explored.
The research on the determination of carbon emission reduction contributions of RDNs involves many aspects of economics, technology, environment, and management, covering many fields such as electric energy substitution, emerging technology, smart logistics, and line loss management, making it a typical multi-attribute decision-making problem under fuzzy environment (Sun et al., 2021; Li et al., 2023; Du et al., 2023; Xue and Tsai, 2022). In recent years, research on multi-attribute decision-making problems in fuzzy environments mostly involves three aspects: indicator weight determination, decision-making method, and fuzzy information characterization. Among them, Qiushuang Wei constructs a best-worst method, interval type-2 fuzzy, preference ranking organization method for enrichment evaluations (BWM-IT2F-PROMETHEE-II) model to calculate indicator weights and recognize the solution of barriers based on the fact that barriers to the implementation of carbon sink projects have the problems of complexity, multiplicity, and uncertainty. The PROMETHEE-II method is cumbersome and requires a complicated calculation process when dealing with large-scale datasets and real-time decision-making, and the interrelationships among the programs are not taken into account (Wei et al., 2023). Therefore, Yongji Wu proposes the measurement of alternatives and ranking according to the compromise solution (MARCOS) method, which effectively avoids the above problems and considers the impact of decision makers’ preferences on the evaluation process (Wu et al., 2023). Xiaomin Gong develops a hybrid decision-making framework to address the problem of renewable energy hosting potential assessment using an interval 2-type fuzzy best-worst method for determining indicator weights and introduces an extended MARCOS method for ranking alternatives (Gong et al., 2021). Based on a spherical fuzzy environment, Rajput Laxmi portrays the importance of indicators and effectively preserves the uncertainty of multi-dimensional information (Laxmi et al., 2024). In addition, the spherical fuzzy set (SFS), as a kind of fuzzy number with three-dimensional degrees of affiliation, non-affiliation, and hesitation, is more in line with the actual situation than the existing linear relationship, which opens up a new way to deal with complex decision-making problems and is widely used in the field of fuzzy decision-making to recognize the effective transformation of fuzzy information (Geng and Li, 2023).
Based on the above analysis, this article proposes a decision-making framework determining the carbon emission reduction contribution of RDNs based on the BWM-MARCOS in an SFS environment to fill the gaps in existing research. First, an indicator system is constructed from economic, technological, environmental, and management dimensions to perceive the carbon emission reduction contribution of RDNs for the first time. Second, the collected expert semantic evaluation information is converted into spherical fuzzy numbers with the BWM to recognize the subjective assignment of the relevant indicators, effectively solving the limitations of traditional methods in dealing with complex and multi-dimensional uncertain information. Then, the weights are incorporated into the developed SFS-MARCOS model for accurate determination relative to traditional methods, which considers the influence of decision makers’ preferences on the evaluation process and improves the scientificity and practicability of decision-making. Finally, the effectiveness of the proposed modeling approach is verified by taking 11 RDNs in Shanghai as examples.
2 Evaluation indicators for carbon emission reduction contribution of RDNs
2.1 Construction of the indicator system
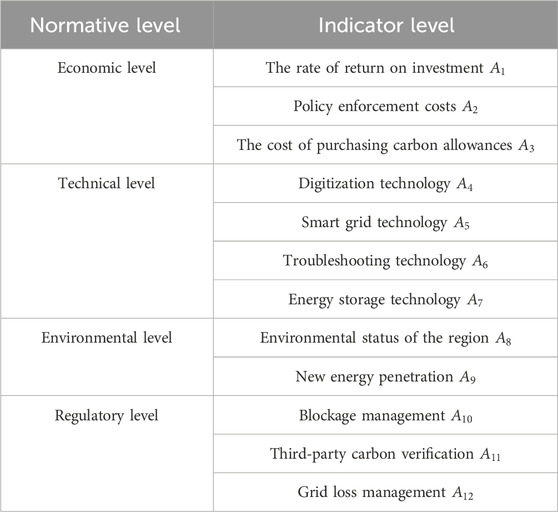
Existing studies mainly diagnose the degree of influence of important operation-related parameters of electricity enterprises on carbon emissions from a global perspective; however, there is a lack of a set of indicator systems to perceive the contribution of carbon emission reduction of RDNs, making it difficult to explain the support of urban green transformation (Yang Y. et al., 2023). In order to solve the above problems, the carbon emission reduction contribution evaluation indicator system of RDNs is constructed from four dimensions of economy, technology, environment, and management, as shown in Table 1.
2.2 Analysis of the indicator system
2.2.1 Economic dimension
The rate of return on investment (
where
Policy enforcement costs (
The cost of purchasing carbon allowances (
2.2.2 Technical level
Digital technology (
Smart grid technology (
Fault handling technology (
Energy storage technology (
2.2.3 Environmental level
Environmental status of the region (
New energy penetration rate (
where
2.2.4 Management level
Blockage management (
Third-party carbon verification (
Grid line loss management (
3 Spherical fuzzy set theory
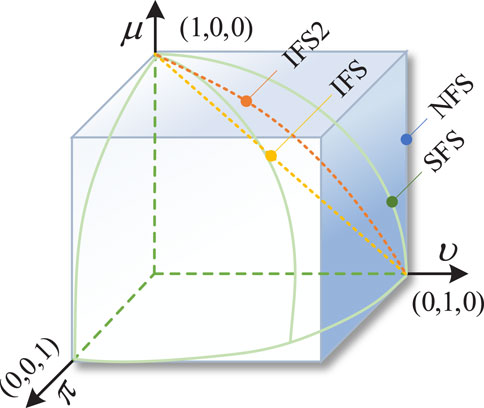
Fuzzy sets are powerful tools for dealing with uncertain information and are widely used in areas such as evaluation decision making (Yu et al., 2021). Spherical Fuzzy Sets (SFSs) is a concept that extends the traditional fuzzy sets, which contains extended forms of traditional fuzzy sets such as Intuitionistic Fuzzy Sets (IFS), Intuitionistic Fuzzy Sets of the second type (IFS2) and Neutrosophic Fuzzy Sets (NFS), providing more powerful tools for decision analysis, data processing, and other fields. Figure 1 illustrates the differences between IFS, IFS2, NFS, and SFS. For example, the affiliation dimension for the rating “absolutely much important” can be set to be close to 0.9, and the neutrality and non-affiliation dimensions can be set to be close to 0.1.
First, an SFS can transform semantic evaluation into fuzzy numbers, providing a wider value domain for each parameter, better dealing with uncertainty and expert’s hesitation, and accurately reflecting decision maker’s preferences and judgments, which is a significant feature of an SFS that distinguishes them from other fuzzy sets. In addition, decision makers often rely on subjective judgment and experience when assessing the contribution of regional distribution grids to carbon emission reduction. An SFS can allow decision makers to express their subjective judgments in a more flexible and precise way, thus better reflecting the actual situation. Finally, an SFS can enhance decision support by helping decision makers better understand and analyze the relationships between various factors and thus make more rational decisions.
Therefore, this article adopts the SFS to accurately characterize the evaluation information of high-dimensional uncertainty indicators in the carbon emission reduction contribution of RDNs.
3.1 Definition of spherical fuzzy sets
The values
3.2 Operations on spherical fuzzy numbers
The basic operations of
where
where the defining factor
The spherical weighted arithmetic mean operation of
where
4 Evaluation method for carbon emission reduction contribution of RDNs
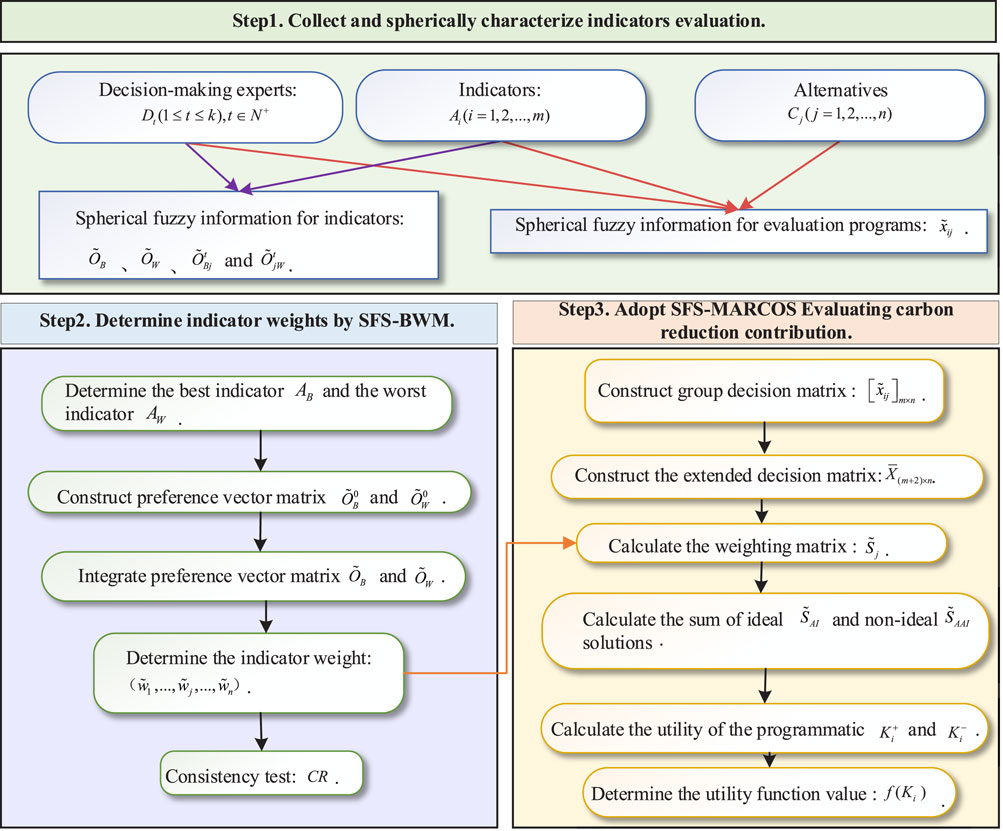
Considering the uncertainty of indicator evaluation, a hybrid model is proposed for analyzing the carbon emission reduction contribution of RDNs. The evaluation process consists of three stages, as shown in Figure 2. When evaluating the carbon emission reduction contribution of urban RDNs, the alternative to be evaluated is
where
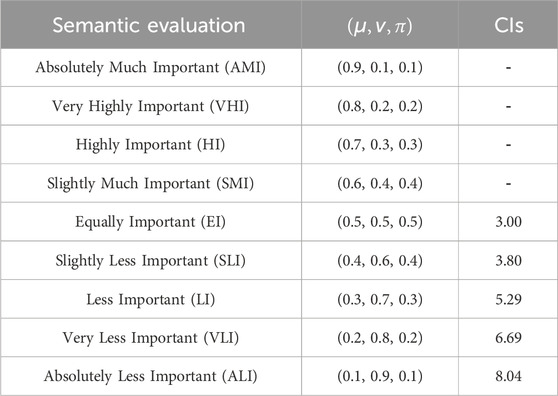
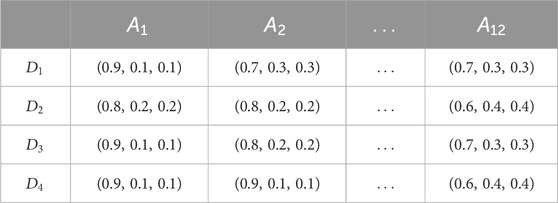
Table 2. Semantic evaluation and corresponding spherical fuzzy numbers applied to SFS-BWM and SFS-MARCOS.
4.1 Measurement of indicator weights
The weights play a crucial role in the model-solving process; however, the constructed indicator system contains a variety of uncertain information. Accordingly, accurate quantification of indicator weights will become a key problem in determining carbon emission reduction contributions.
The evaluation indicator system constructed in this study has many indicators. The commonly used indicator weight determination methods (for example, hierarchical analysis) are cumbersome and complex to calculate, so this article adopts the BWM to prioritize the priority ranking of the indicator assignment weights to obtain consistent results through less pairwise comparison information (Xiao et al., 2023). In addition, the “best-worst” comparison can more directly reflect the relative importance of each criterion, which can help researchers identify the key influencing factors more quickly and formulate targeted emission reduction measures (Jia et al., 2019). The BWM method ensures the scientificity and rationality of the decision-making results through steps such as consistency checking, which helps reduce the influence of subjective judgments on the decision-making results and improves the objectivity and accuracy of the study.
Therefore, the BWM is expanded into the SFS to develop a new method of determining indicator weights. The specific steps are as follows:
a. For the constructed evaluation indicator system
b. Construct the preference vector matrices
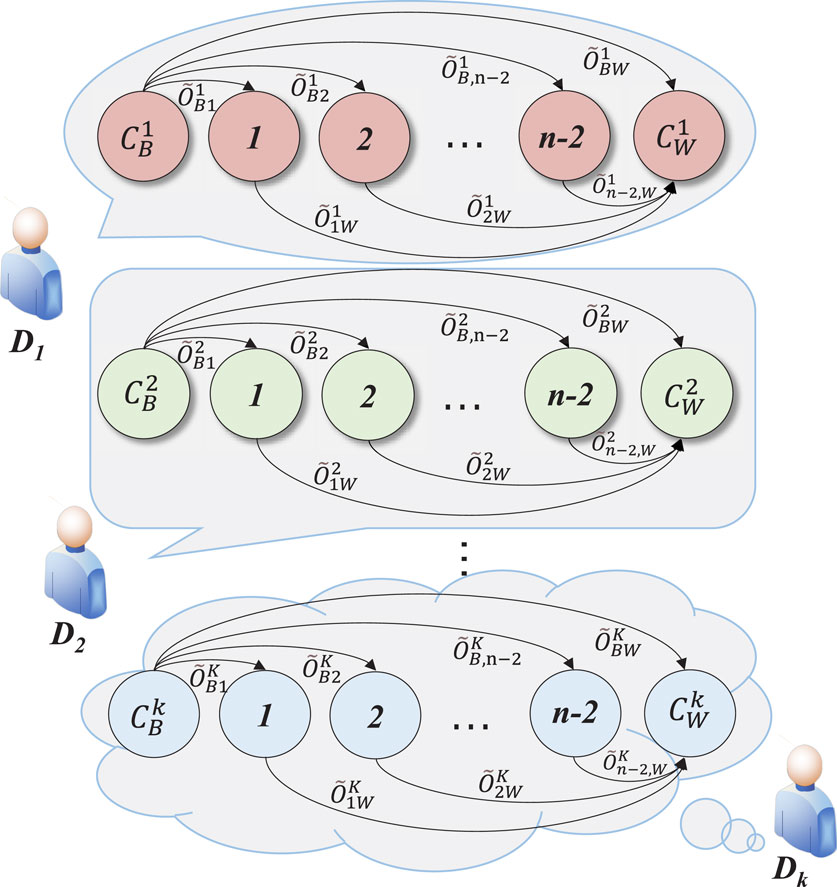
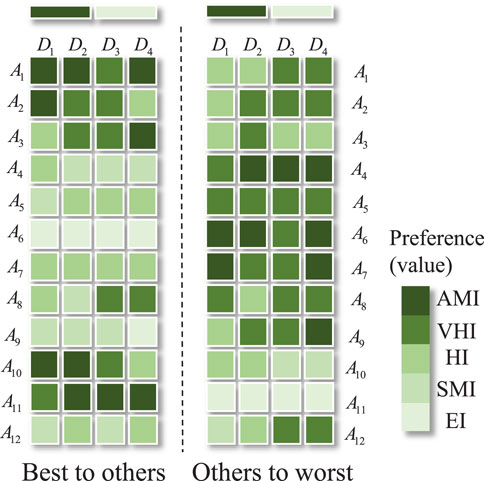
The preference comparison shown in Figure 3 is carried out and converted into the corresponding spherical fuzzy numbers, as shown in Table 2.
where
Similarly, the fuzzy preference vectors of other indicators are compared to the worst indicator
c. Integrate the preference vector matrices
According to Equations 3–7, integrate matrix
where
d. Determination of indicator weights.
Calculate the clear values of matrix
where
It implies that the optimal weights of the indicators are consistent between the optimal indicators compared to the other indicators and between the other indicators compared to the worst indicators as follows:
Let the objective value be
Solve the model by Lingo software to determine the indicator weight set
e. Consistency test.
The consistency ratio (
where
4.2 Evaluation of carbon emission reduction contribution based on SFS-MARCOS
Based on multi-dimensional indicator weights, the multi-attribute decision-making method is extended into the spherical fuzzy environment to calculate the carbon emission reduction contribution of RDNs. Considering that the decision-making process needs to deal with a large and highly uncertain amount of information, this research applies the MARCOS method. It is compared with common multi-attribute decision-making methods such as the multi-attributive border approximation area comparison (MABAC), the fuzzy comprehensive evaluation (FCE), the complex proportional assessment (COPRAS), and the preference ranking organization method for enrichment evaluations (PROMETHEE)-Ι and PROMETHEE-Ⅱ (Jia et al., 2019; Zhang et al., 2024; Rani et al., 2020; Seikh and Mandal, 2023; Yu et al., 2023).
MARCOS considers the inverse ideal solution and the ideal solution in the formation of the initial matrix, and at the same time, covers many indicators and decision scenarios and maintains stability (Thangaraj et al., 2023). Therefore, this article extends MARCOS into an SFS environment to determine the contribution of RDNs to carbon emission reduction. The specific steps are as follows:
a. Constructing a group decision matrix
where
b. Construct the extended population decision matrix
The ideal solution
where
where
c. Calculate the weighting matrix
In the formula,
d. The sum
e. The utility degree of the solution is calculated:
In the formula,
f. Determine the utility function value
where
Finally, based on Equations 12–41, the utility function values of the calculated solutions,
5 Case study
5.1 Case overview and model implementation
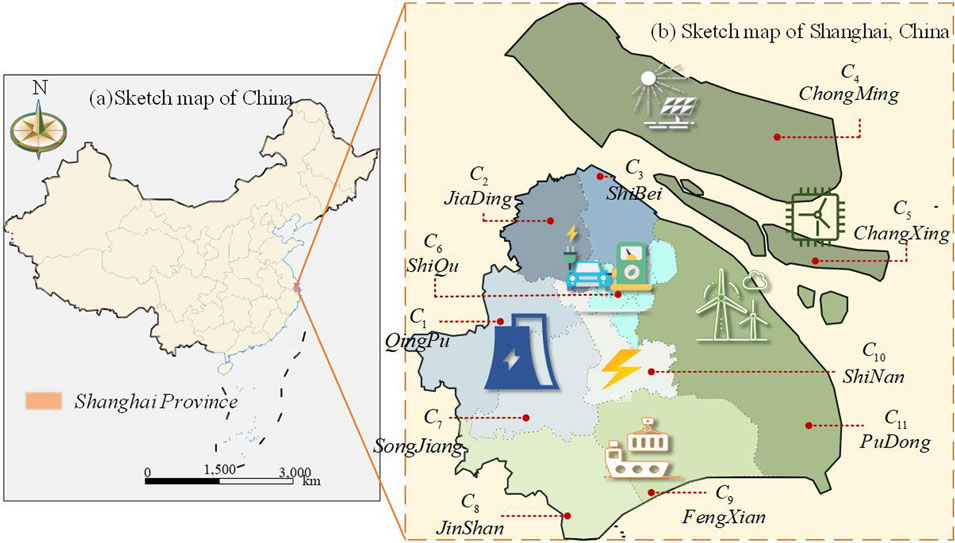
Shanghai has promoted renewable energy and a circular economy in Chongming Island, where distributed power supply, new energy generation, and intelligent operation and maintenance have achieved certain successes, driving the city’s economy toward low-carbon development. However, the significant contribution of regional carbon emission reduction is not currently perceived in depth, and the role of corresponding mitigation initiatives to support the green transformation of cities is not clearly defined. Therefore, this article selects 11 RDNs in Shanghai for analysis.
The evaluation system contains 12 indicators.
a. Conversion of pairwise comparison preference information and alternative evaluation information into spherical fuzzy numbers.
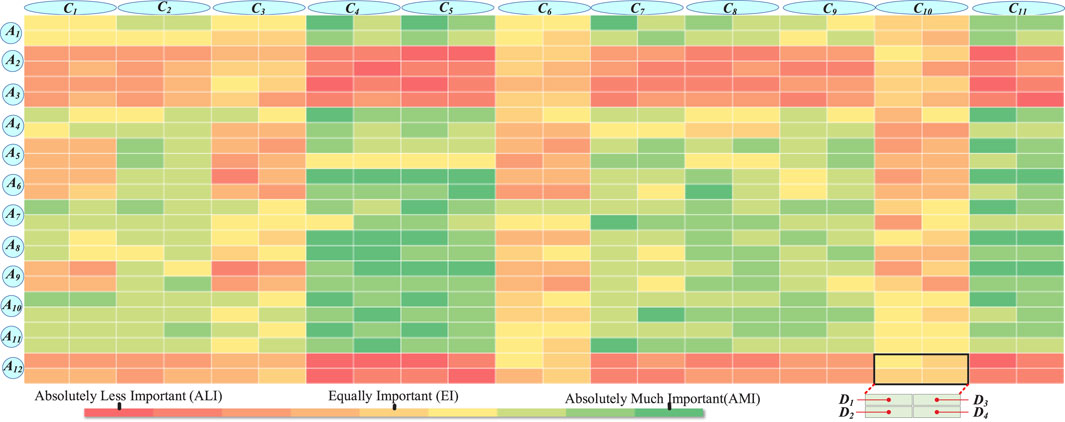
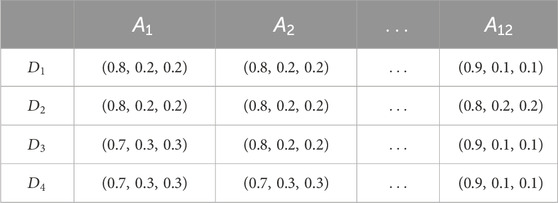
The pairwise comparison preference information and alternative evaluation information provided by the experts, as shown in Figures 5, 6, respectively, are converted into spherical fuzzy numbers, as shown in Tables 3–5.
b. Integration of pairwise comparative preference information and alternative indicator performance evaluation information provided by experts.
The pairwise comparative preferences and indicator performance evaluations provided by the four experts are integrated to generate the group preference information of the best indicators relative to other indicators
c. Indicator weight calculation.
The clear values of
d. Consistency test.
The target value
e. Determination of ideal solution
Considering the influence of the indicators on the contribution of areas to carbon emission reduction, the ideal solution
f. Calculate the ideal solution
The indicator weights obtained in step c are brought into the operation of a spherical fuzzy number to obtain the ideal solution
g. Calculate and rank the utility function value
Equations 37, 38 are used to obtain the utility degree
5.2 Result analysis
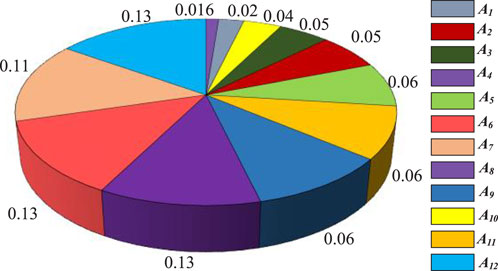
The indicator weight parameters of RDNs in terms of their perceived carbon emission reduction contributions are shown in Figure 7. The weight parameters of the indicators obtained by the SFS-BWM indicate that
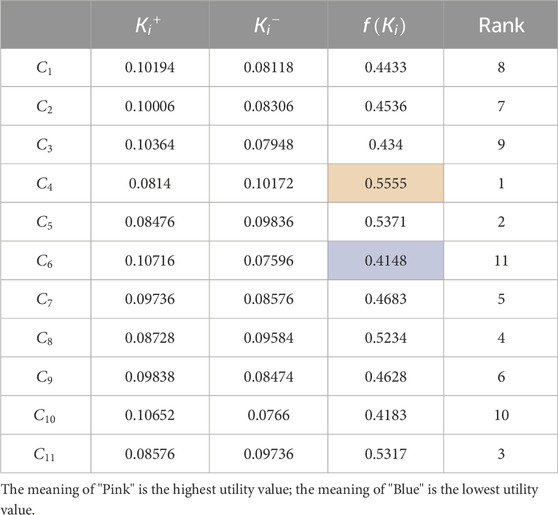
Under the influence of multi-dimensional indicators, the SFS-MARCOS method is used to calculate the carbon emission reduction contribution of RDNs, as shown in Figure 8. The results show that
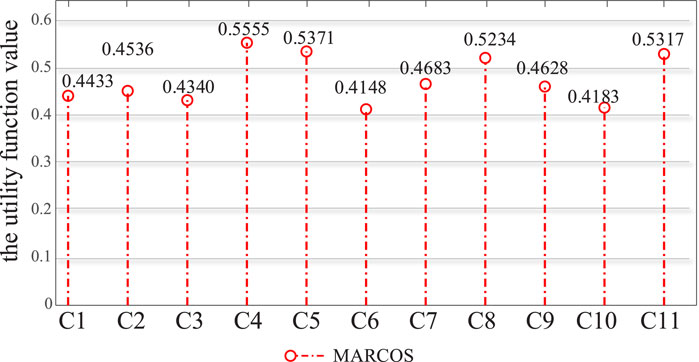
Figure 8. The evaluation results of carbon emission reduction contribution of RDNs under the MARCOS.
The economic development in the southern region of the city heavily relies on high-energy-consuming and high-emission industries, with the electricity sector being the primary contributor to this challenge, so the total amount and intensity of carbon emissions from the south grid are high. For areas with low contribution to carbon emission reduction, a variety of measures should be taken according to local conditions to improve the effect of carbon emission reduction. Therefore, the case results are in line with the actual situation, which verifies the reliability of the modeling method and shows that the evaluation is effective.
5.3 Sensitivity analysis
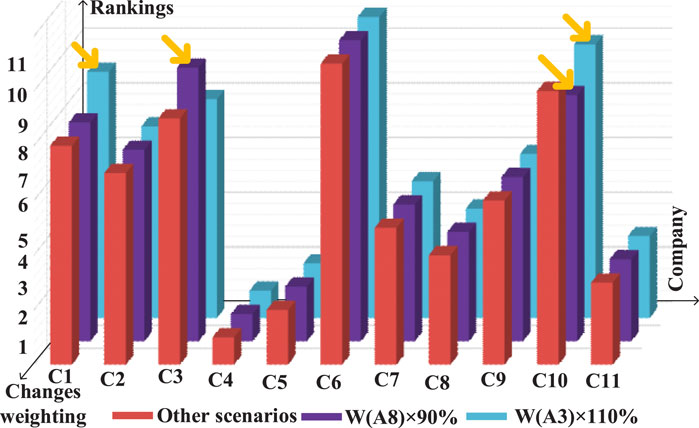
In order to analyze the influence of indicator weights on the rankings of carbon emission reduction contribution of areas, sensitivity analysis based on weight fluctuation was implemented. For this analysis, all indicator weights were reduced or increased by 10% from the original, as shown in Figure 9.
Assuming that the original weight of
When indicator
This indicates that the environmental conditions of the region where areas
5.4 Comparative analysis
In order to verify the feasibility and superiority of the SFS-MARCOS method in evaluating the carbon emission reduction contribution of RDNs, MABAC, FCE, COPRAS, PROMETHEE-Ι, and PROMETHEE-II are used to replace the MARCOS method. The application of MABAC in sorting problems is based on the distances of the alternatives from the border approximation areas. The FCE calculates the comprehensive evaluation value based on the set of weights and the single-factor judgement matrix, thus obtaining the overall evaluation of the evaluation object. The COPRAS considers the relative importance of the options and takes into account the actual validity of the options when dealing with the alternatives to ensure the comprehensiveness and practicability of the assessment results. The PROMETHEE combines the concepts of ideal and anti-ideal solutions and evaluates the solutions by constructing preference and aversion functions. The different results obtained by the different methods are analyzed, and the following rankings of utility function value of RDNs’ carbon emission reduction contribution are obtained, as shown in Figure 10.
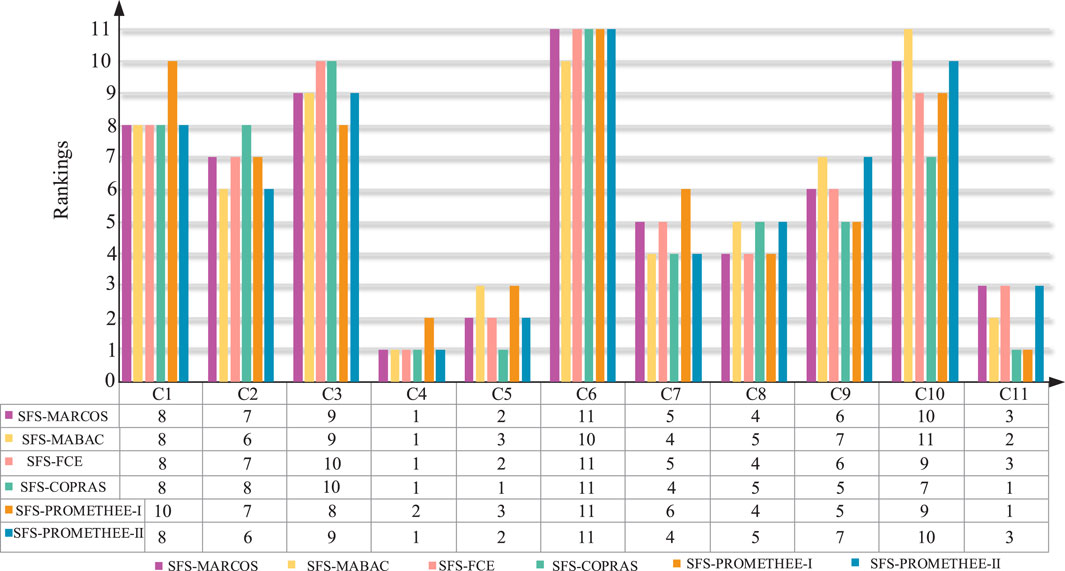
Figure 10. The rankings of the evaluation results of different decision-making methods in SFS environments.
As can be seen in Figure 10, the carbon reduction contribution of
Under the premise of ensuring the completeness of the decision-making evaluation information, it is compared with the SFS-MABAC, SFS-FCE, SFS-COPRAS, SFS-PROMETHEE-Ι, and SFS-PROMETHEE-Ⅱ methods to make the evaluation result objective and authentic and to verify that the SFS-MARCOS method is feasible, effective, and meets the needs of decision-making in practice.
6 Conclusion
In this article, a novel multi-attribute decision-making BWM-MARCOS method based on SFS is proposed for the realm of carbon emission reduction contribution determination, whose characteristics are as follows:
a. This article constructs the indicator system from four dimensions of economy, technology, environment, and management to provide an all-round determination of the carbon emission reduction contribution of RDNs.
b. The SFS-BWM method is adopted to calculate the importance degree of the indicators, circumvent the cumbersome and complicated arithmetic procedures, and avoid the loss of information in the evaluation.
c. The SFS-MARCOS method is used to deal with a large amount of uncertain data, is robust to data changes, solves the problem of data changes in the presence of a certain amount of noise, and ensures the stability of the evaluation results.
Eleven areas in Shanghai are analyzed as examples to verify the effectiveness and feasibility of the proposed method. The next step of the study will incorporate quantitative information on the basis of qualitative research and redesign the indicator system to support the low-carbon development of other industries. In the future, research can leverage big data and machine learning techniques to automate data collection and analysis, reducing subjectivity and enhancing accuracy. Multi-regional case studies can be conducted to test the generalizability and applicability of the proposed model.
To this end, we offer the following recommendations for carbon reduction in RDNs:
a. Strengthen the application of digital and intelligent technologies.
b. Optimize the energy structure and increase the penetration of new energy sources.
c. Implement scientific investment management and cost control.
d. Enhance environmental regulation and third-party carbon verification.
Data availability statement
The original contributions presented in the study are included in the article/supplementary material; further inquiries can be directed to the corresponding author.
Author contributions
PD: conceptualization, funding acquisition, methodology, project administration, software, supervision, visualization, writing–original draft, and writing–review and editing. MY: data curation, formal analysis, investigation, methodology, software, validation, visualization, writing–original draft, and writing–review and editing. WH: methodology, project administration, resources, supervision, writing–original draft, and writing–review and editing. PW: conceptualization, methodology, project administration, resources, visualization, writing–original draft, and writing–review and editing. QX: conceptualization, formal analysis, methodology, software, validation, visualization, writing–original draft, and writing–review and editing.
Funding
The author(s) declare that financial support was received for the research, authorship, and/or publication of this article. This research received support from the Shanghai Yangfan Program (23YF1414300).
Conflict of interest
Author PW was employed by the Economic and Technological Research Institute of State Grid Fujian Electric Power Co., Ltd.
The remaining authors declare that the research was conducted in the absence of any commercial or financial relationships that could be construed as a potential conflict of interest.
Publisher’s note
All claims expressed in this article are solely those of the authors and do not necessarily represent those of their affiliated organizations, or those of the publisher, the editors, and the reviewers. Any product that may be evaluated in this article, or claim that may be made by its manufacturer, is not guaranteed or endorsed by the publisher.
References
Avdasheva, S., and Orlova, Y. (2020). Effects of long-term tariff regulation on investments under low credibility of rules: rate-of-return and price cap in Russian electricity grids. Energy Policy 138, 111276. doi:10.1016/j.enpol.2020.111276
Cheng, S., Cheng, Y., He, C., Fu, T., and Wang, C. (2024). Distributed synergistic planning of distribution networks-multiple integrated energy systems considering uncertainty. Electr. Power Autom. Equip., 1–19. doi:10.16081/j.epae.202404004
Du, P., Gong, X., Han, B., and Zhao, X. (2023). Carbon-neutral potential analysis of urban power grid: a multi-stage decision model based on RF-DEMATEL and RF-MARCOS. Expert Syst. Appl. 234, 121026. doi:10.1016/j.eswa.2023.121026
Du, P., Zhou, B., and Yang, M. (2024). Carbon emission reduction contribution analysis of electricity enterprises in urban green development: a quantum spherical fuzzy sets-based decision framework. Technol. Forecast. Soc. Change 200, 123181. doi:10.1016/j.techfore.2023.123181
Geng, X., and Li, Y. (2023). Methodology research for spherical fuzzy quality function deployment considering psychological preferences. Univ. Shanghai Sci. Technol. 45 (5), 523–533. doi:10.13255/j.cnki.jusst.20220628001
Gong, X., Yang, M., and Du, P. (2021). Renewable energy accommodation potential evaluation of distribution network: a hybrid decision-making framework under interval type-2 fuzzy environment. J. Clean. Prod. 286, 124918. doi:10.1016/j.jclepro.2020.124918
Huang, Q., Zhang, H., Ma, L., and Yang, J. (2023). Hybrid Harris hawks optimization algorithm for solving low-carbon multimodal transportation problem with fuzzy demand. Appl. Res. Comput. 40 (10), 2978–2983. doi:10.19734/j.issn.1001-3695.2023.03.0061
Jia, F., Liu, Y., and Wang, X. (2019). An extended MABAC method for multi-criteria group decision making based on intuitionistic fuzzy rough numbers. Expert Syst. Appl. 127, 241–255. doi:10.1016/j.eswa.2019.03.016
Labis, P. E., Visande, R. G., Pallugna, R. C., and Caliao, N. D. (2011). The contribution of renewable distributed generation in mitigating carbon dioxide emissions. Renew. Sustain. Energy Rev. 15 (9), 4891–4896. doi:10.1016/j.rser.2011.07.064
Laxmi, R., Ismat, B., and Sanjay, K. (2024). Spherical fuzzy analytic hierarchy process and linear assignment model based MCGDM method with its application in ranking of states for their business climate. Expert Syst. Appl. 238, 122247. doi:10.1016/j.eswa.2023.122247
Li, B., Liao, K., Yang, J., and He, Z. (2024). A data-driven fault detection scheme for DC distribution networks based on the adaptive boosting technique. Appl. Energy 374, 123949. doi:10.1016/j.apenergy.2024.123949
Li, B., Xia, X., and Li, Q. (2023). Research on the influence of carbon allowance trading on the improvement of carbon emission reduction technology and the coordination mechanism. Chin. J. Manag. Sci. 575, 1003–207x. doi:10.16381/j.cnki.issn1003-207x.2023.0576
Liu, X., Mei, S., Ding, R., Zhong, S., Zhang, X., Xie, N., et al. (2023). Compressed air energy storage engineering status, development trend and application prospects. Automation Electr. Syst. 43 (10), 38–47. doi:10.16081/j.epae.202309005
Qiu, H., Shi, K., Wang, R., Zhang, L., Liu, X., and Cheng, X. (2024). A novel temporal–spatial graph neural network for wind power forecasting considering blockage effects. Renew. Energy 227, 120499. doi:10.1016/j.renene.2024.120499
Rani, P., Mishra, A. R., and Mardani, A. (2020). An extended Pythagorean fuzzy complex proportional assessment approach with new entropy and score function: application in pharmacological therapy selection for type 2 diabetes. Appl. Soft Comput. 94, 106441. doi:10.1016/j.asoc.2020.106441
Sang, L., Xu, Y., Sun, H., and Wu, W. (2024). Carbon-aware distribution network operation approach via fusing learning and optimization. Proc. CSEE, 1–11.
Seikh, M. R., and Mandal, U. (2023). Interval-valued Fermatean fuzzy Dombi aggregation operators and SWARA based PROMETHEE II method to bio-medical waste management. Expert Syst. Appl. 226, 120082. doi:10.1016/j.eswa.2023.120082
Sun, Y., Li, Z., and Bao, H. (2021). Multi-energy heterogeneous load regulation framework and key technology analysis under clean heating mode. Proc. CSEE 41 (20), 6827–6842. doi:10.13334/j.0258-8013.pcsee.210798
Thangaraj, M., Samayan, N., and Selvaraj, G. (2023). Sustainable renewable energy system selection for self-sufficient households using integrated fermatean neutrosophic fuzzy stratified AHP-MARCOS approach. Renew. Energy 218, 119324. doi:10.1016/j.renene.2023.119292
Wei, Q., Zhou, C., Liu, Q., Zhou, W., and Huang, J. (2023). A barrier evaluation framework for forest carbon sink project implementation in China using an integrated BWM-IT2F-PROMETHEE II method. Expert Syst. Appl. 230, 120612. doi:10.1016/j.eswa.2023.120612
Wu, Y., Yan, W., Du, P., Gong, X., and Zhou, M. (2023). Mengxia zhou. Regional evaluation study of VFTO interference to secondary side cables based on cloud model and MARCOS. IEEE Trans. neural Netw. Learn. Syst. 10, 1–14. doi:10.1109/TNNLS.2023.3325537
Xiao, J., Cai, M., Gao, Y., and Zhou, K. (2023). Consensus model for interval-value non-additive BWM considering risk attitude. Control Decis. 39 (6), 2097–2105. doi:10.13195/j.kzyjc.2022.2099
Xie, Y., Li, Y., Liu, Y., Du, E., Xu, Q., and Zhang, N. (2023). Preliminary exploration of carbon reduction demand side cloud energy storage model: operation model and benefit analysis. Proc. CSEE 61, 1–13. doi:10.13334/j.0258-8013.pcsee.23150
Xue, X., and Tsai, P. W. (2022). Integrating Energy Smart Grid’s ontologies through multi-objective particle swarm optimization algorithm with competitive mechanism. Sustain. Energy Technol. Assessments 53, 102442. doi:10.1016/j.seta.2022.102442
Yang, S., Lao, K. W., Hui, H., and Chen, Y. (2024). Secure distributed control for demand response in power systems against deception cyber-attacks with arbitrary patterns. IEEE Trans. Power Syst., 1–12. doi:10.1109/tpwrs.2024.3381231
Yang, S., Lao, K. W., Hui, H., Chen, Y., and Dai, N. (2023a). Real-time harmonic contribution evaluation considering multiple dynamic customers. CSEE J. Power Energy Syst., 1–13. doi:10.17775/CSEEJPES.2022.06570
Yang, Y., Hao, J., Wang, X., Feng, X., Du, X., and Zheng, L. (2023b). Global diagnosis and analysis of carbon emission reduction by combining data stacked-layer optimization model. Proc. CSEE 43 (S1), 153–164. doi:10.13334/j.0258-8013.pcsee.231399
Yao, L., Cai, R., Qian, J., and Wu, X. (2023). Aggregation and control model construction of hybrid load system for supply and demand balance in low-carbon zone. Power Syst. Technol. 47 (8), 3153–3166. doi:10.13335/j.1000-3673.pst.2023.0432
Yu, D., Liu, Y., and Xu, Z. (2023). Analysis of knowledge evolution in PROMETHEE: a longitudinal and dynamic perspective. Inf. Sci. 642, 119151. doi:10.1016/j.ins.2023.119151
Yu, Q., Liao, Y., Cao, J., and Hou, F. (2021). QUALIFLEX and LINMAP-based approach for multi-attribute decision making problems with simplified neutrosophic hesitant fuzzy sets. Operations Res. Manag. Sci. 30 (6), 77–82. doi:10.12005/orms.2021.0183
Yue, F., Liu, H., Su, X., and Chen, S. (2024). Carbon tracing method for RDNs considering load side electricity substitution. Guangdong Electr. power 37 (02), 47–55. doi:10.3969/j.issn.1007-290X.2024.02.006
Zhang, Y., Wang, S., Liu, J., Liu, D., Li, T., and Wu, W. (2024). A corrosion assessment methodology based on triangular intuitionistic fuzzy comprehensive evaluation (TIFCE) with analytic network process (TIFANP): an application to external corrosion of the storage tank floor. Expert Syst. Appl. 238©, 121896. doi:10.1016/j.eswa.2023.121896
Zhang, Z., and Kang, C. (2022). Challenges and prospects for constructing the new-type power system towards a carbon neutrality future. Proc. CSEE 42 (8), 2806–2819. doi:10.13334/j.0258-8013.pcsee.220467
Keywords: RDNs, multi-attribute decision making, carbon emission reduction contribution, spherical fuzzy sets, BWM, MARCOS
Citation: Du P, Yang M, Hu W, Wang P and Xing Q (2024) A method of determining the carbon emission reduction contribution of regional distribution networks based on spherical fuzzy sets. Front. Energy Res. 12:1486359. doi: 10.3389/fenrg.2024.1486359
Received: 26 August 2024; Accepted: 30 September 2024;
Published: 24 October 2024.
Edited by:
Haifeng Qiu, Nanyang Technological University, SingaporeReviewed by:
Shiyu Liu, Shanghai University of Political Science and Law, ChinaRunsheng Gu, Shanghai University of Finance and Economics, China
Jia Luo, Shangrao Normal University, China
Copyright © 2024 Du, Yang, Hu, Wang and Xing. This is an open-access article distributed under the terms of the Creative Commons Attribution License (CC BY). The use, distribution or reproduction in other forums is permitted, provided the original author(s) and the copyright owner(s) are credited and that the original publication in this journal is cited, in accordance with accepted academic practice. No use, distribution or reproduction is permitted which does not comply with these terms.
*Correspondence: Miaoheng Yang, MTM3MjMzOTcyNDdAMTYzLmNvbQ==
 Puliang Du
 Miaoheng Yang
 Wei Hu1
 Qiang Xing