 Chen Wu
 Hao Jiao
- State Grid Jiangsu Electric Power Co., Ltd., Nanjing, China
The continuous growth of renewable energy and the load level has posed increasingly severe operational risks to distribution systems. In view of this, this paper combines state estimation with risk assessment, and uses the results of distribution system state estimation based on Unscented Kalman Filter as the input of risk assessment. With the combination, the sampling based on probability distributions in traditional risk assessment methods is no longer needed, thus avoiding the difficulty of updating probability distributions timely according to the latest information in real-time operation. By applying the proposed risk assessment method, the real-time assessment of operational risks in perspectives of bus voltage, branch power, and renewable energy utilization is achieved. Meanwhile, the weight of each risk index is properly determined according to both subjective and objective knowledge by using Analytic Hierarchy Process method and entropy weight method. Case studies show that the proposed method achieves effective assessment of comprehensive risks in the operation of distribution system.
1 Introduction
With the development of the power system, the increasing penetration of the renewable energy and the continual growth of load demand in the distribution system have led to a more complex topology and more difficult operation of the distribution system, thus exacerbating its risks (Zheng et al., 2021). Unfortunately, the traditional risk assessment methods cannot satisfy the demands of the modern power system due to their incompetency in real-time risk assessment.
The methods of risk assessment for power system are generally divided into two types: deterministic ones and probabilistic ones. The deterministic method considers the most serious situation and calculates the safety and stability margin of the system, which deals with events with rare occurrence and severe impact (Xu et al., 2020; Liu et al., 2024). The probabilistic method is further divided into analytical method and simulation method. The analytical method is limited to small systems due to the limitation of the amount of computation, while the simulation method simulates the operating state of the system through a large number of samples and comprehensively considers different operating conditions, which is more suitable for complex large-scale power systems. The simulation method is usually based on the Monte Carlo method (Ansari et al., 2020), and the risk severity analysis of the sampled scenarios is carried out according to the established risk assessment standards. Ansari and Chung (2019) propose a short-term risk assessment model, which uses regional risk method and non-sequential Monte Carlo simulation to realize short-term risk assessment. da Silva and de Castro (2019) mention a model based on Monte Carlo simulation which uses importance sampling techniques to calculate risk indices and improves the accuracy of simulation of the probability distribution of state variables by improving the sampling method. Risk assessment by simulation method depends on the probability distribution of uncertainty factors of system operation, but it is difficult to update the probability distribution of uncertainty factors quickly based on the latest information in real-time operation, especially when there are many uncertainty factors involved. To solve this problem, this paper intends to integrate state estimation and risk assessment to achieve real-time and effective perception of the operational risk of the distribution system.
In essence, state estimation is aimed at estimating the operating state of the system by using sampled data of the measurement device and filtering the original data to provide information for the optimal control of the distribution system (Zhao et al., 2019; De Oliveira-De Jesus et al., 2021; Feng et al., 2022). Dynamic state estimation is based on the filtering algorithms, which predict the operating state of the next moment based on the past state combined with the prediction method, and amends the prediction after receiving the latest measurement information, so as to estimate the internal state of the dynamic system, which provides basic data support for the operation of the power system (Ghadikolaee et al., 2020). The traditional dynamic state estimation mainly adopts Extended Kalman Filter, but the foundation of this method is linear approximation of nonlinear systems and linearization by first-order Taylor series expansion, and the error is larger in systems that have strong nonlinear features (Zhao et al., 2017; Wang et al., 2021). In comparison, the Unscented Kalman Filter adopts different ideas and schemes. Considering the difficulty of approximating nonlinear systems, Unscented Kalman Filter approximates probability density functions by generating Sigma point sets (Swain and Subudhi, 2019; Zhao and Mili, 2019). Compared with extended Kalman filtering, Unscented Kalman Filtering does not calculate the Jacobian matrix. Meanwhile, it displays higher approximation accuracy (Yildiz et al., 2020; Wang et al., 2020, Dang et al. (2022) probe into the problem of non-Gaussian noises and enhance the numerical stability. Liu et al. (2020) propose a state estimation method of medium-voltage distribution systems based on Unscented Kalman Filter algorithm to reduce the uncertainty of state prediction to tackle the problem of insufficient real-time measurement of distribution system and the assumption that the system process noise is constant in the existing estimation methods. Mestav et al. (2019) adopt a deep learning approach to deal with the problem of state estimation for unobservable distribution systems and improves estimation accuracy. During the process of state estimation, Unscented Kalman Filter analyzes the prediction and measurement noise, so the corresponding results can actually be utilized for risk assessment. Based on the fact that the existing studies pay little attention to this, this paper focuses on how to combine state estimation and risk assessment effectively.
Dynamic state estimation of power system can reveal the evolution of system operating state over time with strong timeliness and reliability, and the result contains prediction information. Therefore, using state estimation results for risk assessment can greatly improve accuracy and efficiency and achieve real-time risk assessment. Hence, this work proposes a distribution system operational risk assessment method based on Unscented Kalman Filter, which utilizes the prediction step of the Unscented Kalman Filter to obtain the operating state of the next moment. By using the predicted state as the input of the risk assessment model, this work realizes real-time risk assessment of the distribution system. In terms of risk calculation, from the perspectives of bus voltage, power flow and renewable energy consumption, this paper carries out risk assessment from the component and system level and adopts the Analytic Hierarchy Process and Entropy Weight Method to determine the comprehensive weights of different risk indices. The effectiveness of the proposed method is verified by several numerical examples. Section 2 of this paper discusses the risk assessment process based on Unscented Kalman Filter state estimation, Section 3 establishes the comprehensive risk assessment index system, and Section 4 conducts case studies from different perspectives.
2 Real-time risk assessment of distribution systems
2.1 State estimation based on Unscented Kalman Filter
The key step of Unscented Kalman Filter is to generate Sigma points through unscented transformation based on the probability distribution of the state variable. The specific generation method is shown in Equations 1, 2:
where
Based on the Unscented Kalman Filter algorithm, the state estimation steps of the distribution system are as follows:
1) The Sigma point set {
2) State prediction: In terms of prediction, machine learning and exponential smoothing method are adopted in abundant research. Although machine learning is better performed in many aspects, its training relies on reliable data sets and is time-consuming. Therefore, in this paper, the prediction of the next moment is carried out separately for each Sigma point using exponential smoothing method based on the previous state of these points, and the mean and covariance of the points are calculated in Equations 3–7:
where
3) Measurement prediction: Based on the measurement function and the state variable, the prediction of measurement point set
where
4) State update: After obtaining a new round of measurement
2.2 Risk assessment based on Unscented Kalman Filter
In traditional risk assessment, a sampling process based on the probability distribution of uncertainty factors is often required before conducting risk assessment with the scenarios it obtained. However, in real-time operation, it is difficult to adjust the probability distribution of uncertainty factors simultaneously according to the real measurement information, which means that the traditional risk assessment methods are lack of timeliness and not suitable for real-time dynamic risk assessment of the system.
There are two core steps in the process of state estimation of the distribution system based on Unscented Kalman Filter. The first is to predict the state variable through Sigma points, and the second is to revise the prediction of state variable according to new measurement data. The sampling that is completed in the prediction step of the Unscented Kalman Filter algorithm can not only be combined with the measurement information of the next moment to estimate the operational state of the distribution system, but also be used for the early evaluation of the operational risk before the measurement information of the next moment is obtained. Therefore, this paper takes the output of the prediction step of the Unscented Kalman Filter as the input of the risk assessment model, and the complete process is shown in Figure 1. Based on the various Sigma points generated by the Unscented Kalman Filter, the system’s operational state at the next moment, namely the voltage amplitude and phase of all buses, can be forecasted, and the power flow can be calculated immediately based on the bus voltage. Then, the operational risk of the distribution system is fully evaluated with the obtained operational state and the established risk indices. By making full use of the state estimation results, the difficulty of simultaneously updating the probability distribution is avoided and the calculation efficiency is significantly improved, so as to enable real-time operational risk assessment and provide the corresponding data basis for the risk control, which contributes to better operation of the distribution system.
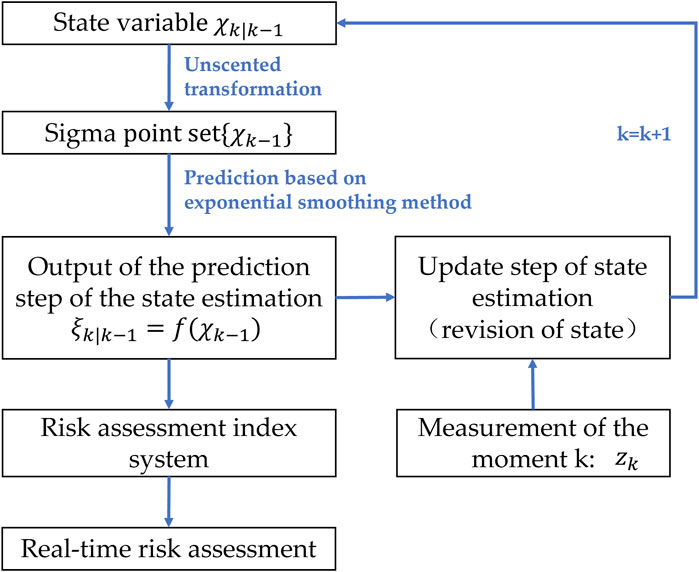
Figure 1. Risk assessment of distribution system based on Unscented Kalman Filter.
3 Comprehensive risk assessment index system
In order to evaluate the operational risk of the distribution system, this paper constructs risk indices from the perspectives of bus voltage, line power flow and renewable energy utilization, and evaluates the operational risk from the component and system level. This paper focuses on real-time risk assessment based on state estimation, and the failure of the equipment will be reflected on the system operational state and the risk indices considered in this paper. Because of the low probability of the malfunction of equipment in a small time-span of real-time operation, it is not considered as a separate risk in this paper.
3.1 Voltage risk and power flow risk
The overvoltage risk index reflects the risk when the voltage of each bus of the distribution system exceeds the safe voltage range, as is calculated in Equation 15:
where
where
The low voltage risk index reflects the risk when the bus voltage falls below the lower voltage limit and is calculated in Equation 17:
where
where
The line overload risk index reflects the risk when the active power flow of the line exceeds the maximum limit, as is calculated in Equation 19:
where
where
Unlike line overload risk which results from high load demand at buses, reverse line overload is caused by high renewable energy penetration in the system. When there is a large amount of renewable power in the system, the residual power will be transmitted backwards through the line from the installation point of the renewable power to the head of the line. The reverse line overload risk index reflects the risk that the reverse active power carried on the line exceeds the maximum limit, (the risk of bus voltage increase caused by incomplete absorption of the renewable power has been included in the overvoltage operational risk mentioned previously, so only the risk caused by its impact on the power flow is considered here), and it is calculated in Equation 21:
where
Because of the different location of each bus in the distribution system and their different amount of load demand, the voltage risk of each bus has varying degrees of impact, so this paper assigns different weights to each bus, and summarizes voltage risks of buses to the system level using the bus weight, as is shown in Equations 23, 24.
where
where
The overload and reversing overload operational risks of distribution lines are the cumulative sum of the overload operational risks of each branch in the distribution system, as is shown in Equations 26, 27:
where
3.2 Risk of renewable energy curtailment
When there is an excessive amount renewable energy that cannot be fully absorbed, it can lead to serious overvoltage and reverse line overload risks in the distribution system. In this case, the impact of renewable energy can be diminished by curtailing power, but it can also result in lower utilization rates of renewable energy. By using the prediction of the system operational state, namely the bus voltage, during the state estimation process, the power flow on each branch can be quickly calculated, and the injection power of each bus can be obtained. Based on this, this section constructs an optimization model to optimize the amount of renewable energy curtailment required to avoid serious voltage and power flow risks before calculating the risk of renewable energy curtailment. The objective function of the optimization model is described in Equation 28:
where
In addition, the optimization model of renewable energy curtailment is also constrained by power flow and power balance. As optimization problems based on accurate power flow constraints cannot be solved, this paper adopts the following linear approximation power flow constraints (Yang et al., 2018; Yang et al., 2019).
In the Equations 30, 31,
Given the complicated operational requirements of distribution systems and the requirement for timeliness of its real-time risk assessment, the simplification of calculation needs to be considered. Although approximating network losses may sacrifice a bit of accuracy, it is an effective way to decouple voltage amplitude v and phase angle
The constraints for bus injection power are described in Equations 34, 35.
where
The constraints on nodal power balance are shown in Equations 36, 37.
where
The constraint for renewable energy curtailment is described in Equation 38.
where
The renewable energy curtailment won’t happen unless the bus voltage or branch power flow reach the triggering point. When they reach the threshold for triggering curtailment, the optimization model reduces the part of bus voltage and power flow exceeding the threshold limit by curtailing part of the renewable energy, thereby reducing the overall operational risk of the distribution system. In the cases where renewable energy curtailment is called for, the distribution system status after curtailment will be calculated through power flow calculation before calculating the voltage and power flow related risks.
3.3 Subjective and objective weights of risk indices
The various operational risk indices of the distribution system reflect different kinds of operational risks. In order to evaluate the overall risk of the system, appropriate weights need to be assigned to each risk index to form a comprehensive risk index system. In order to achieve reasonable risk assessment, this paper combines the Analytic Hierarchy Process and Entropy Weight Method. The Analytic Hierarchy Process determines index weights subjectively based on past knowledge (Saaty, 1990), while the Entropy Weight Method determines index weights objectively based on the amount of information contained in the data (Chen, 2020). The objective weights calculated by the Entropy Weight Method are objective and unbiased for it eliminates the different dimensions of various indices before comparing them. However, the method is based solely on the characteristics of data without considering the actual meaning of it, which may lead to results that go against common sense. Thus, in this paper, subjective weights with experts’ intelligence and experience contained are combined to objective weights to obtain comprehensive weights of the risk indices.
1) Subjective weights. The Analytic Hierarchy Process decomposes complex decision-making problems into a series of sub-problems, and then further divides sub-problems to build a hierarchical evaluation index system, which fully considers the relationship between various influencing factors. When the Analytic Hierarchy Process is used to determine the subjective weights, a three-layer structure of “target layer - criterion layer - scheme layer” is constructed, and the number of elements in each layer usually does not exceed nine. The structure is shown in Figure 2.
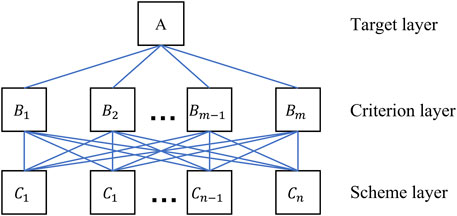
Figure 2. Three-layer structure of the Analytic Hierarchy Process.
Assuming that the criterion layer has m elements, the scheme layer has n elements, and the elements in the criterion layer and the scheme layer are compared in pair-to-pair to form a judgment matrix
In the formula,
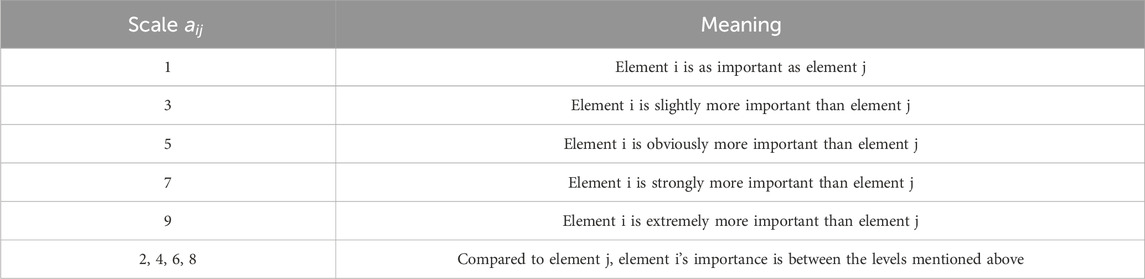
Table 1. Nine-scale risk level.
Consistency test was performed on the judgment matrix, and the consistency index CI is calculated in Equation 40:
where
The random consistency index RI is obtained according to Table 2, and then the consistency ratio CR is calculated in Equation 41:

Table 2. Random consistency index values.
If CR < 0.1, matrix A is considered to pass the consistency test, and then the weights corresponding to each judgment matrix
Record the weight set of matrix A as vector
Likewise, the consistency tests of matrix
2) Objective weights. Assuming that there are a total of s risk assessment indices, and each risk assessment index has n samples. The objective weight evaluation matrix J is established in Equation 44:
where element
where
The entropy calculation formula of the risk assessment index is shown in Equation 46:
The information utility value is defined as
After determining subjective and objective weights, they are integrated to form the comprehensive risk index weights, as is shown in Equation 48.
where W is the subjective weight set obtained through the Analytic Hierarchy Process, Z is the objective weight set calculated by the Entropy Weight Method, and μ is the weight coefficient used to combine subjective and objective weights. The coefficient μ is determined based on the quality of historical data in the Entropy Weight Method and the authority of expert information in the Analytic Hierarchy Process.
After determining the weight of risk indices, the comprehensive operational risk of the distribution system can be calculated by weighted sum of overvoltage risk, low voltage risk, line overload, reverse line overload risk, and renewable energy curtailment risk, as is shown in Equation 49.
where
4 Results
The example analysis is based on the 12-bus distribution system provided by Matpower, and the line impedance and initial load are recorded in Table 3 and Table 4 respectively.
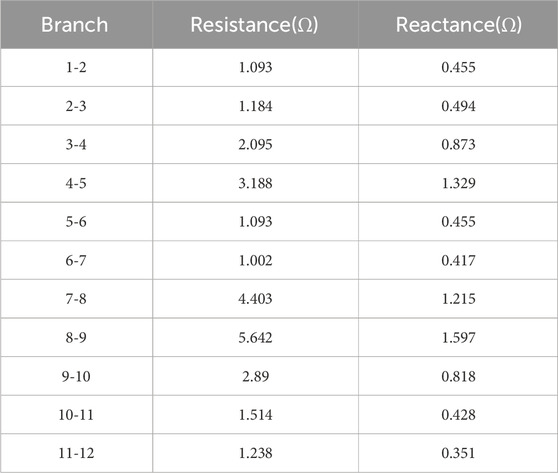
Table 3. Resistance and reactance of the distribution system.
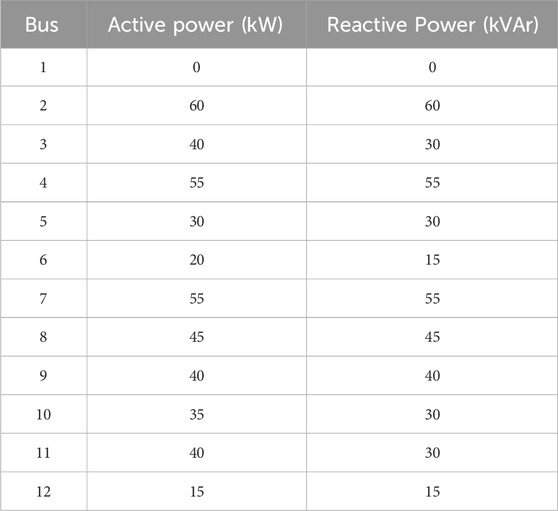
Table 4. Active and reactive loads.
4.1 Impact of load and renewable energy on risk
The operational risk of the distribution system is mainly determined by the connected load and renewable energy, in addition to its own topology and network parameters. This section will discuss their impact on the operational risk of the distribution system from the perspectives of load power, renewable energy power, and the location of renewable energy. The results are shown in Figures 3–5. It can be seen that high load and renewable energy injection will bring about different kind of risks. Along with the increase of load and renewable energy, the operational risk significantly increases, and the growth is not linear. The growth rate increases with the increase of load and renewable energy power. In addition, as is shown in Figure 5, the location of renewable energy also has a significant impact on the risk of the distribution systems. When renewable energy is connected to the head of the line, its power flows to the transmission network through fewer branches, and the bus voltage in the distribution system gradually decreases from the first bus to the end without any occurrence of overvoltage. When renewable energy is connected to the middle section of the line, its power flows through more branches, resulting in a gradual increase in bus voltage from the head to the middle section of the distribution system, and overvoltage risk occurs at buses from the middle to the end. When renewable energy is connected to the end of the line, its output is transmitted backwards through the entire distribution system, posing a serious risk of overvoltage in the distribution system.
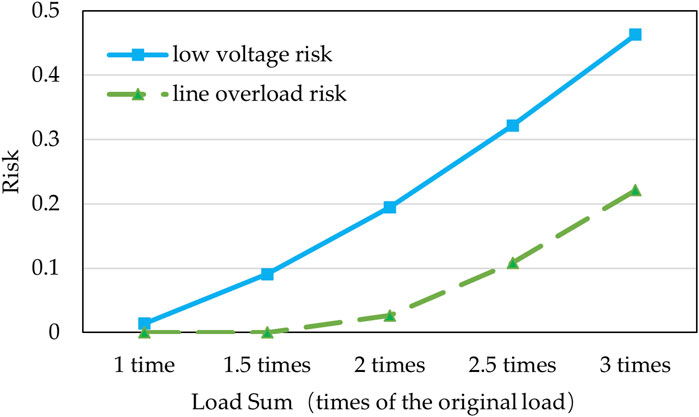
Figure 3. The impact of load amount on the risk of distribution system.
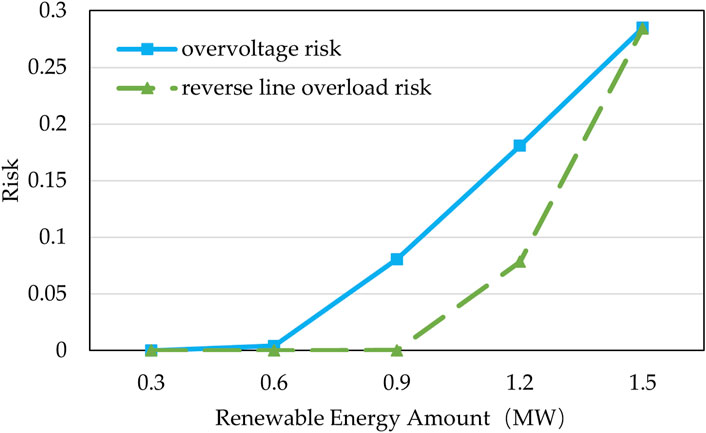
Figure 4. The impact of renewable energy amount on the risk of distribution system.
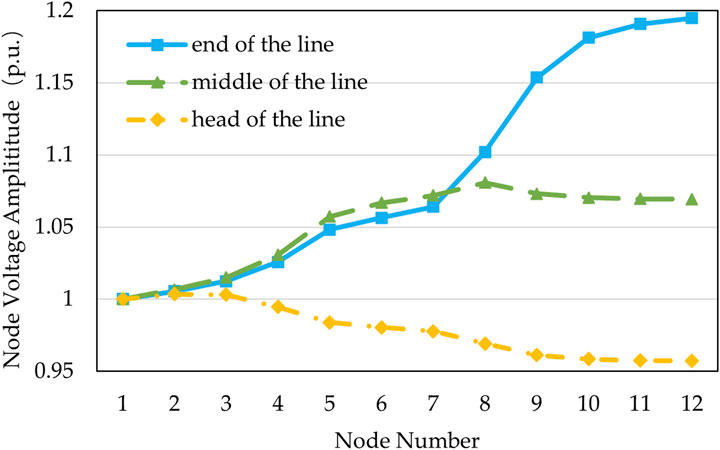
Figure 5. The impact of renewable energy location on the risk of distribution system.
4.2 Objective weight of entropy weight method
The entropy weight method is used to determine the weight of risk indices objectively based on the amount of information reflected in historical data, as a supplement to subjective weights. For different systems and when different operating modes are adopted, the risks faced by the distribution system vary, and the objective weights of the risk indices calculated by the entropy weight method also differs. This section discusses the entropy weight method from the perspective of whether renewable energy curtailment is carried out, and it can be seen from the results shown in Figure 6 that after considering the curtailment of renewable energy, the weights of the remaining four risk indices have decreased due to the addition of one risk index. However, compared to low voltage risk and overload risk, the objective weight of overvoltage risk and reverse line overload risk has decreased more significantly. This is due to the decrease of overvoltage and reverse line overload risk resulting from renewable energy curtailment. According to the Entropy Weight Method, the information contained in a risk index is positively correlated with its degree of dispersion. The wider its variation range, the more information it contains. After conducting the curtailment operations, the overvoltage risk and reverse line overload risk are reduced to the threshold limit, so the originally different severity of overvoltage and reverse line overload risks become similar, which means their fluctuation ranges are narrowed and the information contained in these two indices is reduced, thus resulting in a significant decrease in the objective weights assigned to them.
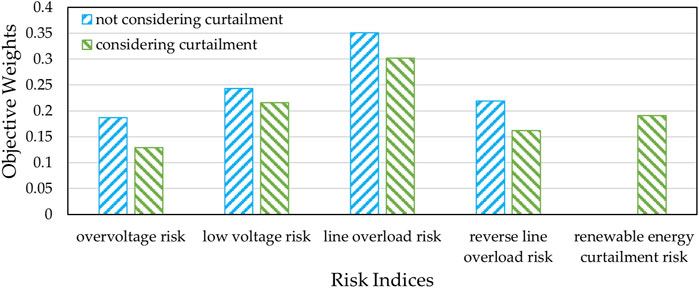
Figure 6. Comparison of the objective weight of risk indices considering and not considering curtailment of renewable energy.
4.3 Impact of curtailed renewable energy on risks
Curtailing renewable energy sources can alter the operational status of the distribution system, thereby affecting its risk level. This section discusses the effect and the results are shown in Table 5. It can be seen that after the curtailment, the overvoltage risk and reverse line overload risk caused by renewable energy have decreased. Although the renewable energy curtailment risk has significantly increased, due to the fact that it only occurs when the voltage and overload risks reach a certain level and that its value is less dispersed than the other risks, both the subjective and objective weights of renewable energy curtailment risk we obtained are relatively lower than voltage and overload risks, so the weighted total risk of the distribution system is been reduced after curtailment.

Table 5. Risks when curtailment of renewable energy is conducted and not.
4.4 Impact of state estimation on risk assessment
This paper utilizes the results of the prediction step of the Unscented Kalman Filter state estimation as the input for risk assessment, so the risk assessment is closely related to the accuracy of the state estimation. In order to demonstrate the relationship between state estimation and risk assessment in detail, this paper conducted comparative experiments by adjusting the variance of measurement noise. In order to simulate the measurement information of SCADA data containing noise, this paper randomly generates noise based on the proposed measurement noise variance, and adds it to the accurate information from power flow calculation to substitute the measurement data used in state estimation. Table 6 records the three noise variances used in this section, and demonstrates the impact of state estimation accuracy on risk assessment through the differences in numerical values of these three variances. In practical applications, noise variances need to be selected based on the characteristics of the measuring device. Due to the randomness of noise, the experimental results also have a certain degree of randomness. In order to better compare the results under different noises, this section conducted 10 experiments for each group, and took the average value for comparison between groups. According to the results recorded in Table 6, as the variance of measurement noise increases, the risk of the distribution system also increases. This is due to deteriorated accuracy of state estimation and the greater variance of the results of state estimation under larger measurement noise, which also means that the possible distribution system states fluctuate in a wider range, and that there is a threat of greater risks, ultimately leading to an increase in the value of comprehensive risk.

Table 6. Risks under different measurement noises.
5 Discussion
This paper proposes a real-time risk assessment method for distribution systems using Unscented Kalman Filter state estimation results as inputs of the risk assessment. Risk indices including low voltage, overvoltage, line overload, reverse line overload and renewable energy curtailment risk are established in this paper and summarized by subjective and objective weights, thus achieving effective perception of comprehensive risks in distribution systems. The case studies show that the risks increase exponentially with the growth of renewable energy and load demand and risk levels vary according to different locations of renewable energy. Meanwhile, case analysis shows that appropriate curtailment can reduce the overall risk of the distribution system by up to 10.5%. Furthermore, as different operating modes bring about different risks, the Entropy Weight Method proves to be effective in determining the weight of risk indices according to the specific scenario faced by the distribution system. In addition, risk assessment is affected by the accuracy of state estimation, and different measurement noises in state estimation may cause a 7% change in the risk assessment results. In this paper, there are still some deficiencies, and the following aspects need to be improved in future research. On the one hand, more risk indices should be added so that the assessment model may evaluate the operational risks more comprehensively and cater to more scenarios. For instance, risks caused by energy storage devices and photovoltaic inverters can be considered. On the other hand, the estimation effects of various existing approaches including the Cubature Kalman Filter can be compared and analyzed to improve the state estimation process.
Data availability statement
The datasets presented in this study can be found in online repositories. The names of the repository/repositories and accession number(s) can be found below: https://pan.baidu.com/s/1VO3eqQpzI-3g7g6wtOE6LA?pwd=8xmx.
Author contributions
CW: Methodology, Writing–original draft. HJ: Conceptualization, Writing–review and editing. DC: Validation, Writing–review and editing. WC: Validation, Writing–review and editing. SL: Validation, Writing–review and editing.
Funding
The author(s) declare that financial support was received for the research, authorship, and/or publication of this article. This research was funded by the Science and Technology Project of State Grid Jiangsu Electric Power Co., Ltd. under Grant J2023007.
Conflict of interest
Authors CW, HJ, DC, WC, and SL were employed by State Grid Jiangsu Electric Power Co., Ltd.
The authors declare that this study received funding from State Grid Jiangsu Electric Power Co., Ltd. The funder had the following involvement in the study: study design, decision to publish.
Publisher’s note
All claims expressed in this article are solely those of the authors and do not necessarily represent those of their affiliated organizations, or those of the publisher, the editors and the reviewers. Any product that may be evaluated in this article, or claim that may be made by its manufacturer, is not guaranteed or endorsed by the publisher.
References
Ansari, O. A., and Chung, C. Y. (2019). A hybrid framework for short-term risk assessment of wind-integrated composite power systems. IEEE Trans. Power Syst. 34, 2334–2344. doi:10.1109/TPWRS.2018.2881250
Ansari, O. A., Gong, Y., Liu, W., and Chung, C. Y. (2020). Data-driven operation risk assessment of wind-integrated power systems via mixture models and importance sampling. J. Mod. Power Syst. Clean Energy 8, 437–445. doi:10.35833/MPCE.2019.000163
Chen, C.-H. (2020). A novel multi-criteria decision-making model for building material supplier selection based on entropy-AHP weighted TOPSIS. Entropy 22, 259. doi:10.3390/e22020259
Dang, L., Wang, W., and Chen, B. (2022). Square root Unscented Kalman Filter with modified measurement for dynamic state estimation of power systems. IEEE Trans. Instrum. Meas. 71, 1–13. doi:10.1109/TIM.2022.3157005
da Silva, A. M. L., and de Castro, A. M. (2019). Risk assessment in probabilistic load flow via Monte Carlo simulation and cross-entropy method. IEEE Trans. Power Syst. 34, 1193–1202. doi:10.1109/TPWRS.2018.2869769
De Oliveira-De Jesus, P. M., Rodriguez, N. A., Celeita, D. F., and Ramos, G. A. (2021). PMU-based system state estimation for multigrounded distribution systems. IEEE Trans. Power Syst. 36, 1071–1081. doi:10.1109/TPWRS.2020.3017543
Feng, F., Zhang, P., and Zhou, Y. (2022). Authentic microgrid state estimation. IEEE Trans. Power Syst. 37, 1657–1660. doi:10.1109/TPWRS.2022.3143362
Ghadikolaee, E. T., Kazemi, A., and Shayanfar, H. A. (2020). Novel multi-objective phasor measurement unit placement for improved parallel state estimation in distribution network. Appl. Energy 279, 115814. doi:10.1016/j.apenergy.2020.115814
Liu, H., Hu, F., Su, J., Wei, X., and Qin, R. (2020). Comparisons on kalman-filter-based dynamic state estimation algorithms of power systems. IEEE Access 8, 51035–51043. doi:10.1109/ACCESS.2020.2979735
Liu, X., Liu, J., Zhao, Y., Ding, T., Liu, X., and Liu, J. (2024). A bayesian deep learning-based probabilistic risk assessment and early-warning model for power systems considering meteorological conditions. IEEE Trans. Industrial Inf. 20, 1516–1527. doi:10.1109/TII.2023.3278873
Mestav, K. R., Luengo-Rozas, J., and Tong, L. (2019). Bayesian state estimation for unobservable distribution systems via deep learning. IEEE Trans. Power Syst. 34, 4910–4920. doi:10.1109/TPWRS.2019.2919157
Saaty, T. (1990). How to make a decision - the analytic Hierarchy process. Eur. J. Oper. Res. 48, 9–26. doi:10.1016/0377-2217(90)90057-I
Swain, S., and Subudhi, B. (2019). Grid synchronization of a PV system with power quality disturbances using unscented kalman filtering. IEEE Trans. Sustain. Energy 10, 1240–1247. doi:10.1109/TSTE.2018.2864822
Wang, T., Huang, S., Gao, M., and Wang, Z. (2021). Adaptive extended kalman filter based dynamic equivalent method of PMSG wind farm cluster. IEEE Trans. Ind. Appl. 57, 2908–2917. doi:10.1109/TIA.2021.3055749
Wang, W., Tse, C. K., and Wang, S. (2020). Dynamic state estimation of power systems by $p$ -norm nonlinear kalman filter. IEEE Trans. Circuits Syst. I Regul. Pap. 67, 1715–1728. doi:10.1109/TCSI.2020.2965141
Xu, Y., Korkali, M., Mili, L., Chen, X., and Min, L. (2020). Risk assessment of rare events in probabilistic power flow via hybrid multi-surrogate method. IEEE Trans. Smart Grid 11, 1593–1603. doi:10.1109/TSG.2019.2940928
Yang, Z., Xie, K., Yu, J., Zhong, H., Zhang, N., and Xia, Q. X. (2019). A general formulation of linear power flow models: basic theory and error analysis. IEEE Trans. Power Syst. 34, 1315–1324. doi:10.1109/TPWRS.2018.2871182
Yang, Z., Zhong, H., Bose, A., Zheng, T., Xia, Q., and Kang, C. (2018). A linearized OPF model with reactive power and voltage magnitude: a pathway to improve the MW-only DC OPF. IEEE Trans. Power Syst. 33, 1734–1745. doi:10.1109/TPWRS.2017.2718551
Yildiz, R., Barut, M., and Zerdali, E. (2020). A comprehensive comparison of extended and Unscented Kalman Filters for speed-sensorless control applications of induction motors. IEEE Trans. Industrial Inf. 16, 6423–6432. doi:10.1109/TII.2020.2964876
Zhao, J., and Mili, L. (2019). A decentralized H-infinity Unscented Kalman Filter for dynamic state estimation against uncertainties. IEEE Trans. Smart Grid 10, 4870–4880. doi:10.1109/TSG.2018.2870327
Zhao, J., Netto, M., and Mili, L. (2017). A robust iterated extended kalman filter for power system dynamic state estimation. IEEE Trans. Power Syst. 32, 3205–3216. doi:10.1109/TPWRS.2016.2628344
Zhao, J., Qi, J., Huang, Z., Meliopoulos, A. P. S., Gomez-Exposito, A., Netto, M., et al. (2019). Power system dynamic state estimation: motivations, definitions, methodologies, and future work. IEEE Trans. Power Syst. 34, 3188–3198. doi:10.1109/TPWRS.2019.2894769
Keywords: risk assessment, state estimation, Unscented Kalman Filter, distribution system, renewable energy
Citation: Wu C, Jiao H, Cai D, Che W and Ling S (2024) Real-time risk assessment of distribution systems based on Unscented Kalman Filter. Front. Energy Res. 12:1488029. doi: 10.3389/fenrg.2024.1488029
Received: 29 August 2024; Accepted: 25 September 2024;
Published: 08 October 2024.
Edited by:
Lun Yang, Xi’an Jiaotong University, ChinaReviewed by:
Xian Zhang, Harbin Institute of Technology, ChinaYichen Shen, Shanghai Jiao Tong University, China
Jiayong Li, Hunan University, China
Copyright © 2024 Wu, Jiao, Cai, Che and Ling. This is an open-access article distributed under the terms of the Creative Commons Attribution License (CC BY). The use, distribution or reproduction in other forums is permitted, provided the original author(s) and the copyright owner(s) are credited and that the original publication in this journal is cited, in accordance with accepted academic practice. No use, distribution or reproduction is permitted which does not comply with these terms.
*Correspondence: Hao Jiao, MzA3OTg2MTY3QHFxLmNvbQ==