 Jieyun Zheng
 Zhanghuang Zhang
- State Grid Fujian Economic Research Institute, Fuzhou, Fujian, China
Introduction: As China continues to develop the advanced power systems, the network structure of distribution networks is becoming increasingly complex. The integration of numerous power electronic devices has caused growing severity of power quality issues in present-day distribution networks. Moreover, the complexity of the networks has resulted in a significant increase in the volume of power quality data, posing greater challenges in data processing and power quality assessment.
Methods: This paper investigates a novel method for comprehensive assessment of power quality in advanced distribution networks (ADN) grounded in complex network theory. First, the influencing factors of power quality in advanced distribution networks are analyzed, and based on this analysis, the power quality evaluation indicators for advanced distribution networks are determined. Then a node characteristic matrix of the distribution network is constructed based on complex network theory which is used to generate the significance of each node within the network. Moreover, the sequential relationship analysis method (G1) and criteria importance though intercrieria correlation (CRITIC) method are leveraged to determine the subjective and objective weights of each indicator. These weights are then combined to calculate the comprehensive weight, which is further optimized using a two-stage method to increase the rationality. Furthermore, a fuzzy comprehensive evaluation method is applied to quantitatively assess the power quality within ADN. Finally, the proposed method is validated using measurement data from a specific ADN.
Results and discussion: The findings demonstrate the rationality and effectiveness of the proposed method, providing valuable insights for optimizing power quality of advanced distribution systems.
1 Introduction
In 2021, the Ninth Meeting of the Central Committee for Financial and Economic Affairs provided clarity on the implementation of the renewable energy substitution initiative. It also deepened the reform of the power system and built an advanced power system centered around renewable energy sources. The overarching aim was to achieve the dual carbon goals. With the development of the new system, more and more distributed resources will be integrated into the new distribution network. The proliferation of distributed new energy sources, such as distributed photovoltaics and decentralized wind power, within the ADN will serve to augment the generation capacity and output of new energy, which will bolster the preeminent role of new energy in the new power system. However, the growing integration of distributed power sources, coupled with the application of nonlinear devices, has made the power quality of the network increasingly complex and acute (Vannoy et al., 2007; Wang H. et al., 2022). Moreover, with technological advancements, the increasing use of power quality-sensitive appliances raises the demand for power quality on the user side. In addition, the integration of more distributed new energy sources into the new distribution network further complicates the network structure, and the impact of complex networks on the new distribution system cannot be ignored. Accurate assessment of power quality in distribution networks is conducive to targeted improvement of power quality issues (Liu B. et al., 2018; Liu K. et al., 2020). Therefore, the evaluation of power quality in the ADN has high research value.
In the context of energy conservation and emission reduction, the ADN serves as a platform for accommodating large-scale distributed new energy, flexible regulation resources, and energy consumption. In order to ensure power supply quality and improve user electricity experience, it is necessary to enhance power quality. Therefore, from both technological and economic perspectives, the assessment and analysis of power quality are particularly important (Huang et al., 2023). A study detailed in reference (Dong et al., 2021) analyzed the characteristics of the new distribution system under the “dual carbon” background and the main challenges it faces. The new distribution system is characterized by diversified power supply and the large-scale application of power electronic equipment, indicating that the problem of deteriorating power supply quality is significant due to the large-scale access of power electronic equipment. In terms of the mechanism and governance of power quality issues, references (Naderi et al., 2018; Ghorbani and Mokhtari, 2015; Liang, 2016) studied the impact of distributed power generation grid connection and the access of power electronic devices on the power quality of distribution networks, and proposed corresponding detection and governance methods.
The comprehensive assessment of power quality is the process of evaluating and comparing various indicators of power quality with their standard grades after obtaining basic data by actual measurement of electrical operating parameters in power systems or using modeling and simulation (Liu Y. et al., 2020). Regarding the assessment of power quality, existing methods for weighting power quality assessment indicators can mainly be split into subjective, objective, and subjective-objective integrated weighting methods. Reference (Bajaj et al., 2022) proposes a power quality assessment method for distributed generation systems based on analytic hierarchy process (AHP). AHP is one of the subjective weighting methods, relying on expert experience for subjective weighting, which may lead to deviation of evaluation results from the actual situation due to excessive subjectivity. Moreover, when considering a large number of indicators, AHP may encounter problems of inconsistency in judgment matrices. Reference (Zhao et al., 2022) proposes the use of CRITIC weighting method to calculate indicator weights. CRITIC weighting approach takes into account the comprehensively correlation and differences among indicators, making it an objective weighting method. Objective weighting methods require a sufficient amount of sample data, and the resulting indicator weights are highly objective. However, CRITIC method may not adequately reflect the decision-maker’s preference for different indicators during the evaluation. References (Zaninelli et al., 2013; Zhang et al., 2021) propose a power quality assessment method based on data envelopment analysis, which can objectively evaluate the power quality of distribution networks. However, the accuracy of the evaluation results of this method is generally lower when objective data is scarce. References (Jia et al., 2000; Cheng et al., 2020) respectively adopt fuzzy pattern recognition methods, set pair analysis, and variable fuzzy set methods for power quality assessment. These methods are of significant value for power quality evaluation. However, the power quality indicators used in the above evaluation methods are not optimized based on the characteristics of ADN, there may be issues such as high computational complexity and discrepancies between the evaluation results and the actual situation of the distribution network when applied to power quality evaluation in the distribution network. Reference (Li et al., 2020) adopts a subjective-objective integrated weighting method based on an improved AHP and the coefficient of variation method for power quality assessment. The improved AHP and coefficient of variation method are used to determine the subjective and objective weights of each power quality indicator, respectively. Subsequently, the least squares method is employed to obtain the comprehensive weight values of each indicator. All the evaluation methods mentioned above determine the weights of indicators through a single weighting method, which lacks consideration for the preference orientation of each evaluation scheme. Even in the integrated weighting method, there may be unreasonable discrepancies between subjective and objective weights, leading to unreasonable final weights obtained through integrated weighting.
In response to the shortcomings of aforementioned methods and taking into account the network structure of ADN, this paper firstly conducts an importance assessment of nodes in ADN based on the complex network theory, and proposes incorporating node importance into the comprehensive evaluation of power quality indicators. Subsequently, this paper designs a novel method for power quality assessment in the distribution network by employing the G1 method and the CRITIC method, along with a two-stage approach. The G1 method addresses the drawbacks of AHP, while the two-stage approach, which is based on optimization theory, initially determines the weights of indicators. After considering decision-makers’ subjective preferences and differences among evaluation schemes, in the second stage, it utilizes an optimization model to adjust the original indicator weights based on the initial weights. This enables a more comprehensive consideration of subjective and objective weighting methods, thereby avoiding instances of “unfair weighting” (Jing and Hu, 2013). In the first stage, the G1 and CRITIC methods are employed to calculate subjective and objective weights respectively, which are then amalgamated to determine the comprehensive weights, reducing information loss during the weighting process. In the subsequent second stage, a least squares method is utilized to establish an optimization model for the indicator weights, determining the optimal weights. Finally, the effectiveness of the proposed method in assessing power quality in the new distribution network is validated through case studies using data from several power quality monitoring points.
2 The indicator framework for evaluating power quality in ADN
2.1 Power quality evaluation indicators
Power quality refers to the quality of alternating current supplied to the user side of the power grid. In general terms, power quality refers to the provision of high-quality power (Li et al., 2019). Ideally, electrical power is a perfectly symmetrical sine wave with a phase difference of 120°. However, in actual systems, deviations in waveform, frequency, and amplitude occur due to the growth of nonlinear loads such as air conditioning, the application of power electronic devices, issues such as electricity theft, etc., These deviations lead to deterioration in power quality, which in turn affects the safety of power supply and utilization.
The power quality standard is a fundamental set of criteria for electrical power established from the perspectives of the safe operation of the power grid and normal user utilization. Based on nationally issued power quality indicators combined with indicators proposed during the application process, there are dozens of power quality assessment indicators. Among them, temporary overvoltage and transient overvoltage are categorized as event-based power quality phenomena and are contingent in nature, making them difficult to measure in practical engineering. The commonly utilized power quality assessment indicators, as depicted in Figure 1, are organized across three principal dimensions: voltage, frequency, and waveform.
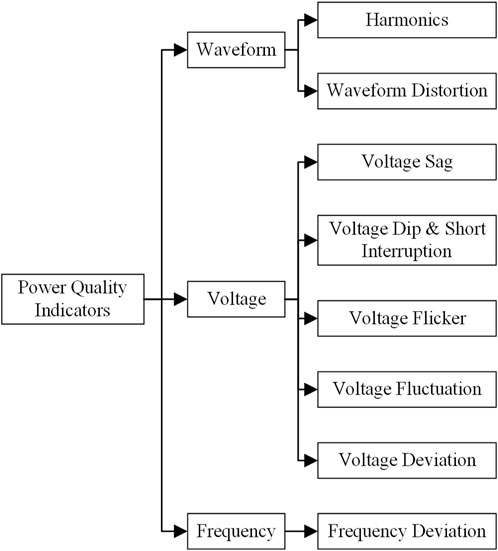
Figure 1. General power quality assessment indicator system.
In addition, other commonly used power quality indicators include supply reliability, service indicators, user satisfaction, and non-national standard indicators. The operating environment, constituent devices, and existing issues vary among different systems, resulting in differences in the importance of power quality indicators. Therefore, when evaluating the power quality of different systems, power quality evaluation indicators should be selected based on their characteristics, which can make the evaluation results more closely aligned with the actual situation.
2.2 Analysis of factors affecting power quality in advanced distribution systems
Distribution network is an electricity grid that distributes electric power from transmission networks or power plants to various types of users through distribution facilities. In the context of the construction of a advanced power system, compared to traditional distribution networks, advanced distribution systems allow for the integration of distributed energy resources. The application of various communication and power electronics technologies enables active distribution networks to effectively manage various energy sources, efficiently incorporate clean energy, and achieve low-carbon operation. However, the increasing integration of distributed energy resources and power electronic devices can have a certain impact on the power quality of active distribution networks. The main influences include the following aspects:
• The fluctuating, stochastic, and intermittent characteristics of distributed energy sources such as wind power and photovoltaics can cause power imbalances between sources and loads in active distribution networks. During the process of connecting and disconnecting distributed energy sources from active distribution networks, surplus or deficient capacity may lead to voltage fluctuations, voltage sag, and other issues (Liang et al., 2003).
• Distributed energy sources typically connect to the distribution grid through power electronic devices, which inject a large amount of harmonic currents into the distribution grid. Moreover, when external environmental factors change significantly, such as fluctuations in photovoltaic generation, it can also lead to a sharp increase in the harmonic content injected into the grid (Hu et al., 2015).
• Nonlinear loads such as transformers, generators, and air conditioners, due to their nonlinear, impulsive, and unbalanced electrical characteristics, cause voltage distortion or voltage fluctuations and flicker in the power grid (Luo et al., 2016; Hadi et al., 2023). Additionally, they contribute to harmonic and three-phase imbalance issues. Furthermore, the reactive power imbalance caused by nonlinear loads can also lead to voltage deviations and other problems (Li et al., 2023).
• The phenomenon of electricity theft in certain areas can lead to voltage dips and short interruptions in the distribution network.
• The complex topology of the advanced distribution system implies that fluctuations in power quality at one node may cause issues at several associated nodes. Therefore, nodes with higher importance should receive greater attention regarding their power quality issues.
2.3 Power quality evaluation indicators for advanced distribution system
Considering the factors affecting power quality in the advanced distribution system, the selected power quality evaluation indicators are as follows:
1) Node Importance: For different complex network models, studying the characteristics of complex network model properties using newly defined or existing complex network topology attributes is one of the hotspots in network science research. In power networks, considering directed flow with the flow of power, the power network can be considered as a directed network. For directed networks, node modeling can be achieved by calculating the node degree parameters, and then node importance can be obtained through certain algorithms. Nodes with higher importance are the ones that need to be emphasized in power quality management.
2) Voltage deviation: the main cause of voltage deviation is the imbalance of reactive power in the system. For example, appliances like air conditioners consume a large amount of reactive power, resulting in an imbalance between active and reactive power, which in turn leads to a decrease in grid voltage and voltage deviation. Excessive voltage deviation can pose a threat to the stable operation of the power system, and electrical equipment may also be damaged due to overvoltage.
3) Voltage fluctuation: the integration of a high proportion of distributed energy sources such as wind power and photovoltaics into advanced distribution networks often exhibits significant randomness, variability, and intermittency. Large-scale integration may lead to voltage fluctuations in the active distribution network, resulting in voltage flicker phenomena. Voltage fluctuations can accelerate the aging of equipment insulation, shorten equipment lifespan, increase grid losses, and undermine the safety of grid operation.
4) Voltage sag: voltage sag is a short-term disturbance phenomenon that occurs in advanced distribution networks, primarily due to sudden large currents. Line and bus short-circuit faults, no-load excitation of large transformers, and large load switching can all lead to this issue. Additionally, voltage sag can be caused by switching issues in certain areas.
5) Three-phase voltage imbalance: nonlinear loads in the power system inject a large amount of harmonic currents into the active distribution network, resulting in three-phase imbalance issues. Three-phase imbalance increases line and distribution transformer losses, leading to severe transformer heating. For users, three-phase imbalance issues can easily cause electrical equipment connected to the phase with high voltage to burn out, while electrical equipment connected to the phase with low voltage may not be useable, significantly affecting the safe use of electrical equipment. Therefore, considering three-phase imbalance issues is essential.
6) Harmonics: with the informatization and intelligence of active distribution networks, the operation of active distribution networks requires the participation of power electronic devices. The integration of nonlinear devices such as power electronic devices can lead to significant harmonic issues. Harmonics can result in increased transmission line losses, overheating of electrical equipment, increased additional losses, and reduced efficiency and durability of equipment.
7) Frequency deviation: the frequency of the power system remains constant only when the total active power output of all generators equals the total active load. For advanced distribution systems, the proportion of renewable energy on the power source side is high, and the output is fluctuating. Meanwhile, the load varies in real-time, resulting in an imbalance in the total system power and causing frequency fluctuations. Excessive frequency fluctuations can threaten the safety of user appliances, cause new energy sources such as wind power to operate abnormally or even disconnect from the grid, thereby leading to other cascade failures in the advanced distribution network.
Due to the rare occurrence of issues such as waveform distortion in advanced distribution networks, they are not considered in the power quality assessment process for advanced distribution networks. Therefore, the power quality assessment indicators adopted in this paper are voltage deviation, voltage fluctuation, voltage sag, three-phase imbalance, harmonics, frequency deviation, and node importance.
2.4 Framework of power quality assessment for ADN
This article first proposes a calculation method for complex network parameters and node importance parameters, and proposes to combine node importance parameters with power quality indicators as the power quality evaluation index matrix. Subsequently, the comprehensive assessment method of power quality was introduced: firstly, the power quality data was standardized, and the subjective and objective weights were calculated using G1 method and CRITIC method respectively. Then, the combined weighting method was used to obtain the comprehensive weight, and the final weight was optimized using a two-stage method with the comprehensive weight as the initial weight. The overall framework of this paper is depicted in Figure 2.
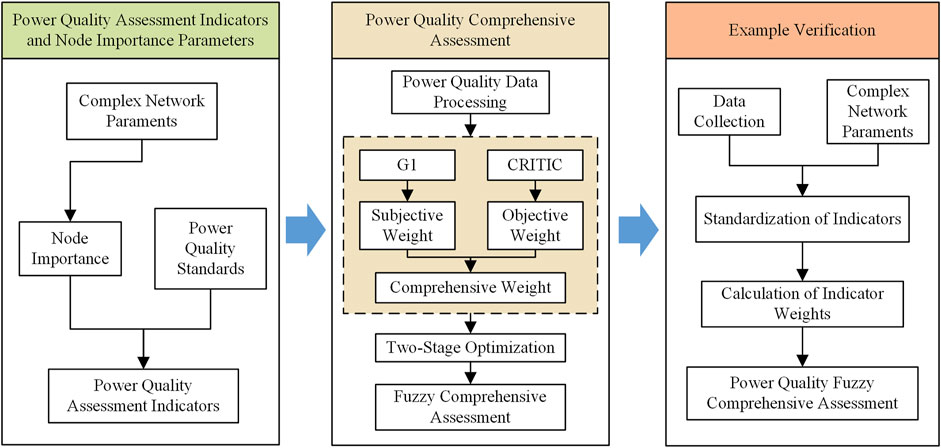
Figure 2. The schematic diagram of two-stage comprehensive assessment framework for power quality in ADN based on complex network theory.
3 Evaluation of node importance in power networks based on complex network theory
In the power network, nodes mainly consist of power plants, substations, and converter stations, among other facilities, while the lines between two nodes represent the power lines connecting them. For a given power network model, the complex network characteristics of the power network can be analyzed based on complex network theory, and a matrix describing the characteristic indicators of each node in the power network can be established. The CRITIC weighting method is used to calculate the comprehensive decision values of the importance of each node in the power network, which are then involved in the process of comprehensive assessment of power quality.
3.1 Calculation of power network node parameters based on complex network theory
Complex networks are a perspective and method for studying complex systems. Therefore, analyzing the properties, functions, and relationships of nodes in a power network through node degree centrality, betweenness centrality, and eigenvector centrality reflects the characteristics of various nodes in the system. The specific calculation methods are as follows (Liu W. et al., 2018):
1) Degree Centrality (Degree): The degree of a node in a power network is denoted as
2) Betweenness Centrality: To accurately characterize the influence and utilization of nodes in the network, the calculation method for node betweenness centrality is as Equation 2:
where
3) Eigenvector Centrality: The importance of nodes in a power network depends not only on their own degrees but also on the importance of their neighboring nodes. In a power grid, the more edges that lead to a node, the higher its importance. Therefore, this node will pass on higher importance to its neighboring nodes connected by directed edges. The eigenvector centrality in a directed network can be calculated using the PageRank algorithm, and its calculation formula is shown in Equation 3:
where
According to the above formula, for any node in a power grid with a known topology, its characteristic matrix can be constructed. The set of samples
where
This node characteristic indicator matrix will serve as the evaluation parameter for the importance of power network nodes and will be involved in the calculation of certain assessment indicators (Wang Z. et al., 2022).
3.2 Calculation of node importance in power networks
The node indicator matrix
1) Data Standardization: For a power network with m nodes in its network topology, node parameter calculations are performed, resulting in the node indicator matrix
where
2) Indicator Coefficient of Variation: The coefficient of variation quantitatively displays contrast strength of indicators. The procedure to compute the coefficient of variation
where
3) Conflict Measurement of Indicators: Based on the standardized matrix
where
4) Information Quantity Calculation: employ Equation 12 to evaluate the information quantity
5) Objective Weighting of Feature Indicators: Standardize the information quantity to derive the weight
According to the above calculations, the set of node importance indicator weights is denoted as
Where
4 Method for comprehensive weight calculation of power quality indicators in advanced distribution networks based on two-stage approach
The current common method for assigning weights to power quality data indicators is the subjective-objective integrated weighting method. Building upon this, the paper adopts the two-stage approach for assigning weights to power quality indicators. This chapter will commence by utilizing the G1 method and CRITIC method to arrive at the subjective, objective, along with integrated weights. Subsequently, the principle of the two-stage weighting method will be introduced.
4.1 First-stage indicator weighting
4.1.1 Subjective weights calculation based on G1 method
The commonly used method for subjective weighting is AHP, but this method is prone to issues with judgment matrices not meeting consistency requirements. Therefore, this paper adopts an improved AHP method—the G1 method—to circumvent the shortcomings of the AHP. The G1 method relies on expert subjective experience to determine the weight of each indicator based on its importance. Experts can rank and quantify the importance of indicators based on the characteristics and knowledge of active distribution networks. The detailed steps for computing subjective weights using the G1 method are as follows:
1) Determining the sequence relationship of evaluation indicators: The evaluation set
2) Determining the relative importance ratio between evaluation indicators as shown in Equation 15: Rational judgment ratios
where
3) Calculating the subjective weights of evaluation indicators: Based on the determined
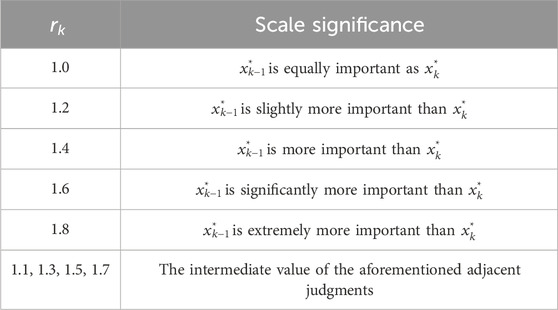
Table 1. The relative importance ratio
The weight of the (k-1)-th indicator is shown in Equation 17:
4.1.2 Objective weight calculation based on CRITIC method
The procedure for determining objective weights using CRITIC method is detailed in Section 2.2.
4.1.3 Integrated weight calculation
To mitigate the potential over-reliance on expert opinions stemming from single subjective weighting approach, as well as the excessive focus on quantitative analysis of sample data and neglect of subjective qualitative analysis, this paper adopts a combined weighting method. This integrated method leverages both subjective weighting (G1) and objective weighting (CRITIC) to compute the comprehensive weight
where
4.2 Two-stage weighting
The two-stage optimization method can more effectively handle the relationship between multidimensional data and indicators through the optimization calculation process, thereby improving the accuracy and reliability of overall evaluation. By obtaining the expected weight value of this scheme based on the given initial weight, and then optimizing the calculation with the goal of minimizing the deviation, it can avoid the situation where the subjective and objective deviation values of certain indicators are too large during the comprehensive weighting process, resulting in unreasonable weighting.
In the first stage, corresponding sets of indicator weights are obtained through subjective weighting, objective weighting, and comprehensive weighting methods. Referring to the two-stage optimization method in reference (Jing and Hu, 2013), the weights obtained from any weighting method as initial weights
The comprehensive decision value of the evaluation object
According to the purpose of the two-stage method, assuming that there exists a weight
An optimization model for indicator weights is established using the least squares method as Equation 22:
The final solution obtained is
5 Quantitative evaluation and fuzzy comprehensive judgment of power quality data in advanced distribution networks
5.1 Quantification of power quality evaluation indicators
Commencing a fuzzy comprehensive judgment necessitates, as the primary step, specifying the factor set
This paper defines five distinct levels of power quality, thereby establishing a five-level fuzzy judgment set
Quantitative grading results of the quality of electrical energy in the new distribution network are obtained through the fuzzy judgment set of evaluation indicators, as shown in Table 2.
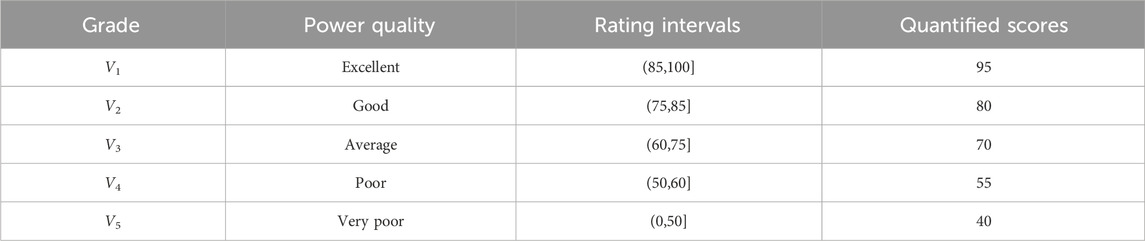
Table 2. Quantitative grading of electrical energy quality evaluation results.
The evaluation set
5.2 Selection of membership functions
The membership of data in the judgment indicator matrix corresponding to different evaluation comments can be calculated using membership functions. This paper adopts the Gauss-type membership function
where
Substituting parameters
where
5.3 Fuzzy comprehensive evaluation of power quality in ADN
The paper employs
where
Finally, the quantified evaluation result is calculated using the method shown in Equation 27:
Based on the computed power quality evaluation results and the corresponding quantified grading intervals for power quality, the evaluation comments for the power quality of the advanced distribution network are obtained.
6 Case study
This paper calculates the distribution network system’s topology parameters and its power quality parameters as shown in Figure 3.
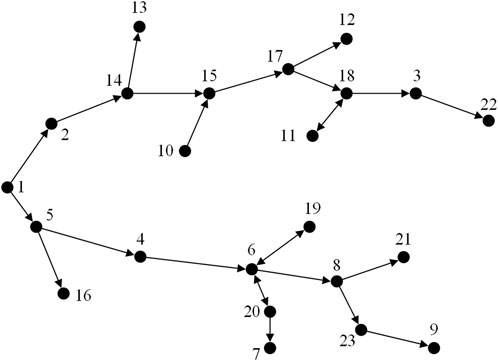
Figure 3. Distribution network topology diagram.
6.1 Calculation of comprehensive decision value for complex network node importance
The centrality metrics, including degree centrality, betweenness centrality, and eigenvector centrality, for each node calculated using the method described in Chapter 2 of this paper are presented in Table 3. The comparison of feature indicator values for each node is illustrated in Figure 4.
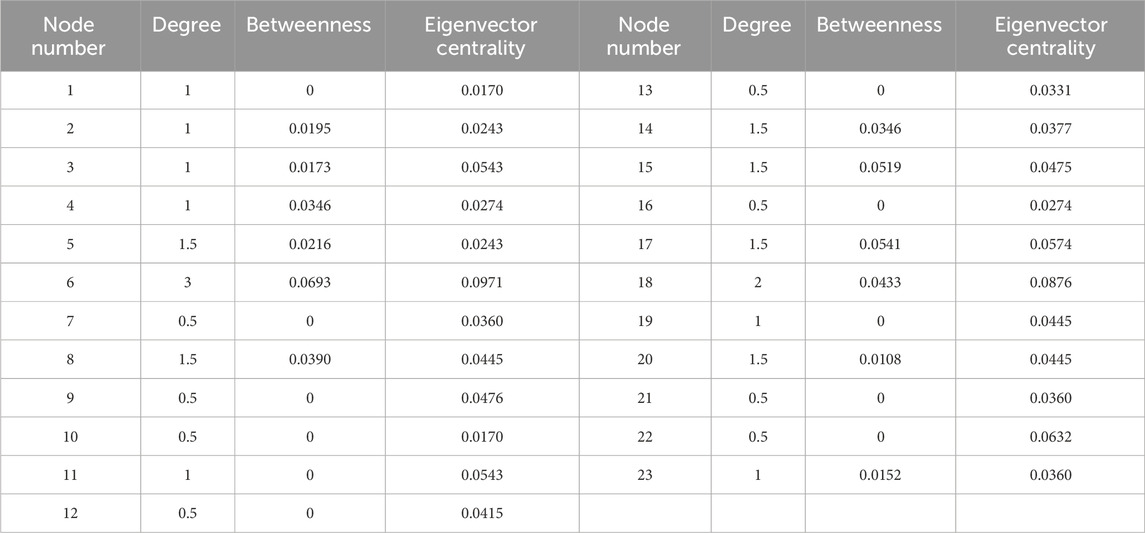
Table 3. Indicators of each node.
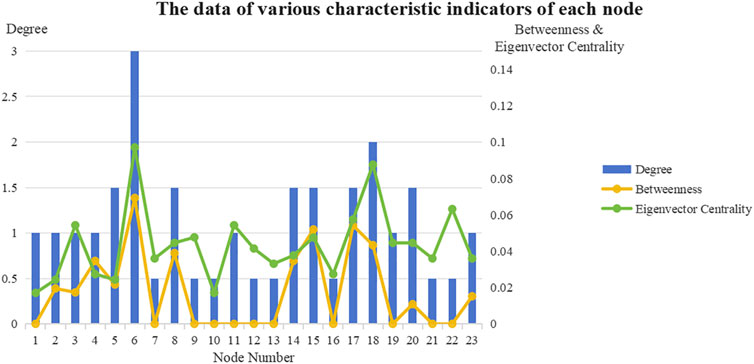
Figure 4. The data of various characteristic indicators of each node.
The node characteristic indicator matrix
The calculated comprehensive decision values of each node’s importance are shown in Figure 5.
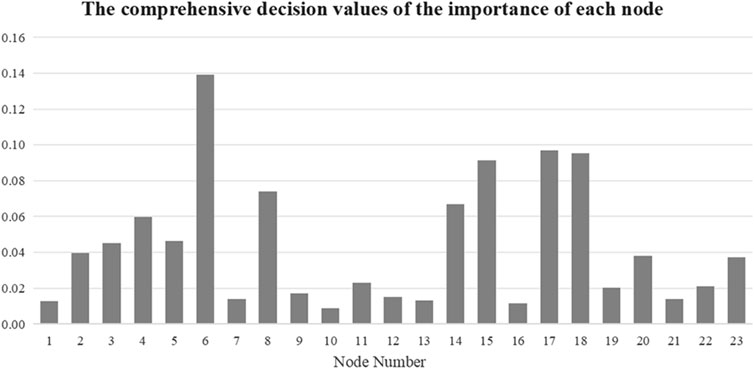
Figure 5. The comprehensive decision values of the importance of each node.
From Figure 5, it can be seen that nodes such as node 6, 8, and 17, which are centrally located in the distribution system, have higher comprehensive decision values for node importance. The electrical quality of these nodes has a significant impact on the electrical quality of nodes directly or indirectly connected to them, hence their higher importance comprehensive decision values.
6.2 Electrical quality data processing and indicators weight calculation
Combining the comprehensive decision values of node importance obtained in Section 5.1 with the measured electrical quality data, Table 4 displays the power quality data matrix for each individual node.
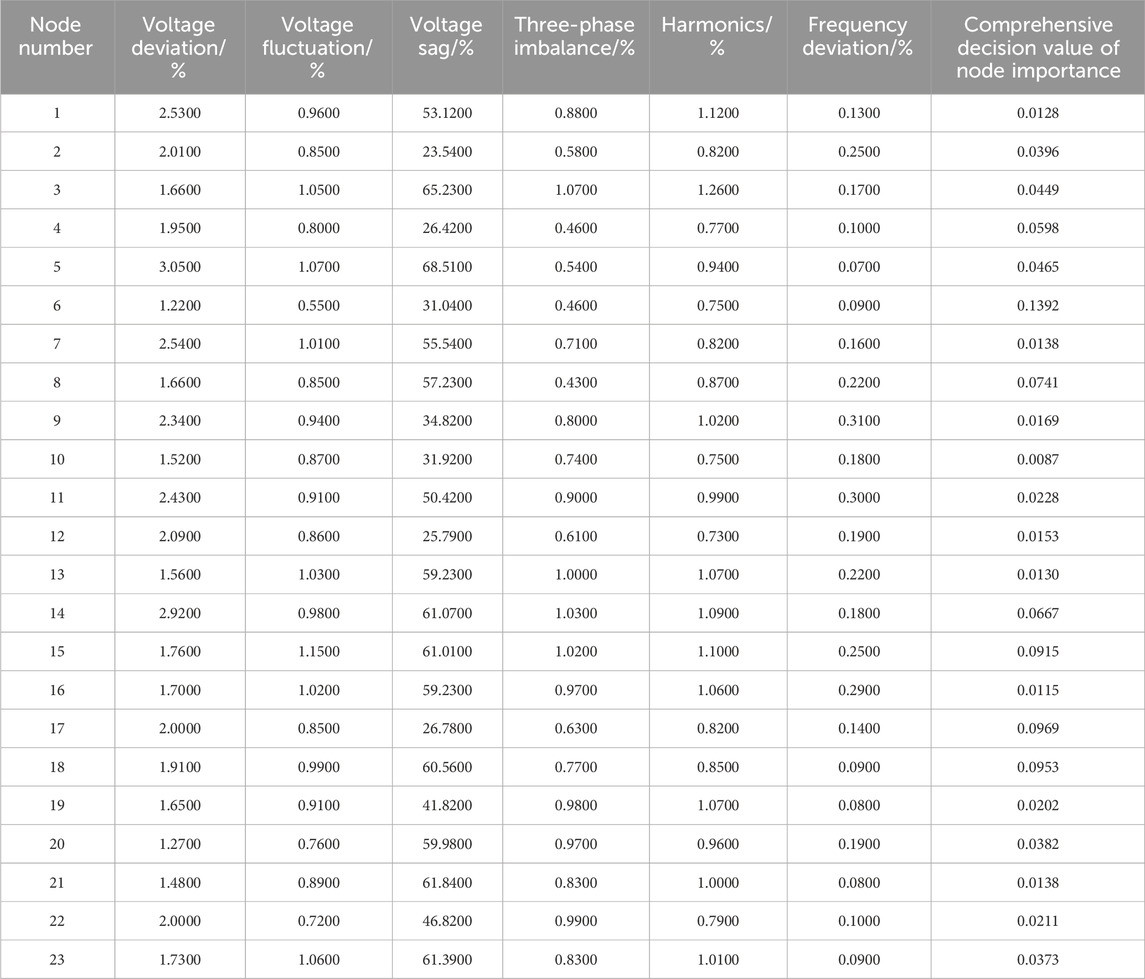
Table 4. The matrix of power quality data.
According to opinions of experts, the evaluation indicators for the electric power quality of the new distribution network are ranked in descending order of importance as follows:
Voltage deviation > Harmonics > Voltage fluctuation > Three-phase imbalance > Voltage sag > Frequency deviation = Node importance.
The ratio of importance levels is:
The subjective weight, objective weight, and comprehensive weight values obtained using the method described in this paper are as follows:
The final weight obtained after optimization through the two-stage algorithm starting with the comprehensive weight
The data from various monitoring points in Figure 3 are subjected to fuzzy comprehensive assessment, resulting in judgment matrices for each monitoring point. Using the weighted average operator for overall evaluation, the fuzzy assessment scores for each monitoring point are calculated using Equation 27.
The power quality assessment values considering and not considering the node importance are shown in Figure 6:
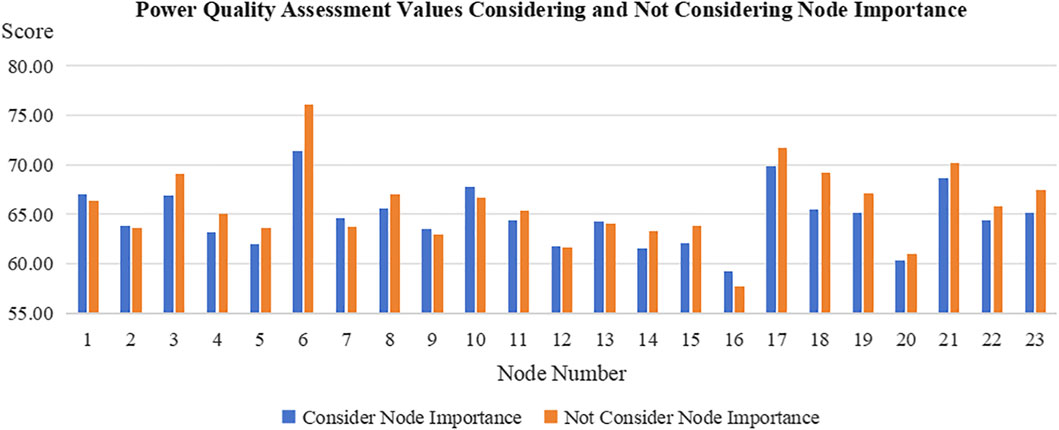
Figure 6. Power quality evaluation values considering and not considering the node importance.
6.3 Analysis of results
Based on the comparison of scores shown in Figure 6, for nodes with high importance, such as nodes 6, 8, 15, and 18, the scores after considering node importance are lower than those without considering importance. However, for nodes with lower importance, such as nodes 7, 10, and 13, there is no significant decrease or increase in scores before and after considering importance. The evaluation results obtained using different methods are compared based on the score rating, as shown in Table 5.
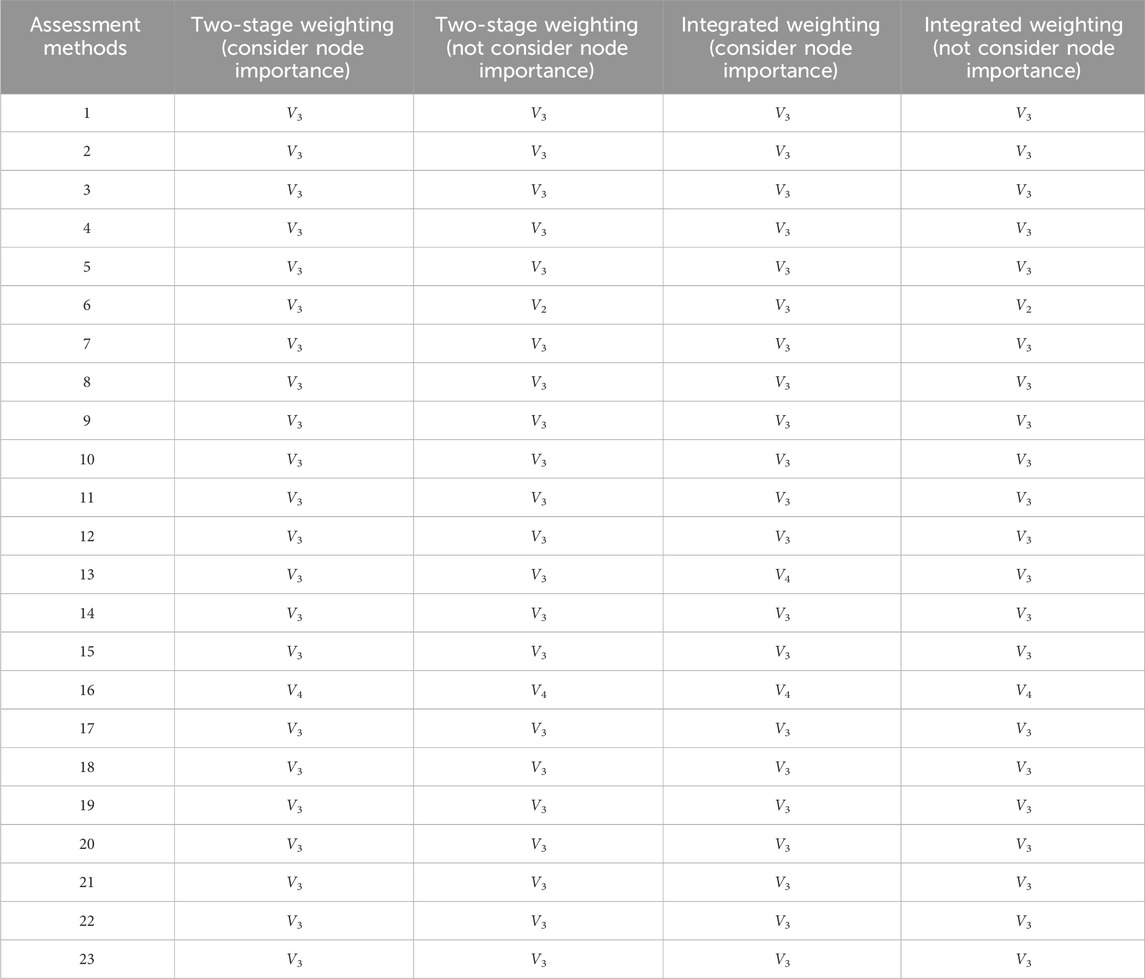
Table 5. Comparison of different methods.
As evident from Table 5, the results of the two-stage power quality assessment method, which accounts for node importance, align generally with the findings of other evaluation approaches, thereby validating the adaptability of this technique.
In the evaluations using both the two-stage weighting method considering node importance and the subjective-objective comprehensive weighting method, for Node 13, the weighting values for voltage fluctuation by both subjective and objective weights are close, leading to an overflow of the comprehensive weight for voltage fluctuation when only one comprehensive calculation is performed. However, after optimizing the weights in the two-stage method, the weights return to a reasonable range, aligning better with the principle of balancing subjective and objective weights and resulting in a more reasonable score. In the evaluations using both the two-stage weighting method considering node importance and the subjective-objective comprehensive weighting method, the rating for Node 6 is consistent, whereas the ratings for Node 6 in the two methods that do not consider node importance tend to increase due to the lack of constraint from the node importance indicator.
7 Conclusion
This article proposes a two-stage comprehensive evaluation method for power quality considering the ADN network structure. Firstly, based on the theory of complex networks, the degree centrality, betweenness centrality, and eigenvector centrality of each node were comprehensively analyzed to quantify the importance of each node in the network. Subsequently, the decision values of node importance were added to the comprehensive evaluation process of power quality, and a two-stage weighting method was introduced to make the final weight values more reasonable.
The evaluation results of the case study validate the effectiveness of the proposed method. Through complex network theory, the method can distinguish the importance levels of different nodes in complex distribution network, and the final weights are made more reasonable through a two-stage weighting method. It imposes stricter evaluation on important nodes, facilitating effective assessment and targeted optimization of power quality in complex network environments for operators.
Data availability statement
The original contributions presented in the study are included in the article/supplementary material, further inquiries can be directed to the corresponding author.
Author contributions
JZ: Writing–original draft, Writing–review and editing. RC: Writing–original draft, Writing–review and editing, Methodology, Validation. ZZ: Writing–original draft, Writing–review and editing, Conceptualization. XW: Writing–original draft. JX: Supervision, Writing–review and editing.
Funding
The author(s) declare that financial support was received for the research, authorship, and/or publication of this article. This research was funded by the Key Science and Technology Project of State Grid Fujian Municipal Electric Power Company, grant number is 52130N23000Z.
Conflict of interest
Authors ZJ, CR, ZZ, WX, and XJ were employed by State Grid Fujian Economic Research Institute.
The authors declare that this study received funding from the Key Science and Technology Project of State Grid Fujian Municipal Electric Power Company. The funder had the following involvement in the study: Financial Support and Data Provision.
Publisher’s note
All claims expressed in this article are solely those of the authors and do not necessarily represent those of their affiliated organizations, or those of the publisher, the editors and the reviewers. Any product that may be evaluated in this article, or claim that may be made by its manufacturer, is not guaranteed or endorsed by the publisher.
References
Bajaj, M., Singh, A. K., Alowaidi, M., Sharma, N. K., Sharma, S. K., and Mishra, S. (2022). Power quality assessment of distorted distribution networks incorporating renewable distributed generation systems based on the analytic hierarchy process. IEEE Access 8, 145713–145737. doi:10.1109/access.2020.3014288
Cheng, Z., Liu, D., Wu, J., and Chen, L. (2020). Comprehensive evaluation of power quality based on set pair analysis and variable fuzzy sets. Power Syst. Technol. 44 (05), 1950–1956. (in Chinese). doi:10.13335/j.1000-3673.pst.2019.0697
Dong, X., Hua, Z., Shang, L., Wang, B., Chen, L., Zhang, Q., et al. (2021). Morphological characteristics and technology prospect of new distribution system. High. Volt. Eng. 47 (09), 3021–3035. (in Chinese). doi:10.13336/j.1003-6520.hve.20211103
Ghorbani, M. J., and Mokhtari, H. (2015). Impact of harmonics on power quality and losses in power distribution systems. Int. J. Electr. Comput. Eng. 5 (1), 166–174. doi:10.11591/ijece.v5i1.pp166-174
Hadi, Al., Aly, H. H., and Little, T. (2023). Harmonics forecasting of wind and solar hybrid model based on deep machine learning. IEEE Access 11, 100438–100457. doi:10.1109/access.2023.3314742
Hu, H., Shi, Q., He, Z., He, J., and Gao, S. (2015). Potential harmonic resonance impacts of PV inverter filters on distribution systems. IEEE Trans. Sustain. Energy 6 (1), 151–161. doi:10.1109/TSTE.2014.2352931
Huang, H., Ni, D., and Liu, X. (2023). Comprehensive evaluation of power quality based on graph convolutional network. Electron. Sci. Technol. 1, 6. (in Chinese). doi:10.16180/j.cnki.issn1007-7820.2024.09.007
Jia, Q., Song, J., Lan, H., Yang, Y., and Yin, C. (2000). Quality of electricity commodity and its fuzzy evaluation. Power Syst. Technol. 06, 46–49. (in Chinese). doi:10.13335/j.1000-3673.pst.2000.06.011
Jing, Z., and Hu, R. (2013). Power quality assessment and sensitivity analysis based on two-stage method. Electr. Power Autom. Equip. 33 (07), 57–62. (in Chinese).
Li, H., Lv, C., and Zhang, Y. (2019). “Research on new characteristics of power quality in distribution network,” in 2019 IEEE International Conference on Power, Intelligent Computing and Systems(ICPICS)(Shenyang, China:IEEE), Shenyang, China, 12-14 July 2019, 6–10. doi:10.1109/icpics47731.2019.8942538
Li, Q., Dai, S., Ding, T., Chen, H., Wang, Y., and Zeng, L. (2020). Comprehensive evaluation of power quality energy consumption in low voltage distribution network based on subjective and objective combination weighting method. Electr. Meas. and Instrum. 57 (12), 52–59. (in Chinese). doi:10.19753/j.issn1001-1390.2020.12.009
Li, Y., Wei, H., Sun, X., and Wang, Y. (2023). Mathematical model of chaotic decoupling control for static reactive compensator in nonlinear load distribution network. Automation and Instrum. 38 (8), 11–15. (in Chinese). doi:10.19557/j.cnki.1001-9944.2023.08.003
Liang, X. (2016). Emerging power quality challenges due to integration of renewable energy sources. IEEE Trans. Industry Appl. 53 (2), 855–866. doi:10.1109/tia.2016.2626253
Liang, Y., Hu, Z., and Chen, Y. (2003). A survey of distributed generation and its application in power system. Power Syst. Technol. 27 (12), 71–75. (in Chinese).
Liu, B., Li, Z., Chen, X., Huang, Y., and Liu, X. (2018). Recognition and vulnerability analysis of Key nodes in power grid based on complex network centrality. IEEE Trans. Circuits Syst. II Express Briefs 65 (3), 346–350. doi:10.1109/tcsii.2017.2705482
Liu, K., Sheng, W., Qin, M., Yin, Z., and Lv, C. (2020). Power quality analysis for active distribution network considering multiple disturbance sources. Power Syst. Technol. 44 (6), 2303–2309. (in Chinese). doi:10.13335/j.1000-3673.pst.2019.1580
Liu, W., Tarasiuk, T., Gorniak, M., Mehdi, S., Carlos, V. J., Su, C. L., et al. (2018). Power quality assessment in shipboard microgrids under unbalanced and harmonic AC bus voltage. IEEE Trans. Industry Appl. 55 (1), 765–775. doi:10.1109/tia.2018.2867330
Liu, Y., Feng, D., Lin, C., and Zhang, Y. (2020). Current status and development trend of power quality comprehensive assessment. Power Syst. Prot. Control 48 (4), 167–176. (in Chinese). doi:10.19783/j.cnki.pspc.190514
Luo, A., Xu, Q., Ma, F., and Chen, Y. (2016). Overview of power quality analysis and control technology for the smart grid. J. Mod. Power Syst. Clean Energy 4 (1), 1–9. doi:10.1007/s40565-016-0185-8
Naderi, Y., Hosseini, S. H., Zadeh, S. G., Mohammadi-Ivatloo, B., Vasquez, J. C., and Guerrero, J. M. (2018). An overview of power quality enhancement techniques applied to distributed generation in electrical distribution networks. Renew. Sustain. Energy Rev. 93, 201–214. doi:10.1016/j.rser.2018.05.013
Vannoy, D. B., McGranaghan, M. F., Halpin, S. M., Moncrief, W. A., and Sabin, D. D. (2007). Roadmap for power quality standards development. IEEE Trans. Industry Appl. 43 (2), 412–421. doi:10.1109/tia.2006.890017
Wang, H., Shen, X., and Liu, J. (2022). Planning of new distribution network considering green power certificate trading and carbon emissions trading. Energies 15 (7), 2435. doi:10.3390/en15072435
Wang, Z., Miao, S., Guo, S., and Ying, H. (2022). Construction of power communication coupling network model and node importance evaluation method based on complex system theory. High. Volt. Eng. 48 (01), 84–94. (in Chinese). doi:10.13336/j.1003-6520.hve.20211154
Zaninelli, D., Roscia, M., Golovanov, N., and Lazaroiu, G. C. (2013). Power quality assessment in small scale renewable energy sources supplying distribution systems. Energies 6 (2), 634–645. doi:10.3390/en6020634
Zhang, H., Li, Y., and Wu, X. (2021). “Comprehensive evaluation and improvement of power quality in distribution networks based on DEA model and membership function,” in 2021 International Conference on Power System Technology (POWERCON), Haikou, China, 08-09 December 2021, 1775–1780. doi:10.1109/powercon53785.2021.9697888
Keywords: advanced distribution network, complex network, power quality, comprehensive weight, two-stage method, fuzzy comprehensive assessment
Citation: Zheng J, Chen R, Zhang Z, Wei X and Xue J (2024) Analysis and comprehensive assessment method of power quality in advanced distribution networks based on complex network theory. Front. Energy Res. 12:1501006. doi: 10.3389/fenrg.2024.1501006
Received: 24 September 2024; Accepted: 21 November 2024;
Published: 05 December 2024.
Edited by:
Chao Deng, Nanjing University of Posts and Telecommunications, ChinaReviewed by:
Rui Zhang, Northeast Electric Power University, ChinaYi Tang, Southeast University, China
Yingjun Wu, Hohai University, China
Copyright © 2024 Zheng, Chen, Zhang, Wei and Xue. This is an open-access article distributed under the terms of the Creative Commons Attribution License (CC BY). The use, distribution or reproduction in other forums is permitted, provided the original author(s) and the copyright owner(s) are credited and that the original publication in this journal is cited, in accordance with accepted academic practice. No use, distribution or reproduction is permitted which does not comply with these terms.
*Correspondence: Zhanghuang Zhang, YmVubnlfemhhbmcwODE1QDE2My5jb20=