 Yalong Li
 Ronghao Liu1
- 1School of Mechanical and Electrical Engineering, China University of Mining and Technology-Beijing, Beijing, China
- 2State Grid Gansu Electric Power Co., Electric Power Research Institute, Lanzhou, China
When a large number of distributed photovoltaic (PV) systems are integrated into the distribution network, power flow becomes bidirectionally fluctuating, resulting in variable line losses. In the scenario of reverse flow, the increase in line loss is particularly significant. The bidirectional reactive power regulation of photovoltaic inverters is an effective approach to reduce losses in the distribution network. However, despite the benefits of reducing losses, reactive power regulation by photovoltaic inverters also incurs additional costs. Therefore, there is a need for research into a comprehensive benefit optimization method for inverters participation in reducing reactive power losses in distribution networks. Firstly, the cost quantification models for the investment, transformation, operation, and lifespan loss of the photovoltaic inverters involved in reactive power loss reduction are established. Secondly, the benefit quantification models for loss reduction and power factor improvement are developed. Thirdly, considering various operational scenarios of both photovoltaic systems and loads, a comprehensive benefit optimization method for photovoltaic inverters participating in reactive power loss reduction in distribution networks is proposed. Finally, through example analysis, the cost and benefit are calculated and fitted in different scenarios, and the optimization calculation is carried out. Compared to the scenario where the photovoltaic inverter operates at the maximum reactive power regulation capacity, the optimized comprehensive benefit is increased by 21.20%. The proposed method is validated to effectively enhance the comprehensive benefits of inverters participation in reactive power loss reduction.
1 Introduction
With the large-scale integration of distributed photovoltaic (PV) systems, the power flow distribution within the distribution network frequently fluctuates, leading to a significant increase in line losses. When the output of photovoltaics far exceeds the load, power is back-fed from the distribution network to the main grid, causing a significant increase in line losses. Urgent reactive power adjustment is needed to reduce these losses (Elseify et al., 2023; Kondo and Baba, 2020; Nwaigwe et al., 2019; Sivalingam et al., 2017). Currently, due to the high investment costs associated with dynamic reactive compensation devices, there are relatively few installations of Static Var Compensators (SVC) or Static Synchronous Generators (SVG) within distribution networks (Wang et al., 2021; Wong et al., 2019). The flexibility of adjusting capacitance and reactance is relatively low. Therefore, it is imperative to explore new types of reactive power sources for loss reduction. Photovoltaic inverters, with their technical advantages in bidirectional reactive power regulation, provide an effective means to achieve local reactive power balance and reduce losses in the distribution network (Kumar and Singh, 2021). However, the reactive power regulation of PV inverters will incur adjustment costs. It is urgent to comprehensively consider the loss reduction benefits and costs, and study methods for optimizing comprehensive benefits.
In the context of reactive power control in photovoltaic power plants (Samadi et al., 2012; Li et al., 2024), addresses challenges arising from the growing integration of PV systems into the grid, highlighting that existing PV models often assume these systems operate at a power factor of 1 according to current standards. This paper outlines a non-proprietary process for modeling three-phase single-stage photovoltaic systems, encompassing control scheme design, and evaluates key aspects and impacts of three distinct reactive power regulation strategies. Existing research has demonstrated the capabilities of photovoltaic inverters to control reactive power while producing active power. In terms of reactive power compensation and loss reduction technologies within distribution networks (Ibram and Gueorgiev, 2021), explores how to adjust the operational parameters of STATCOM to achieve reactive power compensation for the photovoltaic system, thereby effectively enhancing the operational stability of the photovoltaic systems and the overall power quality of the grid. Reference (Chen, 2018) focuses on improving power quality and line losses in a 35 kV distribution network using static reactive power generators and capacitors as reactive devices. Reference (Ahsan et al., 2012) discusses the optimization and stabilization of power quality, power factor, and network line losses in wind power systems utilizing SVC/SCG as reactive power sources. Reference (Wang et al., 2023; Pan et al., 2024) addresses reactive power configuration issues in photovoltaic generation systems but does not investigate the inherent reactive regulation capabilities of the PV systems themselves.
In the area of cost quantification and benefit analysis of reactive power compensation in distribution networks Meliopoulos et al. (1999); Dona and Paredes (2001), analyze the reactive support costs incurred by various energy suppliers to improve voltage stability across the network. (Ji et al., 2017; Masikana et al., 2024; Samadi et al., 2014) establish a reactive pricing model for generators based on the P-Q characteristics of doubly-fed wind turbines and synchronous motors, proposing a segmented pricing strategy for reactive power in doubly-fed turbines under fluctuating wind speeds. In summary, there is relatively little research on the cost and benefit analysis of photovoltaic inverters participating in reactive power regulation.
The main contributions and innovative points of this paper are as follows:
1. The constant and variable costs of reactive power regulation in photovoltaic inverters are quantified.
2. The economic benefits of photovoltaic inverters participating in loss reduction by Reactive Compensation are quantified in different operating scenarios, including direct and indirect benefits.
3. By considering both the adjustment costs and the benefits of loss reduction, comprehensive benefit optimization method for photovoltaic inverters participating in distribution network loss reduction by reactive compensation is proposed.
2 Economic and technical feasibility analysis of photovoltaic inverters participating in reactive power loss reduction in distribution networks
2.1 Technical feasibility
(1) Bidirectional Reactive Power Regulation Capabilities of Photovoltaic Inverters
Currently, many inverters operate under a constant power factor (CPF) mode. Taking a power factor of 0.95 as an example, the output reactive power varies between ±31.33%. When using a variable power factor control mode, during nighttime when the photovoltaic output is zero, the theoretical value of reactive power output can reach ±100%. At other times, the reactive power output of the inverter is influenced by the active power output [Samadi et al. (2012)].
(2) The technical feasibility of reactive power loss reduction by photovoltaic inverters.
The losses in distribution lines are shown in Formula 1:
Where
2.2 Economic feasibility
When photovoltaic inverters participate in reactive power loss reduction, both the benefits and costs increase, as shown in Table 1. The benefits of distributed photovoltaics participating in reactive power loss reduction are divided into two parts, namely, direct benefits and indirect benefits. Direct benefits refer to the energy-saving benefits brought by the loss reduction during the statistical period. Indirect benefits refer to the electricity price discounts obtained by the users when the power factor is improved.

Table 1. Economic analysis of inverter participation in reactive power loss reduction.
When photovoltaic inverters participate in reactive power loss reduction, it will lead to an increase in their operating costs, including: the capital investment costs of equipment that should be allocated to the use of reactive power regulation functions, the renovation costs incurred from developing regulation functions; the loss costs associated with the use of reactive power regulation functions; and the lifespan deterioration costs caused by utilizing reactive power regulation functions.
When the comprehensive benefits are positive, it is economically feasible for photovoltaic inverters to participate in reactive power loss reduction, and the maximization of comprehensive benefits should be pursued.
3 Comprehensive benefit optimization model
3.1 Cost model
(1) Investment Costs
When the reactive power output function is enabled, it occupies the active output capacity of the photovoltaic equipment. The capital investment cost of distributed photovoltaic equipment should be allocated between active and reactive power transmission functions.
First, the capital investment cost of the inverter is allocated to the investment cost for each period according to its designed service life, as shown in Formula 2:
Where D represents the capital investment cost of the inverter; R is the investment cost allocated for each period; M is the cumulative allocated cost for the current period; v is the estimated residual value; and λ is the depreciation rate.
Next, the opportunity cost for each period is calculated as shown in Formula 3:
Where F represents the opportunity cost for each period; Cav is the average investment return in society; and m is the current interest period.
Finally, the investment cost allocated for the reactive power loss reduction function for each period is calculated as Formula 4 and recorded as C1.
Where β is the allocation coefficient.
(2) Transformation Costs
The existing distributed photovoltaic equipment only needs to upgrade the inverter control software without replacing hardware, and can have bidirectional reactive power output function.
First, the total transformation cost is calculated as shown in Formula 5:
Where T represents the number of distributed photovoltaics in a certain distribution network; o is the number of personnel involved in the upgrade; d is the number of working days; b is the labor cost per person per day; and E is the software upgrade fee for a single distributed photovoltaic.
Next, the transformation cost for each period is calculated as shown in Formula 6:
Where N represents the total number of allocation periods;
(3) Operating Loss Costs
When participating in reactive power regulation, a larger ripple current increment is generated on the DC side, leading to an increase in the heating losses of electrolytic capacitors and equipment.
The power loss caused by reactive power transmission is calculated as Formula 7:
Where P and Q represent the active operating value and the reactive operating value of the inverter, respectively. UN is the rated voltage of the grid, and RC represents the equivalent resistance.
The reactive power operating loss costs for each period is calculated as Formula 8:
Where T represents the statistical cycle, and XP is the feed-in tariff for photovoltaic.
(4) Lifespan Loss Costs
The limiting factor affecting the lifespan of distributed photovoltaics is the lifespan of the DC-side capacitors, which is significantly influenced by temperature.
The lifespan of the electrolytic capacitors before participating in reactive power loss reduction is calculated as shown in Formula 9:
Where Tmax and K0 represent the maximum rated temperature and the corresponding estimated lifespan, respectively. Ta is the actual operating temperature of the capacitor.
The temperature of the inverter is calculated as shown in Formula 10:
Where Ts is the room temperature, R is the thermal resistance between the inverter and the atmosphere, and Ps is the loss power.
The temperature increment of the inverter caused by reactive power output is calculated as shown in Formula 11:
The useable lifespan after participating in reactive power loss reduction is calculated as shown in Formula 12:
The lifespan loss cost per period is calculated as shown in Formula 13:
Where DC is the purchase price of the electrolytic capacitors, MC is the already allocated cost, and vc is the residual value, t is selected as the statistical interval.
In summary, the cost function for the distributed photovoltaic participating in reactive power loss reduction is established as Formula 14 and denoted as C:
3.2 Benefit model
(1) Benefit of loss reduction
First, the source-load operating scenarios are defined, and the loss reduction effect of inverter reactive power compensation is modeled under each scenario. The active power of distributed photovoltaics are categorized into large-scale, medium-scale, and small-scale scenarios. The loads are divided into large-scale and small-scale scenarios, leading to a total of six combined operating scenarios.
In these six scenarios, the line loss rate of the distribution network before the inverter participates in the regulation is calculated as σn0 (where n represents different scenario numbers). Then, the line loss rate of the distribution network after the inverter participates without compensation is calculated as σn.
The line loss rate of the distribution network varies depending on the reactive power compensation capacity. The function mapping relationship between reactive power of photovoltaic inverters and line loss rate is established using polynomial fitting, as shown in Formula 15. The goodness-of-fit is defined as the ratio of the regression sum of squares to the total sum of squares. When the goodness-of-fit is greater than or equal to 0.99, the fitting is complete.
Next, the loss reduction quantity in the n-th scenario is calculated as Formula 16:
Where Pn is the grid-connected power in the n-th scenario, TL is the duration of the n-th scenario.
Finally, the total loss reduction benefit during the statistical period is calculated as Formula 17:
Where XSALE represents the electricity price during the statistical period.
(2) Benefit of power factor improvement
Based on the principle of electricity price adjustment according to the power factor, the formula for calculating the electricity price adjustment coefficient is as Formula 18:
In the n-th scenario, the functional relationship between the reactive power capacity and the power factor is established as shown in Formula 19:
According to Formula 19, the power factors before and after the reactive power regulation of the photovoltaic inverter for the n-th scenario are calculated and denoted as cosθn0 and cosθn, respectively. Then, using Formula 18, the electricity price adjustment coefficients before and after the reactive power regulation are calculated and denoted as ɑn0 and ɑn.
The benefit of power factor improvement allocated to distributed photovoltaic enterprises for each period is calculated as Formula 20:
Where Ln represents the total electricity consumption of industrial users during the statistical period, X is the benchmark electricity price for industrial users, and ɛ is the allocation coefficient.
In summary, the benefit function for distributed photovoltaics participating in reactive power regulation is established as Formula 21:
3.3 Comprehensive benefit optimization
Based on the cost model and the benefit model, the comprehensive benefit of distributed photovoltaics participating in reactive power loss reduction is calculated and denoted as Formula 22:
Where H, B, and C are all functions of Q. The optimization objective of this paper is to maximize the benefit. The value of Q is constrained by its maximum reactive power capacity and the inverter capacity, as shown in Formula 23:
3.4 Model solution
The genetic algorithm (Ji et al., 2022) is adopted to solve this model, and the flowchart is shown in Supplementary Figure S1.
4 Example analysis
A distribution network containing distributed photovoltaic systems is built, taking the 33-node system as an example, where the distributed photovoltaics are connected to nodes 4, 5, 8, 9, 10, 12, 20, 21, 22, 24, 25, 26, 28, 30, 32, and 33. A 24-h period is selected as the statistical interval. The operating scenarios for distributed photovoltaics and loads are set as shown in Supplementary Tables S1–S5. The results of dividing source-load operating scenarios are as follows:
Scenario 1: Distributed photovoltaic 5,355 kW, load 1,030 kW; Scenario 2: Distributed photovoltaic 5,355 kW, load 5,800 kW; Scenario 3: Distributed photovoltaic 2,520 kW, load 5,800 kW; Scenario 4: Distributed photovoltaic 2,520 kW, load 1,030 kW; Scenario 5: Distributed photovoltaic 315 kW, load 5,800 kW; Scenario 6: Distributed photovoltaic 315 kW, load 1,030 kW.
4.1 Cost calculation
In the simulation case, the specific parameters are shown in Table 2. According to Formulas 2–13, various costs are calculated.
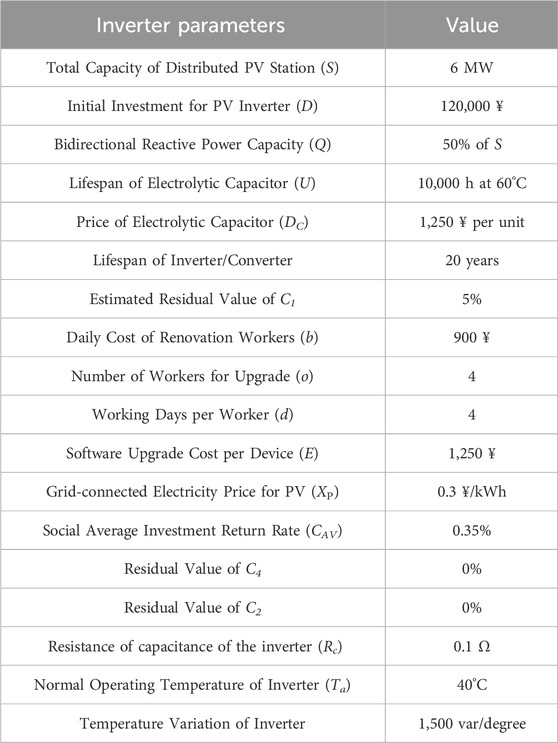
Table 2. Inverter parameters.
4.2 Revenue calculation
The reactive power output of the converters is adjusted in the different scenarios, and the corresponding line loss rates and power factors are obtained through simulation.
Based on Table 3, the function of the line loss rate with respect to the reactive power output in Scenario 1 is fitted as follow:
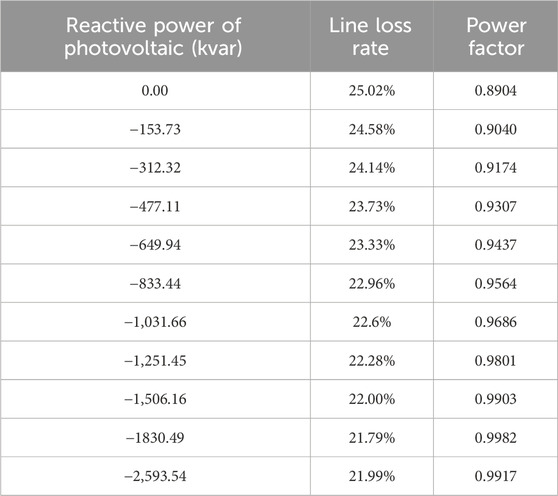
Table 3. Reactive power, line loss rate, and power factor in scenario 1.
Based on Table 3, the function of the power factor with respect to the reactive power output in Scenario 1 is fitted as follow:
Based on Table 4, the function of the line loss rate with respect to the reactive power output in Scenario 2 is fitted as follow:
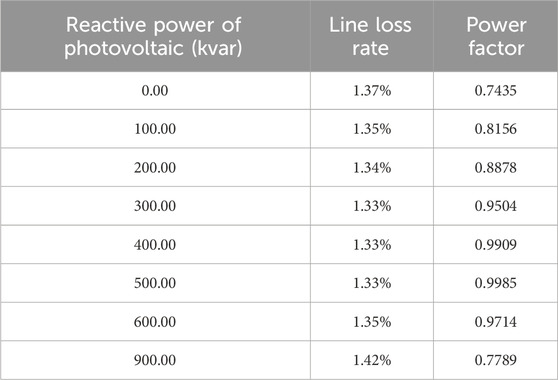
Table 4. Reactive power, line loss rate, and power factor in scenario 2.
Based on Table 4, the function of the power factor with respect to the reactive power output in Scenario 2 is fitted as follow:
Based on Table 5, the function of the line loss rate with respect to the reactive power output in Scenario 3 is fitted as follow:

Table 5. Reactive power, line loss rate, and power factor in scenario 3.
Based on Table 5, the function of the power factor with respect to the reactive power output in Scenario 3 is fitted as follow:
Based on Table 6, the function of the line loss rate with respect to the reactive power output in Scenario 4 is fitted as follow:
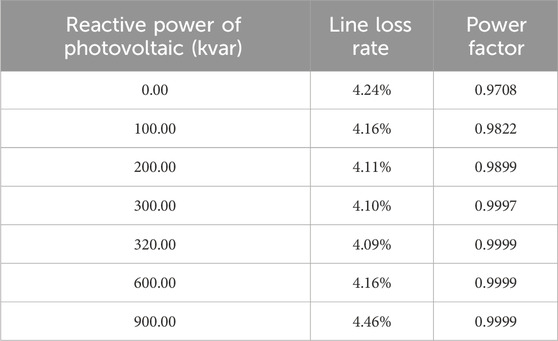
Table 6. Reactive power, line loss rate, and power factor in scenario 4.
Based on Table 6, the function of the power factor with respect to the reactive power output in Scenario 4 is fitted as follow:
Based on Table 7, the function of the line loss rate with respect to the reactive power output in Scenario 5 is fitted as follow:
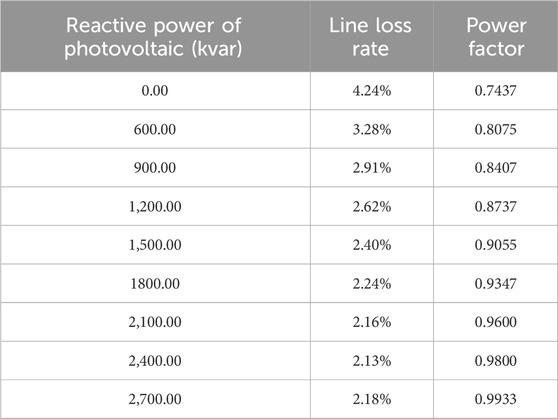
Table 7. Reactive power, line loss rate, and power factor in scenario 5.
Based on Table 7, the function of the power factor with respect to the reactive power output in Scenario 5 is fitted as follow:
Based on Table 8, the function of the line loss rate with respect to the reactive power output in Scenario 6 is fitted as follow:
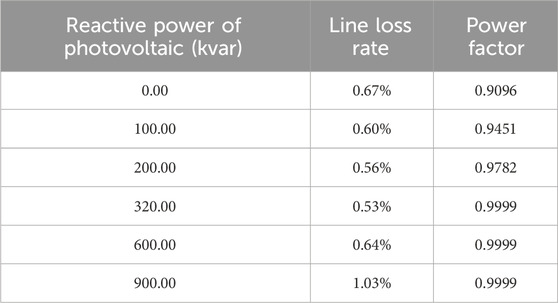
Table 8. Reactive power, line loss rate, and power factor in scenario 6.
Based on Table 8, the function of the power factor with respect to the reactive power output in Scenario 6 is fitted as follow:
The functions
The functions
4.3 Comprehensive benefit optimization and result analysis
With the goal of maximizing comprehensive benefits, global optimization is performed through the rotation of six scenarios over a 24-h period. The step size is set to 2 h. The optimization results are shown in Supplementary Figure S2.
An average reactive power adjustment in Scenario 6 is 290.67 kvar, which is from 0:00 to 6:00. From 6:00 to 10:00 is Scenario 4, with a reactive power adjustment of 2,332 kvar; from 10:00 to 12:00 is Scenario 2, with a reactive power adjustment of 3,000 kvar; from 12:00 to 14:00 is Scenario 1, with a reactive power adjustment of 2022 kvar; from 14:00 to 20:00 is Scenario 3, with a reactive power adjustment of 1769.67 kvar; from 20:00 to 24:00 is Scenario 6, with a reactive power adjustment of 557 kvar.
Before the participation of photovoltaic inverters in reactive power loss reduction, the line loss rates for the six periods were 25.02%, 1.37%, 4.24%, 4.24%, 10.05% and 0.67%, respectively. The power factors were 0.8904, 0.7434, 0.7437, 0.9708, 0.8726 and 0.9096, respectively. After the participation of photovoltaic inverters in reactive power loss reduction, the line loss rates for the six periods were 21.79%, 1.37%, 2.13%, 4.09%, 7.09% and 0.53%, respectively. The power factors were 0.9982, 0.9985, 0.9800, 0.9990, 0.9882 and 0.9990.
Compared with not participating in reactive power loss reduction, the cost of the inverter increased by 536.8681¥, while the line losses decreased in all six periods and the power factors improved. The comprehensive benefit amounted to 3,370.3577 ¥. When the photovoltaic inverter participates in loss reduction at the maximum reactive power value of 3,000 kvar throughout the day, its comprehensive benefit is calculated to be 2,655.8340¥, which is less than the optimized result described in this paper.
As shown in Table 3: The line loss rate in Scenario 1 before reactive power regulation reaches as high as 25.02%, and the reduction in losses after reactive power regulation is the most significant. Therefore, it is recommended to focus on reactive power loss reduction control for this scenario during dispatch operations.
5 Conclusion
In response to the problem of increased line loss after distributed photovoltaic integration into the distribution network, photovoltaic inverters are used as reactive power sources to achieve reactive power loss reduction. Taking the improved 33 node distribution network as an example, the comprehensive benefit optimization of reactive power loss reduction was carried out.
Firstly, cost models for investment, renovation, operation and lifespan losses are established. In this example, the total cost of photovoltaic inverters participating in reactive power loss reduction within 1 day is calculated to be 536.8681 ¥.
Secondly, six combined operation scenarios of photovoltaic systems and loads are defined, and the relationship between the reactive power regulation capacity, loss reduction benefits, and power factor improvement benefits is fitted for each operating scenario.
Finally, a comprehensive optimization of revenue and costs is conducted. Compared to the scenario where the photovoltaic inverter operates at the maximum reactive power regulation capacity, the optimized comprehensive benefit is increased by 21.20%. The feasibility of the benefit optimization method proposed in this article has been verified. In the follow-up research, the different benefits brought by different loss reduction effects due to the geographical location of the PV inverter can be further considered, and the revenue distribution within the PV inverter can also be considered.
Data availability statement
The original contributions presented in the study are included in the article/Supplementary Material, further inquiries can be directed to the corresponding author.
Author contributions
YL: Conceptualization, Methodology, Writing–original draft, Writing–review and editing. RL: Formal Analysis, Methodology, Validation, Writing–original draft, Writing–review and editing. CL: Data curation, Formal Analysis, Writing–review and editing.
Funding
The author(s) declare that financial support was received for the research, authorship, and/or publication of this article. This research was funded by the technology projects at the headquarters of State Grid Corporation under grant number 52272223003C.
Conflict of interest
Author CL was employed by State Grid Gansu Electric Power Co.
The remaining authors declare that the research was conducted in the absence of any commercial or financial relationships that could be construed as a potential conflict of interest.
The authors declare that this study received funding from State Grid Corporation. The funder had the following involvement in the study: Data curation and Analysis.
Generative AI statement
The author(s) declare that no Generative AI was used in the creation of this manuscript.
Publisher’s note
All claims expressed in this article are solely those of the authors and do not necessarily represent those of their affiliated organizations, or those of the publisher, the editors and the reviewers. Any product that may be evaluated in this article, or claim that may be made by its manufacturer, is not guaranteed or endorsed by the publisher.
Supplementary material
The Supplementary Material for this article can be found online at: https://www.frontiersin.org/articles/10.3389/fenrg.2024.1502053/full#supplementary-material
References
Ahsan, S., Siddiqui, A. S., and Khan, S. (2012). Reactive power compensation for integration of wind power in a distribution network in 2012 IEEE 5th India international conference on power electronics (IICPE). IEEE, 1–4.
Chen, G. (2018). Research on reactive power compensation optimization of 35kV three phase unbalanced distribution network system. Sci. J. Circuits, Syst. Signal Process. 7 (2), 60. doi:10.11648/j.cssp.20180702.13
Dona, V. M., and Paredes, A. N. (2001). Reactive power pricing in competitive electric markets using the transmission losses function in Power tech proceedings, 2001 IEEE porto, 10–13.
Elseify, M. A., SeyyedAbbasi, A., Domínguez-García, J. L., and Kamel, S. (2023). Probabilistic optimal planning of multiple photovoltaics and battery energy storage systems in distribution networks:A boosted equilibrium optimizer with time-variant load models. J. Energy Storage 73, 108986. doi:10.1016/j.est.2023.108986
Ibram, D., and Gueorgiev, V. (2021). Reactive power compensation in grid connected photovoltaic system using static synchronous compensator. Electr. Eng. Fac. Conf. (BulEF) (13), 1–5. doi:10.1109/bulef53491.2021.9690827
Ji, Y., Liu, K., Geng, G., Sheng, W., Meng, X., Jia, D., et al. (2017). A novel reactive power optimization in distribution network based on typical scenarios partitioning and load distribution matching method. Appl. Sci. 7 (8), 787. doi:10.3390/app7080787
Ji, Y., Liu, S., Zhou, M., Zhao, Z., Guo, X., and Qi, L. (2022). A machine learning and genetic algorithm-based method for predicting width deviation of hot-rolled strip in steel production systems. Inf. Sci. 589, 360–375. doi:10.1016/j.ins.2021.12.063
Kondo, K., and Baba, J. (2020). Evaluation of harmonic current effect and distribution line voltage control ability of reactive power control by use of power factor correction converter in consumer load. J. Electr. Eng. Jpn. 211, 3–14. doi:10.1002/eej.23261
Kumar, V., and Singh, M. (2021). Reactive power compensation using derated power generation mode of modified P&O algorithm in grid-interfaced PV system. Renew. Energy 178 (178), 108–117. doi:10.1016/j.renene.2021.06.035
Li, Y., Yang, D., Liu, C., Guo, D., Gu, Y., and Li, J. (2024). Dynamic reactive power allocation method of power grid with high-permeability PV considering transient voltage stability. Energies 17, 1190. doi:10.3390/en17051190
Mamdouh, K. A., Shehata, A., and Korovkin, N. V. (2019). Multi-objective voltage control and reactive power optimization based on multi-objective particle swarm algorithm Iop conference series: materials science and engineering. IOP Publ. 643 (1), 012089. doi:10.1088/1757-899x/643/1/012089
Masikana, S. B., Sharma, G., and Sharma, S. (2024). Renewable energy sources integrated load frequency control of power system: a review,e-Prime - advances in Electrical Engineering. Electron. Energy 8, 2772–6711. doi:10.1016/j.prime.2024.100605
Meliopoulos, A. P. S., Asad, M. A., and Cokkinides, G. J. (1999). Issues for reactive power and voltage control pricing in a deregulated environment System Sciences in Proceedings of the 32nd annual Hawaii international conference on, 5–8.
Nwaigwe, K. N., Mutabilwa, P., and Dintwa, E. (2019). An overview of solar power (PV systems) integration into electricity grids. Mater. Sci. Energy Technol. 2, 2629–2633. doi:10.1016/j.mset.2019.07.002
Pan, Y., Sun, X., Cai, Y., Li, X., and Zhao, W. (2024). An improved coordination control for enhancing photovoltaic power imbalance tolerant capability of MMC-based photovoltaic system. Syst. IEEE Trans. Power Electron. 39, 11732–11745. doi:10.1109/tpel.2024.3404398
Samadi, A., Ghandhari, M., and Söder, L. (2012). Reactive power dynamic assessment of a PV system in a distribution grid. Energy Procedia 20, 98–107. doi:10.1016/j.egypro.2012.03.012
Samadi, A., Shayesteh, E., Eriksson, R., Rawn, B., and Söder, L. (2014). Multi-objective coordinated droop-based voltage regulation in distribution grids with PV systems. Renew. Energy 71, 71315–71323. doi:10.1016/j.renene.2014.05.046
Sivalingam, C. M. K., Ramachandran, S., and Rajamani, P. S. (2017). Reactive power optimization in a power system network through metaheuristic algorithms. Turkish J. Electr. Eng. and Comput. Sci. 25 (6), 4615–4623. doi:10.3906/elk-1703-159
Wang, H., Kraiczy, M., Mende, D., Stöcklein, S., and Braun, M. (2021). Application-oriented reactive power management in German distribution systems using decentralized energy resources. Energies 14, 4949. doi:10.3390/en14164949
Wang, X., Hu, Y., Wang, J., Yang, Z., and Fan, C. (2023). Optimal allocation of reactive power compensation in distribution network considering distributed photovoltaic voltage regulation capability. Int. Conf. Renew. Power Generation 2023 (12), 316–321. doi:10.1049/icp.2023.2160
Keywords: benefit optimization, cost and benefit analysis, loss reduction by reactive compensation, multiple operational scenarios, photovoltaic Inverters
Citation: Li Y, Liu R and Liang C (2024) Comprehensive benefit optimization method for photovoltaic inverters participating in distribution network loss reduction by reactive compensation. Front. Energy Res. 12:1502053. doi: 10.3389/fenrg.2024.1502053
Received: 26 September 2024; Accepted: 27 November 2024;
Published: 17 December 2024.
Edited by:
Tianyang Zhao, Royal Institute of Technology, SwedenReviewed by:
Guangchen Liu, Inner Mongolia University of Technology, ChinaZilei Zhang, Inner Mongolia University of Science and Technology, China
Mingjian Cui, Tianjin University, China
Copyright © 2024 Li, Liu and Liang. This is an open-access article distributed under the terms of the Creative Commons Attribution License (CC BY). The use, distribution or reproduction in other forums is permitted, provided the original author(s) and the copyright owner(s) are credited and that the original publication in this journal is cited, in accordance with accepted academic practice. No use, distribution or reproduction is permitted which does not comply with these terms.
*Correspondence: Yalong Li, bHlsd3l5eEAxNjMuY29t