 M. Srinivasarao
 Giancarlo Sorrentino
 V. Mahendra Reddy
- 1Combustion Chemical Kinetics Research Laboratory (CCKRL), Mechanical Engineering, Indian Institute of Technology Kharagpur, Kharagpur, India
- 2Institute of Science and Technology for Sustainable Energy and Mobility (STEMS), National Research Council (CNR), Naples, Italy
Moderate or intense low-oxygen dilution combustion is vital for reducing emissions. Recent advancements have introduced regime diagrams for various reactant mixtures, highlighting no-combustion, Moderate or intense low-oxygen dilution, and high-temperature air combustion regions to analyze the overall operating range. However, studies on these diagrams are limited and often lack detailed analysis. This study focuses on the interaction of the Moderate or intense low-oxygen dilution regime with other regimes, particularly examining ignition delay time. Initially, ignition delay times are analyzed using regime diagrams for methane, propane, and syngas fuel mixtures. Calculations reveal a consistent ignition delay time range at the boundary between Moderate or intense low-oxygen dilution and no-combustion, varying with fuel type. To investigate further, combustion regime diagrams for methane and methane-hydrogen mixtures are developed, considering dilution levels and preheating effects with N2, CO2, H2O, and exhaust gas recirculation. These diagrams examine the spread of the Moderate or intense low-oxygen dilution regime and the ignition delay times at the boundaries. The upper and lower limits of the moderate or intense low-oxygen dilution regime are noted based on obtained ignition delay times. An emission-based analysis within these regimes is conducted to assess the effectiveness of techniques in achieving moderate or intense low-oxygen dilution combustion. Proposed ignition delay time range for the considered mixtures aims to maintain mixture within the moderate or intense low-oxygen dilution regime, ensuring lower emissions. This is also further proved with the numerical simulations. The study also explores the sensitivity of dilution level, mixture temperature, N2, CO2, H2O, and EGR on the Moderate or intense low-oxygen dilution regime.
1 Introduction
Due to the substantial rise in fossil fuel usage for combustion applications, emissions have notably increased. In response to stringent pollution regulations and concerns over emissions from conventional combustion, low-emission technologies such as high-temperature air combustion (HiTAC) (Katsuki and Hasegawa 1998), flameless oxidation (FLOX©) (Wünning and Wünning, 1997), and colorless distributed combustion (CDC) (Arghode and Gupta 2011) have been developed (de Joannon et al., 2012; Sabia et al., 2021; Sorrentino et al., 2015). The moderate or intense low-oxygen dilution (MILD) combustion technique operates similarly to these technologies but with a different mode of operation, offering greater flexibility regarding various energy vectors (Ariemma et al., 2023; Garnayak et al., 2022; Garnayak et al., 2023; Sorrentino et al., 2017). MILD combustion involves supplying the reactants at a temperature higher than the reactant mixture’s self-ignition temperature while ensuring that the temperature rise within the combustor remains below the self-ignition temperature of the fuel. MILD combustion ensures a more uniform distribution of the flame, thereby reducing significant temperature gradients within the combustor. This results in lower emissions and higher efficiency. MILD combustion flames operate under lower oxygen concentrations or higher exhaust gas recirculation, making them significantly different from conventional flames. Due to these conditions and the lower operating temperatures, maintaining flames within the MILD combustion regime is challenging (Mardani and Fazlollahi Ghomshi, 2016; Srinivasarao and Reddy 2024). Consequently, MILD combustion flames have attracted significant attention for their potential, which is being explored through computational and experimental analyses. Several computational simulations (Christo and Dally 2005; Darbyshire and Swaminathan 2012; Giuntini et al., 2023; Srinivasarao et al., 2023) and experiments (Galletti et al., 2017; Kumar et al., 2002; Mahendra Reddy et al., 2013) have been conducted to understand the challenges in achieving MILD combustion for various fuels. In addition, different combustion regime diagrams were constructed for methane (de Joannon et al., 2012; Garnayak et al., 2022; Rao and Levy 2010), propane (Sorrentino et al., 2016), syngas (Kim et al., 2021), and enriched syngas (Kim et al., 2021) to assess the feasibility of MILD combustion across a wide range of oxygen concentrations and preheating temperatures.
Combustion regime diagrams provide a fundamental understanding of reactive region characteristics under different dilution and preheating conditions. The combustion regime diagram typically consists of three regions namely, (i) no-combustion regime in which the combustion process is not initiated (ii) MILD regime where the temperature difference between the peak temperature (
Most of the combustion regime diagrams created in the literature are based on the definition given by Cavaliere and de Joannon (2004). Hence, the borderline between the HiTAC and MILD combustion regimes is associated with the definition of MILD combustion, i.e.,
The characteristics of the reactant mixture can be identified using ignition delay time (IDT). Studies on IDTs for methane (Ebrahimi Fordoei and Mazaheri, 2021; Garnayak et al., 2022; Tu et al., 2020) and propane (Sabia et al., 2015; Yang et al., 2022) under various pressures, preheating temperatures, and combustion dilution percentages have shown that MILD combustion phenomena are particularly sensitive to IDT. A rapid change in IDTs occurs when transitioning from no-combustion to the HiTAC regime, and a similar trend is observed when reactant properties moving from no-combustion to the MILD regime. However, the IDT variation is less pronounced during the shift from no-combustion to the MILD regime. Such variation in IDTs when the flame is shifting from one regime to another regime is not discussed in the literature.
In the present work, ignition delay times (IDTs) of various combustion regimes are studied, initially focusing on the flame transition from the no-combustion regime to the MILD regime. Several data points on the borderline between the MILD and no-combustion regimes are considered, and IDTs of the selected data points are thoroughly analyzed. In the primary investigation, it is observed that the IDTs at the borderline points between the MILD and no-combustion regimes exhibited similar range of magnitudes for a given fuel mixture, though this magnitude varied depending on the fuel mixture. Based on this insight, a comprehensive examination is conducted focusing on the methane fuel regime diagrams. This investigation encompassed various conditions, including hydrogen blending, preheating, and dilution with CO2, H2O, O2, and EGR. Combustion regime diagrams for methane and methane-hydrogen using a plug-flow reactor (PFR) in Chemkin Pro are developed. These diagrams are considered for analyzing the borderline points between the MILD and no-combustion regimes, as well as the MILD and HiTAC regimes. Additionally, an emission analysis for CO and NO within these regime diagrams is conducted. Furthermore, the influence of various techniques employed in achieving MILD combustion is investigated.
2 Preliminary analysis of the borderline between MILD and no-combustion regime
Data for the reacting mixtures are being analyzed to understand the characteristics of reactant mixtures across various combustion regimes and their borderlines. This section primarily focuses on characterizing the designated borderline points between the MILD and no-combustion regimes. For the analysis purposes, various regime diagrams from existing literature, specifically those for methane, propane with CO2 and H2O dilution, syngas, and enriched syngas, are being considered. Within each of these combustion regime diagrams three data points in each regime (no-combustion, HiTAC, and MILD) and seven points located along the border between the no-combustion and MILD regimes, are extracted. Subsequently, the ignition delay times (IDTs) are calculated for these extracted data points.
2.1 Selection of combustion regime diagrams
Figures 1A, B illustrate the combustion regime diagrams for methane fuel under O2 dilution (Garnayak et al., 2022) and exhaust gas recirculation (EGR) (Rao and Levy 2010), respectively. These regimes are developed by varying the O2 concentration in the oxidizer and the unburned mixture temperature. As discussed previously, the selected points are denoted by dots and numbered accordingly. The first group (1–3) falls within the no-combustion regime, the second group (4–10) lies on the borderline between the no-combustion and MILD regimes, the third group (11–13) is situated in the MILD regime, and the last group (14–16) is within the HiTAC regime. This numbering system is maintained consistently throughout this section.
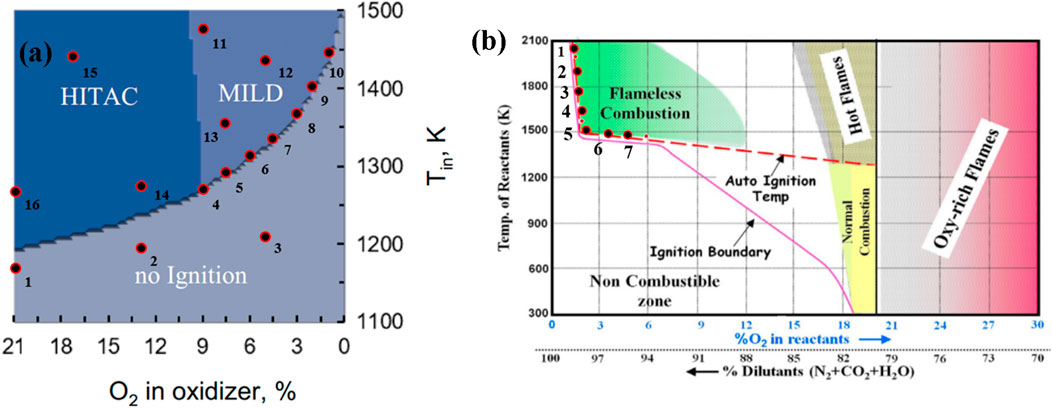
Figure 1. Methane combustion regimes diagram under the (A) O2 dilution. Adapted from (Garnayak et al., 2022) with the permission of Taylor & Francis. (B) exhaust gas recirculation (Rao and Levy 2010).
The complete mixture composition and operational parameters are collected for the selected points, which are utilized in numerical simulations to calculate the ignition delay times (IDTs). Figures 2A, B depict the combustion regimes for propane fuel with CO2 and N2 dilutions, established using the reactant temperatures and C and O radicals’ ratio in the reactant mixture (Sorrentino et al., 2016). Figures 2C, D show combustion regime diagrams for syngas and enriched syngas based on mixture temperatures and oxygen dilution (Kim et al., 2021).
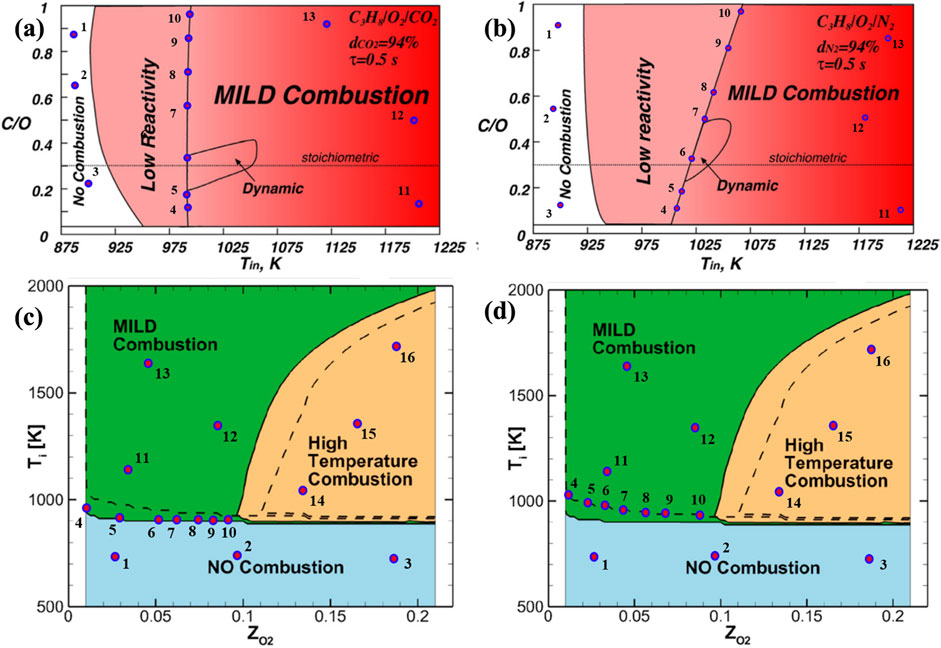
Figure 2. Propane combustion regimes diagram for (A) H2O (B) N2 dilutions, Adapted from (Sorrentino et al., 2016) with the permission of Springer and (C) syngas (continuous lines), (D) enriched syngas (dashed lines) Adapted from (Kim et al., 2021) with the permission of Elsevier.
The regime diagrams illustrating different combustion regimes for the fuels reveal that MILD regimes are stable within an oxygen dilution range of 1.5%–9%. However, the temperature ranges differ according to the flammability of the fuel and oxidizer mixture. This indicates that the reduction in oxygen concentrations in the reactant mixtures is compensated by the reactant temperatures. Notably, CO2 dilution enhances the MILD-operated regime when compared with the N2 diluted MILD regime for the case of propane (Figures 2A, B). Additionally, hydrogen enrichment of syngas enhances the MILD regime (Figures 2C, D). The detailed analysis of the extracted points is well explained in the IDT calculation section.
2.2 Ignition delay times calculation
Numerical simulations are conducted using detailed chemistry for the respective fuel with a closed homogeneous reactor present in Chemkin Pro. In the closed homogeneous reactor, the ignition delay time (IDT) is defined as the duration in which the combustion process releases the maximum amount of heat, indicated by the inflection point in the temperature profile. Alternatively, it can be determined as the time corresponding to the peak concentration of a specific species chosen by the user, often the OH mass fraction (Srinivasarao et al., 2024; Mardani and Karimi Motaalegh Mahalegi, 2019). It is important to note that, in this isobaric closed homogeneous system, species fractions and temperature results remain consistent regardless of the volume scale, as only gas-phase chemistry is considered in this study, and surface chemistry is not a factor.
Numerical simulations are employed to compute the ignition delay times (IDTs) for the extracted points from the regime diagrams. Specifically, for methane and syngas fuels, the GRI-Mech 3.0 mechanism is used, and for propane fuel, the USC-Mech 2.0 mechanism is utilized. These mechanisms are validated against corresponding experimental data from Ebrahimi Fordoei and Mazaheri (2021), and Yang et al. (2022), ensuring their accuracy in predictions. The individual fuel mechanisms align well with the experimental results, as depicted in Figure 3, justifying their use in the IDT calculations.
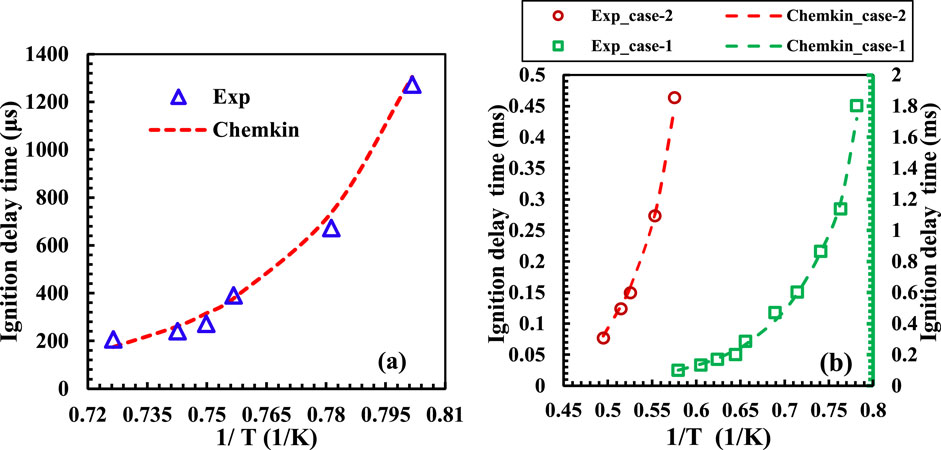
Figure 3. Comparison of simulated and experimental IDTs for (A) methane and (B) propane fuels.
The ignition delay times (IDTs) for the selected points from the regime diagrams obtained through numerical simulations are presented in Figure 4 for all the five fuel cases. The plot is segmented into four regions: Regions 1, 2, 3, and 4 correspond to no-combustion, the borderline between MILD and no-combustion, the MILD regime, and the HiTAC combustion regimes, respectively. A significant decrease in ignition delay times (IDTs) is observed while moving from regions 1 to 4, as depicted in Figure 4. It is important to note that the IDTs at the borderline locations (region 2) remain consistent across for all the fuels, maintaining the same range. However, the actual magnitudes vary depending on the specific fuel mixture. This observation underscores that the IDTs remain relatively stable for a given fuel as the flame transitions from a no-combustion to a MILD regime.
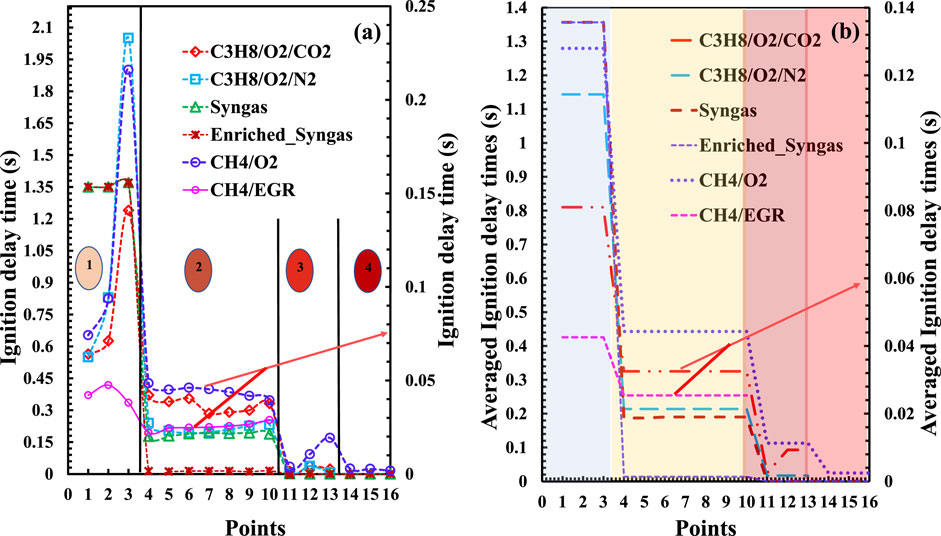
Figure 4. (A) Computed IDTs of the extracted data points and (B) averaged IDTs in each zone.
Based on the observations from the regime diagrams, IDTs of the MILD regime are primarily influenced by factors such as mixture pressure, temperature, fuel concentrations, oxygen levels, and the presence of other diluents. In this section, the authors specifically studied the IDTs at the boundary between the no-combustion and MILD regimes for the various fuel reactant mixtures. Several important observations are made during this analysis and are:
• The ignition delay times (IDTs) at the examined borderline were consistent in magnitude range for various fuels but varied between different fuel types.
• The magnitudes of the IDTs for various fuels on the considered borderline are followed as C3H8/CO2 > C3H8/N2 > Syngas > CH4 > Enriched syngas.
3 MILD regime-based analysis for methane fuel
The consistency in the nature of ignition delay times (IDTs) at the borderline points is observed irrespective of the mixture preheating temperature and dilution level in the preceding section. For further in-depth analysis of the borderline points for a given fuel and oxidizer mixtures under various diluted conditions, combustion regime diagrams are not available in the literature. Hence, in this section, multiple combustion regime diagrams for methane fuel are generated using a 1D plug-flow reactor (PFR) within Chemkin Pro. Since the combustion initiation location and peak temperature in the flow are the major factors in determining the stability and regime of the reactant mixture, a Plug Flow Reactor (PFR) is being considered for developing the regime diagram. These diagrams cover different dilutions involving N2, CO2, H2O, and exhaust gas recirculation (EGR) for both with and without H2 blends as a function of O2 dilution level and reactant mixture temperatures.
3.1 Plug flow reactor (PFR) modeling
The combustion regime diagrams of methane and hydrogen-assisted methane mixtures that are reported in the following sections are developed using an adiabatic plug flow reactor (PFR) module in Chemkin Pro. The numerical simulations are performed under highly preheated and diluted conditions in one-dimensional, steady state, and constant pressure laminar premixed conditions. A well-proved detailed chemical kinetics mechanism of GRI Mech 3.0 is used for conducting the numerical simulations. The plug flow reactor within Chemkin Pro efficiently solves the continuity, momentum, energy, and species first-order ordinary differential equations (ODEs), without considering transport features. This simplification enhances computational efficiency. In this model, the fuel and oxidizer mixture entering the PFR is presumed to be perfectly mixed in the radial direction. The experimental tubular reactor developed by Sabia et al. (2013) is considered for the numerical simulation using PFR. The characteristics of methane mixtures under conditions involving dilution and preheating are assessed within a domain with a 10 mm diameter and a length of 1,400 mm. The methane mixtures are simulated at stoichiometric premixture conditions with N2, CO2, H2O, and EGR by ranging oxygen concentration and preheating temperature of the mixture. The oxygen concentration in the oxidizer is considered from 21% to 0.25% and the inlet reactant preheating temperature is varied from 1100 K to 1700 K. The jet Reynolds number calculated for all the considered cases is approximately 1750. The inlet premixture velocity of 30 m/s is considered as a base case (Garnayak et al., 2022) at a reactant temperature of 1300 K and pressure of 1 atm, and accordingly, the mass flow rate is calculated with 21% oxygen concentration in the oxidizer. The uniform mass flow rate of 0.00061 kg/s is given at the inlet boundary for all the evaluated cases. A similar tubular reactor is also used for developing the combustion regime diagrams by Garnayak et al. (2022).
3.2 CFD modelling and validation
To gain a deeper understanding of the selected flames from the PFR analysis, detailed numerical simulations were conducted using a tubular burner. The burner dimensions match those used in the PFR investigation. The computational domain, along with the finalized grid, comprises 408,051 grid points and 400,000 elements, as illustrated in Figures 5A–C. The radial direction is divided into 50 grids, while the axial direction contains 8,000 grid points. This computational grid is more refined than in previous studies (Garnayak et al., 2022), which employed 240,000 grid points. The boundary conditions applied are also depicted in Figure 5A. All simulations were performed in the OpenFOAM environment, following a methodology consistent with our prior work (Srinivasarao et al., 2023). The earlier study detailed the mathematical modeling and model validation for both pure methane and hydrogen-enriched methane flames.
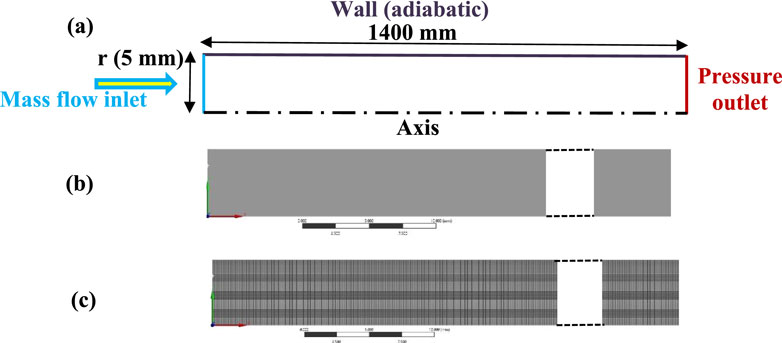
Figure 5. Computational domain (A) line diagram with boundary conditions (B) geometry (C) mesh.
A direct comparison between the present numerical results and experimental data for identical burner geometries at atmospheric pressure could not be conducted, as such data were unavailable. However, relevant experimental information was found for one-dimensional flame geometries using stoichiometric methane-air mixtures at atmospheric pressure (Bechtel et al., 1981; Stephenson, 1979). In their experiments, Bechtel et al. (1981) employed laser Raman scattering to obtain detailed measurements of temperature profiles and species concentrations in premixed, laminar methane-air flames. Further information about the experimental setup, including the burner configuration, can be found in the studies by Bechtel (1979), Bechtel et al. (1981), and Stephenson (1979).
In this study, the numerical results were evaluated by comparing the centerline temperature and species concentration profiles from the CFD simulations with the experimental data from Bechtel et al. (1981), as illustrated in Figure 6. To ensure consistency, the inlet conditions for the stoichiometric methane-air mixture were set to an initial temperature of 300 K and an inflow velocity of 0.3 m/s. The comparison revealed good agreement between the simulation outcomes and the experimental measurements, validating the accuracy of the numerical approach. The close alignment between the numerical and experimental data confirms that the adopted simulation methodology effectively captures the combustion characteristics under the investigated conditions, demonstrating its reliability for use in this work. Further to see the deviation of the predictions between the CFD and PFR a flame is simulated with methane having mixture temperature of 1300K and 21% O2 under N2 diluted condition. Figure 7 shows the axial temperature variation for CFD and PFR. The flame is initiated earlier in case of the CFD as compared with the PFR. The PFR model does not account for key aspects such as mixing phenomena, geometric dependency, and turbulence effects. However, it remains a valuable tool for gaining theoretical insights into the combustion characteristics of various mixtures. In this study, a tubular burner was used, with premixed reactant mixtures supplied uniformly. As a result, the influence of burner geometry and turbulence induced by mixing is minimal. Consequently, the comparison between the axial temperature profiles from the PFR model and CFD simulations shows only slight deviations, validating the applicability of the PFR model under these specific conditions.
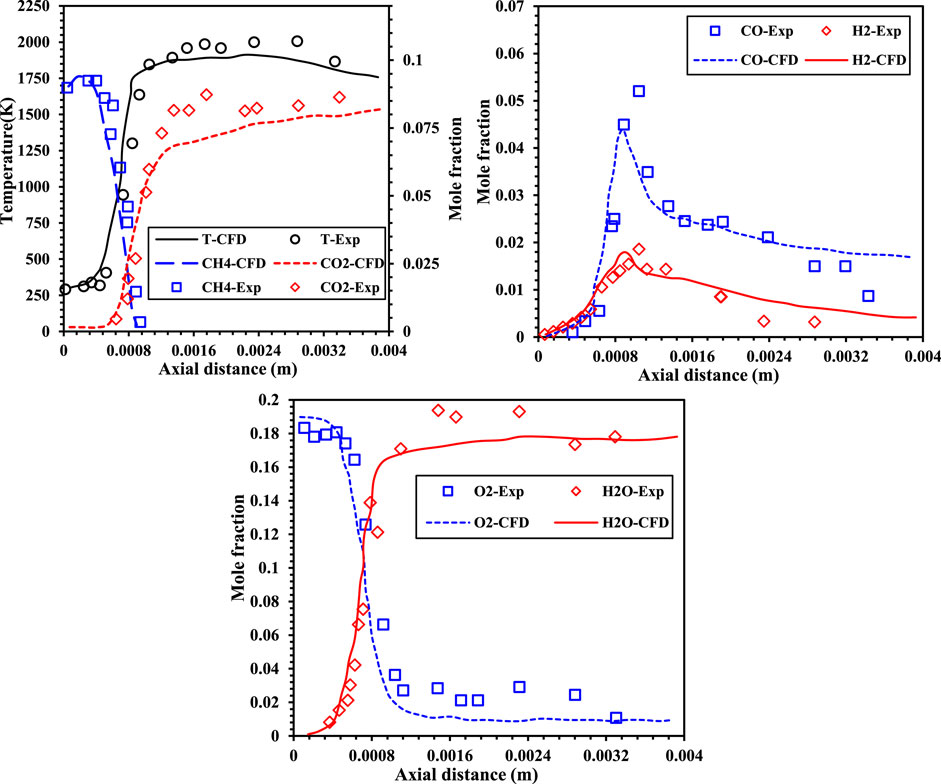
Figure 6. Comparison of experimental data with the computational predictions.
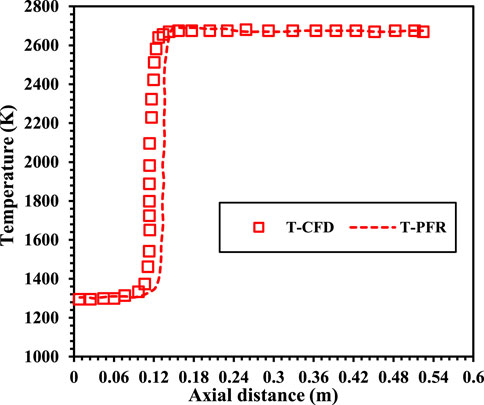
Figure 7. Comparison of computational predictions with PFR results.
3.3 Methane regime diagrams
The regime diagrams are constructed using the PFR modeling approach described in the earlier section. Figures 8A–D represents the methane combustion regime diagrams for N2, CO2, H2O, and EGR as a function of reactant temperature and oxygen concentration in the reactants. In the EGR mixture, 5.5% of CO2, 6.5% of H2O, and the remaining adjusted N2 and O2 based on the dilution level according to Christo and Dally (2005), Dally, Karpetis and Barlow (2002). Three types of combustion regimes termed no-combustion, HiTAC, and MILD are identified. The combustion regime diagrams are built on the basis of peak temperatures observed in stable reactants temperature profiles within the considered length of the PFR. For the preparation of these regime diagrams, numerous computational simulations are performed with the help of an adiabatic, steady, one-dimensional laminar premixed plug flow reactor (PFR). No-combustion region where the combustion process is not initiated within the considered PFR. A temperature increases lower than 100 K is deemed indicative of an unstable reactant mixture, typically observed as a flame anchored near the exit of the burner. This observation persists even when the mixture temperature exceeds the self-ignition temperature typically associated with flames in the no-combustion regime. This is primarily because the residence time of the unburned mixture entering the PFR (τres) is shorter than the ignition delay time (τign). In situations where the PFR length exceeds its current 1,400 mm, a perfectly stable temperature profile would have been achieved. However, the PFR length is uniform for all the simulated conditions. The boundary that distinguishes the no-combustion and MILD and MILD and HiTAC regimes is roughly within a 10–15 K range on the temperature scale (in Tin scale). This small area is not included in the no-ignition zone for basic analysis, nor is it shown in Figure 8. The spread of the no-combustion regime is narrower in the CH4/O2/CO2 regime diagram and wider in the CH4/O2/H2O diagram, compared to the other two considered diluted reactant mixtures. This discrepancy can be attributed to the fact that ignition delay times are longer in the case of H2O-added mixtures when compared to CO2-added methane mixtures. However, at higher mixture temperatures and lower dilutions (1.5%), a widespread no-combustion region is observed for CH4/O2/CO2 mixtures (Figure 8B). Whereas in the CH4/O2/CO2 mixtures, the no-combustion regime is limited to 0.5% dilution at higher mixture temperatures (Figure 8A).
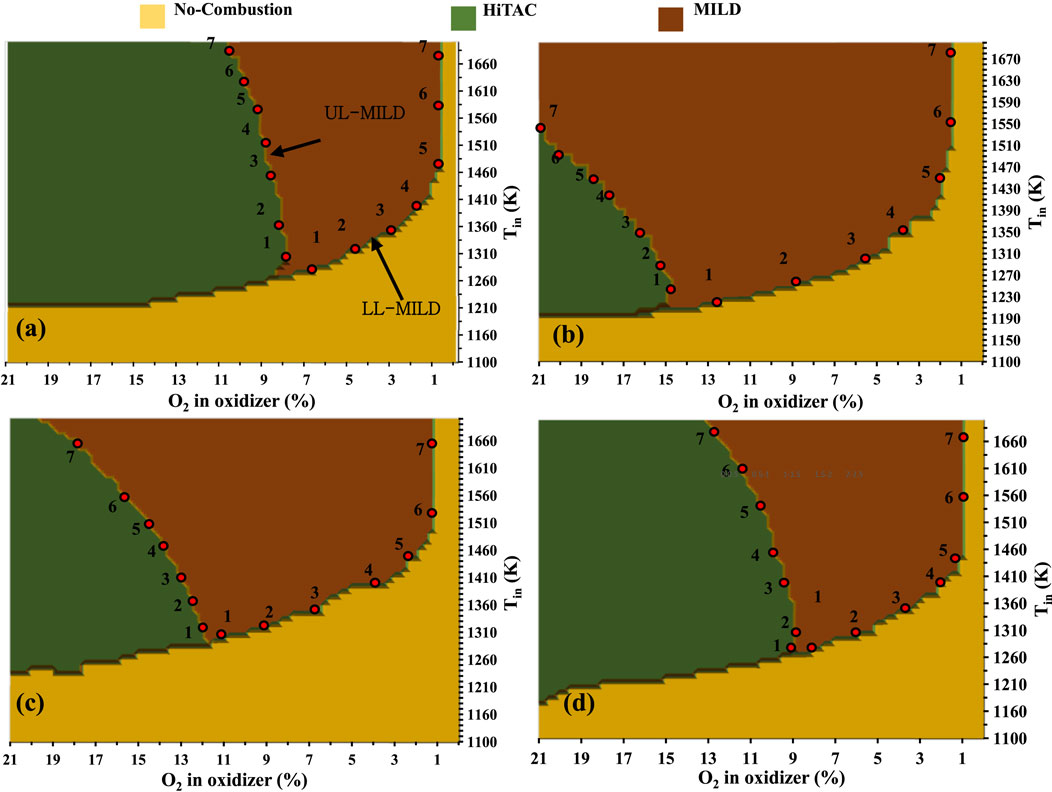
Figure 8. Combustion regime diagrams for methane mixtures with (A) N2, (B) CO2, (C) H2O, and (D) exhaust gas recirculation (EGR).
In Figures 8A–D, the MILD and HiTAC regimes are defined based on the peak temperatures generated within the considered PFR. It is important to note that the MILD combustion mode is a subset of the HiTAC combustion mode. In the case of MILD combustion, the threshold limit is established using the Tpeak-Tmix weightage, as suggested by Cavaliere and de Joannon (2004). A larger MILD regime is observed in the CH4/O2/CO2 mixtures. Conversely, the CH4/O2/N2 mixtures exhibit a narrower MILD regime. In the overall, CO2, H2O, and EGR-assisted methane mixtures have a broader operating range under the MILD combustion mode. Building upon the intriguing observations made in the previous section, the analysis focused on the borderlines between the no-combustion and MILD and MILD and HiTAC combustion regimes. On these borderlines, seven points for the analysis are selected, as depicted in Figures 8A–D. The data points extracted for the methane combustion regime diagrams presented in Figures 8A–D are compiled in Table 1 for further examination.
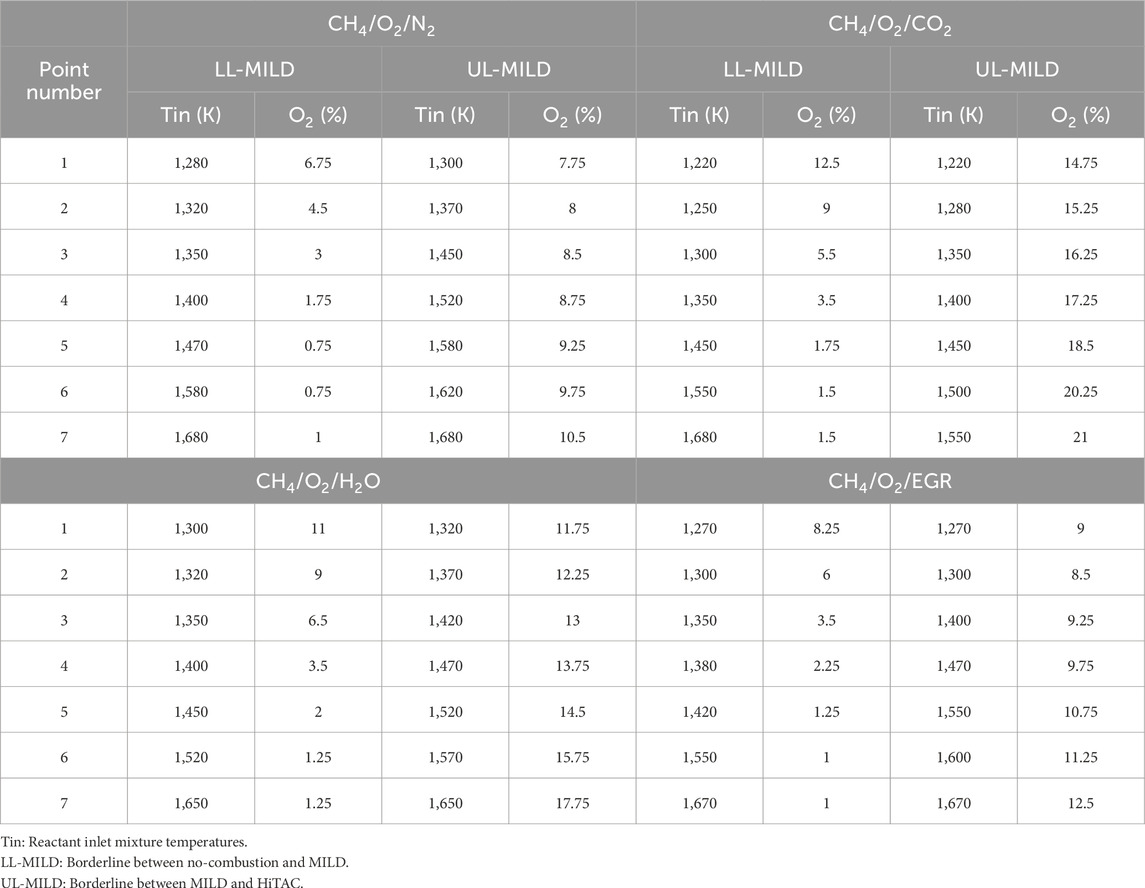
Table 1. Collected borderline points for methane mixtures.
The Ignition Delay Times (IDTs) for the selected borderline points are calculated through numerical simulations employing a 0D closed homogeneous reactor with the GRI Mech 3.0 mechanism. From the perspective of IDTs for the analysis purpose, the borderline between the no-combustion and MILD regimes represents the lower limit of the MILD regime (LL-MILD), while the borderline between the MILD and HiTAC regimes marks the upper limit of the MILD regime (UL-MILD).
Figures 9A–D shows the calculated ignition delay times (IDTs) for the various methane mixture scenarios. These IDTs are derived from the seven selected points, sequentially labelled one to seven, and represent how the IDTs are changing as a function of mixture temperature and oxygen dilution levels. The LL-MILD line signifies the boundary separating the no-combustion and MILD regimes, while UL-MILD marks the borderline between the MILD and HiTAC regimes. The UL-MILD IDTs for all methane mixture cases showed linear variation as the mixture temperatures increased along with a reduction in oxygen concentrations. Whereas UL-MILD IDTs showed consistent behaviour till the 5th point, where the inlet temperature (Tin) is less than or equal to 1500 K. This consistency underscores that the IDTs are uniform and stable in this specific temperature and oxygen concentration range for all methane mixtures studied in Figures 9A–D. On the other hand, the increase in the mixture temperatures is compensated by the reduction in the oxygen concentrations in the reactant mixture. This individual effect, especially from the oxygen concentration, is further detailed in the next sections.
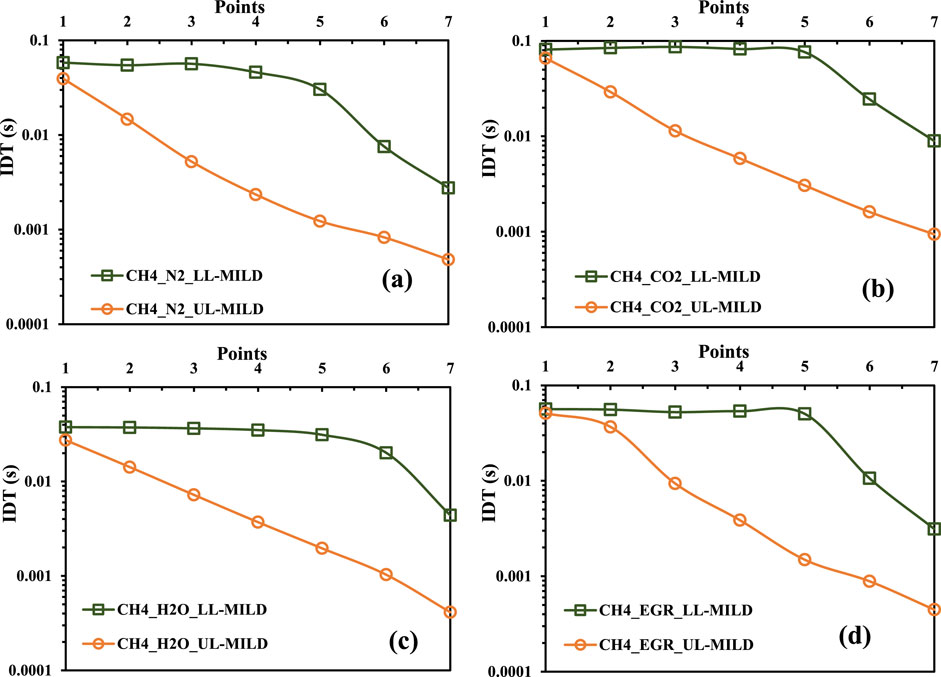
Figure 9. Ignition delay times for the collected points on the borderlines for methane mixtures with (A) N2, (B) CO2, (C) H2O, and (D) exhaust gas recirculation (EGR).
The variation in the no-combustion regime remains constant once the reactants’ temperature reaches 1500 K. In other words, with further reduction in the oxygen concentrations in the mixture at a given 1500 K reactant temperatures, the reactants are not burned within the considered PFR. However, a significant and abrupt change in ignition delay time is observed for points beyond a mixture temperature of 1500 K, as the reactant temperature is further increased at a constant O2 (points 6 and 7). On the other hand, at a fixed mixture temperature of 1500 K, the upper limit of the burned gas temperature in the MILD regime is approximately 2373 K. It is a well-established fact that, for hydrocarbon fuels, flame temperatures should be controlled within the range of 1900 K to reduce the emissions (Wünning and Wünning, 1997). Therefore, an analysis is made from an emissions perspective to gain a deeper understanding of MILD combustion characteristics, focusing on CO and NO emissions. This will be discussed in the next section of the present work. Notably, it is important to highlight that the UL-MILD IDTs do not exhibit a similar magnitude trend when compared to the LL-MILD IDTs. The difference in height between the LL-MILD and UL-MILD plots within a specific case serves as an indicator of the broad range of IDT magnitudes characterizing the MILD regime. For a given mixture temperature and O2 concentration in the mixture, the IDTs for CH4/O2/CO2 mixtures are lower than those for CH4/O2/H2O mixtures. However, the trend is reversed for LL-MILD (
Figure 10 shows the minimum and maximum ignition delay times (IDTs) observed in each scenario for LL-MILD and UL-MILD of methane regime diagrams. These IDTs play a crucial role in determining the optimal range for operating the MILD combustion. When an IDT exceeds the range identified as overlapping, it indicates no combustion. Conversely, if the IDT falls below the overlapping range, the mixture is more effective at generating high-temperature regions.
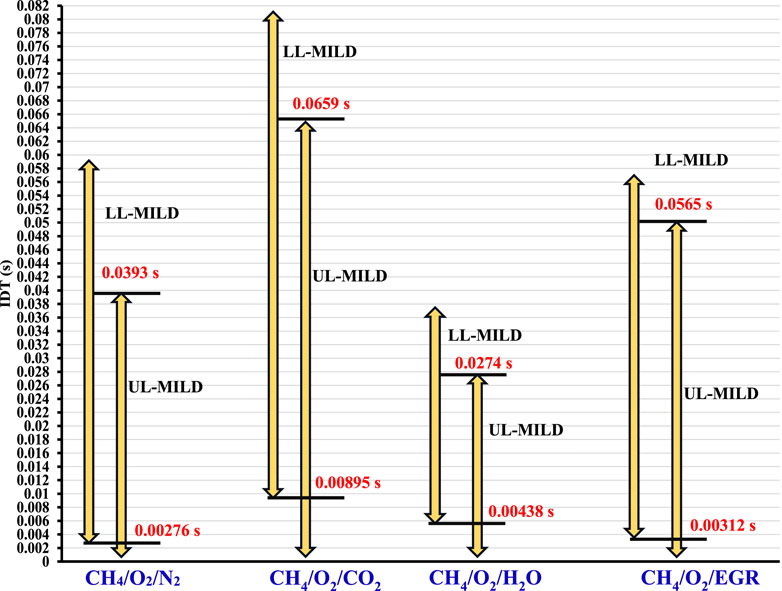
Figure 10. Minimum to maximum ranges of IDTs on LL-MILD and UL-MILD for the methane mixtures.
3.4 Hydrogen-assisted methane regime diagrams
In a manner similar to the methane combustion regime diagrams, combustion regime diagrams for hydrogen-assisted methane combustion are developed, incorporating N2, H2O, CO2, and EGR under highly preheated and diluted conditions, as illustrated in Figures 11A–D. For the computational simulations, methane and hydrogen are supplied in equal volumes in the fuel stream. The analysis for the hydrogen-assisted methane flame, including LL-MILD and UL-MILD points, follows a similar approach to the methane regime diagrams.
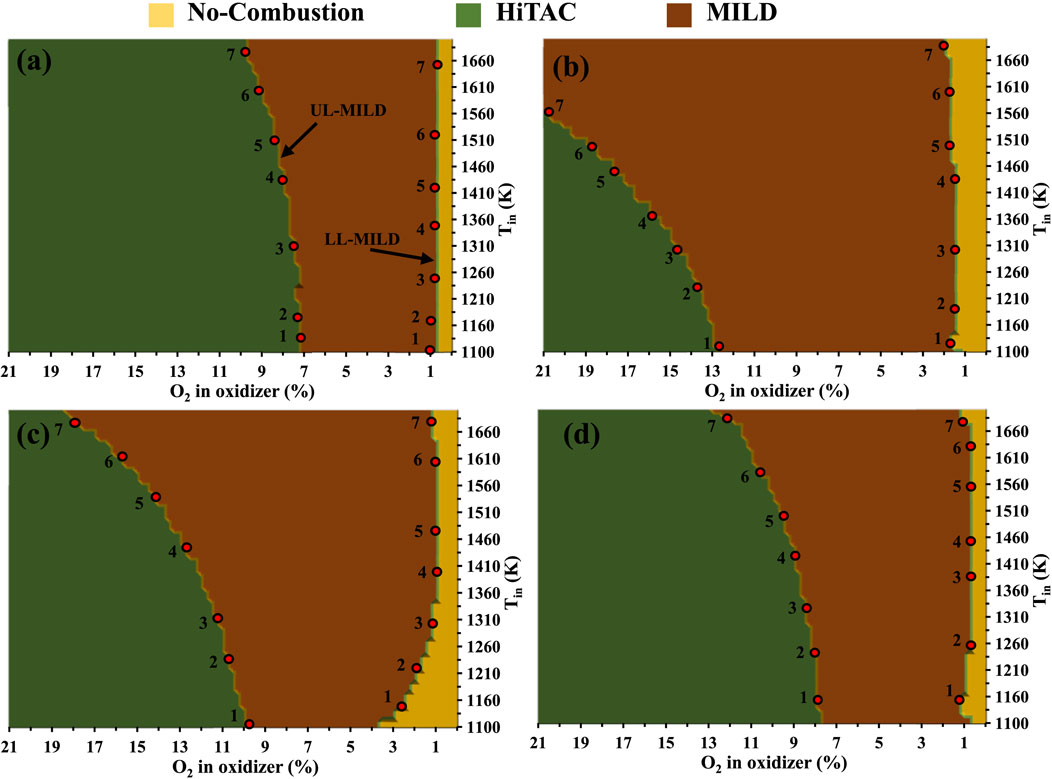
Figure 11. Combustion regime diagrams for hydrogen-assisted methane mixtures with (A) N2, (B) CO2, (C) H2O, and (D) exhaust gas recirculation (EGR).
The introduction of hydrogen into the methane flame across all scenarios leads to a significant reduction in the no-combustion region. This phenomenon can be attributed to the addition of highly flammable hydrogen, which extends the flammability range of the unburned mixture and subsequently results in shorter ignition delay times for the same volumetric flow rate. Among the four considered cases, the no-combustion region (O2 of 0.75%) is notably minimized in the CH4-H2/O2/N2 mixtures, as depicted in Figure 11A. In contrast, a larger no-combustion region is evident in the CH4-H2/O2/CO2 mixtures. This approach of enhancing or controlling flame combustion characteristics by introducing one fuel into another is referred to as fuel blending. While numerous studies have explored the blending of hydrogen into methane combustion, an in-depth examination of the MILD combustion operating range with hydrogen addition to methane mixtures through combustion regime diagrams is lacking in the existing literature. The current study aims to fill this gap by providing valuable insights into the feasibility of achieving MILD combustion through various techniques under atmospheric pressure. It is observed that the introduction of hydrogen into methane mixtures enhances the spread of the MILD combustion region for all the cases depicted in Figures 11A–D, except for CH4-H2/O2/N2 mixtures. Particularly noteworthy is the stabilization of MILD flames at lower mixture temperatures, which holds significant advantages from an application standpoint. Among the CH4-H2/O2/CO2, CH4-H2/O2/H2O, and CH4-H2/O2/EGR mixtures, it is observed that the CH4-H2/O2/CO2 mixture exhibits a well-controlled effect on the peak temperature generated in the considered PFR. To gain a deeper understanding of the boundaries within the hydrogen-methane mixtures, the LL-MILD and UL-MILD points have been collected and are presented in Table 2.
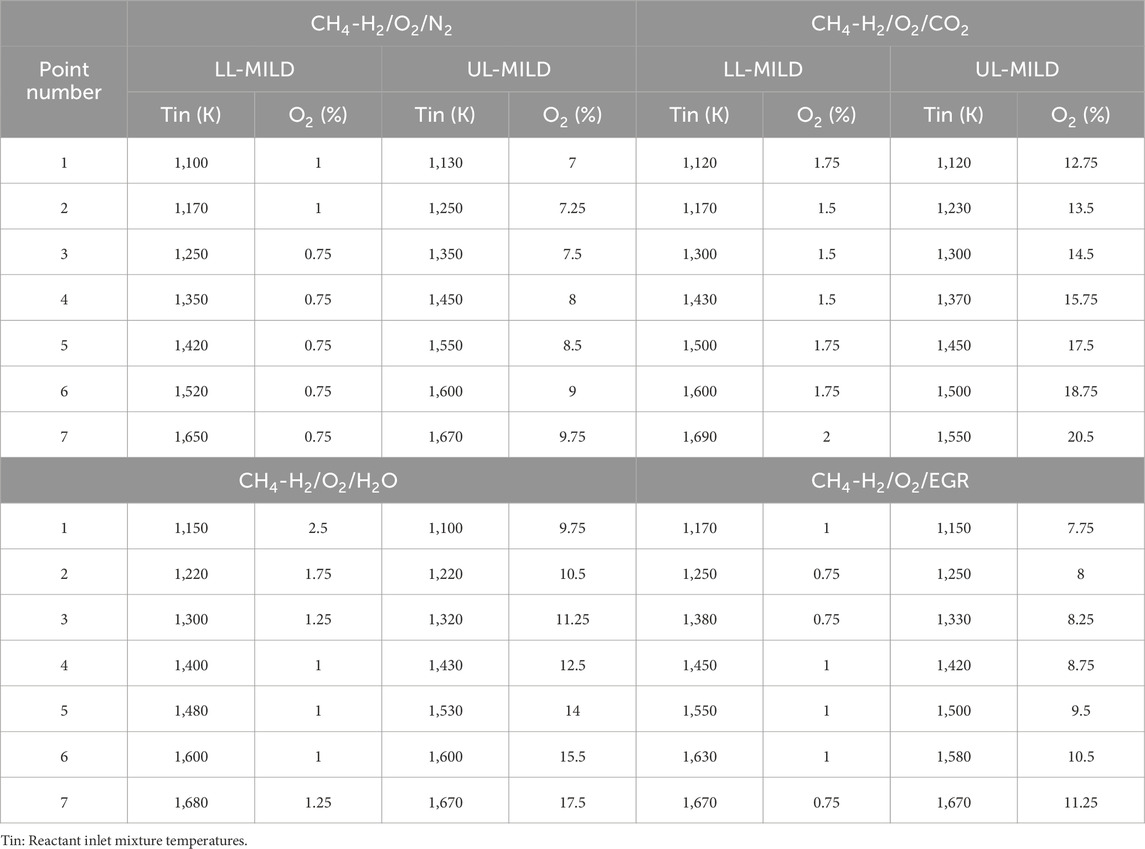
Table 2. Collected borderline points.
Following the established methodology used in prior cases, the ignition delay times (IDTs) for the extracted data points have been calculated. The resulting trends in IDT variations are visually depicted in Figures 12A–D for LL-MILD and UL-MILD in each of the considered scenarios. The consistency in the vertical distance separating the LL-MILD and UL-MILD regions holds true across a spectrum of mixture temperatures and various dilution levels. This consistent pattern provides valuable insights into the linear IDT behavior of the hydrogen-methane mixtures with an increase in mixture temperatures and a reduction in oxygen concentrations.
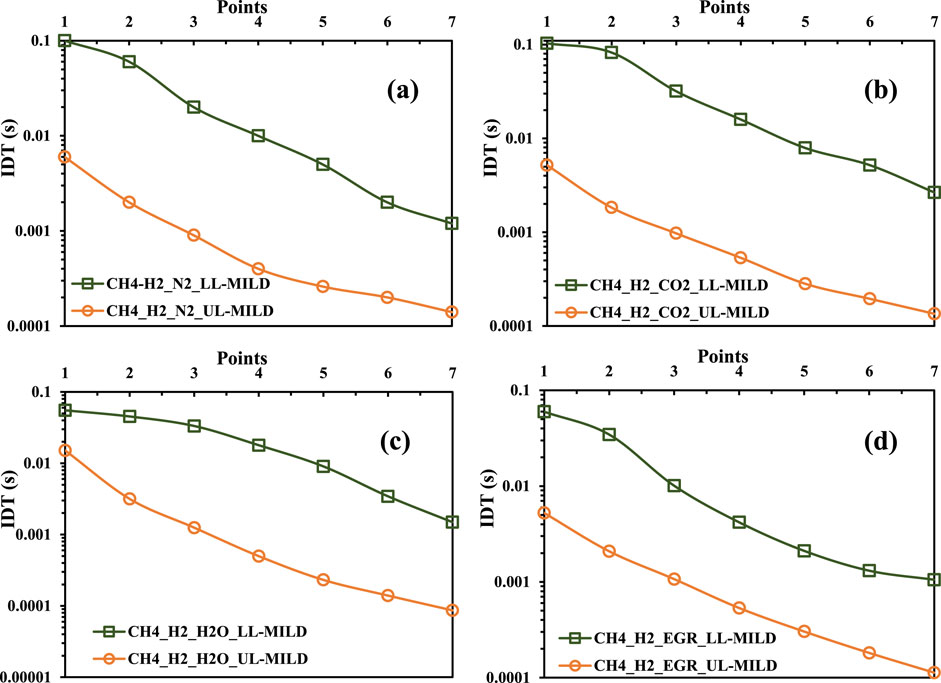
Figure 12. Ignition delay times for the collected points on the borderlines for hydrogen-assisted methane mixtures with (A) N2, (B) CO2, (C) H2O, and (D) exhaust gas recirculation (EGR).
Figure 13 provides a visual insight into the ignition delay times (IDTs) across the various scenarios considered. This overlap in IDTs holds significant implications, particularly for methane-hydrogen mixtures for UL-MILD, as it indicates the presence of a consistent operational range except for CH4-H2/O2/H2O mixtures. Within this range, the flames exhibit enhanced stability in the MILD combustion regime, allowing for precise control over the maximum flame temperature, a crucial factor in optimizing combustion processes.
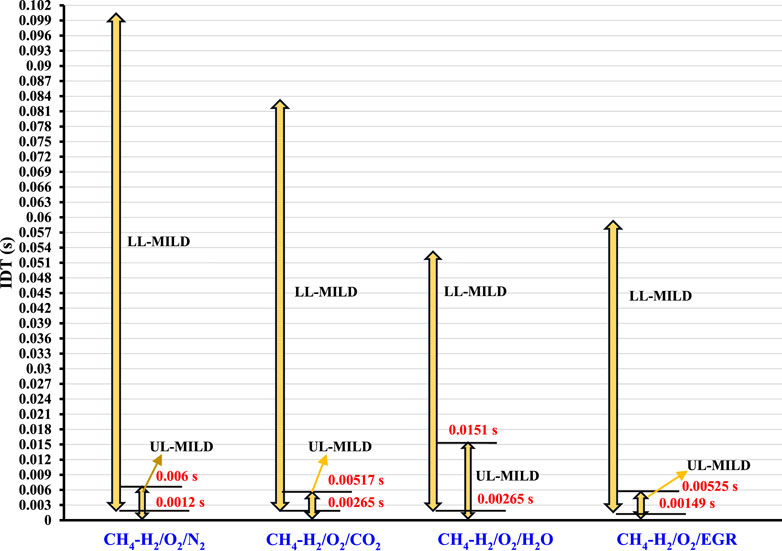
Figure 13. Minimum to maximum ranges of IDTs on LL-MILD and UL-MILD for the methane-hydrogen mixtures.
3.5 Factor of influence of O2 dilution level on MILD combustion
The analysis delves into the influence of oxygen concentration on MILD combustion characteristics, considering the presence of N2, CO2, H2O, and EGR over a range of preheating temperatures. To facilitate this investigation, data from the MILD regime extracted from each of the developed combustion diagrams are incorporated into a single plot. The extent of the MILD regime follows a specific order: CH4/O2/CO2 > CH4/O2/H2O > CH4/O2/EGR > CH4/O2/N2. Significantly, the minimum O2 concentration required to initiate combustion is observed in the following order at equivalent mixture temperatures: CH4/O2/CO2 (1.5%) > CH4/O2/H2O (1.25%) > CH4/O2/EGR (1%) > CH4/O2/N2 (0.75%). The reactivity of the fuel mixture is strongly influenced by the diluent conditions. For N₂-diluted cases, the minimum oxygen concentration required for flame initiation is the lowest, owing to nitrogen’s low specific heat capacity compared to other diluents. This trend follows the specific heat capacity of the diluent: the lower the heat capacity, the less oxygen is needed for flame initiation. In contrast, for H₂O dilution, although water has a high specific heat capacity, it contributes to an OH radical pool, which aids in flame stabilization. As a result, despite its higher heat capacity, H₂O dilution requires less oxygen for flame initiation than other diluents with lower radical generation. Thus, the above order of minimum oxygen requirement for flame initiation is observed. This order reflects the balance between the thermal effect of the diluents and their chemical role in radical formation and flame stabilization. To quantify the impact of O2 concentration on combustion characteristics concerning changes in mixture temperature, the authors considered the gradient of UL-MILD (dT/dO2). In essence, to measure the effect of O2 by measuring how the reduction in O2 dilution was compensated by the increase in mixture temperature at the UL-MILD borderline. Figure 14 reveals that the gradient or slope of the UL-MILD line signifies the oxygen concentration sensitivity. For the CH4/O2/N2 regime diagram, altering the O2 concentration from 7.75% to 10.5% (a difference of 2.75%) resulted in a shift in mixture temperature from 1270 K to 1700 K (a difference of 430 K) for maintaining the flame within the MILD regime. The average gradient along the UL-MILD borderline of the CH4/O2/N2 regime diagram is 156 K. Similarly, the gradients along the UL-MILD borderlines for the CH4/O2/CO2, CH4/O2/H2O, and CH4/O2/EGR regime diagrams are 54 K, 51 K, and 143 K, respectively. A larger gradient signifies a stronger influence of O2 on the respective fuel mixture. The impact of O2 is notably higher and consistent for the CH4/O2/N2 and CH4/O2/EGR flames at higher mixture temperatures (above 1300 K), while it is lower and relatively similar for both CH4/O2/CO2 and CH4/O2/H2O mixtures. In all the examined cases of methane mixtures, stable MILD combustion flames are observed, with mixture temperatures ranging from 1450 K to 1700 K and oxygen dilution percentages between 2.5% and 7.5%. A similar kind of behavior is observed for the methane-hydrogen mixtures.
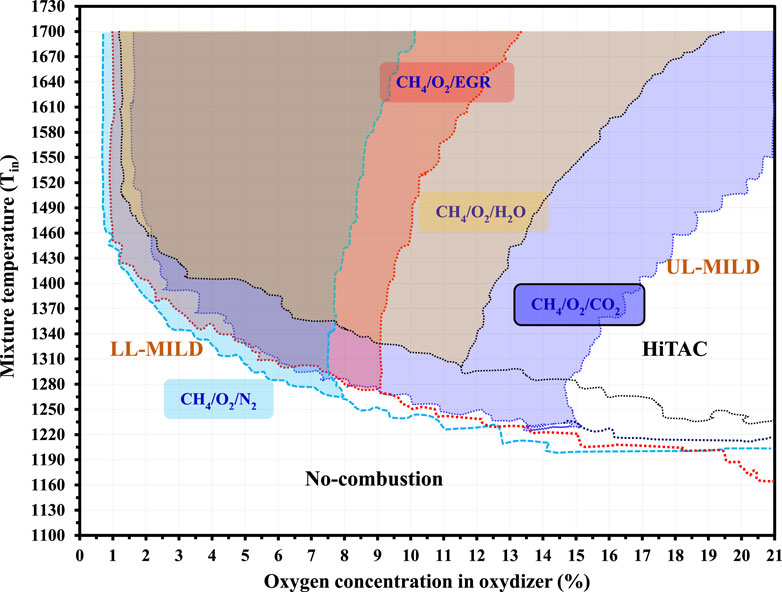
Figure 14. Comparison of the MILD regimes of methane flames.
3.6 Emission-based analysis
3.6.1 Analysis of NO emissions
The regime diagrams developed under the influence of CO2 and H2O do not contain NO, as these mixtures do not contain the N radical. Consequently, NO levels in the LL-MILD and UL-MILD borders of methane and methane-hydrogen regime diagrams with N2 and EGR are analyzed in Figure 15. The black horizontal dashed line in Figure 15 represents the upper limit of NO emissions for the MILD regime (lower limit of the IDT), as mentioned in the previous section regarding the overlapping region (Figures 10, 13). Notably, NO production in the MILD regime is observed after the mixture temperature exceeds 1500 K. Therefore, while achieving MILD combustion is possible at higher mixture temperatures, it is advisable to limit preheating temperatures to around or lower than 1300 K to control NO production from the methane flames. The NO emissions are primarily attributed to the elevated temperatures within the burner for higher mixture temperature cases. The NO levels in the overlapping IDT region are nearly identical for both methane and hydrogen-assisted methane mixtures in both EGR and N2 cases. The mechanism of NOx formation under MILD combustion conditions has been extensively reported in the literature (Iavarone and Parente, 2020; Mardani and Tabejamaat, 2012).
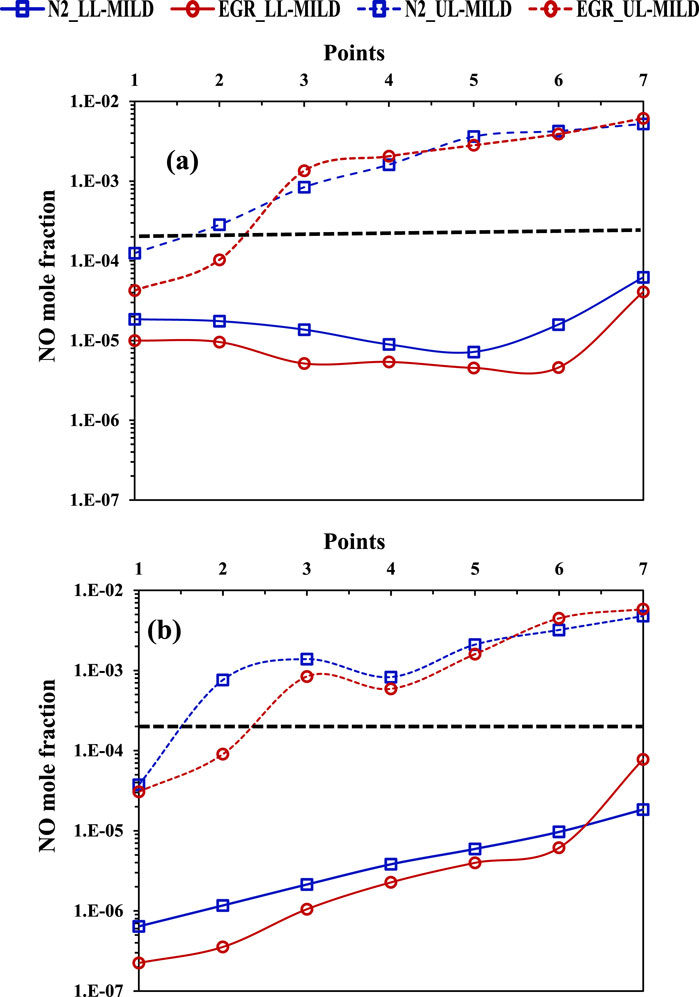
Figure 15. Mole fraction of NO at LL-MILD and UL-MILD of the (A) methane and (B) methane-hydrogen combustion regime diagrams.
3.6.2 Analysis of CO emissions
Figure 16 illustrates the CO variation at the LL-MILD and UL-MILD borders for both methane and hydrogen-assisted methane flames under the influence of N2, CO2, H2O, and EGR. The UL-MILD border points for both methane and hydrogen-assisted methane combustion regimes exhibit a linear variation along the border (points from 1 to 7) in all the considered cases. In the methane regime diagram, the LL-MILD border points show a reduction in CO emissions with increasing mixture temperature. However, this trend is altered for the UL-MILD border points (Figure 16A). CO emissions are slightly higher in the case of hydrogen-assisted methane flames with CO2 influence under highly diluted conditions. On the other hand, CO emissions are lower with the hydrogen-assisted methane flames. Similar to NO emissions, CO emissions are more significant at higher mixture temperatures.
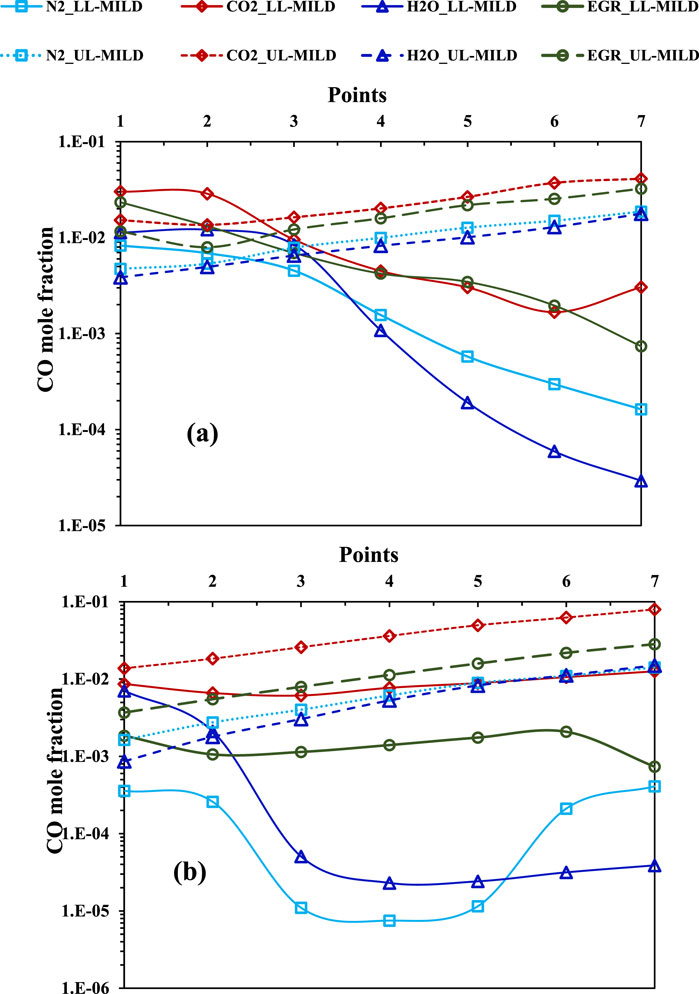
Figure 16. Mole fraction of CO at LL-MILD and UL-MILD of the (A) methane and (B) methane-hydrogen (right side) combustion regime diagrams.
3.7 Overall flame behavior
This section analyzes the flame behavior at the lowest and highest points within the LL-MILD (Lower Limit MILD) and UL-MILD (Upper Limit MILD) regimes for all the considered cases. The goal is to examine how the flame front behaves at these extreme points on the lower and upper boundaries of the combustion regimes.
Figure 17 presents the temperature distributions for the first and last selected data points along the upper and lower MILD boundary lines. Flames LL1 and UL1 show moderate peak temperatures, with the mixture temperatures ranging between 1,100 and 1300 K. Consequently, the peak temperatures remain below 1800 K, which helps reduce NO emissions. Additionally, the oxygen concentration lies between 7% and 15%, further limiting NO formation by suppressing HNO production. In the case of LL7, the mixture temperature rises to around 1,600–1700 K, but the oxygen concentration drops to below 1.5%. Due to this limited oxygen availability at high temperatures, the observed temperature difference (ΔT) is within 200 K, resulting in a well-distributed temperature profile. On the other hand, in UL7, the mixture temperatures are similar to those in LL7, but the oxygen concentration exceeds 10%. As a result, peak temperatures reach nearly 2200 K. Although these conditions still fall within the MILD regime based on the ΔT criterion, the elevated temperatures lead to significantly higher thermal NOx formation compared to other flames. These trends remain consistent across all diluted cases shown in Figure 17. Among the diluted flames, those with CO₂ dilution show the smallest increase in temperature compared to other diluents. However, across all cases, no localized temperature peaks are observed once the flame stabilizes, confirming the MILD flame characteristics.
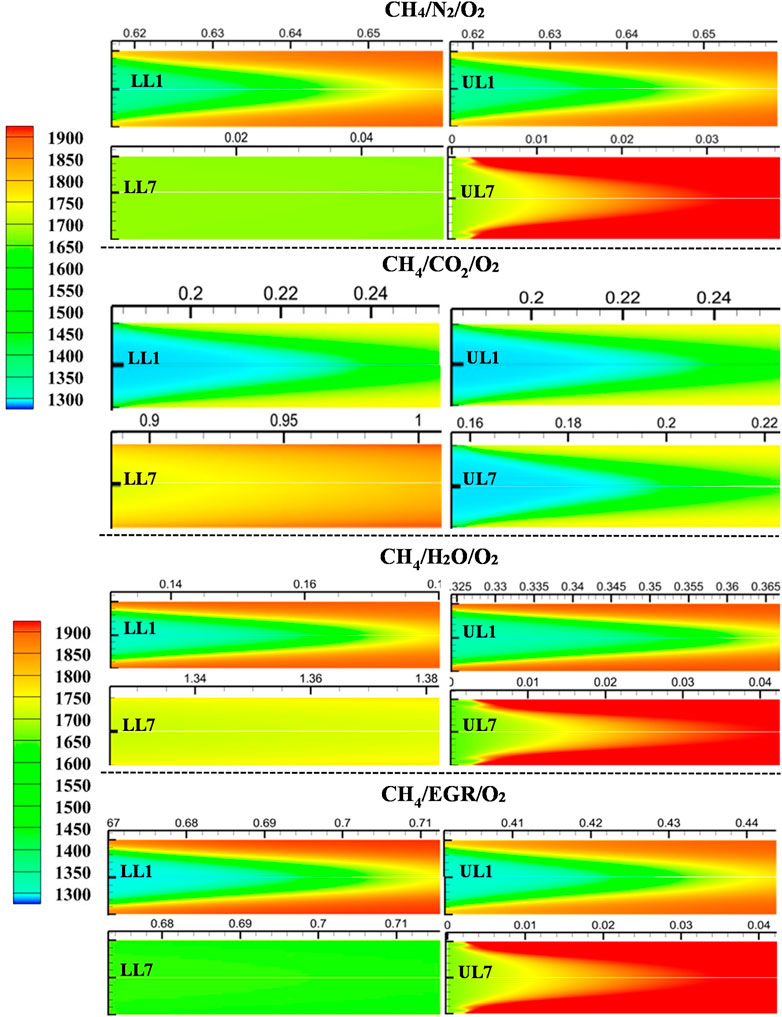
Figure 17. Temperature distribution at the flame initiating point for methane mixtures with all the diluted conditions. Here, LL1, LL2, UL1, and UL2 are given as per the tabulated selected mixture from the lower limit and upper limit of the MILD regimes.
Based on these observations and the findings discussed in earlier sections, it is recommended to maintain the ignition delay time within the range defined between LL7 and UL1. This range corresponds to the overlapping ignition delay times identified in previous sections, ensuring stable operation within the MILD regime with low emissions.
Similarly, hydrogen-blended methane mixtures were analyzed under various dilution conditions. Figure 18 illustrates the temperature distributions for the first and last selected data points along the upper and lower MILD boundary lines in the methane-hydrogen mixture regime diagrams.
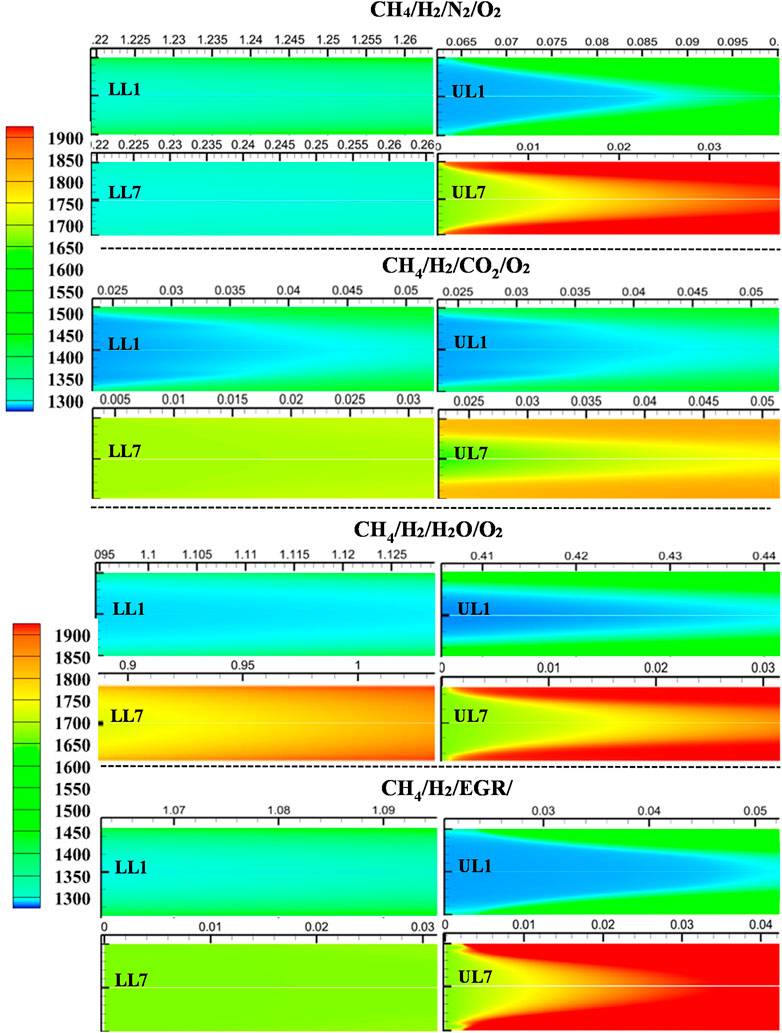
Figure 18. Temperature distribution at the flame initiating point for methane-hydrogen mixtures with all the diluted conditions. Here, LL1, LL2, UL1, and UL2 are given as per the tabulated selected mixture from the lower limit and upper limit of the MILD regimes.
The addition of hydrogen led to a decrease in the rise of peak temperatures across all cases. This reduction in temperature increments within the domain further contributed to lower NO emissions, as peak temperatures play a critical role in NO formation. Furthermore, hydrogen addition led to earlier flame initiation for the respective diluted cases, enhancing ignition stability and improving combustion performance.
4 Conclusion
In the present study, a detailed investigation is conducted on combustion regime diagrams, with a focus on the MILD combustion regime and its interaction with other regimes. Initially analyzed the border point of various combustion regime diagrams available in the literature. Based on the observation, the borderline between the MILD and no-combustion regimes results in the same magnitude of ignition delay time for a given fuel mixture. To further investigate a detailed analysis of a particular fuel under the influences of the various techniques available for stabilizing the flame in the MILD regime. Methane fuel is selected for the development of the combustion regime diagrams with the blending of hydrogen (50% volume) and influence by N2, CO2, H2O, and EGR with the function of oxygen dilution and mixture temperature. A detailed analysis is conducted on the borderlines of the LL-MILD (interaction between no-combustion and MILD) and UL-MILD (interaction between the MILD and HiTAC). In addition to the criteria established in the literature for identifying the MILD combustion regime, an investigation is conducted by considered ignition delay time as a key parameter while emissions also keep into the account. An overlapped region is developed based on the LL-MILD and UL-MILD. The emissions of NO and CO are analyzed, and it is observed that lower NO and CO emissions are identified in the overlapped ignition delay times. In addition, O2 influence on the various considered techniques for achieving the MILD combustion analyzed. The ranges of ignition delay times (overlapped region) are proposed for achieving the better combustion characteristics of MILD combustion. The proposed ranges of the ignition delay times are reported in Table 3.
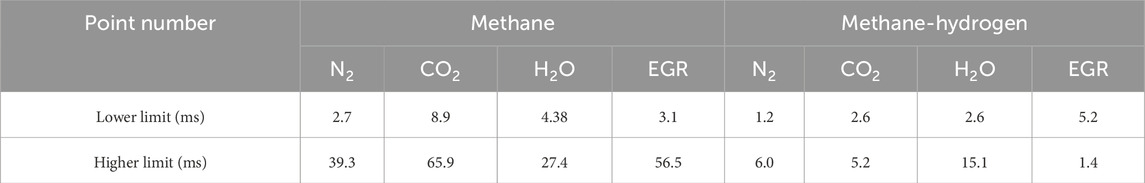
Table 3. Proposed ignition delay time ranges for achieving MILD combustion regime with lower emissions.
Data availability statement
The raw data supporting the conclusions of this article will be made available by the authors, without undue reservation.
Author contributions
MS: Conceptualization, Data curation, Investigation, Software, Validation, Writing–original draft, Writing–review and editing. GS: Formal Analysis, Methodology, Writing–original draft, Writing–review and editing. VM: Resources, Software, Visualization, Writing–original draft, Writing–review and editing.
Funding
The author(s) declare that no financial support was received for the research, authorship, and/or publication of this article.
Acknowledgments
The authors would like to acknowledge the support from the Prime Minister Research Fellowship (PMRF) and the Indian Institute of Technology Kharagpur.
Conflict of interest
The authors declare that the research was conducted in the absence of any commercial or financial relationships that could be construed as a potential conflict of interest.
The author(s) declared that they were an editorial board member of Frontiers, at the time of submission. This had no impact on the peer review process and the final decision.
Generative AI statement
The author(s) declare that no Generative AI was used in the creation of this manuscript.
Publisher’s note
All claims expressed in this article are solely those of the authors and do not necessarily represent those of their affiliated organizations, or those of the publisher, the editors and the reviewers. Any product that may be evaluated in this article, or claim that may be made by its manufacturer, is not guaranteed or endorsed by the publisher.
References
Arghode, V. K., and Gupta, A. K. (2011). Development of high intensity CDC combustor for gas turbine engines. Appl. Energy 88, 963–973. doi:10.1016/j.apenergy.2010.07.038
Ariemma, G. B., Sorrentino, G., Sabia, P., Ragucci, R., and de Joannon, M. (2023). MILD combustion of methanol, ethanol and 1-butanol binary blends with ammonia. Proc. Combust. Inst. 39, 4509–4517. doi:10.1016/j.proci.2022.08.032
Bechtel, J. H. (1979). Temperature measurements of the hydroxyl radical and molecular nitrogen in premixed, laminar flames by laser techniques. Appl. Opt. 18 (13), 2100. doi:10.1364/AO.18.002100
Bechtel, J. H., Blint, R. J., Dasch, C. J., and Weinberger, D. A. (1981). Atmospheric pressure premixed hydrocarbon-air flames: theory and experiment. Combust. Flame 42, 197–213. doi:10.1016/0010-2180(81)90158-9
Cavaliere, A., and De Joannon, M. (2004). Mild combustion. Prog. Energy Combust. Sci. 30, 329–366. doi:10.1016/j.pecs.2004.02.003
Cavigiolo, A., Galbiati, M. A., Effuggi, A., Gelosa, D., and Rota, R. (2003). Mild combustion in a laboratory-scale apparatus. Combust. Sci. Technol. 175 (8), 1347–1367. doi:10.1080/00102200302356
Christo, F. C., and Dally, B. B. (2005). Modeling turbulent reacting jets issuing into a hot and diluted coflow. Combust. Flame 142, 117–129. doi:10.1016/j.combustflame.2005.03.002
Dally, B. B., Karpetis, A. N., and Barlow, R. S. (2002). Structure of turbulent non-premixed jet flames in a diluted hot coflow. Proc. Combust. Inst. 29 (1), 1147–1154. doi:10.1016/S1540-7489(02)80145-6
Darbyshire, O. R., and Swaminathan, N. (2012). A presumed joint pdf model for turbulent combustion with varying equivalence ratio. Combust. Sci. Technol. 184, 2036–2067. doi:10.1080/00102202.2012.696566
de Joannon, M., Sorrentino, G., and Cavaliere, A. (2012). MILD combustion in diffusion-controlled regimes of Hot Diluted Fuel. Combust. Flame 159, 1832–1839. doi:10.1016/j.combustflame.2012.01.013
Ebrahimi Fordoei, E., and Mazaheri, K. (2021). Effects of preheating temperature and dilution level of oxidizer, fuel composition and strain rate on NO emission characteristics in the syngas moderate or intense low oxygen dilution (MILD) combustion. Fuel 285, 119118. doi:10.1016/j.fuel.2020.119118
Galletti, C., Parente, A., and Tognotti, L. (2017). Numerical and experimental investigation of a mild combustion burner. Combust. Flame 151, 649–664. doi:10.1016/j.combustflame.2007.07.016
Garnayak, S., Elbaz, A. M., Kuti, O., Dash, S. K., Roberts, W. L., and Reddy, V. M. (2022). Auto-ignition and numerical analysis on high-pressure combustion of premixed methane-air mixtures in highly preheated and diluted environment. Combust. Sci. Technol. 194, 3132–3154. doi:10.1080/00102202.2021.1909579
Garnayak, S., Sharma, D., Dash, S. K., and Reddy, V. M. (2023). Numerical and chemical kinetic analyses on the formation of CO and CO2 for C1-C4 hydrocarbon alkanes in a hot Co-flow under MILD combustion. Energy Fuels 37, 2275–2293. doi:10.1021/acs.energyfuels.2c02700
Giuntini, L., Frascino, L., Ariemma, G. B., Galletti, C., Sorrentino, G., and Ragucci, R. (2023). Performance assessment of modeling approaches for moderate or intense low-oxygen dilution combustion in a scale-bridging burner. Energy Fuels 37, 9500–9513. doi:10.1021/acs.energyfuels.3c00597
Iavarone, S., and Parente, A. (2020). NO x formation in MILD combustion: potential and limitations of existing approaches in CFD. Front. Mech. Eng. 6, 13. doi:10.3389/fmech.2020.00013
Katsuki, M., and Hasegawa, T. (1998). The science and technology of combustion in highly preheated air. Symp. Combust. 27, 3135–3146. doi:10.1016/S0082-0784(98)80176-8
Kim, N., Kim, Y., Jaafar, M. N. M., Rahim, M. R., and Said, M. (2021). Effects of hydrogen addition on structure and NO formation of highly CO-Rich syngas counterflow nonpremixed flames under MILD combustion regime. Int. J. Hydrogen Energy 46, 10518–10534. doi:10.1016/j.ijhydene.2020.12.120
Kumar, S., Paul, P. J., and Mukunda, H. S. (2002). Studies on a new high-intensity low-emission burner. Proc. Combust. Inst. 29, 1131–1137. doi:10.1016/S1540-7489(02)80143-2
Mahendra Reddy, V., Sawant, D., Trivedi, D., and Kumar, S. (2013). Studies on a liquid fuel based two stage flameless combustor. Proc. Combust. Inst. 34, 3319–3326. doi:10.1016/j.proci.2012.06.028
Mardani, A., and Fazlollahi Ghomshi, A. (2016). Numerical study of oxy-fuel MILD (moderate or intense low-oxygen dilution combustion) combustion for CH4-H2 fuel. Energy 99, 136–151. doi:10.1016/j.energy.2016.01.016
Mardani, A., and Karimi Motaalegh Mahalegi, H. (2019). Hydrogen enrichment of methane and syngas for MILD combustion. Int. J. Hydrogen Energy 44, 9423–9437. doi:10.1016/j.ijhydene.2019.02.072
Mardani, A., and Tabejamaat, S. (2012). NOx formation in H2-CH4 blended flame under MILD conditions. Combust. Sci. Technol. 184 (7-8), 995–1010. doi:10.1080/00102202.2012.663991
Mardani, A., Tabejamaat, S., and Hassanpour, S. (2013). Numerical study of CO and CO2 formation in CH4/H2 blended flame under MILD condition. Combust. Flame 160, 1636–1649. doi:10.1016/j.combustflame.2013.04.003
Rao, A. G., and Levy, Y. (2010). “A new combustion methodology for low emission gas turbine engines,” in 8th HiTACG Conference, January, 2010.
Reddy, V. M., Katoch, A., Roberts, W. L., and Kumar, S. (2015). Experimental and numerical analysis for high intensity swirl based ultra-low emission flameless combustor operating with liquid fuels. Proc. Combust. Inst. 35, 3581–3589. doi:10.1016/j.proci.2014.05.070
Sabia, P., de Joannon, M., Picarelli, A., and Ragucci, R. (2013). Methane auto-ignition delay times and oxidation regimes in MILD combustion at atmospheric pressure. Combust. Flame 160, 47–55. doi:10.1016/j.combustflame.2012.09.015
Sabia, P., de Joannon, M., Sorrentino, G., Giudicianni, P., and Ragucci, R. (2015). Effects of mixture composition, dilution level and pressure on auto-ignition delay times of propane mixtures. Chem. Eng. J. 277, 324–333. doi:10.1016/j.cej.2015.04.143
Sabia, P., Lubrano Lavadera, M., Sorrentino, G., Giudicianni, P., Ragucci, R., and de Joannon, M. (2016). H2O and CO2 dilution in MILD combustion of simple hydrocarbons. Turbul. Combust. 96, 433–448. doi:10.1007/s10494-015-9667-4
Sabia, P., Manna, M. V., Ariemma, G. B., Sorrentino, G., Ragucci, R., and de Joannon, M. (2023). Novel insights into mild combustion processes through analyses of hysteresis behavior. Proc. Combust. Inst. 39, 4501–4507. doi:10.1016/j.proci.2022.08.011
Sabia, P., Sorrentino, G., Ariemma, G. B., Manna, M. V., Ragucci, R., and de Joannon, M. (2021). MILD combustion and biofuels: a minireview. Energy Fuels 35, 19901–19919. doi:10.1021/acs.energyfuels.1c02973
Sharma, S., Pingulkar, H., Chowdhury, A., and Kumar, S. (2018). A new emission reduction approach in MILD combustion through asymmetric fuel injection. Combust. Flame 193, 61–75. doi:10.1016/j.combustflame.2018.03.008
Sorrentino, G., Göktolga, U., de Joannon, M., Van Oijen, J., Cavaliere, A., and De Goey, P. (2017). An experimental and numerical study of MILD combustion in a Cyclonic burner. Energy Procedia 120, 649–656. doi:10.1016/j.egypro.2017.07.173
Sorrentino, G., Sabia, P., Ariemma, G. B., Ragucci, R., and de Joannon, M. (2021). Reactive structures of ammonia MILD combustion in diffusion ignition processes. Front. Energy Res. 9. doi:10.3389/fenrg.2021.649141
Sorrentino, G., Sabia, P., de Joannon, M., Cavaliere, A., and Ragucci, R. (2016). The effect of diluent on the sustainability of MILD combustion in a cyclonic burner. Turbul. Combust. 96, 449–468. doi:10.1007/s10494-015-9668-3
Sorrentino, G., Sabia, P., de Joannon, M., Ragucci, R., Cavaliere, A., Göktolga, U., et al. (2015). Development of a novel cyclonic flow combustion chamber for achieving MILD/flameless combustion. Phys. Procedia 66, 141–144. doi:10.1016/j.egypro.2015.02.079
Srinivasarao, M., Jun, D., Jik, B., and Reddy, V. M. (2023). International Journal of Hydrogen Energy Numerical analysis of the enrichment of CH 4/H 2 in ammonia combustion in a hot co-flow environment. Int. J. Hydrogen Energy. doi:10.1016/j.ijhydene.2023.11.160
Srinivasarao, M., Lee, B. J., and Reddy, V. M. (2024). Modified reacting solver: a simplified approach for capturing the molecular and flow diffusivities for the nonpremixed MILD flames. ACS Omega 9, 15804–15817. doi:10.1021/acsomega.3c07212
Srinivasarao, M., and Reddy, V. M. (2024). Effect of thermodiffusion on non premixed flame in MILD regime using a modified reacting solver. Solver 74, 173–180. doi:10.14429/dsj.74.19627
Stephenson, D. A. (1979). Non-intrusive profiles of atmospheric premixed hydrocarbon-air flames. Symp. (Int.) Combust. 17 (1), 993–999. doi:10.1016/S0082-0784(79)80096-X
Tu, Y., Xu, S., Xu, M., Liu, H., and Yang, W. (2020). Numerical study of methane combustion under moderate or intense low-oxygen dilution regime at elevated pressure conditions up to 8 atm. Energy 197, 117158.
Wünning, J. A., and Wünning, J. G. (1997). Flameless oxidation to reduce thermal no-formation. Prog. Energy Combust. Sci. 23, 81–94. doi:10.1016/s0360-1285(97)00006-3
Keywords: combustion regime diagrams, MILD combustion, ignition delay time, emissions, chemkin
Citation: Srinivasarao M, Sorrentino G and Mahendra Reddy V (2024) Investigation of the interaction of the MILD regime with HiTAC and no-combustion regimes in combustion region diagrams. Front. Energy Res. 12:1503787. doi: 10.3389/fenrg.2024.1503787
Received: 29 September 2024; Accepted: 31 October 2024;
Published: 14 November 2024.
Edited by:
Jinlong Liu, Zhejiang University, ChinaReviewed by:
Tianfang Xie, Purdue University, United StatesJunqing Zhu, ExxonMobil Research and Engineering, United States
Nan Zhang, University of West Florida, United States
Copyright © 2024 Srinivasarao, Sorrentino and Mahendra Reddy. This is an open-access article distributed under the terms of the Creative Commons Attribution License (CC BY). The use, distribution or reproduction in other forums is permitted, provided the original author(s) and the copyright owner(s) are credited and that the original publication in this journal is cited, in accordance with accepted academic practice. No use, distribution or reproduction is permitted which does not comply with these terms.
*Correspondence: V. Mahendra Reddy, bWFoZW5kcmFAaWl0a2dwLmFjLmlu; Giancarlo Sorrentino, Z2lhbmNhcmxvLnNvcnJlbnRpbm9Ac3RlbXMuY25yLml0