 Ezhilmaran Devarasan
 Deepikaa Nagarajan
 Jenisha Rachel1
- 1Department of Mathematics, Vellore Institute of Technology, Vellore, Tamilnadu, India
- 2P.G. Student in Business Statistics, Vellore Institute of Technology, Vellore, Tamilnadu, India
India, as a rapidly growing country facing significant pollution challenges, sees a major opportunity for sustainable mobility through the adoption of electric vehicles. Since a large amount of India’s crude oil is imported, the country is vulnerable to changes in the price of crude oil globally. India may improve its energy security and lessen its reliance on imported fossil fuels by switching to electric vehicles (EVs) that are powered by electricity generated domestically. Air pollution from internal combustion engine vehicles is a contributing factor to several health issues, such as heart disease and respiratory disorders. Making the switch to EVs can result in better public health outcomes and cleaner air. This study offers an in-depth analysis of India’s Electric Vehicle (EV) market dynamics from FY 2014 to February 2024, utilizing machine learning techniques to identify sales trends, regional disparities, and adoption drivers. Through meticulous examination, the research aims to elucidate sales trends, regional variations, and underlying factors influencing EV adoption across the nation. Objectives include analysing sales trajectories over the past decade, estimating EV sales across states, exploring category-specific trends, identifying drivers of regional disparities, investigating EV adoption patterns in the Tamil Nadu, evaluating the advantages and disadvantages of EVs. With a particular interest in analyzing the complex dynamics of charging infrastructure in cities, this study extensively examines EV adoption in India. By using data-driven insights, this research aims to contribute to a deeper understanding of the dynamics shaping the EV landscape in India and provide valuable guidance for stakeholders, industry participants and policymakers on how to promote the country’s electric mobility sector’s sustainable growth.
1 Introduction
Electric Vehicles (EVs) represent a major shift in the automotive industry, providing cleaner, more efficient, and sustainable transportation. Unlike traditional internal combustion engine vehicles that rely on fossil fuels, EVs are powered by electricity, either from onboard batteries or through external charging sources. The shift toward EV adoption is driven by growing concerns over climate change, air pollution, and fossil fuel depletion. EVs come in various forms, including electric cars, electric buses, electric scooters, electric bicycles, and so on
Research on electric vehicle (EV) adoption highlights several key factors across various regions. In Korea, consumer attitudes towards EVs are significantly influenced by familiarity with EV driving, household vehicle count, educational attainment, parking availability, and perceptions of government incentives (Kim et al., 2019). In India, financial, societal, technological, and environmental factors play a role in shaping EV adoption. The focus is on expanding charging infrastructure and educating the public about EV benefits, with predictions indicating market growth despite challenges (Kalita and Hussain, 2021). A deeper examination of the Indian EV market using machine learning identifies key influences such as demographics, financial considerations, and environmental awareness, while also stressing the importance of government policies for boosting adoption (Dixit and Singh, 2022). In Europe, the expansion of EV markets hinges on technological advancements, policy support, and collaboration between governments and businesses, with an emphasis on improving battery technology and charging infrastructure to further market growth (Razmjoo et al., 2022). In India, financial incentives, charging infrastructure, environmental concerns, and social reinforcement are key determinants of EV adoption, with pricing emerging as the most significant driver, as shown through SEM and CFA analyses (Ali and Naushad, 2022). Further studies into consumer perspectives in India highlight cost and charging infrastructure as primary barriers to widespread adoption, recommending that policymakers focus on overcoming these challenges to foster a sustainable transportation network (Singh, 2023). Addressing air pollution and emissions reduction through EV adoption is critical for India, with rising fossil fuel prices, consumer awareness, and government initiatives expected to drive increased EV sales, contributing to achieving net-zero emissions by 2070 (Infanto et al., 2023).
The literature also reviews the adoption of EVs, identifying air pollution reduction as a key motivator, while high purchase costs and limited driving range remain significant barriers. Rapid charging and battery improvements are proposed as solutions to accelerate EV adoption (Pamidimukkala et al., 2024). Surveys conducted in Europe, particularly in Finland, Austria, Spain, and Italy, show positive attitudes towards light-duty electric vehicles (LEVs) among users, with recommendations for increasing awareness among non-users to further drive adoption (Mesimäki and Lehtonen, 2023). In Maharashtra, India, strategic placement of EV chargers is critical for promoting sustainable mobility. Researchers identified prime locations like Mumbai, Thane, and Pune through predictive models, contributing to the development of EV infrastructure in densely populated urban areas (Chandra et al., 2023). Similarly, research from Spain developed a model to optimize charging stations on highways by analyzing factors like road slope and weather, thereby facilitating long-distance EV travel (Saldarini et al., 2023). Accurate power usage prediction for charging stations is also essential for infrastructure planning, with models like SARIMA providing valuable insights into energy consumption patterns, supporting sustainable EV network development (Akshay et al., 2024).
Innovations in battery technologies and hybrid energy storage systems (HESS) are crucial for improving electric vehicle (EV) efficiency and sustainability. HESS, combined with machine learning (ML) control, optimizes energy use from renewable sources, ensuring stable performance under varying conditions (Punyavathi et al., 2024). Vehicle-to-grid (V2G) systems, coupled with power management strategies, enhance EV integration into sustainable transit networks (Agarwal et al., 2024). Machine learning models like Random Forest and Lasso Regression effectively predict EV sales and market trends, enabling manufacturers to tailor strategies to consumer needs (Khusanboev et al., 2023; Yeh and Wang, 2023). Research shows factors such as CO2 emissions and renewable energy availability significantly influence EV sales, linking environmental policies to market dynamics (Yeh and Wang, 2023). Additionally, marketing strategies targeting psychographic and behavioral market segments, especially in regions with sustainability-conscious consumers, are vital for boosting EV adoption (Tripathy et al., 2023; Kautish et al., 2024). Machine learning frameworks like Light GBM help predict household EV adoption, enabling manufacturers to target potential buyers effectively (Dai and Zhang, 2023). The shift to EVs is critical for achieving global climate targets and reducing dependence on fossil fuels, with research increasingly focused on key areas such as charging infrastructure, EV adoption, thermal management, and routing problems. The development of wireless charging systems, advancements in AI-driven sustainable transportation solutions, and predictive maintenance models for EV batteries further illustrate the breadth of technological progress aimed at enhancing EV performance and market adoption (Miconi and Dimitri, 2023; Obrador Rey et al., 2024). Lastly, studies on consumer behavior, charging infrastructure, and emerging technologies such as autonomous EVs and flying vehicles highlight the multifaceted challenges and opportunities in the transition to a low-carbon transportation future (Dai and Zhang, 2023; Tripathy et al., 2023).
The EV adoption is widely recognized as crucial for achieving global climate change targets and advancing sustainable transport (Haghani et al., 2023). Recent research trends in electric vehicles (EVs) highlight key areas such as charging infrastructure (Fescioglu-Unver and Aktas, 2023), adoption rates (Moreno Rocha et al., 2024), thermal management systems, and routing problems (Singh et al., 2024), with a noticeable decline in hybrid EV research across subfields. Addressing global challenges like urban congestion and environmental degradation, renewable energy-powered EVs and flying automobiles are being explored to reduce fossil fuel dependence and carbon emissions. Studies emphasize the need for integrating flying vehicles into existing infrastructures through dynamic modeling and a mixed-methods approach, analyzing drivers and challenges, such as infrastructure, safety, and airspace management. The importance of wireless charging, particularly inductive and capacitive power transfer (Govathoti, 2024), is also highlighted, while policies like the European Union’s 2035 ban on internal combustion engine vehicle registrations aim to boost EV adoption (Menyhart, 2024). Transforming public transportation requires machine learning-driven predictions of energy economy for electric buses, with studies indicating that predictive maintenance and consumer-centric policies can enhance EV adoption. Research also points to growing consumer interest in EVs in the Nordic countries (de Rubens, 2019), where vehicle-to-grid technologies and pricing strategies drive market adoption. Furthermore, machine learning models have proven effective in predicting market dynamics (Ahmadi et al., 2020), identifying charging infrastructure needs, and forecasting individual consumer behavior, aiding manufacturers and policymakers (Dixit and Singh, 2022; Neeraja et al., 2023). Studies highlight the significant potential of AI, blockchain, and autonomous EVs in achieving a sustainable future for urban mobility, while also identifying challenges related to infrastructure and emissions (Kavcic et al., 2022; Jin et al., 2024). Finally, the environmental footprint of EVs, including indirect emissions and recyclability, remains a critical focus, with recommendations for further technological advancements and sustainable policy frameworks (Vajsz et al., 2022).
The paper is organized as follows: The complete methodology is explained in Section “Materials and methods.” To demonstrate the application of the suggested problem, a numerical example is given in Section “Analysis and Interpretation.” Section “Conclusion” of the paper provides concluding remarks, an analysis of the study’s shortcomings, and implications.
2 Materials and methods
The study’s methodology is illustrated in Figure 1. It starts by gathering both primary and secondary data, which involves obtaining responses from surveys and information from sources. Data was sourced from the Vahan dashboard and district distance matrices for Tamil Nadu, including survey responses for consumer perception analysis. Once data collection is complete, thorough cleaning and preprocessing procedures are undertaken to ensure the data quality, including addressing missing values and standardizing data format. Following this, relevant features are identified, and the target variable (the year of EV sales) is established, leading to the consolidation of datasets for a comprehensive analysis. Machine learning models such as Linear Regression, Support Vector Regressor, K Nearest Neighbours, Random Forest Regressor, Decision Tree Regressor, Gradient Boosting Regressor, AdaBoost Regressor, Ridge Regression, and Lasso Regression were used. The dataset is subsequently divided into training and testing sets for the purpose of model training and evaluation. The performance of the chosen model is assessed using appropriate metrics, and adjustments to hyperparameters may be made for optimization if necessary. The interpretation of results involves analysing insights into the dynamics of the EV market and regional disparities. Ultimately, actionable recommendations are formulated to promote sustainable growth in India’s electric mobility sector based on the study’s findings.
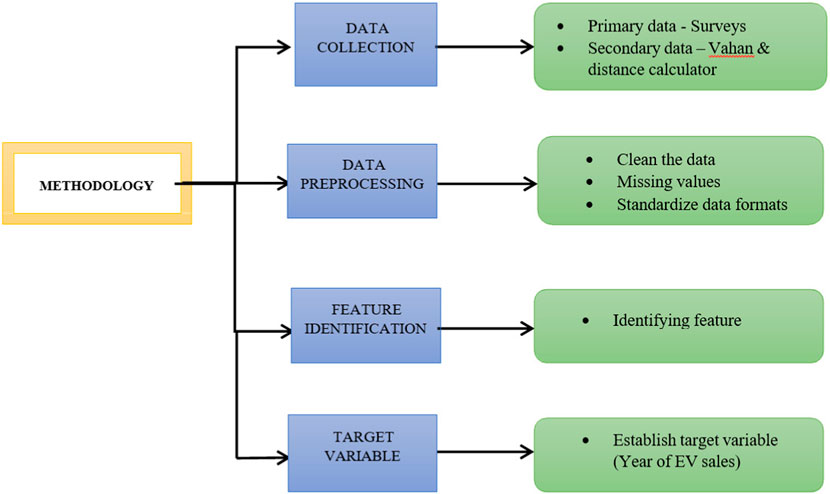
Figure 1. Methodology of the study.
3 Analysis and interpretation
A thorough analysis of India’s EV market dynamics from FY 2014 to 2024 up to February is presented by using the steps in Figure 2. Using ML methods, it examines sales patterns, regional differences, and factors impacting EV adoption across the country. Key points include insights into sales trends, regional adoption patterns, category-specific dynamics, and performance disparities among states. Moreover, a specific focus on Tamil Nadu provides localized insights, while an evaluation of EV advantages and disadvantages offers clarity on their overall feasibility. Additionally, spatial analysis of charging infrastructure expansion assists in strategic planning for infrastructure development.
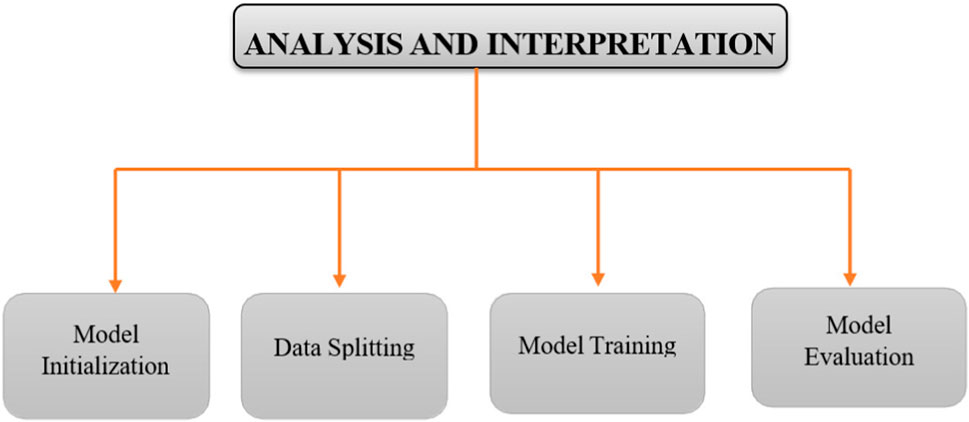
Figure 2. Analysis and interpretation.
3.1 Total sales of EV in India FY 2014–2024 (Feb)
Figure 3 illustrates a steady increase in EV sales from 2014 to 2023, reflecting growing adoption across India. This upward trend can be attributed to several factors, including government incentives, increased environmental awareness, rising fuel prices, and advancements in EV technology. Despite this growth, the rate of increase may vary over time due to shifts in consumer preferences, economic conditions, and government policies.

Figure 3. Total sales of EV in India (2024 is not a full year).
The Indian government has played a crucial role in promoting EV adoption through initiatives such as the Faster Adoption and Manufacturing of Electric Vehicles (FAME) scheme, which offers subsidies and incentives for both consumers and manufacturers. Additionally, state governments have implemented localized policies to further encourage the use of EVs. Although EV sales have been rising, they still represent a small fraction of the total vehicle sales in India. Nevertheless, the continued emphasis on reducing emissions and dependence on fossil fuels is expected to drive substantial growth in EV sales in the coming years.
Year-to-year fluctuations in EV sales are also evident. For instance, in 2020, the global automotive industry faced a significant downturn due to the COVID-19 pandemic, which led to lockdowns, supply chain disruptions, and reduced consumer spending. This resulted in a temporary dip in EV sales, reflecting the broader impact on the automotive sector.
Overall, the bar plot underscores the growth and potential of the EV market in India, highlighting the progress achieved thus far and the opportunities for further expansion in the future.
3.2 State-wise EV sales in India (2021–2024)
India is witnessing a steady rise in EV sales; however, challenges such as high upfront costs and a lack of accessible charging infrastructure persist. State governments play a pivotal role in addressing these issues by implementing supportive policies, investing in infrastructure, and promoting awareness of the benefits of electric vehicles. For a cleaner and more sustainable future, all Indian states must work towards increasing EV adoption.
Uttar Pradesh has consistently emerged as the top-performing state in EV sales across multiple years (up to 2023), reflecting strong market demand and widespread adoption in the region. Maharashtra and Karnataka ranked second and third in terms of EV sales in 2022 and 2023, respectively, maintaining their prominent positions in the rankings. In 2024, Gujarat has taken the lead as the top-selling state based on data available up to February. This notable shift in rankings highlights Gujarat’s expanding EV market, driven by factors such as favorable policies, well-developed charging infrastructure, growing consumer awareness, and interest in electric vehicles.
Tamil Nadu has also positioned itself among the leading states in EV sales. Projections for 2024 suggest that Tamil Nadu is expected to become the top-selling state for electric vehicles across India (refer Supplementary Figure S1). These developments underscore the dynamic nature of the EV market in India and the importance of continued efforts to promote EV adoption nationwide.
3.3 Category-wise EV sales in India
The category-wise EV sales chart (see Supplementary Figure S2) for the years 2021, 2022, and 2023 in India provides valuable insights into the trends and dynamics of the electric vehicle market. The data illustrates that the 2W and 3W segments consistently outperform other categories, such as 4W, Buses, and Others, across all 3 years, indicating a strong consumer preference for electric 2Ws and 3Ws in India.
The year 2022 stands out as the period with the highest overall EV sales, driven primarily by a remarkable surge in the 2W segment. This highlights 2022 as a pivotal year for the EV market in India, marked by widespread adoption and increased consumer confidence in EV technology. Although overall sales in 2023 did not surpass the peak achieved in 2022, the 2W segment maintained its dominance, achieving the second-highest sales volume within this category.
This sustained growth reflects a maturing market, with consumers continuing to adopt electric 2Ws as a viable mode of transportation. The high demand for 2W and 3W EVs highlights the need for tailored policies and incentives to promote the adoption of these categories. Policymakers and industry stakeholders should prioritize enhancing charging infrastructure, incentivizing manufacturing, and implementing supportive measures to further accelerate growth in the 2W and 3W segments.
While the 2W and 3W segments currently dominate the market, there is significant potential for growth and diversification in other categories, such as electric 4Ws, Buses, and specialized vehicles. Strategic investments in research and development, along with targeted marketing efforts, can unlock the full potential of these segments and contribute to the overall expansion of India’s EV market.
4 Analysis & interpretation: initializing models
Dependent variable: EV category-wise sales data (2W,3W, 4W, BUS, OTHERS) Independent variable: Year.
4.1 Linear regression
Linear regression models the relationship between a dependent variable and one or more independent variables by fitting a linear equation to observed data. To put it simply, it clarifies how changing one or more independent variables affects the value of the dependent variable.
4.2 Support vector regressor
For regression tasks, the supervised learning algorithm known as the support vector regressor is employed. The way it operates is by projecting the input data onto a high-dimensional feature space, then identifying the ideal hyperplane to minimize error and effectively divide the data into distinct classes. These metrics show the degree to which the model’s predictions agree with the actual target values.
4.3 K-nearest neighbour
For classification and regression tasks, K Nearest Neighbors (KNN) is an easy to understand, accessible supervised learning algorithm. It uses the majority class (classification) or average value (regression) of their K nearest neighbors to forecast new points while storing the training set in storage.
4.4 Random forest regressor
With the use of multiple decision trees built during training, the random forest regressor is an ensemble learning technique that produces the mean prediction of each individual tree for regression tasks. By combining the predictions of several trees, it decreases overfitting and increases prediction accuracy.
4.5 Decision tree regressor
For regression tasks, a supervised learning algorithm called a decision tree regressor is employed. With the training set, it constructs a decision tree, with each leaf node denoting the expected output value, each branch representing a decision, and each node representing a feature.
4.6 Gradient boosting regressor
Gradient Boosting Regressor is a machine learning technique for regression that builds an ensemble of weak prediction models, focusing on minimizing errors in a sequential manner. It’s used for accurate regression tasks, especially in complex datasets with nonlinear relationships, and is favoured in competitions for its high performance and versatility.
4.7 Ada boost regressor
AdaBoost Regressor is a machine learning algorithm that sequentially trains weak learners to correct errors made by previous models, emphasizing difficult-to-predict instances. It’s used for regression tasks, particularly when dealing with noisy data or complex relationships, and excels in scenarios where robustness to outliers is crucial.
4.8 Ridge regression
Ridge regression, or L2 regularization, is a linear regression technique that adds a penalty term to the loss function, penalizing large coefficient values. It helps to prevent overfitting and improve the generalization performance of the model.
4.9 Lasso regression
Lasso regression, or L1 regularization, is a linear regression technique that adds a penalty term to the loss function, forcing some of the coefficient values to be exactly zero. It helps to select a subset of the most relevant features and reduce model complexity.
4.10 Output of machine learning models & interpretation
The best prediction models are found to be Ridge Regression and Linear Regression based on the category-wise EV sales data (refer Table 1) in India. Compared to the other regression procedures examined, these models show the lowest Mean Squared Error (MSE) and Mean Absolute Error (MAE). Their predictability, ease of interpretation, and effective computing power make them the ideal options for analyzing and predicting EV sales trends across various categories. Their usefulness for stakeholders seeking actionable insights in the rapidly expanding EV industry is further enhanced by their capacity to offer insights into the relative contributions of specific characteristics. Since Ridge Regression and Linear Regression balance predictive accuracy, interpretability, and computational efficiency, they are recommended for estimating category-wise EV sales in India.
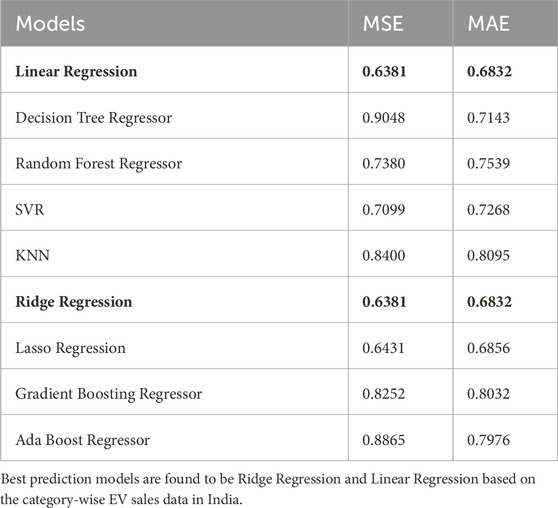
Table 1. Output of ML models.
5 Top 5 states of EV in India
The bar chart (see Figure 4) illustrates the distribution of EV sales in India, with Uttar Pradesh (UP), Maharashtra, Gujarat, Karnataka, and Delhi leading the transition towards electric vehicles. Uttar Pradesh emerges as the largest contributor, indicating a growing market for EVs, particularly in cities such as Lucknow and Noida. Maharashtra, recognized for its industrial and commercial significance, also plays a significant role in EV sales, while Gujarat leverages its strong industrial base and government initiatives to support EV growth. Karnataka and Delhi, although contributing slightly less, demonstrate substantial participation in EV sales, supported by favorable policies and increased consumer awareness, including incentives such as 100.
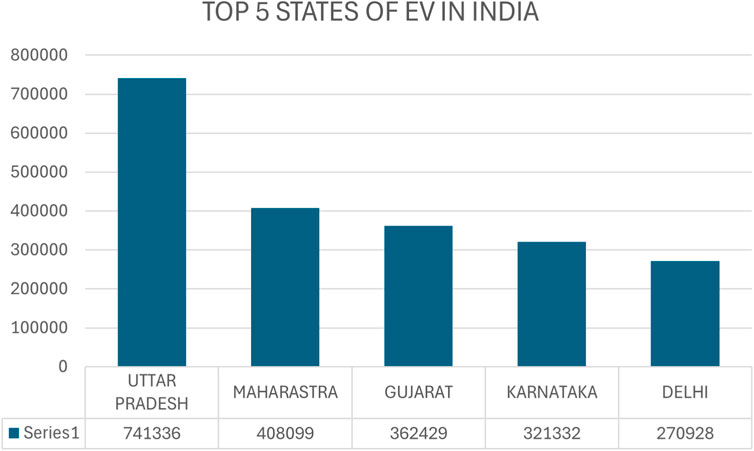
Figure 4. Top 5 states of EV in India.
5.1 What makes EV sales go up in UP?
Uttar Pradesh (UP) emerges as a frontrunner in electric vehicle (EV) sales due to its proactive governmental strategies, exemplified by the UP Electric Vehicle Manufacturing and Mobility Policy 2022 and the establishment of 582 operational public charging stations. Despite grappling with a poverty rate of 22.93%, UP showcases robust economic indicators, with a GDP per capita of 79,396 rupees and a minimal unemployment rate of 2.9%. With a dense population density of
From 2014 to February 2024, UP maintains a consistent upward trajectory in EV sales (refer Supplementary Figure S3), peaking notably in 2023 with 278,017 units sold. The state further incentivizes EV adoption by offering a full waiver on road tax, though it does not impose any maximum subsidy provisions.
6 Least 5 states of EV in India
The bar chart (refer Figure 5) indicates that Sikkim, Arunachal Pradesh, Nagaland, Ladakh, and the Andaman and Nicobar Islands have lower rates of EV adoption compared to other parts of India. This is likely due to factors such as insufficient charging infrastructure, limited awareness of the benefits of EVs, absence of government incentives, and geographical challenges. Among these regions, Sikkim demonstrates the smallest share of EV sales, followed by Arunachal Pradesh, Nagaland, Ladakh, and the Andaman and Nicobar Islands. While Ladakh and the Andaman and Nicobar Islands show slightly higher proportions of EV sales, they still fall short of national averages, highlighting the need for targeted efforts to enhance EV adoption in line with India’s sustainable transportation objectives.
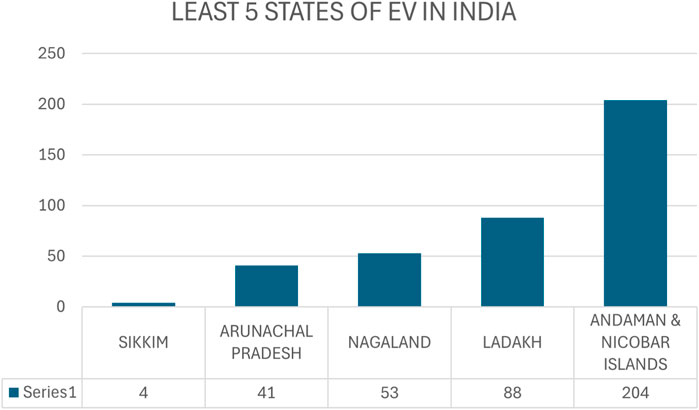
Figure 5. Least 5 states of EV in India.
6.1 Why are EV sales lower in Sikkim?
Several factors contribute to the slow sales of electric vehicles (EVs) in Sikkim (refer Supplementary Figure S4). The potential EV market in the region is limited by its small population, which is further impacted by unfavorable climatic conditions and security concerns.
Census data shows a population of 610,577, with only slight growth over time. With just two EV charging stations in East Sikkim, limited infrastructure hampers widespread EV adoption. Economic dynamics also play a role, as Sikkim’s agrarian economy, despite a notable GDP per capita, restricts consumer spending on EVs. The emerging EV market in Sikkim faces challenges such as restricted model availability and limited services, which hinder consumer acceptance. Furthermore, given the region’s reliance on agriculture as the predominant occupation, the lack of diverse economic activities also impacts the potential for EV sales.
7 EV sales trend in the Tamil Nadu region
The Tamil Nadu EV sales data from 2021 to 2023 indicates a steady rise (refer Supplementary Figure S5 in supplementary material), with notable peaks in March each year, possibly due to increased demand or promotional activities. In 2022, sales surged, particularly from April to August, with March recording the highest sales at 8,179 units. This trend continues in 2023, with March remaining a top-selling month. Notably, May 2023 sees a significant spike in sales at 11,484 units, potentially influenced by seasonal factors or specific market events. Cultural preferences and societal norms also play a role in shaping consumer behavior and perceptions toward EVs. Factors such as the status symbols associated with traditional vehicles or cultural attitudes toward technology adoption may impact EV sales.
8 Public perceptions of EVs
The examination of Electric Vehicles (EVs) advantages and disadvantages is essential in gauging their potential influence on transportation and the environment. A structured questionnaire has been devised to gather insights from respondents, evaluating aspects such as EV awareness, government incentive awareness, and future EV purchase intentions. This survey aims to collect valuable data for comprehensive assessment of perceptions, preferences, and considerations regarding EV adoption. Statistical analysis, including chi-square analysis were performed using SPSS to further explore the relationships between variables and derive meaningful insights.
8.1 Gender vs. are you aware of EV
A Chi-square analysis revealed a statistically significant association between gender and EV awareness, with males reporting higher levels of awareness than females
The bar chart (refer Supplementary Figure S6) depicts the relationship between gender and awareness of EVs among respondents. The x-axis represents gender, where “1” corresponds to males and “2” to females. The y-axis indicates the count of respondents, with light blue bars representing those who are aware of EVs and dark violet bars representing those who are not aware.
8.2 Education vs. are you aware of EV
The chi-square tests were conducted to examine the relationship between variables. The results indicate no significant association between the variables at the conventional significance level of 0.05. Additionally, there is no significant linear trend observed. However, it is important to note that a portion of the cells have low expected counts, which may impact the reliability of the test results (refer Supplementary Figure S7).
8.3 Age vs. are you aware of EV
The chi-square tests were conducted to explore the relationship between variables. The results indicate that while there is no significant association between the variables at the conventional significance level of 0.05 based on the Pearson and likelihood ratio tests, a significant linear trend is observed according to the linear-by linear association test. It’s important to note that a considerable portion of cells have low expected counts.
The bar chart (refer Supplementary Figure S8) displays how different age groups relate to knowing about EVs. The x-axis represents Age where “1” corresponds to Less than 25 years, “2” corresponds to 26–35 years, “3” corresponds to 36–45 years, “4” corresponds to 46–55 years, and “5” corresponds to Above 55 years. Notably, the youngest age group (Less than 25 years) exhibits the highest level of awareness, followed by the other age groups.
8.4 Gender vs. are you aware of any government schemes or policies related to EV
The chi-square tests conducted to explore the relationship between variables reveal no significant association based on various measures. For example, Pearson’s chi-square value is 0.028 with a p-value of 0.867, continuity correction yields a value of 0.000 with a p-value of 1.000, and likelihood ratio chi-square value is 0.028 with a p-value of 0.867. Fisher’s exact test shows a two-sided p-value of 1.000 and a one-sided p-value of 0.502. The linear-by-linear association chi-square value is 0.028 with a p-value of 0.868. All cells have expected counts greater than 5.
8.5 Age vs. are you aware of any government schemes or policies related to EV
The chi-square show no significant association between variables. Pearson’s chi-square value is 7.947 with 4 (df), yielding a p-value of 0.094. Likelihood ratio chi-square is 9.401 with 4 df, resulting in a p-value of 0.052. However, 30.0% of cells have expected counts less than 5, with a minimum expected count of 2.86, potentially impacting reliability.
9 Education vs. are you aware of any government schemes or policies related to EV
The chi-square examination assessed the connection between education levels and awareness of government programs concerning EVs. The findings, such as the Pearson Chi-square value of 0.707 with 2 degrees of freedom and a significance level of 0.702, upheld the null hypothesis. Likewise, both the Likelihood Ratio and Linear-by-Linear Association analyses produced non-significant outcomes, affirming that there’s no statistically meaningful link between education levels and awareness of EV-related governmental policies among the participants.
The bar chart presents the relationship between education levels and awareness of government schemes or policies related to EVs. Across different education categories, there is notable variation in awareness levels. Graduates exhibit the highest awareness, followed by those with postgraduate and above education, Conversely, individuals with Up to 12th grade education show the lowest awareness.
9.1 Gender vs. would you like to purchase EV in future
The outcomes of the chi-square tests indicate a potential link between demographic variables and the inclination to purchase an EV. Both the Pearson Chi-square and Likelihood Ratio tests showed p-values of 0.016 and 0.015, suggesting a plausible association. Furthermore, the Linear-by-Linear Association test approached significance with a p-value of 0.051, indicating a possible linear trend in the relationship. These findings suggest that demographic factors may influence individuals’ intentions to buy EVs.
9.2 Age vs. would you like to purchase EV in future
The chi-square tests highlight substantial correlations between demographic variables and whether someone wants to buy and EV. The results of two tests, Pearson Chi-Square and Likelihood Ratio, had really low p-values-0.000 and 0.002. These low p-values mean they give strong evidence that there is a connection. However, the Linear-by-Linear Association test yielded a p-value of 0.129, suggesting a potential linear trend, albeit less conclusively than the other test.
9.3 Education vs. would you like to purchase EV in future
The Pearson Chi-Square and Likelihood Ratio tests produced p-values are 0.078 and 0.101, indicating they are not statistically significant at the common significance level of 0.05. This suggests there might not be a significant link between the variables being examined. However, the Linear-by-Linear Association test showed a minimal chi-square value of 0.03 with 1 degree of freedom and a high p-value of 0.872, indicating no noticeable linear trend in the relationship. Based on these tests, there is not strong evidence of a connection between the variables being studied. Tables 2, 3 gives the cross tabulation between gender and awareness of EV and education and awareness of govt. schemes respectively. Tables 4–13 calculates the chi- square of different parameters. Table 14 gives the top 10 optimal locations based on single mode analysis. Table 15 represents the district wise data for income, road density, EV sames, and population in TN.
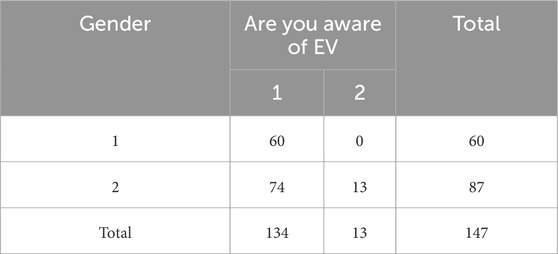
Table 2. Cross tabulation b/w gender & awareness of EV.
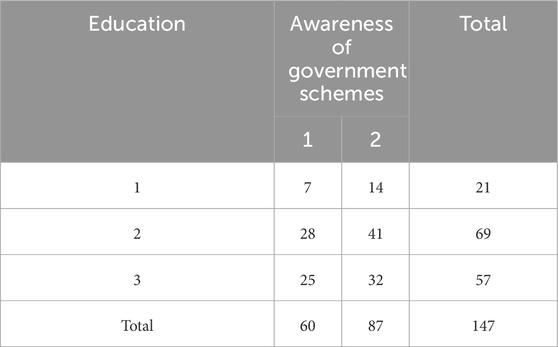
Table 3. Cross tabulation b/w education & awareness of govt. schemes.

Table 4. Chi-Square b/w gender & awareness of EV.
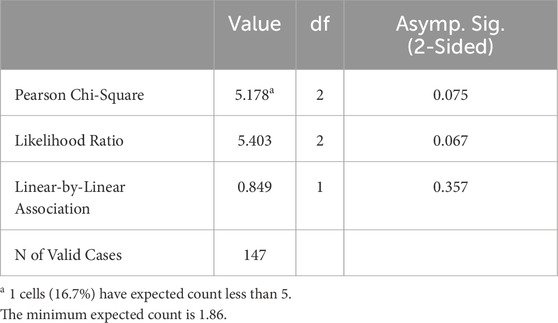
Table 5. Chi-square b/w education & awareness of EV.
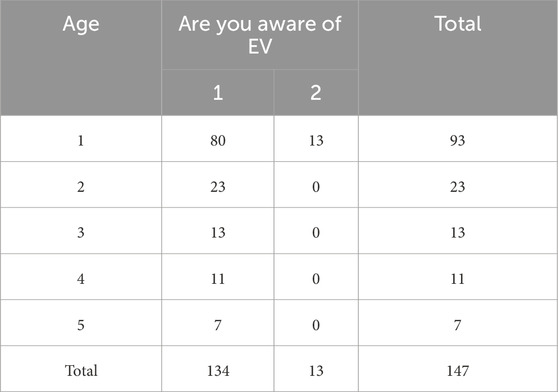
Table 6. Cross tabulation b/w age & awareness of EV.

Table 7. Chi-square b/w age & awareness of EV.

Table 8. Chi-square b/w gender & awareness of govt. schemes.

Table 9. Chi-Square b/w age & awareness of govt. schemes.
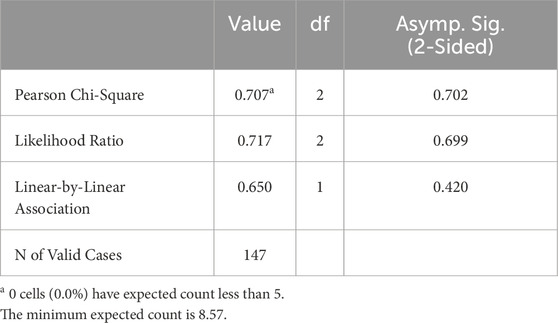
Table 10. Chi square b/w education & awareness of govt. schemes.
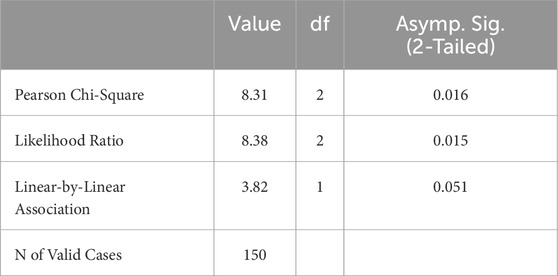
Table 11. Chi-square b/w gender & intention to purchase EV in future.

Table 12. Chi-square b/w age & intention to purchase EV in future.
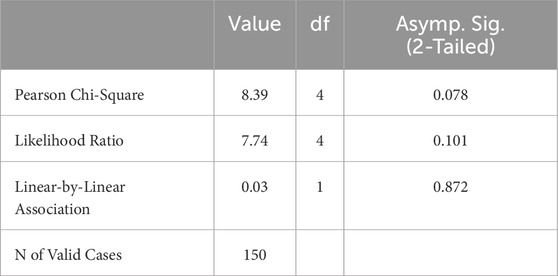
Table 13. Chi-square b/w Age & intention to purchase EV in future.
9.4 Advantages
Based on the responses from the 147 participants regarding the advantages of EVs, the majority highlighted saving fuel costs (118 respondents), followed by reducing emissions (81 respondents), and mitigating noise pollution (86 respondents). Notably, several participants also cited additional benefits, including addressing air pollution, facilitating easy adaptation for current and future generations, the convenience of home charging, and the ease of handling due to lower weight and robust design. This comprehensive range of responses underscores the multifaceted appeal and perceived advantages of EVs beyond the conventional benefits typically associated with them.
9.5 Disadvantages
Based on the responses from the 147 participants regarding the advantages of EVs, the majority highlighted saving fuel costs (118 respondents), followed by reducing emissions (81 respondents), and mitigating noise pollution (86 respondents). Notably, several participants also cited additional benefits, including addressing air pollution, facilitating easy adaptation for current and future generations, the convenience of home charging, and the ease of handling due to lower weight and robust design. This comprehensive range of responses underscores the multifaceted appeal and perceived advantages of EVs beyond the conventional benefits typically associated with them.
9.6 Interpretation
The analysis presented a comprehensive examination of various factors related to EVs, including demographic influences on awareness, perceptions regarding government initiatives, purchase intentions, and perceived advantages and disadvantages. The study found that factors like age and whether someone is a man or woman affect how much they know about EVs. Younger people and mean usually know more about them. Being educated does not always mean you know more about EVs, but it does mean you might know more about government plans for them. Even though people have different levels of knowledge, many are interested in EVs because they can save money and help the environment. But, problems like not enough places to charge them and how expensive they are can make it hard for more people to use them.
10 Strategic placement of charging infrastructure in TN
Tamil Nadu’s greenhouse gas (GHG) emissions surged by an astonishing 84% from 2005 to 2019, reaching 184 million tons of Carbon dioxide Equivalent (MtCO2eq). This increase was predominantly driven by the energy sector, contributing 77% of the total emissions, equivalent to 141 MtCO2eq in 2019. The substantial rise underscores the urgent need for measures to curb emissions, particularly focusing on the energy sector. Transitioning to sustainable energy sources like EVs is crucial. However, TN faces challenges in its EV infrastructure, including poor road conditions and gaps in power distribution, hindering the deployment of charging stations. Addressing these challenges and optimizing charger placement are essential steps toward facilitating smoother journeys with reduced environmental impact, thus advancing TN towards a more sustainable future.
10.1 Data collection
For data collection, the initial step involved utilizing a distance calculator to compile a matrix detailing the distances between districts within Tamil Nadu. Preprocessing was omitted prior to analysis. This distance matrix served as pivotal data for strategically positioning charging stations. It facilitated an understanding of district proximity and guided decisions regarding optimal placement. The raw data derived from the distance calculator formed the cornerstone for subsequent analyses and determinations concerning charger placement.
10.2 Algorithm used
10.2.1 MST
It is a subset of the edges of a connected, undirected graph that connects all the vertices together without any cycles and with the minimum possible total edge weight. Essentially, it’s a tree that covers all the graph’s vertices with the least total edge weight. MSTs find applications in diverse fields like network planning, clustering, and optimization.
10.2.2 MST-K
It is a greedy approach to finding the MST of a connected, weighted graph. It selects edges based on their weights, ensuring no cycles are formed, until all vertices are included in the tree. With a time complexity of O (E log V), it efficiently constructs the MST.
11 Execution & outcome
The graphs show how TN districts are connected geographically, aiding in planning. The first graph (Figure 6) displays distances between districts, while the optimized MST graph (Figure 7) highlights efficient connections. Central districts play key roles in linking others, while peripheral districts may need better infrastructure. Analyzing these graphs informs decisions, including where to place charging stations for EVs.
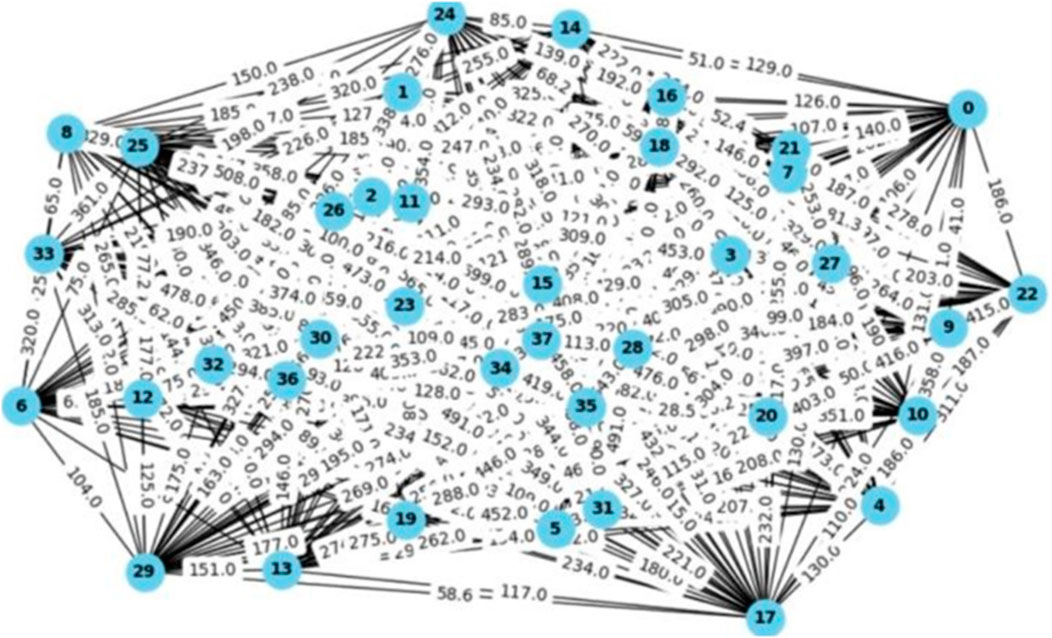
Figure 6. MST of TN Districts.
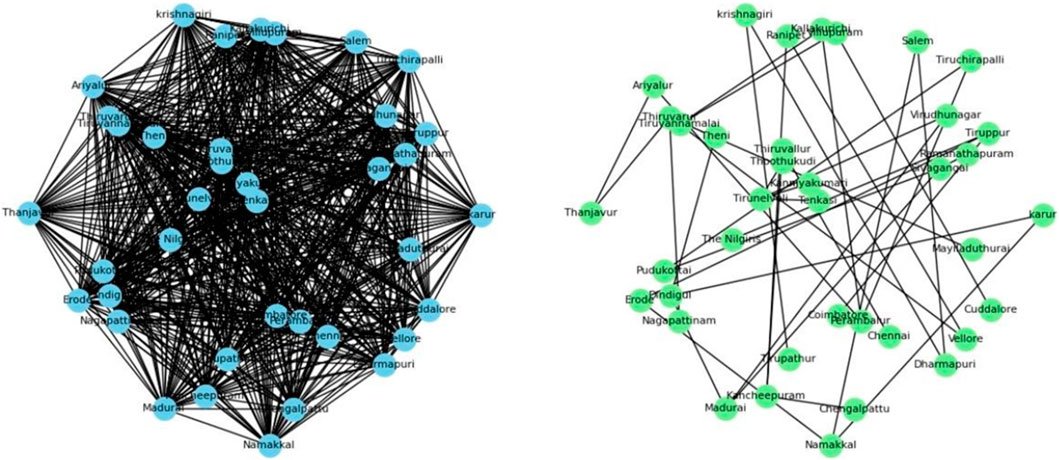
Figure 7. Initial and optimized MST.
After conducting a detailed analysis of edge weight in a single-mode examination. I’ve identified the top 10 optimal sites [refer (Table 14)] for installing charging stations throughout TN. These locations were selected meticulously to ensure effective coverage and accessibility, encouraging the adoption of EVs and supporting sustainable transportation infrastructure. The selection criteria focused on edge weights in the connectivity graph, prioritizing areas with longer distances between districts. This strategic approach aims to minimize travel distances for EVs, marking a substantial step towards establishing a strong EV infrastructure network in TN.
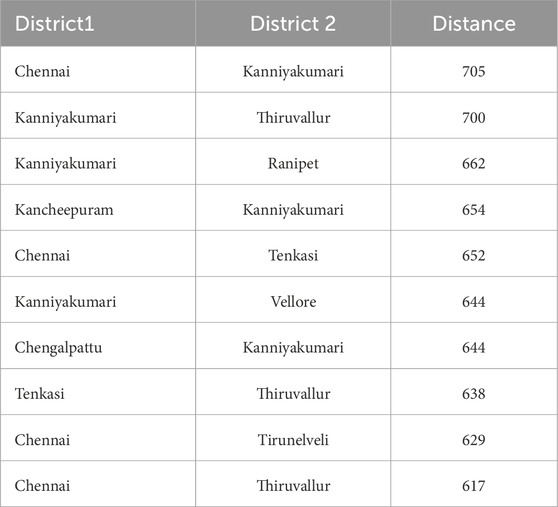
Table 14. Top 10 optimal locations based on single mode analysis.
A histogram graph [see (Figure 8)] has been created to depict the total distance for each district in Tamil Nadu. This histogram offers insights into distance distribution across the state, revealing connectivity and transportation dynamics. Shorter distances suggest efficient transportation networks and proximity to key hubs. Longer distances signal connectivity issues, necessitating targeted interventions like improved infrastructure. Optimizing charging station placement can enhance transportation efficiency and very useful for the EV users. Figure 9 displays the raw graph, which was generated using multi-modal edge weights with the assistance of Python programming.
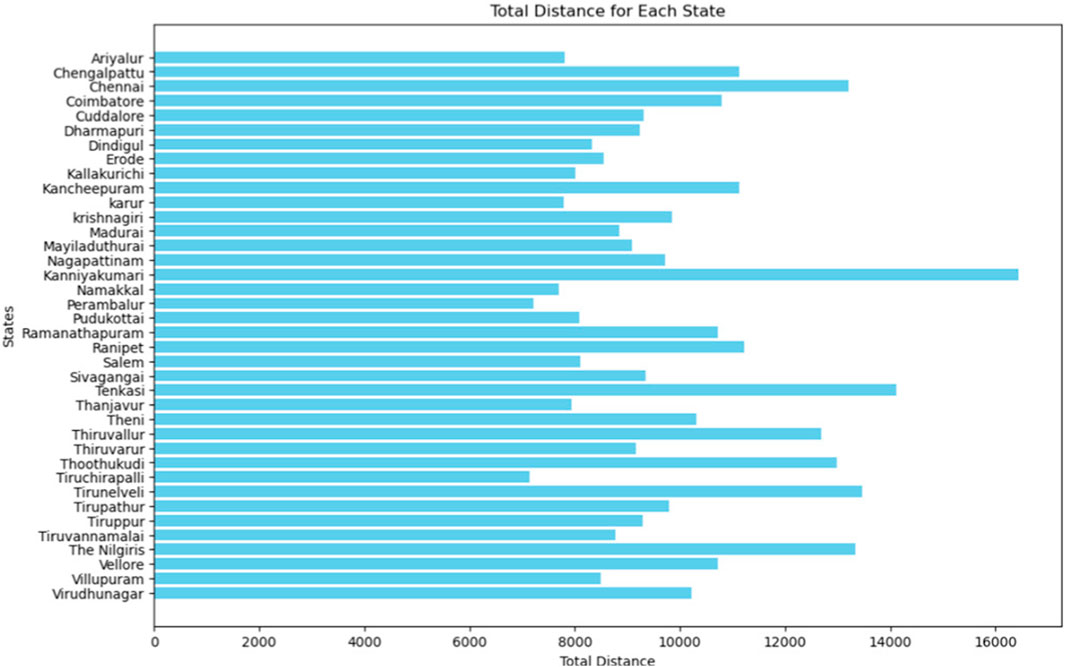
Figure 8. Total distance for each state (Histogram).
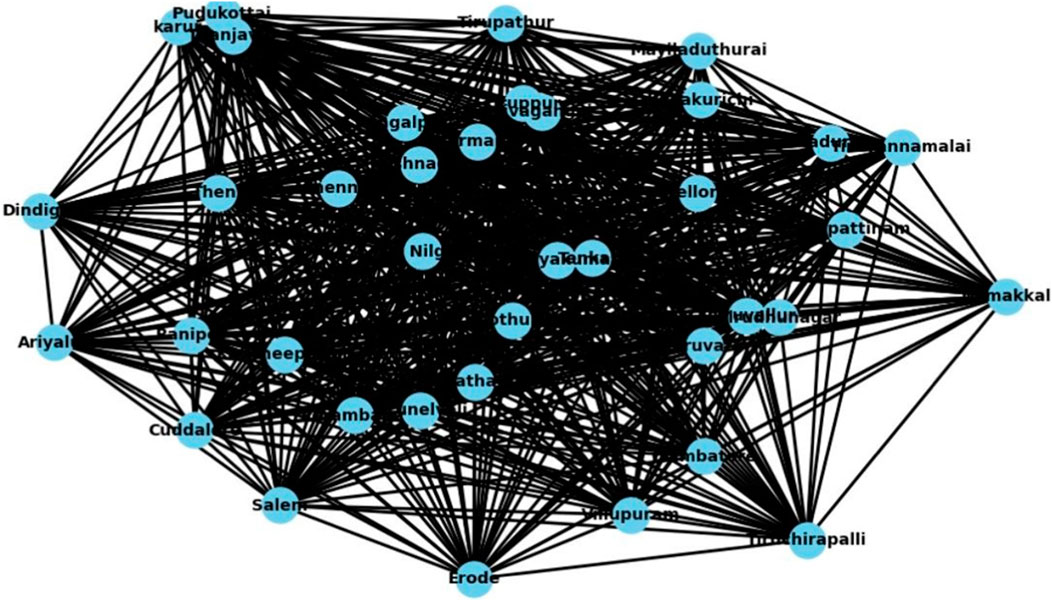
Figure 9. Raw graph using multi-modal edge weights.
12 Results & discussion
The recent data collected for district-wise population, income, road density, and electric vehicle (EV) sales across Tamil Nadu are tabulated in Table 15. Figure 10 illustrates the resulting Minimal Spanning Tree, generated with Chennai as the central hub. Strategically placing charging stations along main roads is crucial for encouraging greater EV adoption in Tamil Nadu.
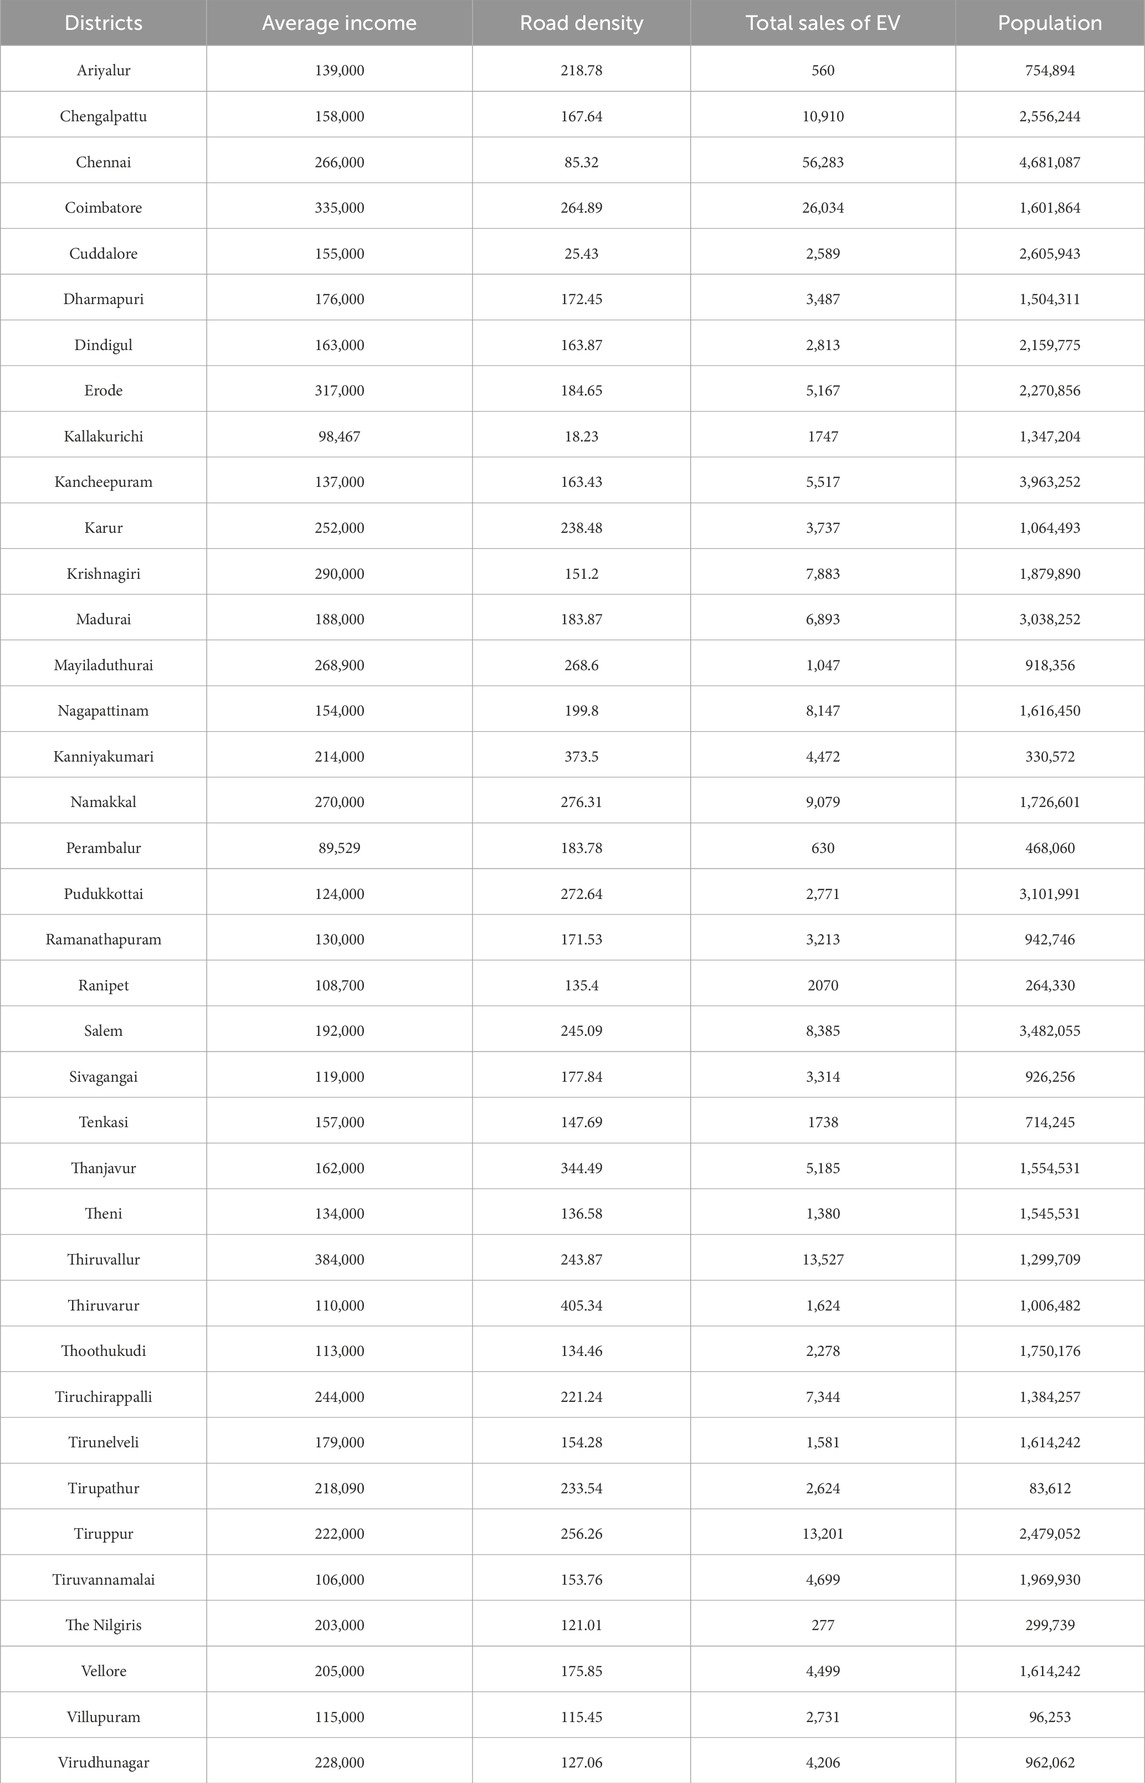
Table 15. District-wise data for income, road density, EV sales, and population in TN.
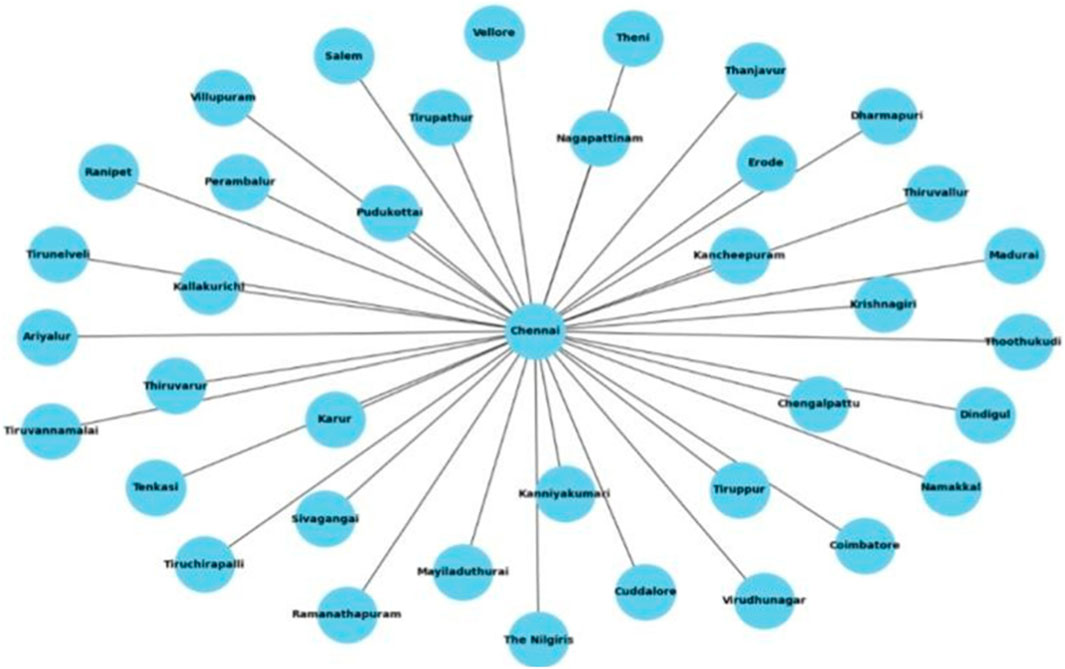
Figure 10. Resulting MST generated (central hub-Chennai).
After analyzing the top 10 edge weights derived from the MST multi-modal analysis, several critical pathways emerge. These corridors connect major urban centers like Chennai, Coimbatore, and Madurai, along with key junctions such as Salem and Tirupur. Establishing charging stations along these routes facilitates long-distance travel, supports inter-city commuting, and promotes the use of eco-friendly transportation options for both residents and visitors.
Additionally, focusing on areas with significant commuter activity, industrial presence, and tourist influx, such as Chengalpattu and Thanjavur, ensures widespread access to EV charging infrastructure. In conclusion, strategically placing charging stations on these key routes enhances transportation efficiency, boosts the local economy, and contributes to environmental sustainability in the region.
13 Limitations
The success of the project relies on the availability of sufficient and high-quality data. Incomplete or poor-quality data can impede the progress of the project, potentially leading to inaccurate conclusions. A significant limitation stems from regional variations in data, as variations in reporting standards, data collection methods, and regional focus can introduce biases. These variations in lifestyle, infrastructure, and socioeconomic factors limit the generalizability of the findings across diverse areas within India. As a result, the conclusions drawn may not fully reflect the experiences or conditions of all regions, thus potentially skewing the understanding of EV adoption trends.
Another limitation concerns the machine learning models employed in the study. These models rely on historical data and assumptions about future trends, which may not always hold true, especially in a rapidly evolving market like electric vehicles. Unexpected shifts in consumer behavior, technological advancements, or policy changes could lead to inaccuracies in predictions. Furthermore, the models’ accuracy is constrained by the quality and completeness of the available data, and they may struggle to capture the full complexity of real-world dynamics, limiting the reliability of the predictions.
The study’s focus on car sales trends during a specific period also introduces limitations. While these trends offer valuable insights, they overlook the broader global changes and external factors that could influence the EV market. Additionally, the study does not fully address consumer sentiment beyond surveys, which is a crucial aspect of EV adoption. Consumer attitudes, preferences, and psychological factors play a significant role in purchasing decisions and may not be adequately captured by sales data alone. Moreover, the research does not account for variations in the placement of EV chargers across different locations. The distribution and availability of charging infrastructure significantly impact the adoption of EVs, and differences in this regard can greatly affect sales trends, which this study does not comprehensively capture.
14 Conclusion
The analysis indicates a consistent rise in EV sales in India from FY 2014 to 2024, driven by factors like environmental awareness, technological advancements in EV, and government incentives. UP leads in EV sales due to proactive government strategies and strong economic indicators. Other states like Maharashtra, Karnataka, Gujarat, and Tamil Nadu also show promising growth, highlighting the importance of supportive policies and charging infrastructure. Electric 2Ws and 3Ws dominate the market, reflecting strong consumer preferences. While these segments have been supported by strategic policies, there’s potential for growth in other categories like electric 4Ws and buses, requiring targeted investments. Despite growth, challenges such as high costs and limited charging stations persist. However, these challenges present opportunities for state governments to implement supportive policies and infrastructure development to promote EV adoption.
Predictive Analysis the use of Ridge Regression and Linear Regression models offers valuable insights for predicting EV sales trends, aiding strategic planning for infrastructure development and ensuring widespread access to charging facilities. Strategically placing EV charging stations along major roads in TN, connecting urban centres and essential junctions, supports long-distance travel, inter-city commuting, and eco-friendly transportation. Focusing on high-traffic areas ensures widespread access, improving transportation, boosting the economy, and promoting environmental sustainability.
Addressing key challenges, such as high initial costs and limited charging infrastructure, is essential to drive broader EV adoption across India. We can do this by making helpful rules, investing in charging spots wisely, and telling people about the good factors about EVs. Tailoring EV adoption strategies to meet the unique needs of different regions will be crucial in making EVs a popular choice nationwide. By dealing with these challenges well, we can make it easier for people to pick EVs for cleaner and better transportation, which will help everyone and the environment too.
Future research should focus on integrating real-time data on consumer sentiment and behavior to better understand the factors influencing EV adoption. Expanding the scope to include diverse regions and considering socio-economic dynamics will enhance the generalizability of findings. Additionally, exploring the impact of charging infrastructure density and accessibility on EV sales is essential. Long-term studies can track how evolving policies and technological advancements shape the market. Lastly, incorporating advanced machine learning models that account for unforeseen market shifts would improve prediction accuracy.
Data availability statement
The datasets presented in this study can be found in online repositories. The names of the repository/repositories and accession number(s) can be found below: https://vahan.parivahan.gov.in/vahan4dashboard/.
Ethics statement
Ethical review and approval was not required for the study on human participants in accordance with the local legislation and institutional requirements. Written informed consent from the [patients/ participants OR patients/participants legal guardian/next of kin] was not required to participate in this study in accordance with the national legislation and the institutional requirements.
Author contributions
ED: Conceptualization, Formal Analysis, Methodology, Writing–review and editing. DN: Methodology, Software, Writing–original draft. JR: Data curation, Formal Analysis, Writing–review and editing.
Funding
The author(s) declare that no financial support was received for the research, authorship, and/or publication of this article.
Acknowledgments
We thank the reviewers for their careful reading of our manuscript and their many insightful comments and suggestions.
Conflict of interest
The authors declare that the research was conducted in the absence of any commercial or financial relationships that could be construed as a potential conflict of interest.
Publisher’s note
All claims expressed in this article are solely those of the authors and do not necessarily represent those of their affiliated organizations, or those of the publisher, the editors and the reviewers. Any product that may be evaluated in this article, or claim that may be made by its manufacturer, is not guaranteed or endorsed by the publisher.
Supplementary material
The Supplementary Material for this article can be found online at: https://www.frontiersin.org/articles/10.3389/fenrg.2025.1500515/full#supplementary-material
References
Agarwal, B., Pathak, V., Nagar, B., and Chauhan, B. (2024). Driving towards sustainability: a comprehensive review of electric vehicles. Int. J. Marit. Eng. 1, 19–26. doi:10.5750/ijme.v1i1.1333
Ahmadi, S., Anam, K., and Saleh, A. (2020). “Steering system of electric vehicle using extreme learning machine,” in 2020 7th international conference on electrical engineering, computer sciences and informatics (EECSI) (IEEE), 105–108.
Akshay, K., Grace, G., Gunasekaran, K., and Samikannu, R. (2024). Power consumption prediction for electric vehicle charging stations and forecasting income. Sci. Rep. 14, 6497. doi:10.1038/s41598-024-56507-2
Ali, I., and Naushad, M. (2022). A study to investigate what tempts consumers to adopt electric vehicles. World Electr. Veh. J. 13, 26. doi:10.3390/wevj13020026
Chandra, A., Srivastava, A., and Devarasan, E. (2023). Strategic placement of electric vehicle charging infrastructure for sustainable mobility in Maharashtra. Int. J. Recent Innovations Trends Comput. Commun. 11, 4295–4299.
Dai, Z., and Zhang, B. (2023). Electric vehicles as a sustainable energy technology: observations from travel survey data and evaluation of adoption with machine learning method. Sustain. Energy Technol. Assessments 57, 103267. doi:10.1016/j.seta.2023.103267
de Rubens, G. (2019). Who will buy electric vehicles after early adopters? using machine learning to identify the electric vehicle mainstream market. Energy 172, 243–254. doi:10.1016/j.energy.2019.01.114
Dixit, S., and Singh, A. (2022). Predicting electric vehicle (ev) buyers in India: a machine learning approach. Rev. Socionetwork Strateg. 16, 221–238. doi:10.1007/s12626-022-00109-9
Fescioglu-Unver, N., and Aktas, M. (2023). Electric vehicle charging service operations: a review of machine learning applications for infrastructure planning, control, pricing, and routing. Renew. Sustain. Energy Rev. 188, 113873. doi:10.1016/j.rser.2023.113873
Govathoti, S. (2024). V2g nonlinear connection in ev’s for wireless and sustainable mobility with support of machine learning. Commun. Appl. Nonlinear Analysis 31, 214–233. doi:10.52783/cana.v31.637
Haghani, M., Sprei, F., Kazemzadeh, K., Shahhoseini, Z., and Aghaei, J. (2023). Trends in electric vehicles research. Transp. Res. Part D Transp. Environ. 123, 103881. doi:10.1016/j.trd.2023.103881
Infanto, V., and Pandiaraj, S. (2023). A study on demand side incentives offered to consumers for purchase of electric vehicles in Tamil nadu. South India J. Soc. Sci. 25, 1–10.
Jin, W., Li, C., and Zheng, M. (2024). Sustainable energy management in electric vehicle secure monitoring and blockchain machine learning model. Comput. Electr. Eng. 115, 109093. doi:10.1016/j.compeleceng.2024.109093
Kalita, M., and Hussain, G. (2021). Opportunities and challenges of electric vehicles in India. IJERT 10, 33.
Kautish, P., Lavuri, R., Roubaud, D., and Grebinevych, O. (2024). Electric vehicles’ choice behaviour: an emerging market scenario. J. Environ. Manag. 354, 120250. doi:10.1016/j.jenvman.2024.120250
Kavcic, M., Mutavdzija, M., and Buntak, K. (2022). New paradigm of sustainable urban mobility: electric and autonomous vehicles—a review and bibliometric analysis. Sustainability 14, 9525. doi:10.3390/su14159525
Khusanboev, I., Yodgorov, I., and Karimov, B. (2023). “Advancing electric vehicle adoption: insights from predictive analytics and market trends in sustainable transportation,” in Proceedings of the 7th international conference on future networks and distributed systems, 314–320.
Kim, J. H., Lee, G., Park, J. Y., Hong, J., and Park, J. (2019). Consumer intentions to purchase battery electric vehicles in korea. Energy Policy 132, 736–743. doi:10.1016/j.enpol.2019.06.028
Menyhart, J. (2024). Overview of sustainable mobility: the role of electric vehicles in energy communities. World Electr. Veh. J. 15, 275. doi:10.3390/wevj15060275
Mesimäki, J., and Lehtonen, E. (2023). Light electric vehicles: the views of users and non-users. Eur. Transp. Res. Rev. 15, 33. doi:10.1186/s12544-023-00611-3
Miconi, F., and Dimitri, G. (2023). A machine learning approach to analyse and predict the electric cars scenario: the Italian case. PLoS One 18, e0279040. doi:10.1371/journal.pone.0279040
Moreno Rocha, C., Ospino, M., Ramos, I., and Guzman, A. (2024). Enhancing sustainable mobility: multi-criteria analysis for electric vehicle integration and policy implementation. Int. J. Energy Econ. Policy 14, 205–218. doi:10.32479/ijeep.15021
Neeraja, B., Singh, R., Panda, S., Kumar, S., and Singh, P. (2023). “A machine learning model develops the electrical energy consumption and costs for charging evs through the grid,” in 2023 international conference on advances in computing, communication and applied informatics (ACCAI) (IEEE), 1–6.
Obrador Rey, S., Canals Casals, L., Gevorkov, L., Cremades Oliver, L., and Trilla, L. (2024). Critical review on the sustainability of electric vehicles: addressing challenges without interfering in market trends. Electronics 13, 860. doi:10.3390/electronics13050860
Pamidimukkala, A., Kermanshachi, S., Rosenberger, J., and Hladik, G. (2024). Barriers and motivators to the adoption of electric vehicles: a global review. Green Energy Intell. Transp. 3, 100153. doi:10.1016/j.geits.2024.100153
Punyavathi, R., Pandian, A., Singh, A., Bajaj, M., Tuka, M., and Blazek, V. (2024). Sustainable power management in light electric vehicles with hybrid energy storage and machine learning control. Sci. Rep. 14, 5661. doi:10.1038/s41598-024-55988-5
Razmjoo, A., Ghazanfari, A., Jahangiri, M., Franklin, E., Denai, M., Marzband, M., et al. (2022). A comprehensive study on the expansion of electric vehicles in europe. Appl. Sci. 12, 11656. doi:10.3390/app122211656
Saldarini, A., Miraftabzadeh, S., Brenna, M., and Longo, M. (2023). Strategic approach for electric vehicle charging infrastructure for efficient mobility along highways: a real case study in Spain. Vehicles 5, 761–779. doi:10.3390/vehicles5030042
Singh, A., Sharma, K., Rengarajan, A., and Gautam, A. (2024). Promoting sustainable transportation solutions through electric vehicles in smart cities. E3S Web Conf. EDP Sci. 540, 02021. doi:10.1051/e3sconf/202454002021
Tripathy, N., Hota, S., Satapathy, P., Nayak, S., and Prusty, S. (2023). “An empirical analysis of electric vehicle in urban transportation market using deep-learning techniques,” in 2023 IEEE 3rd international conference on sustainable energy and future electric transportation (SEFET) (IEEE), 1–5.
Vajsz, T., Horváth, C., Geleta, A., Wendler, V., Bálint, R., Neumayer, M., et al. (2022). “An investigation of sustainable technologies in the field of electric mobility,” in 2022 IEEE 1st international conference on cognitive mobility (CogMob) (IEEE).
Keywords: electric vehicles, energy efficiency, energy storage, machine learning, energy security, sales trends, charging infrastructure, sustainable growth
Citation: Devarasan E, Nagarajan D and Rachel J (2025) Advancing sustainable mobility in India with electric vehicles: market trends and machine learning insights. Front. Energy Res. 13:1500515. doi: 10.3389/fenrg.2025.1500515
Received: 23 September 2024; Accepted: 03 February 2025;
Published: 28 April 2025.
Edited by:
Mufutau Adekojo Waheed, Federal University of Agriculture, Abeokuta, NigeriaReviewed by:
Dimitrios Nalmpantis, Aristotle University of Thessaloniki, GreeceOlasunkanmi Ismaila, Federal University of Agriculture, Abeokuta, Nigeria
Adekunle Oyelami, Federal University of Agriculture, Abeokuta, Nigeria
Copyright © 2025 Devarasan, Nagarajan and Rachel. This is an open-access article distributed under the terms of the Creative Commons Attribution License (CC BY). The use, distribution or reproduction in other forums is permitted, provided the original author(s) and the copyright owner(s) are credited and that the original publication in this journal is cited, in accordance with accepted academic practice. No use, distribution or reproduction is permitted which does not comply with these terms.
*Correspondence: Ezhilmaran Devarasan, ZXpoaWwuZGV2YXJhc2FuQHlhaG9vLmNvbQ==