 Brahim Belmahdi
- Abdelmalek Essaadi University, Tetouan, Morocco
Developing an accurate mathematical model for parameter extraction in photovoltaic modules is a crucial endeavor in optimizing photovoltaic energy systems. This study seeks to assess and compare various analytical and numerical methods for extracting the primary five parameters of photovoltaic modules. Specifically, six established approaches based on a single diode model (SDM) are employed, including the methods introduced by Khan et al., Blas et al., Phang et al., Vika, Cubas et al., and Almonacid et al. The performance of these approaches is evaluated and compared under standard test conditions (STC) with a focus on maximum power point current and voltage. The analytical and numerical methods demonstrate their precision in predicting photocurrent-voltage (I-V) and power-voltage (U-V) curves, with the exception of the Almonacid et al. method, which tends to underestimate the I-V curve at the module’s maximum power. Among these methods, the Phang et al. approach stands out, displaying a strong agreement between experimental data and the predicted curve. This is evidenced by the lower values of root mean square error (RMSE), mean bias error (MBE), normalized RMSE (NRMSE), mean absolute percentage error (MAPE), and absolute error (AE). These findings underscore the high quality of results obtained through the Phang et al. method.
1 Introduction
The escalating costs of fossil fuels and their detrimental impact on the environment, including air pollution resulting from greenhouse gas emissions like carbon dioxide and methane, have spurred global efforts to explore and develop clean and renewable energy technologies (Yahya-Khotbehsara and Shahhoseini, 2018). Solar energy, with its abundant intensity, offers a swift and straightforward means of conversion into photovoltaic (PV) electricity. This conversion leverages the inherent properties of semiconductors, making it a promising and effective renewable energy resource (Sheraz Khalid and Abido, 2014). In various energy conversion systems, it is possible to represent certain electrical photovoltaic (PV) characteristics using an equivalent electrical circuit. This approach is suitable for accurately emulating the actual behavior of solar cells, ensuring that the simulated data closely aligns with the measured current-voltage (I-V) data across all operational conditions (Chin et al., 2015). Among these representation methods, some well-known equivalent electrical circuits include the single diode model (SDM), double diode model (DDM), and third diode model (TDM). These models have gained popularity and are employed by numerous researchers due to their high precision and performance. Moreover, the utilization of an increased number of parameters for extracting PV module characteristics within the single diode model enhances the accuracy of predicting the I-V behavior under varying solar radiation levels. This presents an intriguing opportunity in the research literature.
Parameter extraction methods can be categorized based on several factors, including the quantity of data samples involved in the extraction process, the specific method utilized, and the mathematical approach applied. In terms of the mathematical approach, the extraction of parameters from photovoltaic modules is typically classified into three main categories: numerical, analytical, and evolutionary methods. The primary objective of these methods is to establish a strong correlation and achieve an optimized fit between the theoretical and experimental I-V characteristics of solar cells (Yahya-Khotbehsara and Shahhoseini, 2018; Appelbaum and Peled, 2014). Given that a significant number of I-V data samples are utilized during the parameter extraction process, these optimization methods are considered to collectively result in substantial improvements in obtaining the final parameter values. The relevant literature offers a wealth of references on parameter extraction. An uncomplicated method for extracting the five parameters was introduced by Villalva et al. (2009), Cubas et al. is one of the most cited contributors in this field. Their technique, aimed at reducing the gap between estimated and experimental peak power values, involves incorporating the series resistance as a parameter. However, a limitation of this method is its use of a fixed ideality factor value of 1.3, which makes it more accurate in the vicinity of the maximum power point but less so in other regions (Cubas et al., 2014). Achouby et al. have introduced a comprehensive approach that utilizes four analytical formulas, along with certain approximations, to derive the values of four parameters. Additionally, it includes an ideality factor, which is typically defined to be around 1.3 (El Achouby et al., 2018). Zaimi et al. have developed a highly accurate numerical method for determining the five physical parameters of photovoltaic modules. This method involves fine-tuning the ideality parameter and enhancing a system of nonlinear equations. It's worth noting that the initial estimates for the four physical criteria in their method need to be precise for it to work effectively (Zaimi et al., 2019). Stornelli et al. have introduced an innovative approach that combines both numerical and well-established methodologies. In this method, it's essential to have consistent initial values for the shunt resistance and ideality factor, which are vital for its effectiveness. This approach presents a new and promising way to determine the five parameters of photovoltaic modules (Stornelli et al., 2019). This condensed technique allows for the identification of the ideal values for both the ideality parameter and the shunt resistance. Sera et al. (2008) Finding the ideal value of the ideality parameter and the shunt resistance is made possible by this condensed technique. The shunt resistance (Rsh) was advised to be disregarded by Sera et al. for the purpose of condensing the five-parameter model to a four-parameter model, Cannizzaro et al. (2014) proposed ignoring either Rs or Rsh. To make the computation simpler. Other analytical techniques call for more inputs, such as those in the Celik and Acikgoz (2007), Khan et al. (2013), and Bai et al. (2014) models, which call for extra inputs of estimating or computing Rsho and Rso, or the slopes at both short-circuit (SC) and open-circuit (OC) locations. For the purpose of determining the five parameters, Batzelis and Papathanassiou (2016) and Saleem and Karmalkar (2009), Karmalkar and Haneefa (2008) also added new coefficients. Another approach was set forth by Bellia et al. (2014), Wang et al. (2017) and Hussein (2017) and is based on obtaining a closed-form equation for Rs and then numerically solving this expression for various ideality factor values. Iteratively calculating Rs, Rsh, and Iph is the foundation of Vika’s approach (Breisnes Vika, 2014).
In this study, the single diode model serves as a baseline for extracting parameters related to photo-generated current (Iph), diode saturation current (I0), diode ideality factor (α), series resistance (Rs), and shunt (or parallel) resistance (Rsh) under standard conditions (STC conditions, G = 1000 W/m2, T = 25°C). Furthermore, the extracted parameters are employed to assess and compare six analytical/numerical methods, namely, the Khan et al. method, Blas et al. method, Phang et al. method, Vika method, Cubas et al. method, and Almonacid et al. method. The performance of these methods is analyzed using data sheets provided by the manufacturers of three main photovoltaic modules: the S70 and SM-210W polycrystalline, SP 75 and SPR-230 WHT-I monocrystalline, and Shell ST36 and U-EA110W thin film. All computations are conducted using Matlab software. The two sections of our study are as follows: The first section outlines the methods used by each author to extract the main five parameters of the single diode model, followed by an assessment and comparison of the effectiveness of each approach.
2 Theoretical base of analytical/numerical approaches
PV module performance accuracy is evaluated by examining the I-V characteristic under standard conditions. Various methods exist for modeling PV cells, offering different degrees of approximation to the actual device behavior. According to (Louzazni and Belmahdi, 2022), the SDM is the most commonly used approximation for PV module modeling. The SDM enables the extraction of five main parameters: the photo-generated current (Iph), diode saturation current (I0), diode ideality factor (α), series resistance (Rs), and shunt (or parallel) resistance (Rsh). These parameters are interrelated through a specific equation and are illustrated in Figure 1.
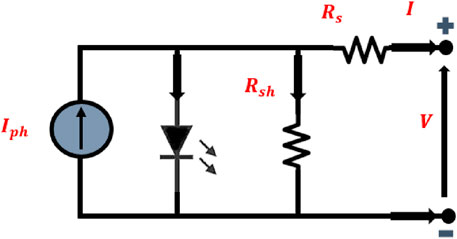
Figure 1. The five-parameter model’s equivalent circuit.
Where
Where
Concerning performance evaluation, the I-V characterization offers valuable insights into the crucial aspects of PV cells. In this context, the precise estimation of the parameters outlined in Equation 1 is detailed through the application of six methods namely, the Khan et al. method (Khan et al., 2013), Blas et al. method (De Blas et al., 2002), Phang et al. method (Phang et al., 1984), Vika method (Breisnes Vika, 2014), Cubas et al. method (Cubas et al., 2014), and Femia et al. (Femia et al., 2012) method. The performance and effectiveness of these approaches are systematically assessed and compared under standard test conditions (STC conditions).
2.1 Khan et al. method
The Khan et al. method is an analytical technique specifically designed for parameter extraction from silicon solar cells. This method focuses on obtaining parameters of PV cells under high radiation conditions. The extraction process involves utilizing initial values from key parameters such as
2.2 Blas et al. method
The Blas et al. method is an analytical approach employed for the extraction of parameters associated with PV cell behavior. This method relies on a set of experimentally measured voltage-intensity curves conducted under elevated temperature and high radiation levels. The values obtained from these experiments are then used to extract model parameters. Similar to the previously described method, the extraction of parameters from Equation 1 is performed for the specified temperature and solar radiation levels, utilizing initial values of
The calculation of
1. Initial value assignment for
2. Approximate estimation of both
3. Recalculation of
4. Iterative repetition of step 3 until
The remaining measured data has been discussed in previous sections.
2.3 Phang et al. method
The Phang et al. method is an analytical approach designed for the extraction of the primary five parameters from different single-junction PV cells under standard levels of solar radiation and cell temperature. The estimation of
The parameters of Equation 1 are estimated and given as follows (Equations 14–16):
The value of
2.4 Vika method
The Vika method, also known as the Vika algorithm, is employed for the extraction of parameters from PV cells under standard solar radiation and cell temperature conditions. This method involves fitting the dataset adequately for a specified number of iterations, incorporating variables such as
2.5 Cubas et al. method
The Cubas et al. method is an analytical technique designed to extract parameters for various types of PV technology under standard levels of radiation and cell temperature. Similar to the previously discussed methods, the extraction of parameters from Equation 1 is estimated using initial values of
2.6 Almonacid et al. Method
The Almonacid et al. (2016) method is a numerical approach employed for the extraction of parameters from PV cells. This method is based on a developed system with non-linear implicit equations derived from Equation 1. Within this system, the primary five unknown parameters are solved using the trust-region optimization algorithm (Powell, 1968). This algorithm enhances robustness, especially when dealing with initial values that are far from the solution. Additionally, it can handle cases where the Jacobian becomes singular at a specific iteration. The initial values of
In the Vika, Cubas et al., and Almonacid et al. methods, the parameter α remains unidentified. To address this, multiple trials are conducted to solve the equation system within a defined interval [0.1, 1.5], with the mm parameter changing in increments of 0.1. The solutions obtained through these trials are then regarded as the extracted parameters of the I-V curve.
The selected methods were chosen for their established accuracy, reliability, and relevance to the study’s objectives. Each method offers unique strengths that make it suitable for analyzing PV systems. Phang et al. is renowned for accurately modeling I-V and P-V curves near the maximum power point, ensuring reliable performance evaluation across different PV technologies. Blas et al. provides detailed modeling that incorporates environmental factors, making it applicable in diverse climatic conditions. Khan et al. focuses on computationally efficient approaches, ideal for real-time or large-scale applications. Vika contributes valuable insights into system behaviors and environmental interactions, while Cubas et al. emphasizes parameter extraction and practical implementation for accurate and dependable results. Together, these methods offer a comprehensive and balanced evaluation framework.
3 Result and discussion
To examine the outcomes obtained from the analytical/numerical methods discussed in the preceding section, MATLAB software was employed to estimate the primary five parameters extracted using the SDM for three distinct PV module technologies. These technologies include polycrystalline (p-Si), monocrystalline (m-Si), and thin film. The performance of the selected methods is evaluated based on the electrical characteristics at STCs, manufacturing conditions, and the temperature coefficients for the maximum power point (MPP) of the utilized photovoltaic modules, as outlined in Table 1.
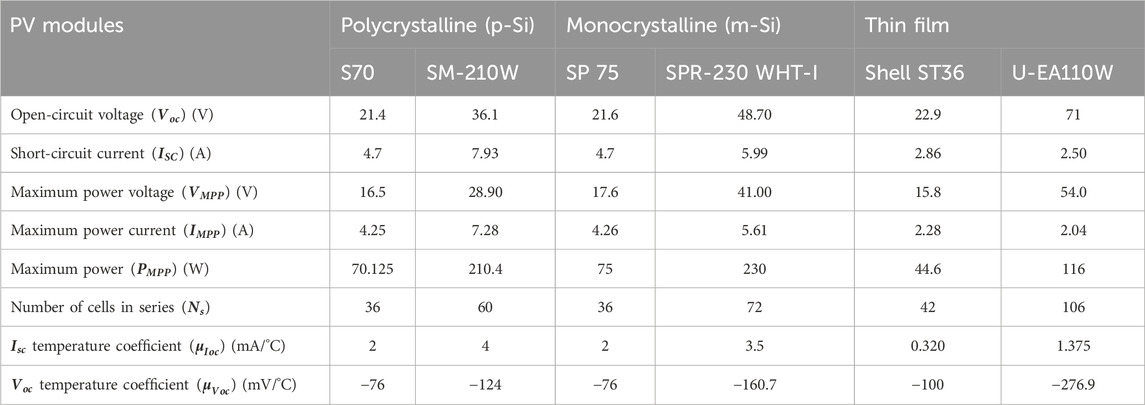
Table 1. Electrical properties of three PV technologies.
To evaluate and compare the selected methods, various statistical metrics are employed to gauge the precision of our analytical/numerical approaches for extracting parameters from PV modules operating under STCs and manufacturing conditions. The primary statistical metrics include root mean square error (RMSE), mean bias error (MBE), mean absolute percentage error (MAPE), normalized root mean square error (NRMSE), and Absolute error (AE). The mathematical expressions (Equations 28–32) for these statistical metrics are provided as follows:
Where
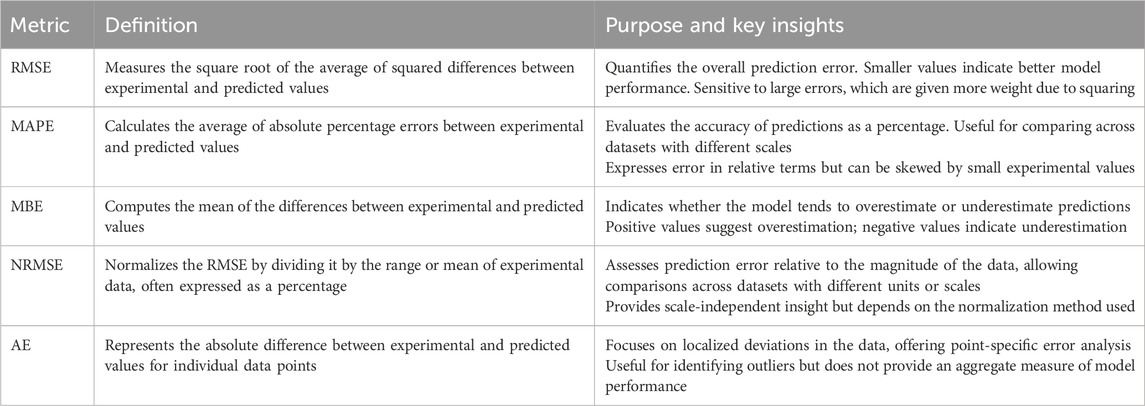
Table 2. Comparison of statistical metrics for evaluating PV module parameter extraction methods.
In this section, the analysis of the results obtained from the methods described in the previous section is presented. To facilitate this analysis, several I-V curves spanning the full operational range of the PV technologies were selected. Initially, the recorded I-V curves were analyzed as a function of cell temperature and effective irradiance.
Based on this analysis, the I-V curves presented in Table 3 were identified as a representative dataset for the various photovoltaic (PV) technologies under real operating conditions. Specifically, Curve 1 corresponds to I-V curves near the peak of the data distribution, representing typical working conditions for the PV modules. Further details on these representative I-V curves can be found in Table 3. The criteria above, as well as the I-V curves shown in Table 3, are the same previously considered by the authors to validate the models analyzed in (Almonacid et al., 2016).

Table 3. Effective normal irradiance, cell temperature, and the main electrical parameters derived from the I-V curves used for method evaluation.
The main findings of the analytical/numerical methods are presented in Tables 4–6, respectively. It is evident from Tables 4–6 that the predictions of all selected methods are approximately the same for the assessment of
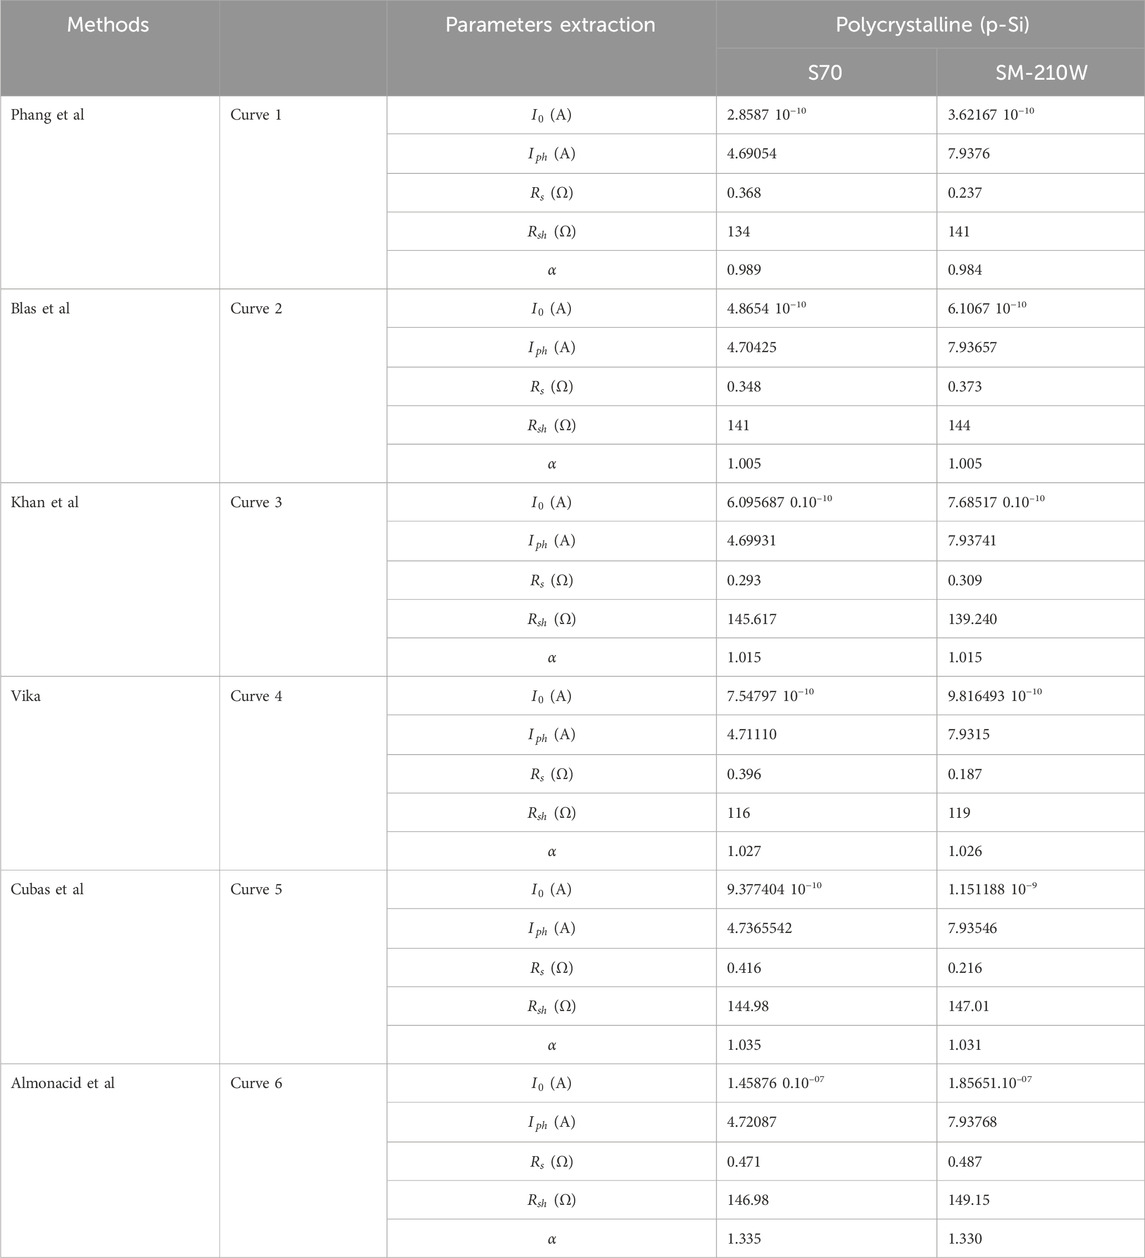
Table 4. Parameters extraction of Polycrystalline (p-Si) module.
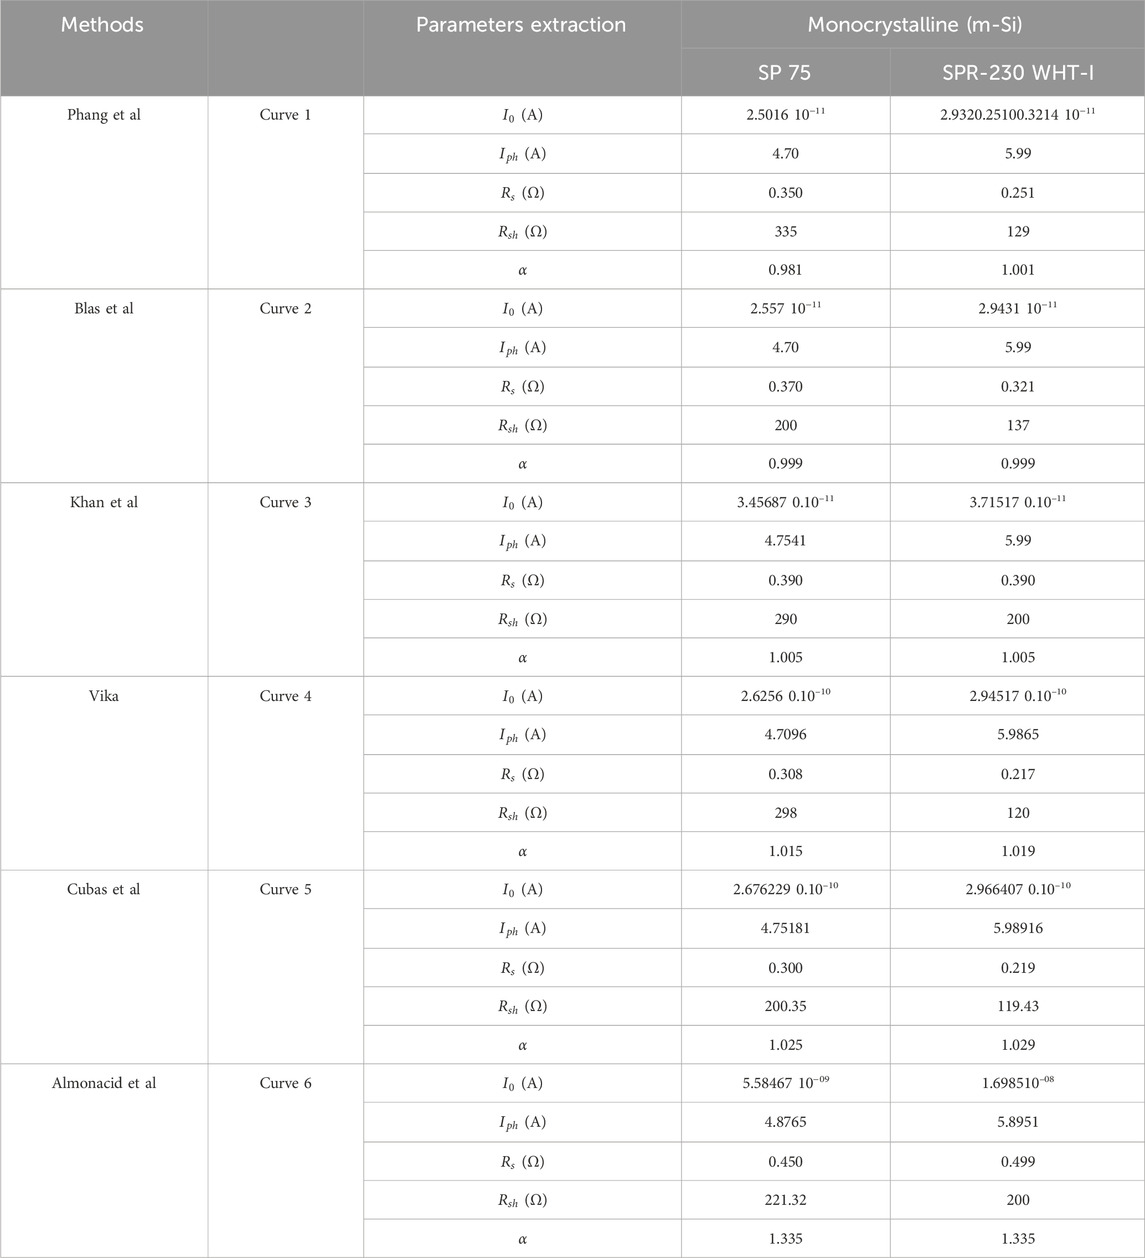
Table 5. Parameters extraction of Monocrystalline (m-Si) module.
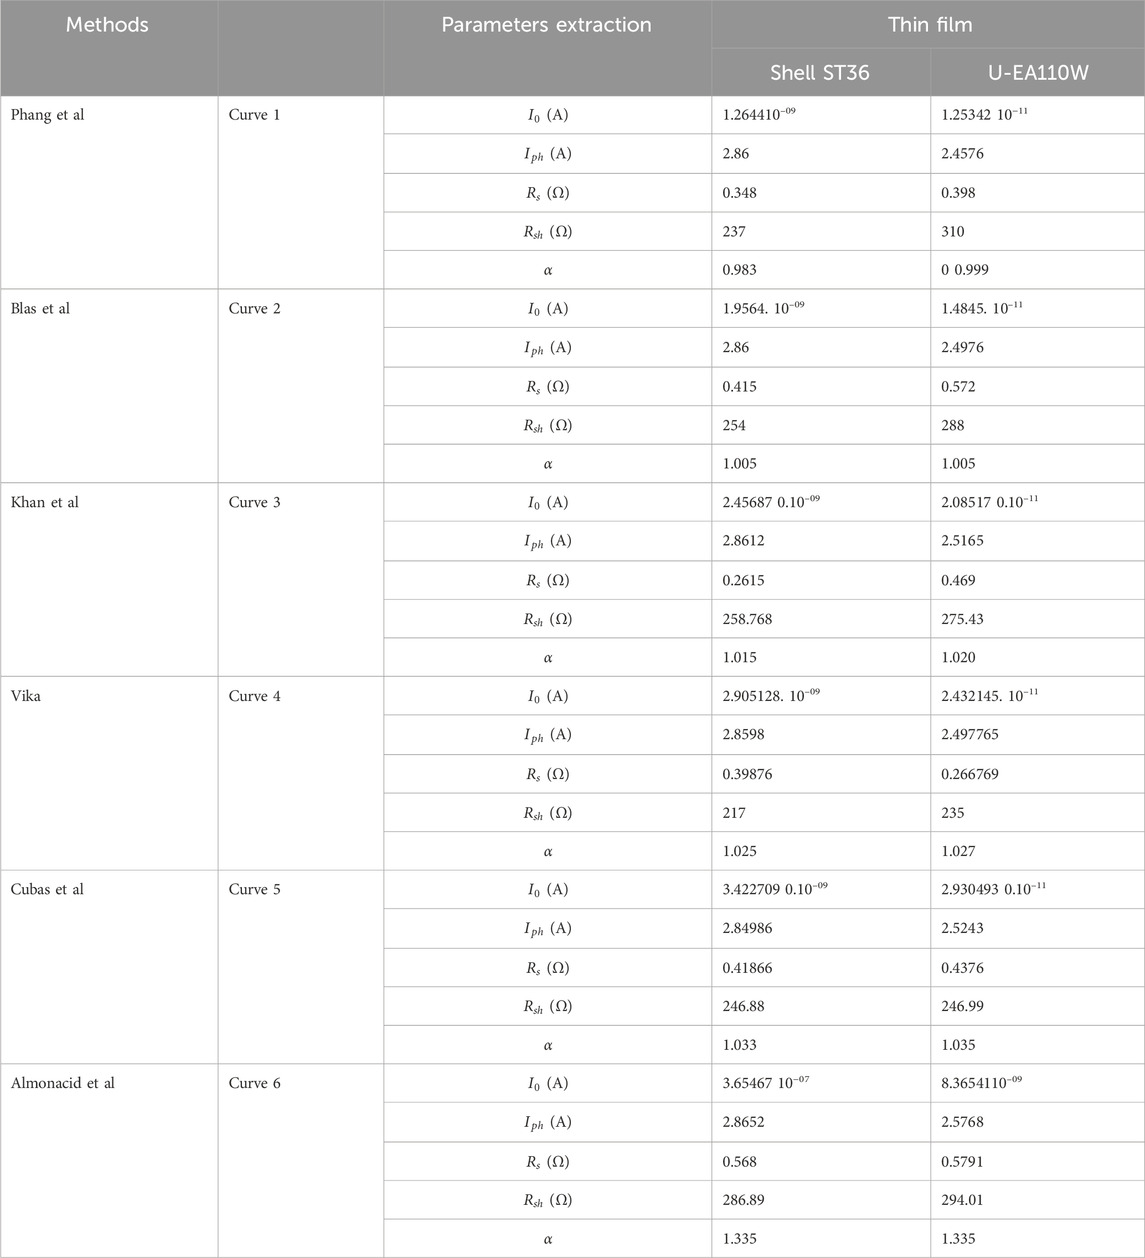
Table 6. Parameters extraction of thin film module.
In terms of the ideality factor, the estimated value of α is technology-dependent (p-Si, m-Pi, and thin film). It is clear from the three technologies of PV modules that all proposed methods predict a significant value of the ideality factor except for the last (Almonacid et al.) method. The range values of Phang et al., Vika, Cubas et al., Khan et al., and Blas et al. methods are between 0.983 and 1.335 for the three technologies. The Almonacid et al. method presents almost the same prediction values with a slight variation, which is higher compared to the other methods.
According to Tables 4–6, Phang et al., Vika, Cubas et al., Khan et al., and Blas et al. methods surpass the Almonacid et al. methods in terms of
To evaluate the performance accuracy of each method under standard conditions (GNI = 1000 W/m2, T = 25°C), the figures below depict both I-V and P-V curves for three technologies (polycrystalline, monocrystalline, and thin film). As evident from the figures, all the proposed methods exhibit well-fitted curves, indicating good agreement with experimental data at standard conditions. Notably, the Almonacid et al. method for the three technologies demonstrates the least favorable curve compared to the preceding methods.
Figures 2A–D depicts the I-V and P-V curves of S-70 and SM-210W p-Si PV modules generated by six methods under STC conditions. The predictive methods exhibit high performance across all methods, excluding the Almonacid et al. method. Considering both Table 7 and Figures 2A–D, Phang et al., Blas et al., Khan et al., and Vika methods are deemed appropriate, closely aligning with experimental data. The range values of RMSE (%), MBE (%), and MAPE are 0.080575, −0.95201166, and 0.0722083 for S-70, and 0.20266, 0.98897, and 0.10125 for SM-210W polycrystalline PV modules, respectively. In terms of I-V and P-V curves, the Cubas et al. method exhibits a slight variation compared to the preceding methods. The Almonacid et al. method records the highest value of NRMSE, approximately 0.25906 and 0.48904 for S-70 and SM-210W, respectively. The results obtained from the single diode model for polycrystalline modules indicate that the SM-210W module is more accurate compared to the S-70 PV module.
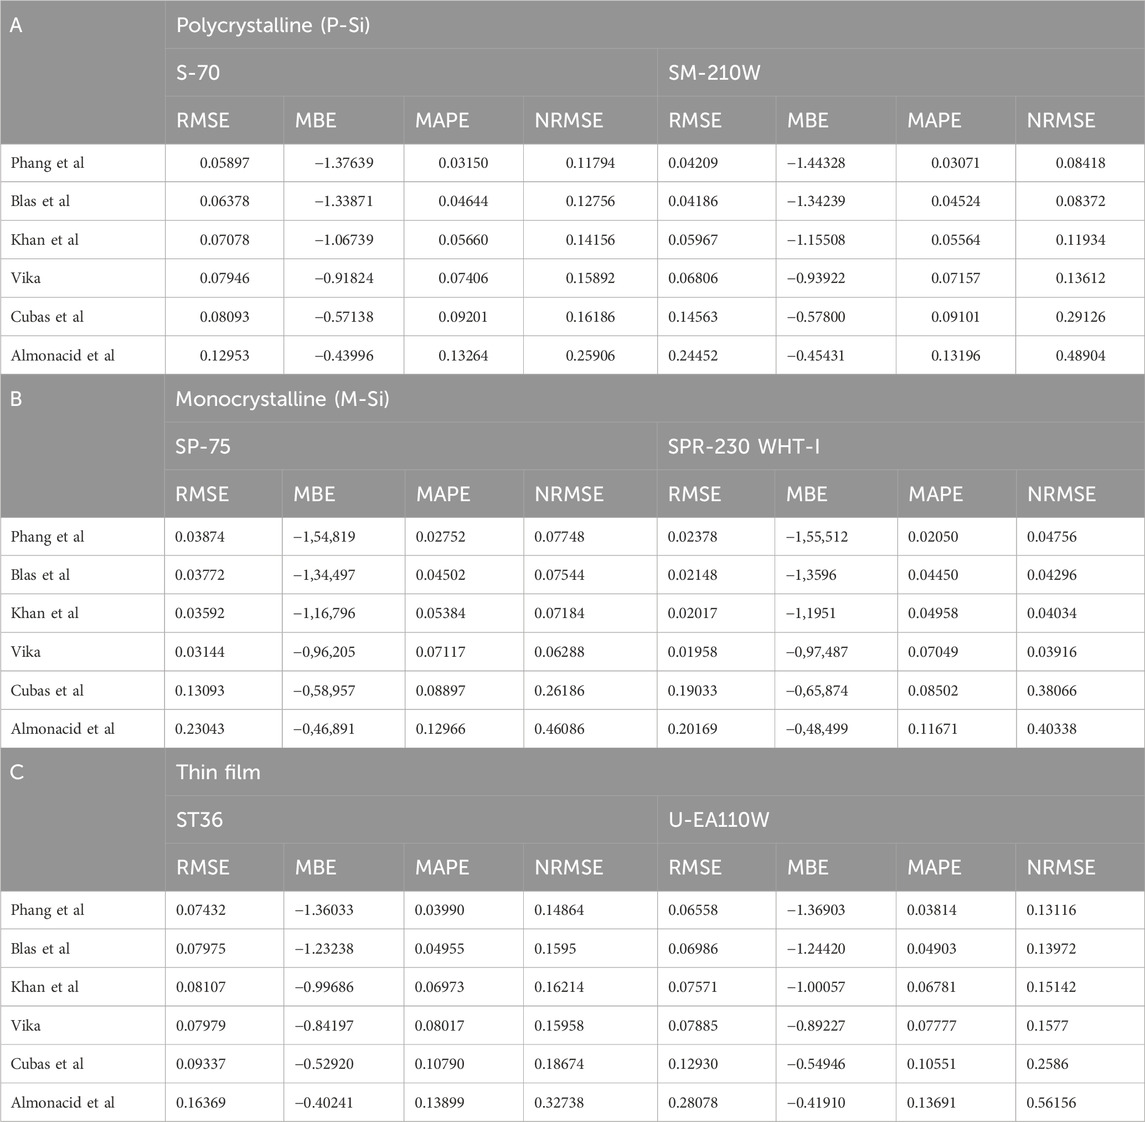
Table 7. Statistical metric of all proposed methods for three different technologies.
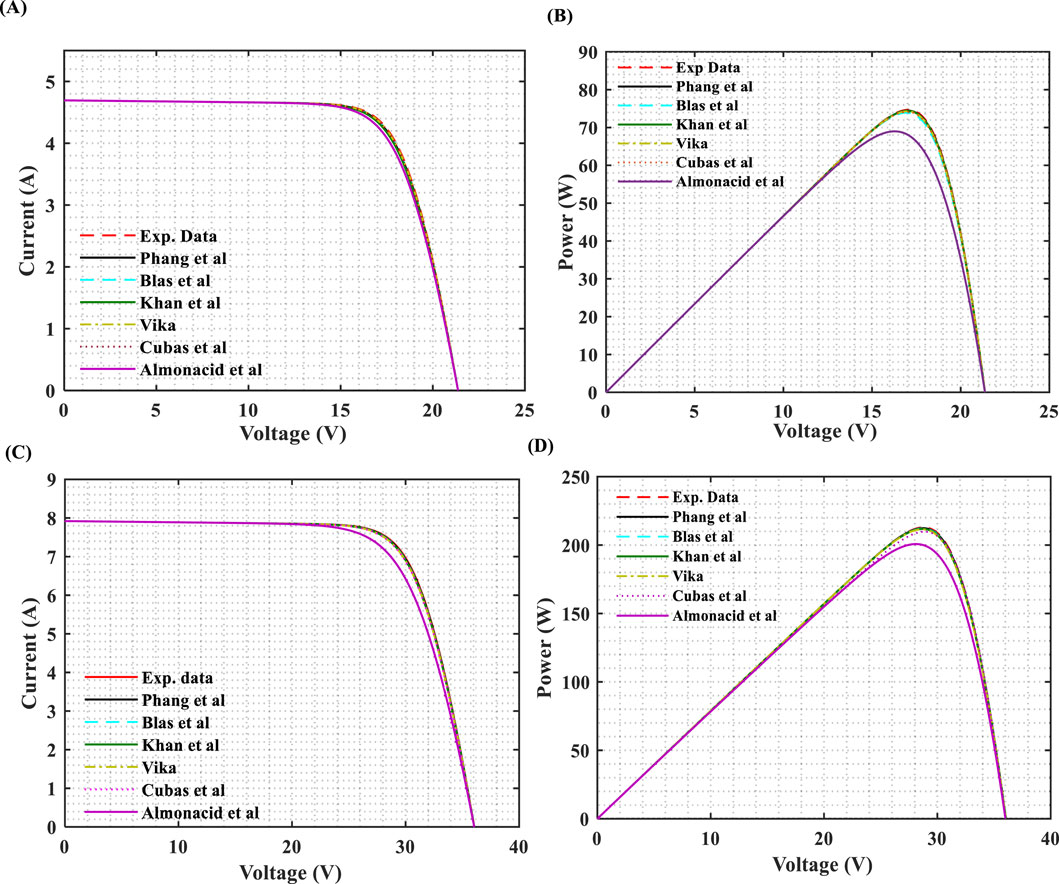
Figure 2. Model curves vs experimental data of the (A–B) S-70 and (C–D) SM-210W Polycrystalline PV modules under STCs.
Figures 3A–D provides a comparative analysis of six proposed methods for SP-75 (A-B) and SPR-230 WHT-I (C-D) monocrystalline PV modules under STCs. This figure illustrates the I-V and P-V curves for each method, highlighting the relationship between the prediction methods and experimental data. Referring to Table 7 and Figures 3A–D, the maximum and minimum values of RMSE (%) vary between 0.23043 and 0.03144 for SP-75 monocrystalline silicon and 0.20169 and 0.01958 for SPR-230 WHT-I monocrystalline silicon, respectively. The range values of RMSE (%) suggest that the Phang et al., Blas et al., Khan et al., Vika, and Cubas et al. methods exhibit smaller values than the Almonacid et al. method. In terms of I-V and P-V curves for SP-75 and SPR-230 WHT-I monocrystalline PV modules, the methods depicted in Figures 3A–D closely align with the experimental data, earning recognition as “the most accurate prediction methods” compared to the S-70 and SM-210W polycrystalline PV modules.
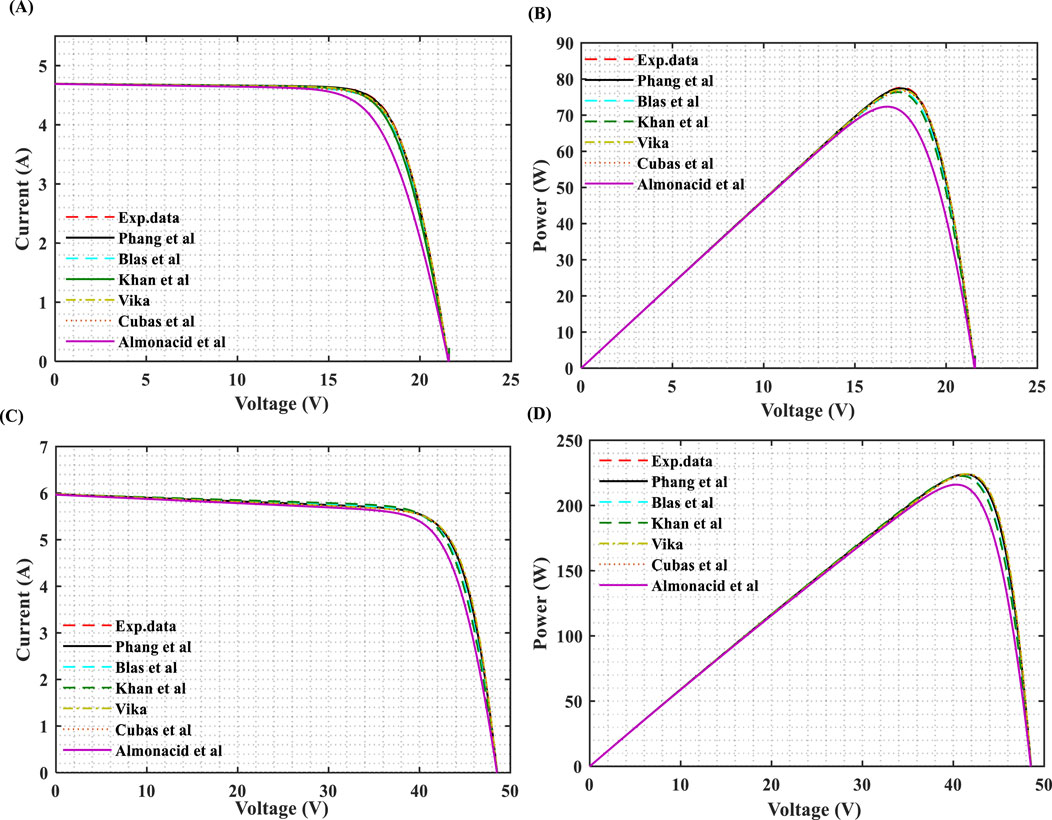
Figure 3. Model curves vs experimental data of the (A–B) SP-75 and (C–D) SPR-230 WHT-I Monocrystalline PV modules under STCs.
Figures 4A–D and Table 7 present the prediction accuracy of Phang et al., Blas et al., Khan et al., Vika, Cubas et al., and Almonacid et al. methods under STCs for (A-B) ST36 and (C-D) U-EA110W thin film PV modules. Among the six methods, Phang et al., Blas et al., Khan et al., Vika, and Cubas et al. exhibit the lowest values of MBE (%), MBE (%), MAPE, and RMSE. In terms of I-V and P-V curves, all five methods curve well compared to the Almonacid et al. method and closely align with the experimental data. It is evident from the table that the U-EA110W thin film PV module is more accurate compared to the ST36 thin film PV module. Similarly, consistent with the previous prediction methods, thin film PV modules are recognized as “the least accurate prediction methods” compared to monocrystalline and polycrystalline PV modules.
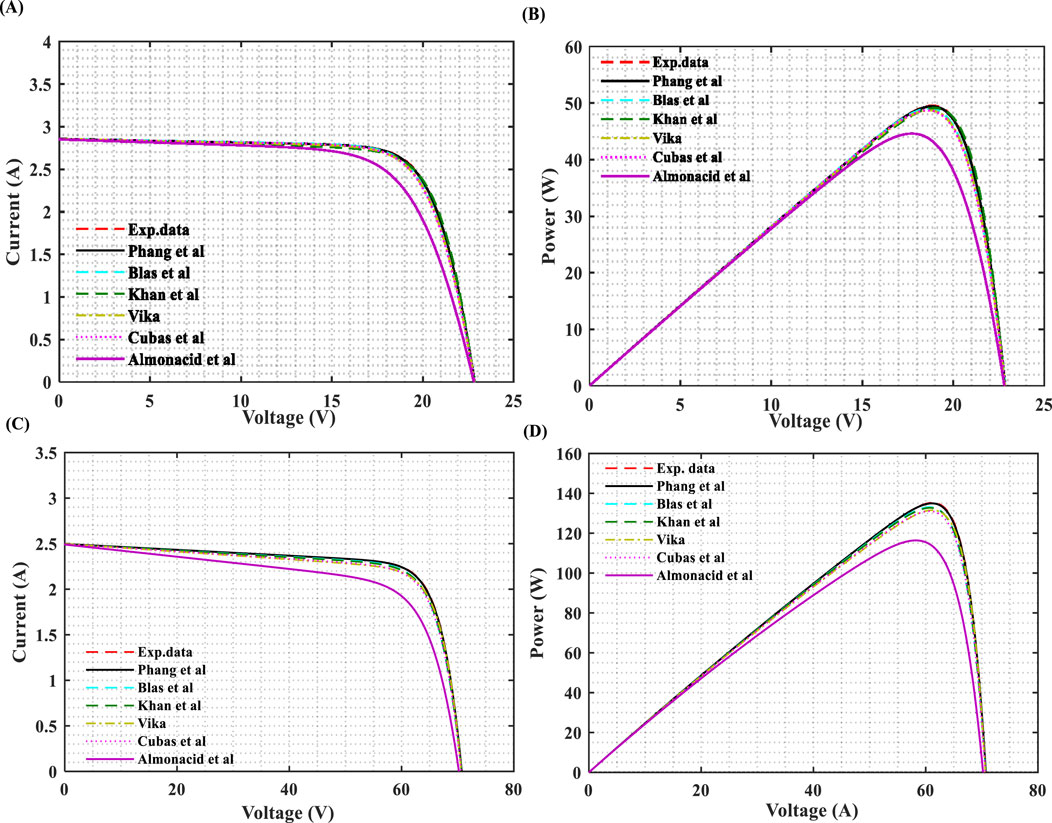
Figure 4. Model curves vs experimental data of the Shell (A–B) ST36 and (C–D) U-EA110W Thin film PV modules under STCs.
Table 7 provides numerical values for the selected methods, employing computational performance analysis to compare and evaluate their accuracy in predicting experimental data for monocrystalline, polycrystalline, and thin film PV modules. The results show that all methods, except for Almonacid et al., exhibit lower prediction errors for the three PV technologies at the maximum power point. It is important to note that there is no specific criterion for determining which method is more appropriate, as no technique consistently outperforms the others under all conditions. Nevertheless, the Phang et al. method demonstrated a strong alignment with experimental I-V and P-V curves, particularly near the maximum power point, based on lower RMSE, MAPE, and AE values across all PV technologies. Thus, it can be regarded as a suitable approach for all three technologies. It is worth mentioning that our findings align with those studied in (Phang et al., 1984; Chan et al., 1986), where analytical methods are highlighted for their strong performance, closely matching fitting curves and numerical methods under standard STC conditions.
In this section, the optimal technology for a SDM is illustrated in Figures 5A,B. The figures depict the AE versus PV module voltage for both SP-75 and SPR-230 WHT-I monocrystalline PV modules using various methods. The maximum AE values are 0.004238 for Phang et al., 0.015832 for Almonacid et al., 0.005772 for Vika, 0.001702 for Khan et al., 0.003988 for Blas et al., and 0.004598 for Cubas et al. in the case of SP-75. Similarly, for SPR-230 WHT-I, the maximum AE values are 0.004958 for Phang et al., 0.015381 for Almonacid et al., 0.004286 for Vika, 0.000151 for Khan et al., 0.00204 for Blas et al., and 0.003514 for Cubas et al. method.
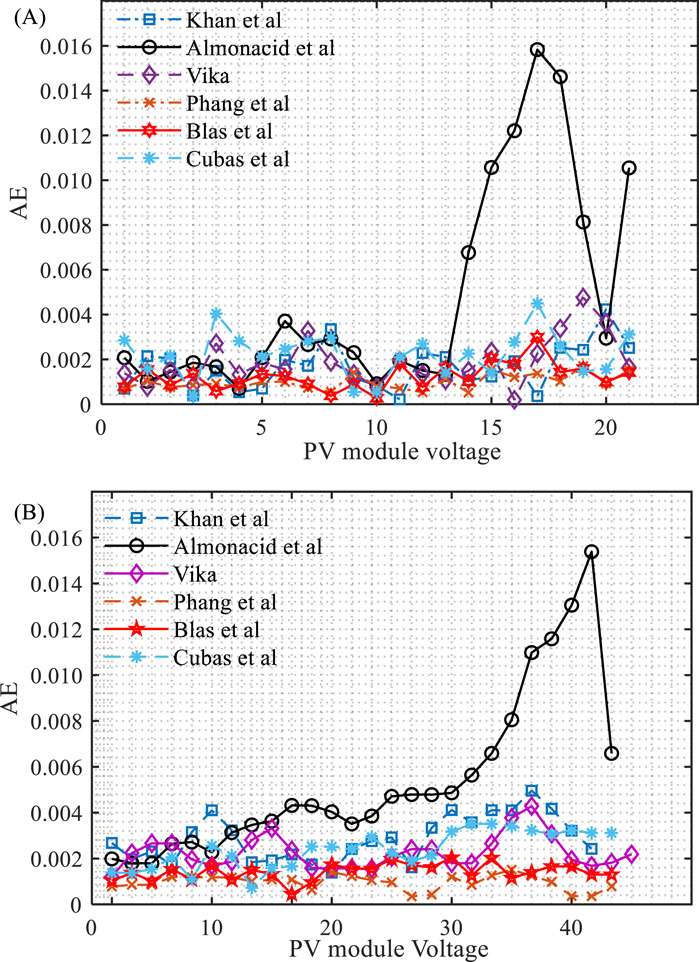
Figure 5. Absolute Error vs PV module voltage of SDM for (A) SP-75 and (B) SPR-230 WHT-I monocrystalline at STCs.
The parameter extraction for the SDM of three different photovoltaic modules has been presented, with the first five analytical/numerical methods identified as suitable models based on their lower values of several statistical metrics, particularly the Phang et al. and Blas et al. methods. The Phang et al. method, in particular, achieves high accuracy through its use of a linear fit near critical points, such as the short-circuit current and open-circuit voltage. This approach enhances its robustness in minimizing errors across different PV technologies and demonstrates strong agreement between experimental data and the predicted curves. These attributes underscore the high quality and reliability of the results obtained using the Phang et al. method for the proposed technologies.
4 Conclusion
This paper provides a comparative study of various analytical/numerical methods for estimating parameter extraction in different technologies of PV modules. The simulations were conducted under STCs using a single diode model implemented in the Matlab Environment software. Each method was introduced and modeled, and their appropriateness was assessed based on statistical metrics such as RMSE, NRMSE, MAPE, MBE, and AE.
The performance analysis of the six methods was tested across different manufacturers of monocrystalline, polycrystalline, and thin film modules. The I-V and P-V curves of all selected methods exhibited a strong relationship between experimental and predicted values, except for the Almonacid et al. method. Notably, the Phang et al., Blas et al., Khan et al., and Vika methods demonstrated lower error values for various PV modules, including S-70 and SM-210W polycrystalline, SP 75 SPR-230 WHT-I Monocrystalline, and Shell ST36 and U-EA110W thin film modules. Conversely, the Almonacid et al. method yielded the highest error values compared to the other methods.
In conclusion, the Phang et al. method is identified as the most effective for both technologies, providing high-quality results with a strong agreement between experimental and predicted values.
Data availability statement
The original contributions presented in the study are included in the article/supplementary material, further inquiries can be directed to the corresponding author.
Author contributions
BB: Conceptualization, Data curation, Formal Analysis, Funding acquisition, Investigation, Methodology, Project administration, Resources, Software, Supervision, Validation, Visualization, Writing–original draft, Writing–review and editing.
Funding
The author(s) declare that no financial support was received for the research, authorship, and/or publication of this article.
Conflict of interest
The author declares that the research was conducted in the absence of any commercial or financial relationships that could be construed as a potential conflict of interest.
Publisher’s note
All claims expressed in this article are solely those of the authors and do not necessarily represent those of their affiliated organizations, or those of the publisher, the editors and the reviewers. Any product that may be evaluated in this article, or claim that may be made by its manufacturer, is not guaranteed or endorsed by the publisher.
References
Almonacid, F., Rodrigo, P., and Energy, E. F. (2016). undefined: determination of the current–voltage characteristics of concentrator systems by using different adapted conventional techniques. Elsevier.
Appelbaum, J., and Peled, A. (2014). Parameters extraction of solar cells - a comparative examination of three methods. Sol. Energy Mater. Sol. Cells. 122, 164–173. doi:10.1016/j.solmat.2013.11.011
Bai, J., Liu, S., Hao, Y., Zhang, Z., Jiang, M., and Zhang, Y. (2014). Development of a new compound method to extract the five parameters of PV modules. Energy Convers. Manag. 79, 294–303. doi:10.1016/j.enconman.2013.12.041
Batzelis, E. I., and Papathanassiou, S. A. (2016). A method for the analytical extraction of the single-diode PV model parameters. IEEE Trans. Sustain. Energy. 7, 504–512. doi:10.1109/TSTE.2015.2503435
Bellia, H., Youcef, R., and Fatima, M. (2014). A detailed modeling of photovoltaic module using MATLAB. NRIAG J. Astron. Geophys. 3, 53–61. doi:10.1016/j.nrjag.2014.04.001
Breisnes Vika, H. (2014). Modelling of photovoltaic modules with battery energy storage in simulink/matlab with in-situ measurement comparisons.
Cannizzaro, S., Di Piazza, M. C., Luna, M., and Vitale, G. (2014). “Generalized classification of PV modules by simplified single-diode models,” in IEEE international symposium on industrial electronics (Institute of Electrical and Electronics Engineers Inc.), 2266–2273. doi:10.1109/ISIE.2014.6864971
Celik, A. N., and Acikgoz, N. (2007). Modelling and experimental verification of the operating current of mono-crystalline photovoltaic modules using four- and five-parameter models. Appl. Energy. 84, 1–15. doi:10.1016/j.apenergy.2006.04.007
Chan, D. S. H., Phillips, J. R., and Phang, J. C. H. (1986). A comparative study of extraction methods for solar cell model parameters. Solid State Electron 29, 329–337. doi:10.1016/0038-1101(86)90212-1
Chin, V. J., Salam, Z., and Ishaque, K. (2015). Cell modelling and model parameters estimation techniques for photovoltaic simulator application: a review. Appl. Energy 154, 500–519. doi:10.1016/j.apenergy.2015.05.035
Cubas, J., Pindado, S., and Victoria, M. (2014). On the analytical approach for modeling photovoltaic systems behavior. J. Power Sources. 247, 467–474. doi:10.1016/j.jpowsour.2013.09.008
De Blas, M. A., Torres, J. L., Prieto, E., and García, A. (2002). Selecting a suitable model for characterizing photovoltaic devices. Renew. Energy. 25, 371–380. doi:10.1016/S0960-1481(01)00056-8
El Achouby, H., Zaimi, M., Ibral, A., and Assaid, E. M. (2018). New analytical approach for modelling effects of temperature and irradiance on physical parameters of photovoltaic solar module. Energy Convers. Manag. 177, 258–271. doi:10.1016/j.enconman.2018.09.054
Femia, N., Petrone, G., Spagnuolo, G., and Vitelli, M. (2012). Power electronics and control techniques for maximum energy harvesting in photovoltaic systems (Femia, N. et al; 2013). CRC Press, Taylor and Francis Group.
Hussein, A. (2017). A simple approach to extract the unknown parameters of PV modules. Turk. J. Electr. Eng. Comput. Sci. 25, 4431–4444. doi:10.3906/elk-1703-14
Karmalkar, S., and Haneefa, S. (2008). A physically based explicit $J$– $V$ model of a solar cell for simple design calculations. IEEE Electron Device Lett. 29, 449–451. doi:10.1109/LED.2008.920466
Khan, F., Baek, S. H., Park, Y., and Kim, J. H. (2013). Extraction of diode parameters of silicon solar cells under high illumination conditions. Energy Convers. Manag. 76, 421–429. doi:10.1016/j.enconman.2013.07.054
Louzazni, M., and Belmahdi, B. (2022). “Analytical modelling approach of photovoltaic curves: analysis and comparison,” in Lecture notes in networks and systems (Springer Science and Business Media Deutschland GmbH), 562–572.
Phang, J. C. H., Chan, D. S. H., and Phillips, J. R. (1984). Accurate analytical method for the extraction of solar cell model parameters. Electron. Lett. 20, 406–408. doi:10.1049/el:19840281
Powell, M. (1968). A Fortran subroutine for solving systems of non-linear algebraic equations. undefined.
Saleem, H., and Karmalkar, S. (2009). An analytical method to extract the physical parameters of a solar cell from four points on the illuminated $J{-}V$ curve. IEEE Electron Device Lett. 30, 349–352. doi:10.1109/LED.2009.2013882
Sera, D., Teodorescu, R., and Rodriguez, P. (2008). “Photovoltaic module diagnostics by series resistance monitoring and temperature and rated power estimation,” in IECON proceedings (industrial electronics conference) (IEEE Computer Society), 2195–2199.
Sheraz Khalid, M., and Abido, M. A. (2014). A novel and accurate photovoltaic simulator based on seven-parameter model. Electr. Power Syst. Res. 116, 243–251. doi:10.1016/j.epsr.2014.06.010
Stornelli, V., Muttillo, M., de Rubeis, , and Nardi, I. (2019). A new simplified five-parameter estimation method for single-diode model of photovoltaic panels. Energies 12, 4271. doi:10.3390/en12224271
Villalva, M. G., Gazoli, J. R., and Filho, E. R. (2009). Comprehensive approach to modeling and simulation of photovoltaic arrays. IEEE Trans. Power Electron. 24, 1198–1208. doi:10.1109/TPEL.2009.2013862
Wang, G., Zhao, K., Shi, J., Chen, W., Zhang, H., Yang, X., et al. (2017). An iterative approach for modeling photovoltaic modules without implicit equations. Appl. Energy. 202, 189–198. doi:10.1016/j.apenergy.2017.05.149
Yahya-Khotbehsara, A., and Shahhoseini, A. (2018). A fast modeling of the double-diode model for PV modules using combined analytical and numerical approach. Sol. Energy. 162, 403–409. doi:10.1016/j.solener.2018.01.047
Zaimi, M., El Achouby, H., Ibral, A., and Assaid, E. M. (2019). Determining combined effects of solar radiation and panel junction temperature on all model-parameters to forecast peak power and photovoltaic yield of solar panel under non-standard conditions. Sol. Energy. 191, 341–359. doi:10.1016/j.solener.2019.09.007
Nomenclature
Abbreviations
SDM Single diode model
STC Standard tests conditions
RMSE Root mean square error
MBE Mean bias error
NRMSE Mean absolute percentage error
MAPE Normalized root mean square error
AE Absolute error
DDM Double diode model
TDM Third diode model
p-Si Polycrystalline
m-Si Monocrystalline
MPP Maximum power point
GNI Global normal irradiation (W/m2)
Symbols
I-V Photocurrent–voltage
U-V Power-voltage
Rsh Shunt resistance (Ω)
Rs Series resistance (Ω)
Iph Photo-generated current (A)
I0 Diode saturation current
α Diode ideality factor
Keywords: parameter extraction, photovoltaic modules, analytical/numerical approaches, single diode model, standard test conditions, I–V characteristics
Citation: Belmahdi B (2025) Comparative study of parameter extractions of photovoltaic modules using analytical and numerical approaches. Front. Energy Res. 13:1501335. doi: 10.3389/fenrg.2025.1501335
Received: 24 September 2024; Accepted: 03 January 2025;
Published: 20 January 2025.
Edited by:
Kaiwen Sun, University of New South Wales, AustraliaReviewed by:
Yongli Lu, Massachusetts Institute of Technology, United StatesYinyan Liu, University of New South Wales, Australia
Copyright © 2025 Belmahdi. This is an open-access article distributed under the terms of the Creative Commons Attribution License (CC BY). The use, distribution or reproduction in other forums is permitted, provided the original author(s) and the copyright owner(s) are credited and that the original publication in this journal is cited, in accordance with accepted academic practice. No use, distribution or reproduction is permitted which does not comply with these terms.
*Correspondence: Brahim Belmahdi, YmVsbWFoZGkuYnJhaGltQGdtYWlsLmNvbQ==