 Muhammad Arif Budiyanto1*
 Gigin Rizki Novrian1Achmad Riadi1Gerry Liston Putra1 Gunawan1Gerasimos Theotokatos2
- 1Department of Mechanical Engineering, Universitas Indonesia Kampus Baru UI, Depok, Jawa Barat, Indonesia
- 2Naval Architecture Ocean and Marine Engineering (NAOME), University of Strathclyde, Glasgow, Scotland, United Kingdom
The demand for sustainable energy is increasing along with the increasing population in the archipelago. Liquefied natural gas (LNG) is a clean, high-efficiency energy source. The aim of this paper is to conduct a shipping cost feasibility of LNG distribution for gas power plants located in multi-island areas. In this study, small-scale LNG carrier vessels with a capacity of under 10,000 m3, which have a shallow draft, are used to distribute LNG supplies to locations with limited berth depth. The shipping route optimization method used is the capacitated vehicle routing problem combined with linear programming and a greedy algorithm with an objective function to maximize the ship’s load capacity. A shipping cost feasibility is carried out on financial assessment based on the construction of new ships and analysis of world gas prices. The results of this study obtained two route options to be supplied using two ships, 7,500 m3 and 3,587 m3, respectively, with an average speed of 13 knots. Based on the optimum route, the remaining cargo is 3.3% of the ship’s total capacity. The economic analysis shows the feasibility of LNG distribution when the selling price is at least USD 5/MMBtu with a payback period of 9 years.
1 Introduction
Liquefied natural gas (LNG) is natural gas that has been cooled to approximately −160°C (−260°F) under atmospheric pressure and transformed into a liquid form. The liquefaction process reduces the volume of natural gas by approximately 600 times, making long-distance transportation easier and more cost-effective (Park et al., 2021; Qyyum et al., 2018). In the liquid phase, LNG can be more easily distributed than in the gas phase. LNG can be distributed using ships, pipelines, or trucks (Ursavas et al., 2020; Sharafian et al., 2019). However, LNG transportation by ship is recognized as the most efficient means of transportation compared to trucks or pipelines, especially for long routes (Zaloumi and Kotios, 2021). LNG contains mostly methane gas and contains some gaseous hydrocarbon components (Cronshaw, 2021). The LNG supply chain starts from the gas refinery, where gas is produced, and then flows to the liquefaction plant to remove impurities or contaminants such as carbon dioxide, water, and sulfur (Zakir et al., 2020; Katebah et al., 2020). After the contaminants are removed, the LNG is cooled until it turns into a liquid phase and then flows into a storage tank (Lee et al., 2020). From the storage tank, LNG is loaded on LNG carrier vessels that carry it to the receiving terminal. Before it reaches the end user, the LNG must first change its phase in the regasification process at the receiving terminal (Rozali et al., 2023).
An LNG transport ship is one of the transportation methods to distribute LNG from the refinery to the receiving terminal (Budiyanto et al., 2020). LNG ship users are generally used to distribute LNG on medium- or long-distance routes (Andreadis et al., 2021). One of the advantages of LNG ships that use gas as a propulsion system is increased thermal efficiency (Nirbito et al., 2020). LNG ships have different capacities and are commonly classified into four groups: very large, large, medium, and small capacity ships (International Group of Liquefied Natural Gas Importers, 2019). Very large LNG vessels have a size of more than 200,000 cubic meters, while small vessels have sizes below 40,000 cubic meters (Noble, 2009). Two general methods of distribution patterns can be used for LNG distribution: milk-run and hub-and-spoke (Kimura et al., 2021). The milk-run pattern is a method of determining ship routes from gas sources to supply several destinations that will require LNG in accordance with the needs and storage capacity by traveling around the same or regular schedule (Chen et al., 2021). The hub-and-spoke pattern is a method of determining routes and ship schedules from one or many gas sources to many destination points where the gas is transported by larger vessels to a hub where LNG can be stored for further delivery to smaller satellites using smaller vessels (Bai and Fan, 2022). Linear programming is a mathematical method of allocating limited resources to achieve a goal, that is, to get the maximum or minimum result of LNG load capacity, as well as the desired end result in the form of costs (Sangaiah et al., 2020; Tuchinda et al., 2021).
The capacitated vehicle routing problem (CVRP) is a distribution method that designs a series of customer requests that must be served by a fleet of vehicles from a central depot or node. Each vehicle has a uniform capacity, and each customer has a specific request that must be met at a minimum cost (Jiang et al., 2022; Wijharnasir et al., 2019). These costs usually represent distance, time traveled, number of vehicles used, or a combination of these factors (Verma, 2018). Various approaches have been presented to solve CVRPs, such as linear programming, some metaheuristics, and many hybrid heuristics with variable environment search or constructive heuristic methods (Sitek et al., 2021; Juan et al., 2023). Many methods for CVRP are population-based algorithms and parameter settings of the algorithm, which all achieve comparable results (Dalbah et al., 2022).
An archipelagic country that has many small islands and is surrounded by vast oceans has its own challenges in LNG distribution (Purwosaputra et al., 2022). To facilitate the distribution of LNG supplies to gas-fired power plants in the region, small-scale LNG carriers are used for distribution (Bittante et al., 2018). Installing pipelines across land would be more complex and expensive (Wibisana and Budiyanto, 2021). Based on this background, it is necessary to develop several scenarios for transporting LNG supplies to various power plants in the archipelago. There is a research gap in optimizing LNG distribution routes for the needs of gas power plants in an archipelago region. The problem is how to determine the optimal cargo capacity with the most optimal ship round-trip time in terms of financial feasibility for LNG distribution. The aim of this study is to find optimal shipping routes and the economic feasibility of LNG distribution for gas power plants located on multiple islands. The contribution of the results of this study is to provide an overview to decision makers related to cargo capacity and the most optimal ship round-trip time from the optimal route. Therefore, the stakeholders can decide whether the LNG shipping system offered with small-scale LNG is feasible to finance.
2 Research methods
2.1 Optimization of LNG distribution using ships
The method used in this study is CVRP combined with linear programming and the greedy algorithm with the objective function of maximizing the ship’s load capacity. This study emphasizes maximizing cargo utilization, which is crucial for the economic efficiency of LNG distribution to multiple islands. Linear programming is used to define constraints such as vessel capacity, terminal demands, and routing structure, while the greedy algorithm helps iteratively construct routes that prioritize higher cargo volume over shorter distances. This integrated approach allows for the selection of routes that may appear longer but minimize the unused capacity on board, ensuring that each small-scale LNG (SSLNG) vessel operates close to its full potential, aligning with cost-efficiency and sustainability objectives. Power generation and supply needs in the previous section are input data for optimizing distribution. Route optimization using the greedy algorithm will produce iterations of all possible LNG distribution routes. One of the routes with supply requirements close to the capacity that can be transported by an SSLNG carrier will be selected. Figure 1 shows a flowchart of optimization using CVRP. From the diagram, the objective function chosen is to maximize the cargo capacity of the ship by finding the minimum value of the remaining LNG cargo carried by the ship.
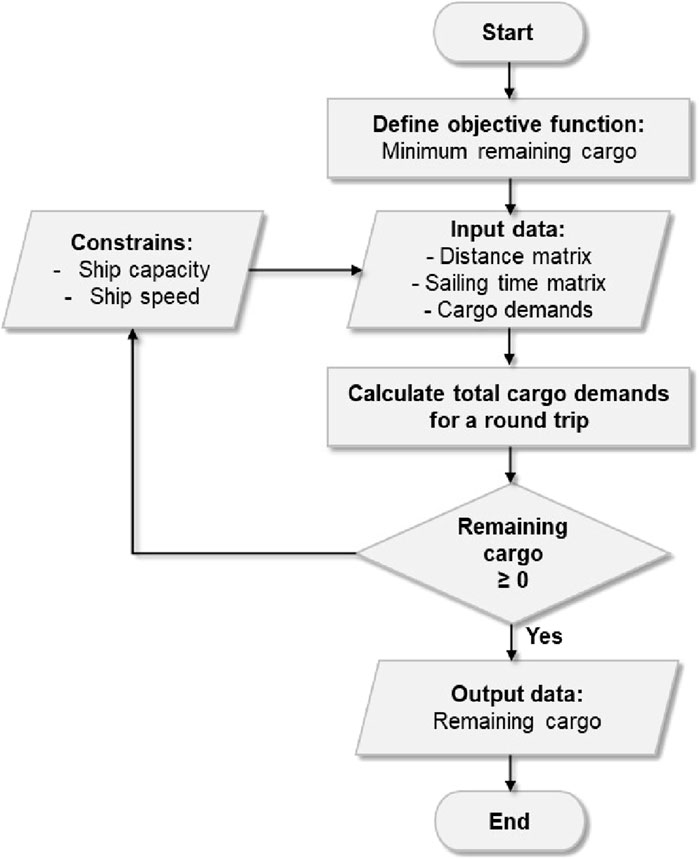
Figure 1. Optimization of LNG distribution with CVRP.
In this study, four major components are used to create an optimization model for LNG distribution routes utilizing ships: LNG supply sources, LNG receiving terminals, LNG transportation ships, and distances between receiving terminals. This analysis makes use of a single source of LNG supply and five receiving terminals spread over multiple islands at varied distances. The ship used to transport LNG is an SSLNG, with a capacity of 3,587 m3 to 7,500 m3. By using these components as input from the calculation of the CVRP model, optimization is carried out through linear programming calculations. To get the maximum total cargo volume, an optimal route is found by minimizing the remaining cargo carried by the LNG vessel using Equation 1.
Equation 2 is the limit function, which aims to ensure that the number of requests for the receiving terminal on each ship must be less than or equal to the load capacity of the ships serving that route. Equations 3, 4 aim to ensure that the receiving terminal is served exactly once by ships with a certain capacity.
Equations 5, 6 aim to ensure that each route with a particular ship starts from the LNG source, serves the receiving terminal, and then returns to the LNG source.
Equation 7 shows the continuity of the distribution route where every ship that has passed one terminal continues to the next terminal and returns to the LNG source.
Equation 8 to ensure that the determining variable only uses integers.
where
Sij = distance between locations i and j.
Di = demand from each receiving terminal.
K = set of vessel types.
Q = capacity.
Cijk = transportation costs (ship charter, fuel consumption, and port fees).
R = route.
Xijk = decision variable
i, j = {0,1,2, … , n}, i,j∈R and i ≠ j and k = {1,2, … , n}, k∈{1, … , K}.
The optimization of the LNG distribution route is influenced by the type of ship and the distribution route of the ship. The type of ship that has a loading capacity parameter will limit the number of receiving terminals that will be served. The greater the loading capacity of the ship used, the greater the number of receiving terminals that can be served in one trip. This will affect the shipping route of the LNG ship. Variations in ship size will be used when optimizing the LNG distribution route, which will provide different LNG distribution routes. Optimization of the LNG distribution route uses a greedy algorithm that considers the variables of ship capacity, sailing speed, distance between delivery points, transportation costs, and generator demand. Solving the problem of LNG distribution using the heuristic method is then developed in a program. To reduce the complexity of the optimization process, several assumptions are used: loading and unloading time is a constant 3 h for all types of ships, and time at the port is a constant 6 h for all types of ships (Budiyanto et al., 2019). To overcome the uncertainty of shipping conditions, a time allocation of 10 h (buffer time) is added to each voyage from one location to another port for clearance, queuing, and loading/unloading times at small ports (Budiyanto et al., 2022).
2.2 Shipping cost feasibility of LNG distribution
The economic analysis in this study was calculated based on the results of optimizing the LNG distribution. Economic analysis is carried out using several parameters as financial feasibility criteria. This analysis is carried out by considering operational expenditure (OPEX) in the form of transportation costs during LNG distribution, operational costs, maintenance, processing of LNG, and workers from the receiving terminal. Then, CAPEX is calculated based on the total investment capital for several receiving terminals needed to carry out LNG distribution. The investment feasibility criteria parameters in the form of net present value (NPV), payback period (PBP), and internal rate of return (IRR) are calculated to analyze the financial feasibility of the overall LNG distribution. In the economic analysis, revenue assumptions are also used by varying the selling margin of LNG to generators. The output of the economic analysis is a natural gas selling price margin that meets the investment feasibility criteria. NPV is the difference between the present value of cash inflows and the present value of cash outflows over a period. NPV is used in capital budgeting and investment planning to analyze the projected profitability of an investment or project. NPV is the result of a calculation used to find the present value of a stream of future payments. The method of calculating the NPV value uses Equation 9.
where
Rt = net cash inflows and outflows during one period t
i = discount rate or return that can be obtained in alternative investments
t = number of timer periods
n = total number of periods.
IRR is an indicator of the level of efficiency of an investment, where a project can be carried out if the IRR is greater than the rate of return when investing elsewhere. The IRR value is the interest rate at which the NPV value is zero. Capital expenditure, or CAPEX, is the entire initial investment cost of this LNG distribution activity. In this study use Equation 10 to estimate the cost of constructing a new ship (Mulligan, 2008).
Two basic parameters are used in Equation 10, namely, the producer price index (PPI) and deadweight tonnage (DWT). This equation also applies to estimating the cost of building new container ships, bulk carriers, tankers, and liquified petroleum gas (LPG) tankers. OPEX is all costs incurred to carry out operations in a certain period, usually in a period of 1 year. In this study, there are two SSLNG ships with capacities of 7,500 cbm and 3,587 cbm. The operational costs incurred are in the form of local port agent expenses, crew costs, ship repair costs, freshwater, ship docking costs, survey and maintenance costs, and overhead costs. Then, the calculation of ship operational costs is added to the cost of fuel and lubricants. The payback period refers to the amount of time required to recover investment costs. In simple terms, the payback period is the length of time until an investment reaches the breakeven point. People and companies invest their money primarily to get paid back, which is why the payback period is so important. In essence, the shorter the return on investment, the better.
2.3 Case study of the multi-island LNG distribution
The case study used in this research is a multi-island destination gas power plant in the Nusa Tenggara region, Indonesia. Data collection was carried out by utilizing open information from several books and annual reports from the Ministry of Energy and Mineral Resources of the Republic of Indonesia and the State Electricity Company (Ministry of Energy and Mineral Resources Republic of Indonesia, 2017). The data collected are power plant data, gas demand data for each power plant, small LNG vessel data, and distance data for each port. In determining the LNG supply chain scenario, it is necessary to determine the source of the LNG plant that will be used to meet the needs of the power plant, as well as to minimize the costs incurred. The annual report states that several sources of LNG refineries can be used as the main supplier for gas-fired power plants in the Central Indonesian region. In this study, the source for the Tangguh LNG Plant is in West Papua, Indonesia (Daud, 2002). The selection of the LNG source is based on the regional division that has been implemented by the Ministry of Energy and Mineral Resources. It was also chosen because the LNG plant is geographically close to the clusters of power plants that have been determined in the Central Indonesian region. In addition, the production capacity of the LNG refinery is considered sufficient to meet the demand for power plants in the region.
Identification of the need for gas-fired power plants was obtained from the LNG supply receiving terminal data from each of the identified power plants. The list of gas-fired power plants in the Nusa Tenggara region used as a case study can be seen in Table 1.
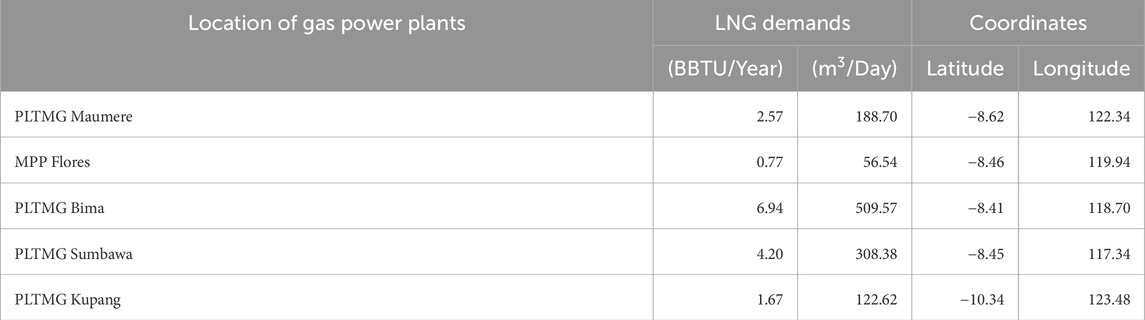
Table 1. LNG demands of gas power plants.
LNG demand is determined by calculating the fuel consumption of each power plant per day. However, to classify LNG demand data, each power plant that is close to and is in one area is made into one terminal as a representative for each region in order for the data to be displayed as daily LNG consumption data for each region. The number of requests is multiplied by the number of round trips (per day) to obtain the volume of transport, which is the number of ships moved. The boil-off gas (BoG) value is then derived from the calculated loading volume using LNG itself. The BoG refers to the amount of LNG that naturally evaporates due to heat ingress during storage or transportation, even under cryogenic conditions. This evaporated gas must be carefully managed as it affects both the quantity of deliverable LNG and the overall efficiency of the transport system. In this study, the BoG value is derived based on the volume of LNG loaded, considering specific evaporation rates throughout the voyage. The loading volume is multiplied by 0.15%, and the sailing duration is added to get the overall BoG number (Pamitran et al., 2019). The BoG value is added to the initial volume so that the number of requests does not decrease until they reach their destination.
After the total volume of LNG demand is known, it is then compared with the previously planned ship capacity. The difference between the planned volume and the volume transported with the smallest value is the solution for selecting the route and the capacity of the ship used. From all the power plant data above, distance calculations between islands and LNG terminals will then be carried out, and a distance matrix will be formed to facilitate optimization calculations. Table 2 shows the distance between the receiving terminals of a gas power plant located on multiple islands.
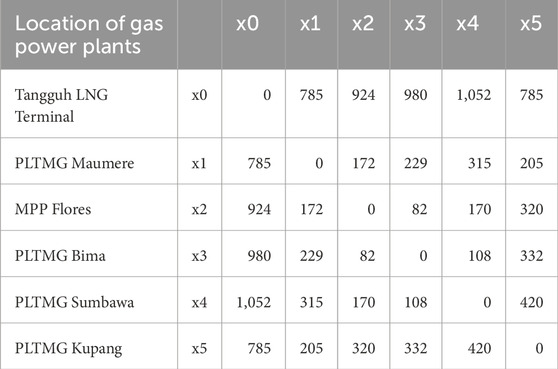
Table 2. Distance matrix of multi-island destination (sea miles).
Distribution of LNG to power plants in this study will use SSLNG vessels with a capacity of 7,500 cbm and 3,587 cbm. The use of this type of ship fulfills the character of LNG distribution, where the number of requests for each generator is relatively small. In addition, the power plants to be supplied are located on small islands with waters that tend to be shallow, so a ship with a small draft is needed. SSLNG ships usually have a relatively small draft. SSLNG ship data that will be used in the Nusa Tenggara region can be seen in Table 3.
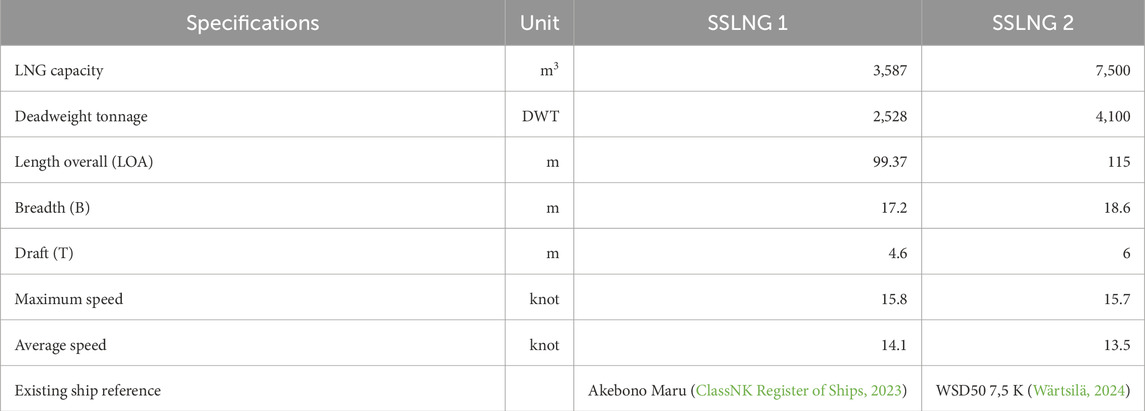
Table 3. Specification of SSLNG vessels.
The vessels used in this study were collected from a variety of ship registration websites and international classification agencies. Ship data from the comparison will be collected and used to optimize LNG distribution, including ship loading capacity, ship speed, fuel consumption, and ship production pricing. The amount of LNG that may be transported on each voyage is determined by the ship’s loading capacity. The larger the size of the ship’s tank, the more LNG that can be transported and the more sites that can be visited. Furthermore, with increased capacity, the cost of distribution per unit volume of LNG will be lower. On the other side, with more cargo, the ship will be larger, and the leasing price will be higher.
For the same distance, a ship with a higher speed will require less sailing time than a ship with a lower speed. As a result, the ship’s round-trip time will be reduced, and its operational duration will be reduced. In this study, five different ship speeds were used, ranging from 11 knots to 15 knots. Data on fuel use will be used to calculate transportation expenses. Fuel is a component that can account for up to 30% of overall transportation costs. Most of the power plants that will be supplied in this study are mobile and can be moved at any time to other regions when there is an electricity shortage. The larger the ship’s size, the higher the ship’s production cost.
3 Results and discussion
3.1 Optimal LNG shipping route
LNG requirement variables, transportation logistics-related variables, and cost variables are used to optimize shipping routes. These three variables will be the main variables in optimizing LNG distribution to power plants in the Sumatra region. Cost variables or economic variables to calculate transportation costs are derivatives of the main variables that have been obtained previously. For example, the round-trip time of the ship, fuel requirements, and fuel prices must be known to calculate shipping costs or voyage costs. Round-trip time is obtained from the distance between receiving terminals or the distance between receiving terminals and the LNG plant, ship speed, and ship unloading time.
The main variables of the LNG distribution system for power plants include LNG refineries, LNG ships, and generators. The LNG plant is a supply unit that provides LNG to be shipped and used for generator fuel. The LNG ship is a transportation unit that transports LNG from the refinery and then distributes it to each generator via the receiving terminal. Meanwhile, generators are demand units that use LNG as fuel to generate electricity. To determine the volume of gas that will be transported by ships, the number of requests is multiplied by the number of round trips per day so that the total transported volume is obtained. Then, the boil gas volume is added to the calculated loading volume. To determine the total boil of gas, the loading volume is multiplied by 0.15% and the sailing time. The boil of gas value is added to the initial volume so that the total volume of gas on the ship is sufficient to service all the destination demand units.
Once the LNG volume is determined, it is compared to the previously planned ship capacity. The solution for determining the route and the capacity of the ship utilized is the difference between the projected volume and the volume transported with the smallest value. Optimization of the LNG distribution route uses a greedy algorithm that considers the variable capacity, ship speed, sail speed, distance between terminal facilities, and generator demand. Solving the problem of LNG distribution can be done by analyzing the route and the maximum load capacity. The results of the optimization of the route formation above are based on the minimum total load difference value considering the difference between the ship’s capacity and the total need from power plants on the route. The most optimal shipping route considering the remaining cargo using the CVRP is shown in Table 4 and Figure 2.
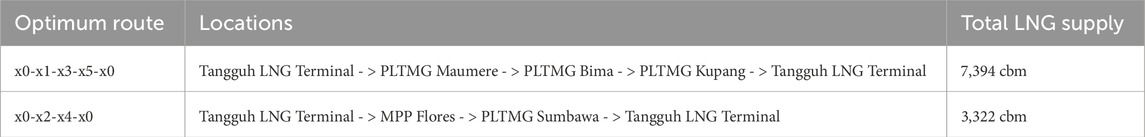
Table 4. The optimum route of the CVRP for multiple island destinations.
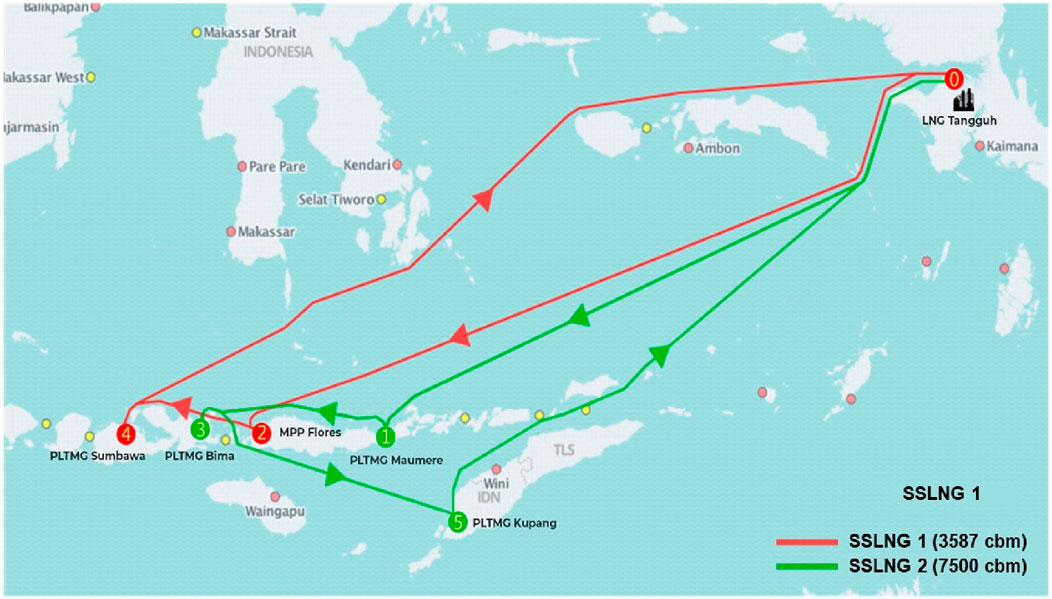
Figure 2. Optimal multi-island LNG shipping route.
In addition to determining the route, variations in the speed of the vessels used to supply LNG cargo are examined. Figure 3 shows a comparison between variations in ship speed (knots) and the total remaining shipload (metric cubic) used.
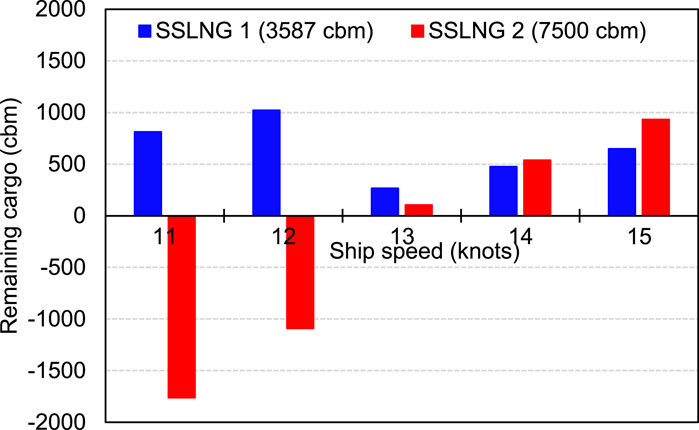
Figure 3. Optimum ship speed for multi-island LNG distribution.
3.2 Economic feasible LNG shipping cost
Two variables are considered in the economic analysis. The two variables are CAPEX and OPEX. The parameters or financial feasibility criteria used in this economic analysis are NPV, IRR, and payback periods. By using Equation 10, the estimated initial investment value for SSLNG 1 is USD 175,547,620.74 and SSLNG 2 is USD 178,281,419.71. The total CAPEX for building two new ships is USD 353,829,040.50. Meanwhile, OPEX is calculated based on all costs resulting from the operation of the LNG distribution to the receiving terminal. This cost calculation is based on calculations and assumptions from previous literature studies. Table 5 shows the OPEX cost of two vessels in 1 year of operation. The total OPEX for the two vessels is USD 12,191,236. The price of the fuel used is USD 48.2/nm. Local port agent expenses are USD 480,000. Assumptions from the maritime labor convention are used to determine crew costs. Other item values were obtained from previous research assumptions.
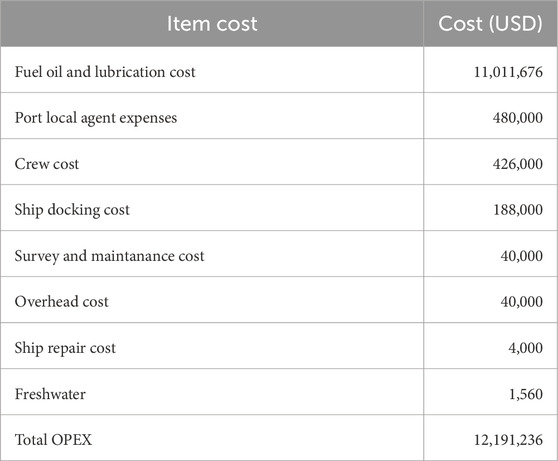
Table 5. Total OPEX for 1 year of operation.
Once OPEX is determined, the amount of income for 1 year of operation can be determined. The revenue referred to in this research is revenue derived from transportation services and LNG regasification up to the mouth of the engine at the power plant. Profits are obtained from the difference between the buying price of LNG and the selling price of LNG, or the LNG sales margin. LNG sales units are units of money per million British thermal units (MMBtu) or, in this study, $/MMBtu. MMBtu is a unit of heat energy produced by natural gas per unit volume. To determine the sensitivity of the LNG sales margin at the end of the 20th year, variations of the LNG sales price margin are used. In this study, six variations of margin were used, from USD 4.0 to USD 6.0 per MMBtu, with an increase of $1.0.
The sales margin is then multiplied by the amount of LNG sold in 1 year to obtain revenue per sales margin. The income earned is, of course, different for each variation in sales margin. This different revenue will affect the payback period. The payback period is the period of return-on-investment capital that has been issued. Figure 4 shows the results of the interest rate and NPV of the three LNG price margin schemes per MMBtu. Figure 5 shows the payback period of each LNG price margin scheme. In this LNG distribution, the margin rates tested are USD 4/MMBtu, USD 5/MMBtu, and USD 6/MMBtu. Using a good sales margin rate of at least USD 5/MMBtu, the payback period can be achieved within 9 years with an IRR = 9%. This margin rate can be used as a reference for the minimum shipping cost of LNG transportation.
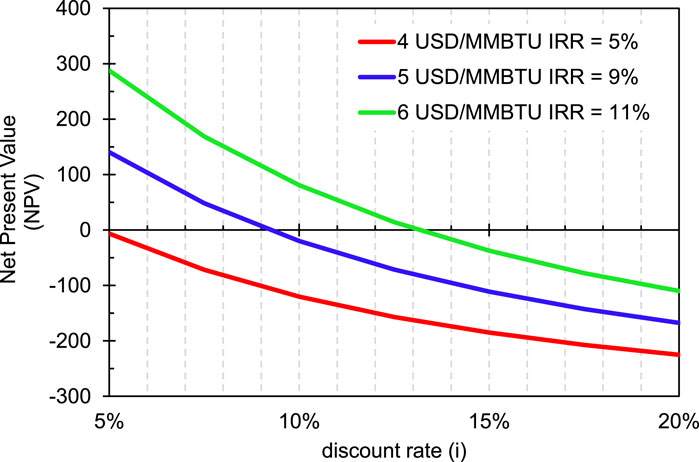
Figure 4. NPV of the gas transportation pricing scheme.
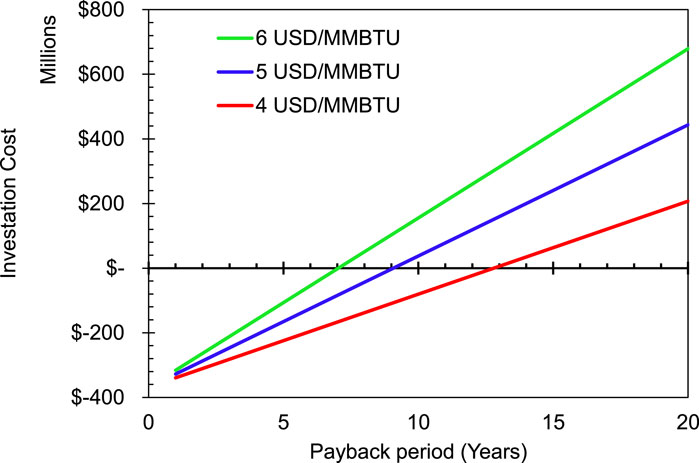
Figure 5. The payback period of the LNG price scheme.
From the point of view of fluctuating world gas prices, the shipping cost of USD 5/MMBtu is challenging. It is necessary that energy pricing stakeholders accurately assess the costs of production, transmission, distribution, and consumption of energy to ensure overall economic effectiveness (Yudha and Tjahjono, 2019). Policy support is needed from local governments with natural gas production potential, such as eastern Indonesia, in the form of providing LNG infrastructure for power plants. Growing a mutually productive economy requires increased cooperation between national corporations and local governments. Joint ventures can be used to carry out forms of business cooperation so that the local region can enjoy its natural resources, establish an LNG business, and aid in commercial, technical, and legal matters.
4 Conclusion
The feasibility study of using SSLNG vessels to supply gas plants on multiple islands has been carried out by finding the optimum shipping routes and conducting an economic analysis for each route. From the results of optimizing the distribution of LNG using small-scale LNG ships with the greedy algorithm method with the objective function of maximizing the capacity of the ship’s load, it is obtained that the Nusa Tenggara region route will be supplied using two ships of 7,500 cbm and 3,587 cbm with an average speed of 13 knots. Based on the optimum route obtained, the remaining cargo of the Nusa Tenggara islands is 369.85 cbm or 3.34% of the ship’s total capacity. The economic analysis shows a total CAPEX of USD 353,829,040.5, with the selling price of LNG at USD 5/MMBtu for this region with a payback period of 9 years. From the results of this study, it can be concluded that the distribution of LNG by SSLNG ships for multi-island destinations has special characteristics where the price of transportation tends to be more expensive than the price of the gas itself. Thus, these results open opportunities for further research to design an optimal SSLNG ship design in terms of payload and ship size.
Data availability statement
The raw data supporting the conclusions of this article will be made available by the authors, without undue reservation.
Author contributions
MB: Conceptualization, Data curation, Formal analysis, Funding acquisition, Investigation, Methodology, Project administration, Software, Supervision, Validation, Visualization, Writing – original draft, Writing – review and editing. GN: Data curation, Resources, Writing – original draft. AR: Formal analysis, Writing – review and editing. GP: Supervision, Writing – review and editing. Gunawan: Formal analysis, Writing – review and editing. GT: Formal analysis, Writing – review and editing.
Funding
The author(s) declare that financial support was received for the research and/or publication of this article. The authors would like to thank the Directorate of Research and Development of Universitas Indonesia for research funding by PUTI Q1 for the year 2024 contract number: NKB-522/UN2. RST/HKP.05.00/2024.
Conflict of interest
The authors declare that the research was conducted in the absence of any commercial or financial relationships that could be construed as a potential conflict of interest.
The reviewer AW declared a shared affiliation with all of the author(s) except AUT and GT to the handling editor at the time of review.
Generative AI statement
The author(s) declare that no Generative AI was used in the creation of this manuscript.
Publisher’s note
All claims expressed in this article are solely those of the authors and do not necessarily represent those of their affiliated organizations, or those of the publisher, the editors and the reviewers. Any product that may be evaluated in this article, or claim that may be made by its manufacturer, is not guaranteed or endorsed by the publisher.
References
Andreadis, G. O., Papaleonidas, C., and Lyridis, D. V. (2021). Evaluating the operations of an LNG shipping Company with business process modelling. SNAME 7th International Symposium on Ship Operations, Management and Economics, SOME 2021, April 6–7, 2021.doi:10.5957/SOME-2021-018
Bai, B., and Fan, W. (2022). Research on strategic liner ship fleet planning with regard to hub-and-spoke network. Operations Manag. Res. 16 (1), 363–376. doi:10.1007/S12063-022-00315-2/FIGURES/3
Bittante, A., Pettersson, F., and Saxén, H. (2018). Optimization of a small-scale LNG supply chain. Energy 148, 79–89. doi:10.1016/j.energy.2018.01.120
Budiyanto, M. A., Pamitran, A. S., and Yusman, T. (2019). Optimization of the route of distribution of LNG using small scale LNG carrier: a case study of a gas power plant in the Sumatra region, Indonesia. Int. J. Energy Econ. Policy 9 (6), 179–187. doi:10.32479/ijeep.8103
Budiyanto, M. A., Riadi, A., Buana, I. G. N. S., and Kurnia, G. (2020). Study on the LNG distribution to mobile power plants utilizing small-scale LNG carriers. Heliyon 6 (7), e04538. doi:10.1016/J.HELIYON.2020.E04538
Budiyanto, M. A., Singgih, I. K., Riadi, A., and Putra, G. L. (2022). Study on the LNG distribution to mobile power plants using a small-scale LNG carrier for the case of the sulawesi region of Indonesia. Energy Rep. 8, 374–380. doi:10.1016/J.EGYR.2021.11.211
Chen, J., Wang, K., and Huang, Y. (2021). An integrated inbound logistics mode with intelligent scheduling of milk-run collection, drop and pull delivery and LNG vehicles. J. Intelligent Manuf. 32 (8), 2257–2265. doi:10.1007/S10845-020-01637-3/FIGURES/4
ClassNK Register of Ships (2023). M/S Akebono maru (CNo.115541). Available online at: https://www.classnk.or.jp/register/regships/one_dsp.aspx?imo=9554729.
Dalbah, L. M., Al-Betar, M. A., Awadallah, M. A., and Zitar, R. A. (2022). A modified coronavirus herd immunity optimizer for capacitated vehicle routing problem. J. King Saud Univ. - Comput. Inf. Sci. 34 (8), 4782–4795. doi:10.1016/J.JKSUCI.2021.06.013
Daud, S. (2002). “The Tangguh LNG project,” in 17th World Petroleum Congress, Rio de Janeiro, Brazil, September 1–5, 2002.
Jiang, H., Lu, M., Tian, Y., Qiu, J., and Zhang, X. (2022). An evolutionary algorithm for solving Capacitated Vehicle Routing Problems by using local information. Appl. Soft Comput. 117, 108431. doi:10.1016/J.ASOC.2022.108431
Juan, A. A., Keenan, P., Martí, R., McGarraghy, S., Panadero, J., Carroll, P., et al. (2023). A review of the role of heuristics in stochastic optimisation: from metaheuristics to learnheuristics. Ann. Operations Res. 320 (2), 831–861. doi:10.1007/S10479-021-04142-9/FIGURES/7
Katebah, M. A., Hussein, M. M., Shazed, A. R., Bouabidi, Z., and Al-musleh, E. I. (2020). Rigorous simulation, energy and environmental analysis of an actual baseload LNG supply chain. Comput. and Chem. Eng. 141, 106993. doi:10.1016/J.COMPCHEMENG.2020.106993
Kimura, S., Miyakoshi, S., Purwanto, A. J., Sidemen, I. G. S., Malik, C., Suharyati, S., et al. (2021). Feasible solutions to deliver LNG to midsized and large islands in Indonesia. Available online at: https://think-asia.org/handle/11540/13246.
Lee, H., Choi, J., Jung, I., Lee, S., Yoon, S., Ryu, B., et al. (2020). Effect of parameters on vapor generation in ship-to-ship liquefied natural gas bunkering. Appl. Sci. 10 (19), 6861. doi:10.3390/APP10196861
Ministry of Energy and Mineral Resources Republic of Indonesia (2017). HANDBOOK of energy and economic statistics of Indonesia hybrid power plant of wind and solar, located in east sumba, east Nusa Tenggara thanks to muhamad habibi, photo competition of Ministry of energy and mineral resources in 2017.
Mulligan, R. F. (2008). A simple model for estimating newbuilding costs. Marit. Econ. Logist. 103 (10), 310–321. doi:10.1057/MEL.2008.8
Nirbito, W., Budiyanto, M. A., and Muliadi, R. (2020). Performance analysis of combined cycle with air breathing derivative gas turbine, heat recovery steam generator, and steam turbine as LNG tanker main engine propulsion system. J. Mar. Sci. Eng. 8 (9), 726. doi:10.3390/jmse8090726
Noble, P. G. (2009). A short history of LNG shipping. Society of Naval Architects and Marine Engineers.
Pamitran, A. S., Budiyanto, M. A., and Dandy Yusuf Maynardi, R. (2019). Analysis of ISO-tank wall physical exergy characteristic – case study of LNG boil-off rate from retrofitted dual fuel engine conversion. Evergreen 6 (2), 134–142. doi:10.5109/2321007
Park, J., You, F., Mun, H., and Lee, I. (2021). Liquefied natural gas supply chain using liquid air as a cold carrier: novel method for energy recovery. Energy Convers. Manag. 227, 113611. doi:10.1016/J.ENCONMAN.2020.113611
Purwosaputra, A. A., Artana, K. B., and Dinariyana, A. A. B. (2022). Selection over small-scale LNG transportation model in designing an efficient and reliable LNG supply chain using analytical network process. Mar. Syst. Ocean Technol. 17 (2), 95–112. doi:10.1007/S40868-022-00115-0/FIGURES/10
Qyyum, M. A., Qadeer, K., and Lee, M. (2018). Comprehensive review of the design optimization of natural gas liquefaction processes: current status and perspectives. Industrial Eng. Chem. Res. 57 (17), 5819–5844. doi:10.1021/ACS.IECR.7B03630/ASSET/IMAGES/MEDIUM/IE-2017-036303_0019.GIF
Rozali, M., Szepesi, G. L., Szamosi, Z., Haziq, M., Akashah, N., Erniza, N., et al. (2023). Utilization of cold energy from LNG regasification process: a review of current trends. Processes 11 (2), 517. doi:10.3390/PR11020517
Sangaiah, A. K., Tirkolaee, E. B., Goli, A., and Dehnavi-Arani, S. (2020). Robust optimization and mixed-integer linear programming model for LNG supply chain planning problem. Soft Comput. 24 (11), 7885–7905. doi:10.1007/S00500-019-04010-6/TABLES/8
Sharafian, A., Blomerus, P., and Mérida, W. (2019). Liquefied natural gas tanker truck-to-tank transfer for on-road transportation. Appl. Therm. Eng. 162, 114313. doi:10.1016/J.APPLTHERMALENG.2019.114313
Sitek, P., Wikarek, J., Rutczyńska-Wdowiak, K., Bocewicz, G., and Banaszak, Z. (2021). Optimization of capacitated vehicle routing problem with alternative delivery, pick-up and time windows: a modified hybrid approach. Neurocomputing 423, 670–678. doi:10.1016/J.NEUCOM.2020.02.126
Tuchinda, N., Moryadee, S., U-tapao, C., and Laokhongthavorn, L. (2021). A multi-period linear programming model for the natural gas distribution network of Thailand. Int. J. Sustain. Energy 41 (2), 184–204. doi:10.1080/14786451.2021.1924716
Ursavas, E., Zhu, S. X., and Savelsbergh, M. (2020). LNG bunkering network design in inland waterways. Transp. Res. Part C Emerg. Technol. 120, 102779. doi:10.1016/J.TRC.2020.102779
Verma, A. (2018). Electric vehicle routing problem with time windows, recharging stations and battery swapping stations. EURO J. Transp. Logist. 7 (4), 415–451. doi:10.1007/s13676-018-0136-9
Wibisana, L. P., and Budiyanto, M. A. (2021). Design and cost multi-objective optimization of small-scale LNG carriers using the value engineering approach. Int. J. Technol. 12 (6), 1288–1301. doi:10.14716/IJTECH.V12I6.5192
Wijharnasir, A. P. A., Alghasi, M. A., and Pujawan, N. (2019). Greedy approach for solving the capacitated vehicle routing problem of liquefied natural gas distribution to power plants. MATEC Web Conf. 272, 01040. doi:10.1051/MATECCONF/201927201040
Yudha, S. W., and Tjahjono, B. (2019). Stakeholder mapping and analysis of the renewable energy industry in Indonesia. Energies 12 (4), 602. doi:10.3390/EN12040602
Zakir, F., Wang, D., Rehman, A., Waheed, A., Iffat, Z., and Wang, L. (2020). “LNG supply chain: challenges, opportunities and future prospects,” in 2020 3rd International Conference on Computing, Mathematics and Engineering Technologies: Idea to Innovation for Building the Knowledge Economy, ICoMET 2020, Sukkur, Pakistan, 29-30 January 2020 (IEEE).
Keywords: LNG distribution, shipping route, small-scale LNG carrier, capacitated vehicle routing problem, shipping cost
Citation: Budiyanto MA, Novrian GR, Riadi A, Putra GL, Gunawan and Theotokatos G (2025) Shipping cost feasibility of LNG distribution with multiple island gas power plant destinations. Front. Energy Res. 13:1502518. doi: 10.3389/fenrg.2025.1502518
Received: 10 October 2024; Accepted: 20 May 2025;
Published: 12 June 2025.
Edited by:
Michael Carbajales-Dale, Clemson University, United StatesReviewed by:
Zhe Cui, Nantong University, ChinaMoses Omolayo Petinrin, University of Ibadan, Nigeria
Abdul Wahid, University of Indonesia, Indonesia
Copyright © 2025 Budiyanto, Novrian, Riadi, Putra, Gunawan and Theotokatos. This is an open-access article distributed under the terms of the Creative Commons Attribution License (CC BY). The use, distribution or reproduction in other forums is permitted, provided the original author(s) and the copyright owner(s) are credited and that the original publication in this journal is cited, in accordance with accepted academic practice. No use, distribution or reproduction is permitted which does not comply with these terms.
*Correspondence: Muhammad Arif Budiyanto, YXJpZkBlbmcudWkuYWMuaWQ=