 Abdullah Bin Omar
 Gang Zeng
 Leila N. Salykova
- 1Department of Commerce and Economics, Faculty of Management Sciences, Emerson University Multan, Multan, Pakistan
- 2School of Economics and Management, Civil Aviation University of China, Tianjin, China
- 3School of Creative Industry, Astana IT University, Astana, Kazakhstan
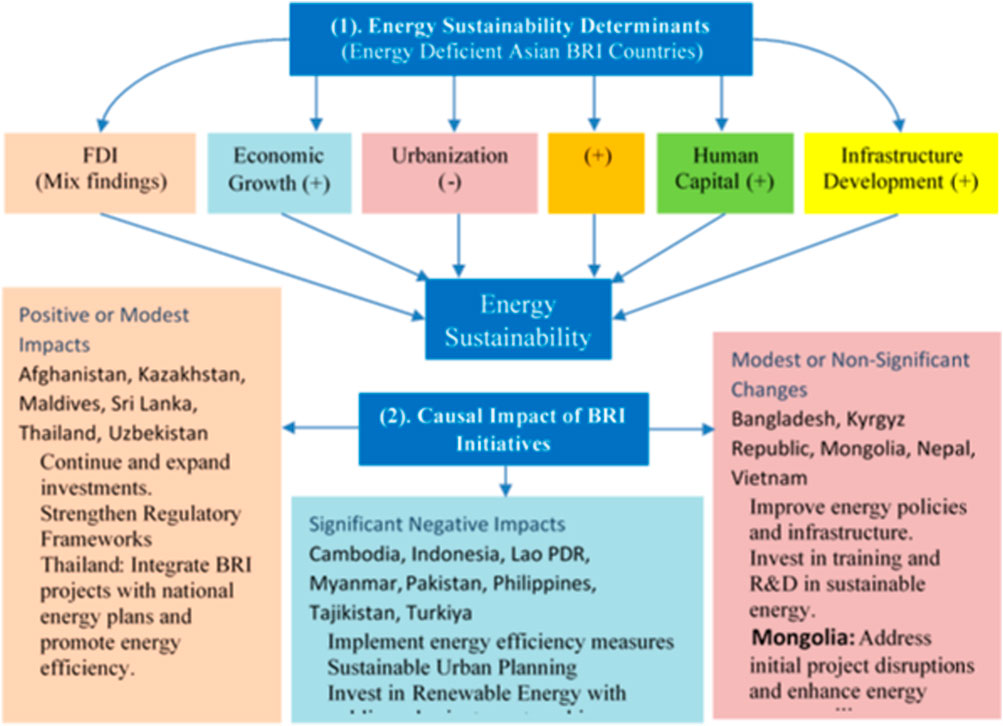
The strategic investment and international cooperation for sustainable energy supplies have grown within the Belt and Road Initiative (BRI) countries. Through such projects, BRI is believed to bring myriad benefits that engender trade and stimulating economic growth through investment in infrastructure. However, research that has targeted the causal impact of BRI initiatives on energy sustainability has markedly been lacking. The study aims to aid in filling this gap by analyzing the causal effect of BRI initiatives through an investigation of how BRI-related factors—FDI, economic growth, urbanization, trade openness, human capital, and infrastructure development—affect energy sustainability. The panel data of 20 Asian BRI energy-deficient countries have been taken into consideration for the time range of 2000–2022. This study carries out cross-sectional dependence tests, second-generation panel unit root and cointegration testing, panel quantile regression, and employ the Bayesian Structural Time Series (BSTS) approach in assessing the causal impact of BRI initiatives on energy sustainability. The panel quantile regression results reveal that economic growth, urbanization, trade, human capital, and infrastructure development significantly affect energy sustainability at various quantiles. Further, the causal impact analysis highlights the varied and significant effects of BRI initiatives on energy sustainability. Countries like Afghanistan, Maldives, and Uzbekistan should continue attracting investment for energy projects, while nations such as Bangladesh and Pakistan need to stabilize energy policies to manage short-term disruptions, and countries like Cambodia, Indonesia, and Turkey must balance rapid increase in energy demand with sustainable practices.
1 Introduction
Through infrastructural investments, China’s Belt and Road Initiative (BRI) is likely to address the challenges of energy sustainability in its member nations. The BRI sets a structured path forward by formalizing commitments to collaborate on energy infrastructure projects through Memorandums of Understanding (MoUs) with China. In addition, some other factors like foreign direct investment (FDI), economic growth, infrastructure, urbanization, trade, and human capital significantly shape energy sustainability (Ayres et al., 2007; Azam, 2019; Jones, 1991; Mohammadi et al., 2023; Murshed et al., 2021; Narula and Narula, 2019; Osabuohien-Irabor and Drapkin, 2022).
The best-case scenario for energy-deficit BRI countries is to have a stable and sustainable energy supply where appropriate infrastructure and technology investment guarantees efficient energy use, leading toward renewable energy sources. This ideal is far from the actual situation for most of these countries. All these countries are currently fighting to acquire secure and reliable energy resources. These problems of infrastructure investments and greater international cooperation are what the BRI tends to channelize. Despite many discontinued efforts, large lacunae are still persist in reaching energy sustainability.
Literature on the subject identifies a wide range of variables affecting energy sustainability, including FDI, economic growth, urbanization, trade, human capital, and infrastructure development. It is outlined in studies that FDI can play a positive role in facilitating technology transfer and infrastructure development (Irfan and Ojha, 2023). At the same time, the relationship between economic growth, energy use, and sustainability is indeed a complex one (Ayres et al., 2007; Mohammadi et al., 2023). In addition, urbanization has held mixed findings on its impact on energy sustainability (Jones, 1991; Kammen and Sunter, 2016). It is well documented that the role that can be played by trade and infrastructure in enhancing energy sustainability (Narula and Narula, 2019; Osabuohien-Irabor and Drapkin, 2022). However, one of the significant gaps related to the literature review is that no comprehensive study has tried to determine the causal impact of BRI initiatives on energy sustainability in energy-deficient Asian countries.
This research aims to assess the causal impact of BRI initiatives on energy sustainability in countries with Asian economies that lack sufficient energy resources. We also investigate how FDI, economic growth, urbanization, trade, human capital, and infrastructure development affect energy sustainability. To achieve the goals, we have focused on the following research questions: How do BRI initiatives impact energy sustainability in these countries? What role does FDI play in enhancing or compromising energy sustainability? How does economic growth influence energy sustainability? Additionally, how do urbanization and trade openness facilitated by the BRI contribute to or challenge energy sustainability? Finally, what is the role of human capital and infrastructure development in achieving sustainable energy goals? This study addresses a gap in the existing literature by examining the causal impact of BRI initiatives in energy-deficient Asian countries which has been largely overlooked. By answering these research questions, the study explains how BRI initiatives influence energy sustainability.
This study employs econometric approaches including cross-sectional dependence tests, second-generation panel unit root tests, cointegration tests, panel quantile regression, and the BSTS approach to analyze the influencing factors of energy sustainability and causal impact of BRI initiatives. Key findings from the panel quantile regression indicate a significant impact of economic growth, urbanization, trade, human capital, and infrastructure development on energy sustainability across different quantiles. The causal impact analysis reveals that BRI initiatives have a varied and significant impact on energy sustainability across the selected Asian countries.
The organization of the study is as follows: Section 2 reviews the relevant literature on energy sustainability and its influencing factors. Section 3 outlines the methodology. Section 4 presents and discusses the empirical results, including the findings from the panel quantile regression and causal impact analysis. Finally, Section 5 concludes the study and offers recommendations for future research.
2 Literature review
FDI plays a critical role in countries’ economic development and energy sustainability. It has a multifaceted impact on energy sustainability as evidenced by several studies. In Sub-Saharan Africa, FDI does not significantly impact clean energy consumption overall but shows positive effects in low-income countries and negative effects in middle-income countries, with a significant link to increased carbon dioxide emissions in both categories (Nyeadi, 2023). In the emerging seven economies (E7), higher FDI inflows promote energy diversification in the long run, although the effects vary in the short term due to country-specific factors (Irfan and Ojha, 2023). In Bangladesh, FDI enhances renewable electricity output but also increases the ecological footprint, indicating that while FDI aids in renewable energy adoption, it also contributes to environmental degradation, necessitating policies for cleaner FDI (Murshed et al., 2021).
In Asia, FDI improves regulatory quality and clean energy use, thus playing a crucial role in sustainable greenhouse gas emission reduction and supporting SDGs (Abbas et al., 2021). In OECD countries, FDI and trade openness enhance the benefits of technological innovation on energy consumption (Gajdzik et al., 2024; Osabuohien-Irabor and Drapkin, 2022). Adams et al. (2020) found that FDI’s impact on energy consumption is positive but not significant. They elucidate that its effects might be contingent on additional factors such as regional policies and infrastructure development.
As economies grow, their energy demand usually rises correspondingly; hence, more energy is consumed. Ayres et al. (2007) have the arguable view that with improved regulation, an economy can continue growing yet reduce its GHG emissions instead of an increase in the cost of energy through a carbon tax, which is disincentive to businesses and thus foster growth sustainably. Similarly, Mohammadi et al. (2023) reported that energy consumption has high elasticity in inducing growth for developed and developing countries. However, they cautioned that such policies aimed at reducing energy consumption may risk losing economic development, especially in the case of developing countries. Moreover that, Saidi and Hammami (2015) utilized data from 58 countries to demonstrate the argument that energy consumption can drive growth. Jia et al. (2023) take into account the 90 BRI countries and find a two-way causal relationship between renewable energy consumption and economic growth, emphasizing the intricate relationship existing between energy use and financial performance. Similarly, China’s subsidy policies and detailed electricity technologies were presented by a computable general equilibrium (CGE) model in Jiang et al. (2024) study and several carbon neutrality methods were proposed. By employing the marginal abatement cost curves (MACCs) model, the multiple pollutants were quantified in China’s provincial level in the study of Jiang et al. (2023) and they concluded the lack of general equilibrium effects.
He et al. (2021) discussed the impact of renewable energy on low-carbon development in BRI countries and that renewable energy consumption is found to have bidirectional Granger causalities with economic growth. Liu et al. (2020) conducted a study across 33 BRI countries, returning results that, overall, there is still relatively low energy efficiency, especially in middle- and low-income nations. Therefore, specially designed policies should be designed for improving energy efficiency and bridging income inequality. In the study conducted by Khan et al. (2021), evidence showed that technological innovation, financial development, and FDI significantly influence both renewable and non-renewable energy consumption. From their results, it can be deduced that even though economic development has favored renewable energy, that brought about by FDI and technological innovation increased aggregate energy consumption. Gu and Zhou (2020) estimated the effect of emission reduction brought about by green energy investment projects across Belt and Road Initiative countries, which had significant carbon emission reductions resulting from such initiatives, hence underpinning energy transformations and sustainability goals.
Urbanization influences energy consumption patterns. The relationship between urbanization and energy sustainability is explored in various studies. Kammen and Sunter (2016) emphasize that cities must develop low-carbon, resilient energy systems to manage the high energy demands of growing populations. Adams et al. (2020) found that urbanization decreases CO2 emissions in sub-Saharan Africa despite increasing transport energy consumption. Rickwood et al. (2008) highlight that higher-density, transit-oriented urban forms have lower per-capita transport energy use. Jones (1991) notes that urbanization increases overall energy consumption due to transportation and modernization of agriculture. Broto (2017) suggests spatial planning promoting flexibility in urban energy systems can foster sustainability innovations. Yang et al. (2018) reveal that the service industry is the largest consumer of energy and water and the biggest emitter of CO2 in Shanghai and Beijing. Seto et al. (2017) emphasize that urban areas are critical for sustainable development due to high energy demand and emissions. Futcher and Mills (2013) highlight the role of urban form in energy management, particularly cooling loads for office buildings in London. Yang et al. (2019) show that urbanization increases residential electricity consumption in China with significant regional variations.
Human capital, trade, and infrastructure are also important determinants of energy sustainability in BRI countries. Various studies highlight their collective influence on energy sustainability. Azam (2019) found that human capital significantly contributes to economic growth in BRICS countries. Narula and Narula (2019) argues that energy trading is necessary for maintainable energy security and energy availability by reducing costs that support environmental and economic activities. Murshed (2020) describes the non-linear effects of ICT trade on transitions to renewable energy, enhanced energy efficiency, access to clean cooking fuel, and environmental sustainability in South Asia. An et al. (2021) have found that high-quality transport infrastructure and logistical services enormously reduce carbon emissions by conserving energy in the supply chain. Tan et al. (2023) emphasized that integrating clean energy into the mix is critical to delivering energy sustainability in BRI countries. According to them, financial and trade openness and infrastructure development greatly facilitates sustainable energy transitions. According to Tsaurai (2021), human capital development, financial development, and infrastructure development are the major factors that influence energy consumption in BRICS countries. Ullah et al. (2022) concluded that economic development, financial inclusion, energy efficiency, and governance positively affect sustainable development in 64 BRI countries.
3 Methodology
3.1 Econometric model
This study develops an econometric model which is firmly rooted in theoretical principles and supported by empirical literature to investigate the factors influencing energy sustainability in BRI energy-deficient Asian countries. It systematically dissects the determinants impacting energy sustainability. The proposed econometric model is given in Equation 1 as follows:
where ESIit represents the Energy Sustainability Index for country i at time t, FDIit stands for Foreign Direct Investment, LnGDPit is the natural logarithm of GDP, URBit indicates urban population percentage, TRit denotes trade as a percentage of GDP, HCIit captures human capital index, INit refers to infrastructure proxy and εit is usual error term.
The theoretical basis for including these variables in the econometric model is grounded in both theoretical and empirical studies. FDIit can lead to technological spillovers and enhance the energy infrastructure in host countries, thereby improving energy efficiency and sustainability (Osabuohien-Irabor and Drapkin, 2022). On the other side, in case of the shift to energy-intensive production methods, FDIit can increase energy consumption and degrade the environment (Murshed et al., 2021). Incorporating FDIit helps capture these dual effects and understand its overall impact on energy sustainability.
Higher economic growth generally means an increase in energy consumption but also provides the resources needed for investment in sustainable energy infrastructure (Mohammadi et al., 2023). Earlier research has found that, with the appropriate regulatory setting, economic growth contributes to elevating energy efficiency and lowering greenhouse gas emissions (Ayres et al., 2007). Thus, including LnGDPit in the model sets out to capture the dynamics of the economy on energy sustainability.
Generally, higher rates of URBit correspond to increased energy demand for transportation, industry, and homes (Jones, 1991). On the other hand, urbanization can be an impetus for powder-efficient technologies and innovative, sustainable urban planning (Kammen and Sunter, 2016). Including URBit in the model they are allowed us to study what such net effect urbanization have on energy sustainability.
TRit can affect energy sustainability by exchanging energy-efficient technologies and best practices. Studies have shown that with increased trade activities, access to advanced technologies is generally bound to increase, which, in turn matter for energy efficiency and sustainability (Narula and Narula, 2019). Moreover, the impact of trade on changing the energy mix could be realized through improved access to renewable energies (Osabuohien-Irabor and Drapkin, 2022). Consequently, TRit is factored in for analysis while assessing its role in energy sustainability.
HCIit encapsulates education, skills, and health conditions. It contributes much to the sustainability of energy. Better energy management practices and adoption of sustainable technologies are related to higher levels of human capital (Azam, 2019). From this, including HCIit in the model-assisted us in capturing the effect of human capital development on energy sustainability.
Energy sustainability can also be enhanced, especially by infrastructure development (INit) within the energy sector. Investments in green energy infrastructure—renewable sources of energy and efficient transmission networks—can reduce carbon emissions and increase energy efficiency accordingly (An et al., 2021). In this regard, introducing INit into the model provides a way to consider the impacts of infrastructure about energy sustainability.
3.2 Data sources
The data for this study spans from 2000 to 2022, covering 20 selected Asian BRI countries with significant energy resource deficiencies. This comprehensive dataset includes various indicators essential for analyzing energy sustainability and the impact of BRI initiatives. The primary data sources are the World Development Indicators (WDI) and the United Nations Trade and Development database. Table 1 below provides a detailed description of the variables used in the analysis.
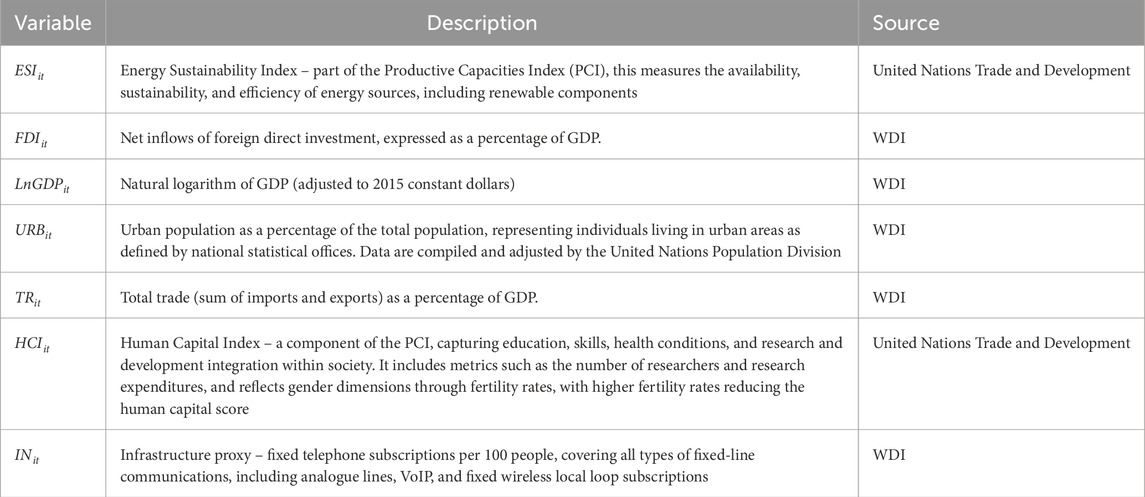
Table 1. Description of variables.
The methodology involves several steps. First, descriptive statistics for all variables involved in the analysis are obtained. Next, a correlation matrix is constructed to examine the relationships among the variables. The correlation matrix provides a measure of the strength and direction of the linear relationship between pairs of variables. This step is essential to detect multicollinearity issues, which can affect the robustness of the regression analysis. First, a check for cross-sectional dependence proposed by Pesaran (2021) is performed to confirm if there is cross-sectional dependence among the variables that feature in this panel. The tests used in this work include the Breusch-Pagan LM, the Pesaran scaled LM test, the bias-corrected scaled LM test, and the Pesaran CD test.
Following the existence of cross-sectional dependence, second-generation panel unit root tests are conducted to establish the stationarity properties of the variables. The second-generation panel unit root test to be used is the one proposed by Pesaran (2007) which accounts for cross-sectional dependence. A Westerlund panel cointegration test accounting for cross-sectional dependence is then applied to establish long-run equilibrium relationships within series.
In particular, panel quantile regressions are run to estimate the long-run parameters and to learn about heterogeneity in these relationships at different quantiles of the conditional distribution of the dependent variable. Quantile regression is a method that adds this dimension to the impact that explanatory variables have at various points of the distribution of the dependent variable.
where in Equation 2,
One of the advantages of quantile regression with panel data is that it allows for an analysis of the effect of explanatory variables along the entire distribution of the dependent variable, not just at the mean. This significantly helps understand how various factors influence energy sustainability at different levels. It may further reveal heterogeneous effects that traditional mean regression models often miss (Koenker and Bassett Jr, 1978). Moreover, panel quantile regression is robust to outliers and heteroskedasticity; therefore, it has advantages in analyzing data sets containing non-normal error distributions or different levels of variance (Koenker, 2005). However, it also has some disadvantages. In this respect, computational complexity may also be higher than in traditional regression methods with large datasets. Moreover, interpretation of the result is more complicated since it involves understanding the effects across multiple quantiles and how these impacts differ from the mean effects commonly estimated by conventional regression models (Yu et al., 2003).
This study utilizes the BSTS methodology to estimate the causal impact of BRI on ESIit in energy-scarce Asian countries. Brodersen et al. (2015) introduced a novel BSTS method based on state space models, estimating the causal relationship by filtering it against other signals. The BSTS model is expressed in Equation 3 as:
where yt is the observed ESIit, αt is the hidden state vector, Zt is the observation matrix, Xt represents the explanatory variables (FDIit, LnGDPit, URBit, TRit, HCIit, INit), and β is the vector of coefficients.
The study incorporates a dummy variable, capturing the effect of MoU. This dummy variable is set to 1 from the year after which MoU was signed to join BRI onwards and stays 0 for all periods before MoU signing. In Equation 4, innovation vector ϵt is assumed to be normally distributed with mean zero and variance σ2:
In this paper, the BSTS approach is applied separately for each selected BRI country to project their contribution to ESIit. The counterfactual analysis contrasts the observed ESIit with the case where the BRI MoUs were not signed. Brodersen et al. (2015) emphasize that such a counterfactual scenario is an essential aspect of quantifying the causal impact of BRI initiatives on energy sustainability.
The BSTS approach allows flexibility in terms of including a myriad of external covariates and adaptation to different economic conditions, and thus, it fits perfectly in this study. Also, Bayesianism is robust for quantifying uncertainty, increasing the reliability of causal impact estimates Brodersen et al. (2015).
Assigning prior distributions to the model parameters is a crucial step in the Bayesian approach. Let β represent the coefficients for the explanatory variables, with its prior distribution denoted as p(β). Prior distributions are also assigned to the state space model parameters, reflecting beliefs about their plausible values (Box and Tiao, 2011; Brodersen et al., 2015).
Inference in Bayesian analysis involves updating model parameter assumptions based on observed data. The posterior distribution of the parameters is derived using Bayes’ theorem given the observed ESIit data yt as expressed in Equation 5:
Markov Chain Monte Carlo methods, such as Gibbs sampling or Metropolis-Hastings algorithms, are used to sample from the posterior distribution, facilitating the estimation of model parameters and latent states (Box and Tiao, 2011; Brodersen et al., 2015).
The causal impact is determined by comparing the observed ESIit with the counterfactual scenario in which BRI initiatives were not implemented. The counterfactual is simulated by projecting the model forward, assessing what ESIit have been without the BRI MoUs. The causal impact is the difference between the observed and counterfactual ESIit (Brodersen et al., 2015). This analysis is applied to various post-MoU periods, providing insights into the effectiveness of BRI initiatives on energy sustainability.
The BSTS approach offers a robust framework for evaluating the causal impact of BRI on energy sustainability in Asian countries. Its adaptability to different conditions and the inclusion of explanatory variables ensure a comprehensive and reliable analysis, providing valuable insights for policymakers. The whole methodology is summarized in Figure 1.
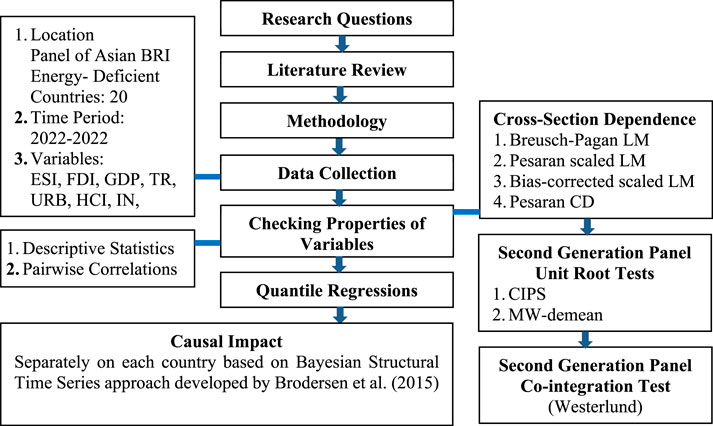
Figure 1. Research methodology–flow diagram.
4 Empirical results
Table 2 presents the descriptive statistics for the variables included in the study. These statistics summarize the central tendency, dispersion, and shape of the distribution of each variable. The descriptive statistics reveal substantial variability across the variables. For instance, the ESIit has a mean value of 49.095 with a standard deviation of 16.625, indicating significant differences in energy sustainability among the countries studied. The FDIit shows a mean of 3.655% of GDP, but its high standard deviation of 4.920 and wide range (from −37.173 to 43.912) highlight considerable fluctuations in FDI inflows.
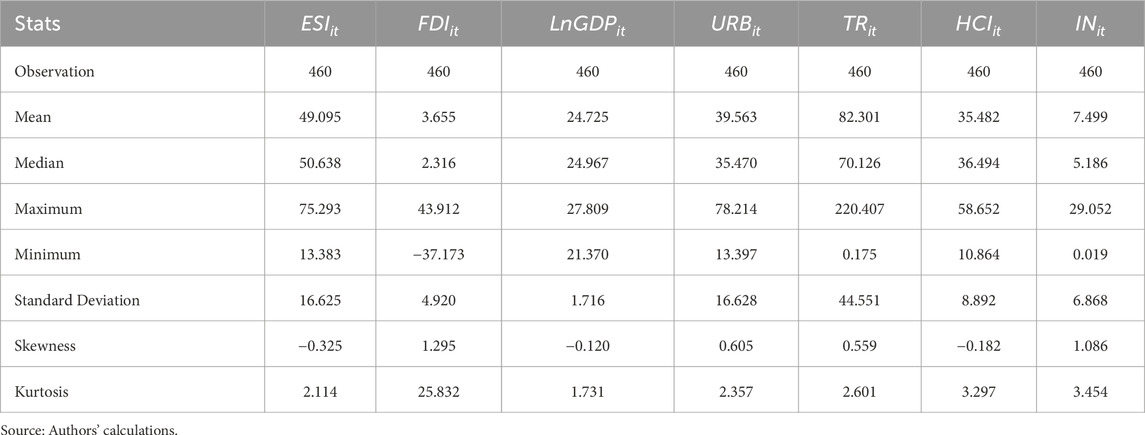
Table 2. Descriptive statistics.
Similarly, LnGDPit and URBit exhibit moderate variability, with standard deviations of 1.716 and 16.628, respectively. TRit reflects diverse trade activities among the countries which has a high mean value of 82.301 and a wide range from 0.175 to 220.407. The HCIit and INit also show notable differences in human capital development and infrastructure across the sample countries. The skewness and kurtosis values of some variables such as FDIit indicate the presence of outliers or non-normal distribution patterns and have distributions with significant asymmetry and peakedness.
The correlation matrix in Table 3 reveals several notable relationships among the variables. ESIit shows a moderate positive correlation with URBit (0.662), HCIit (0.726), and INit (0.633), indicating that these factors are associated with higher energy sustainability. ESIit also has weaker positive correlations with FDIit (0.159), LnGDPit (0.208), and TRit (0.439). Additionally, the correlation matrix indicates that there is no high correlation between the explanatory variables, suggesting that there is not a problem of possible multicollinearity among them.
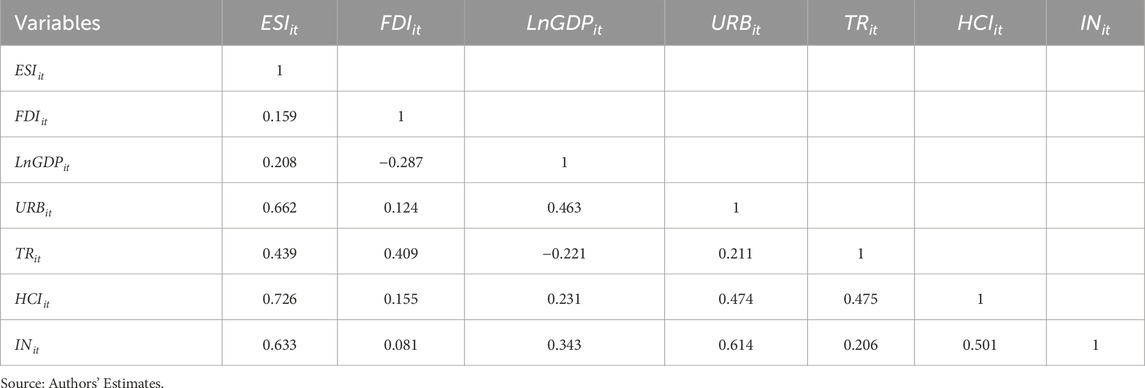
Table 3. Correlation matrix.
The cross-sectional dependence tests, as shown in Table 4, indicate significant cross-sectional dependence among the panel time series variables. The Breusch-Pagan LM, Pesaran scaled LM, Bias-corrected scaled LM, and Pesaran CD tests all yield extremely high test statistics with p-values of 0.0000, indicating strong evidence of cross-sectional dependence (Breusch and Pagan, 1980; Pesaran, 2021). Given the presence of cross-sectional dependence, the most suitable approach to examine the stationarity of the variables is to employ second-generation panel unit root tests, which are designed to account for such dependencies (Pesaran, 2007). This ensures more reliable and valid results in the context of panel data analysis.
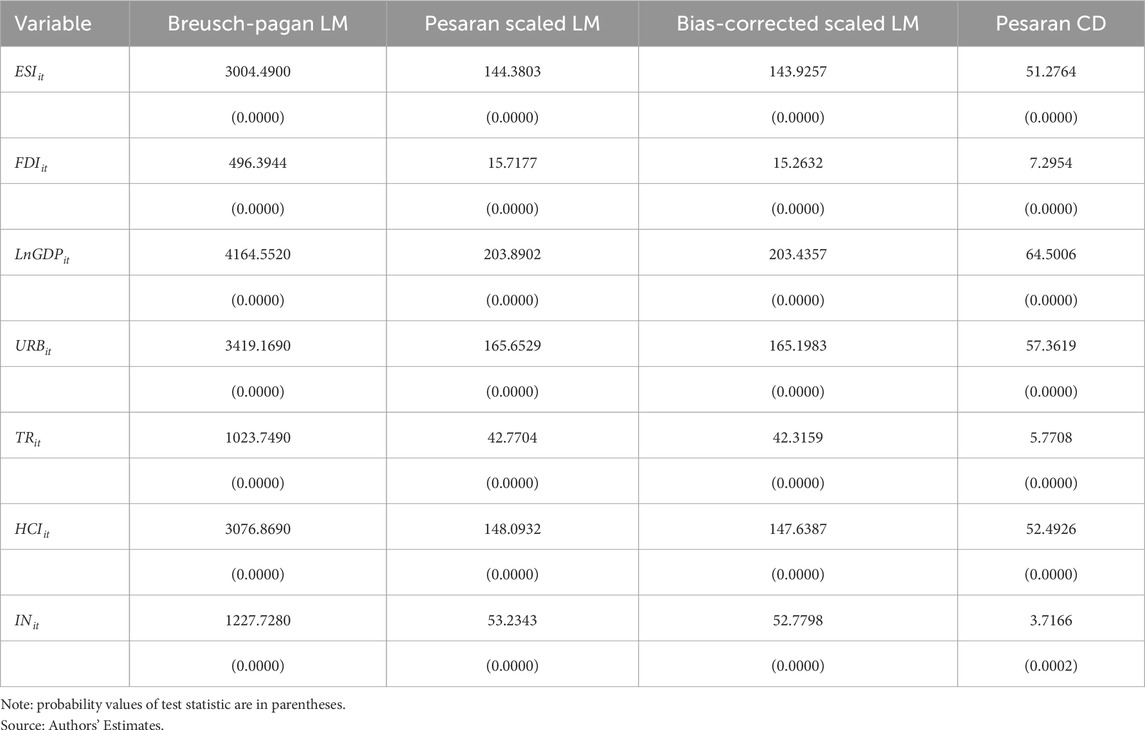
Table 4. Cross-section dependence tests.
The panel unit root tests, as presented in Table 5, reveal significant insights into the stationarity of the variables under investigation. At their levels, the majority of variables (ESIit, FDIit, LnGDPit, URBit, TRit, HCIit, and INit) show non-stationarity, as indicated by both the Maddala and Wu (MW) and Cross-sectional Augmented Im, Pesaran, and Shin (CIPS) tests. Specifically, the p-values for these tests are generally above conventional significance levels (0.05), suggesting the presence of unit roots.
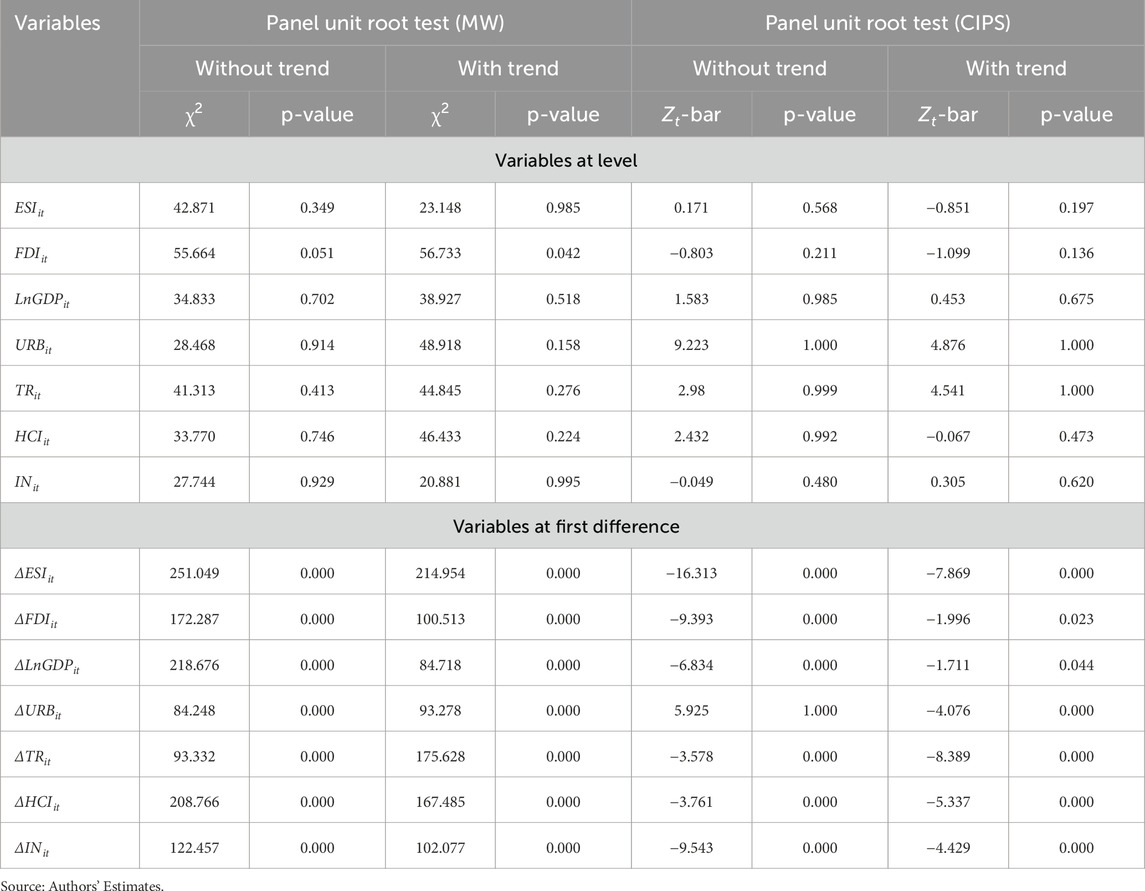
Table 5. Panel unit root tests.
For instance, the MW test for ESIit without trend reports a chi-square value of 42.871 with a p-value of 0.349, while the CIPS test without trend gives a Zt-bar of 0.171 with a p-value of 0.568, indicating non-stationarity. Similar patterns are observed across other variables at their levels, such as FDIit (MW test p-values of 0.051 and 0.042) and URBit (MW test p-values of 0.914 and 0.158), corroborating the presence of unit roots.
However, when these variables are differenced, they become stationary, as evidenced by both the MW and CIPS tests at the first difference. For ΔESIit, the MW test reports highly significant chi-square values (251.049 without trend and 214.954 with trend) with p-values of 0.000. The CIPS test further supports this stationarity with Zt-bar values of −16.313 and −7.869, both with p-values of 0.000. Similar results are observed for ΔFDIit, ΔLnGDPit, ΔURBit, ΔTRit, ΔHCIit, and ΔINit, where the tests consistently show p-values of 0.000, indicating strong evidence of stationarity at the first difference.
Therefore, based on these results, it is clear that while the variables exhibit non-stationarity at their levels, they become stationary after differencing. Consequently, second-generation panel unit root tests, which account for cross-sectional dependence, are appropriate for this analysis (Pesaran, 2007). These findings underscore the necessity of using differenced data to ensure the reliability and validity of further econometric analyses involving these variables.
The results of the Westerlund panel cointegration test presented in Table 6 indicate that the variables exhibit cointegration in the long run under certain conditions. Specifically, when considering the scenarios “without trend and panel means” and “with trend and panel means,” both tests for “some panels are cointegrated” and “all panels are cointegrated” yield significant results (p-values of 0.0170 and 0.0128 for some panels, and 0.0769 and 0.0158 for all panels, respectively). These findings suggest that the variables are cointegrated in the long run, implying a stable long-term relationship among them.
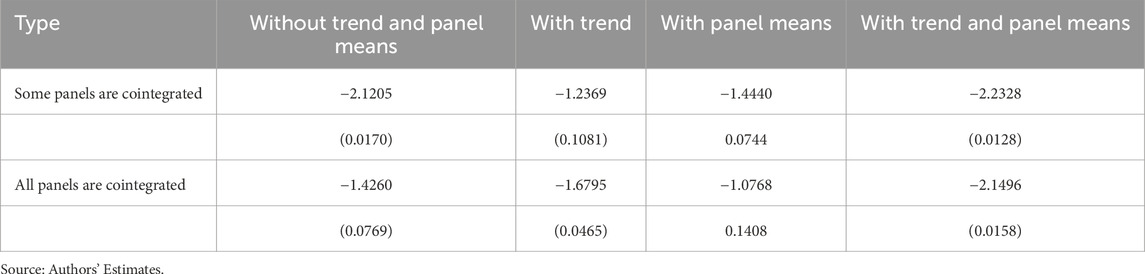
Table 6. Panel cointegration test - westerlund.
4.1 Energy sustainability determinants
The Panel Quantile Regression Estimates (PQRE) in Table 7 reveal insightful findings regarding the factors influencing ESIit in the context of the BRI countries. The results are also summarized in Figure 2. The results show varying impacts across different quantiles. FDIit demonstrates a negative and insignificant impact on ESIit in most of the quantiles except 50th and 60th quantiles. It suggests that FDIit can lead to increase energy consumption. The negative coefficients, although not statistically significant at lower quantiles, become more pronounced at higher quantiles. It suggests that as countries receive more FDIit, the detrimental impact on ESIit becomes more evident. This can be attributed to the importation of energy-intensive technologies and lax environmental regulations in many developing countries which lead to higher energy consumption.
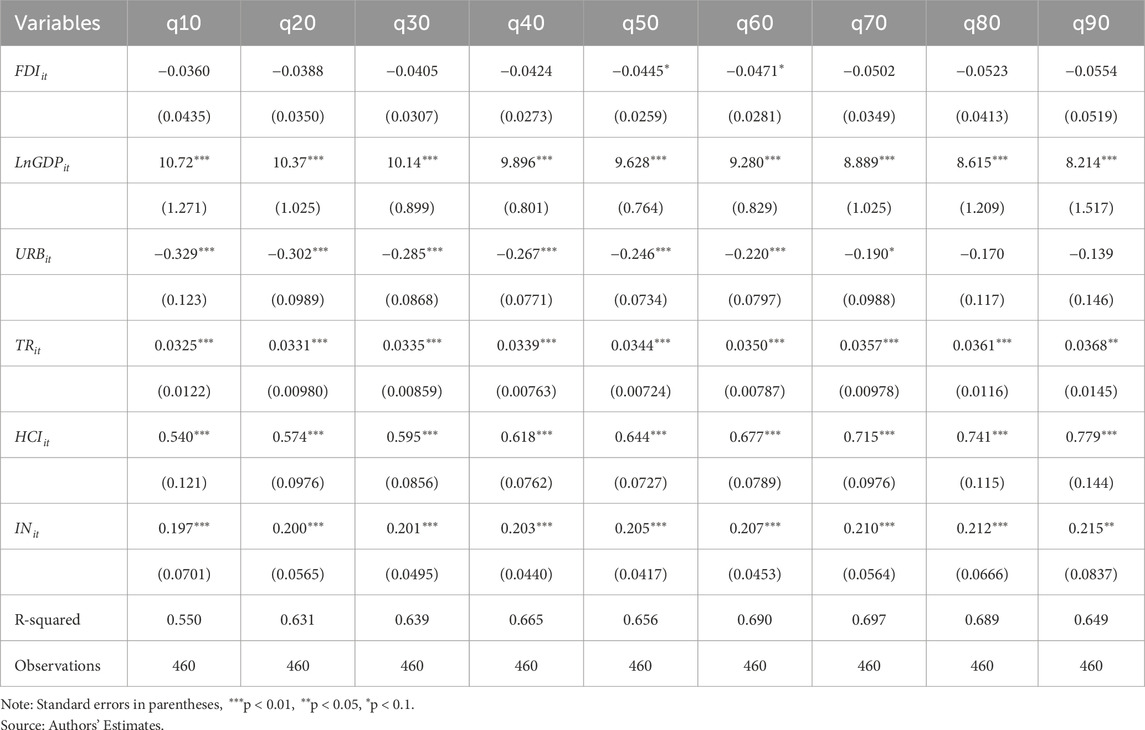
Table 7. Panel quantile regression estimates.
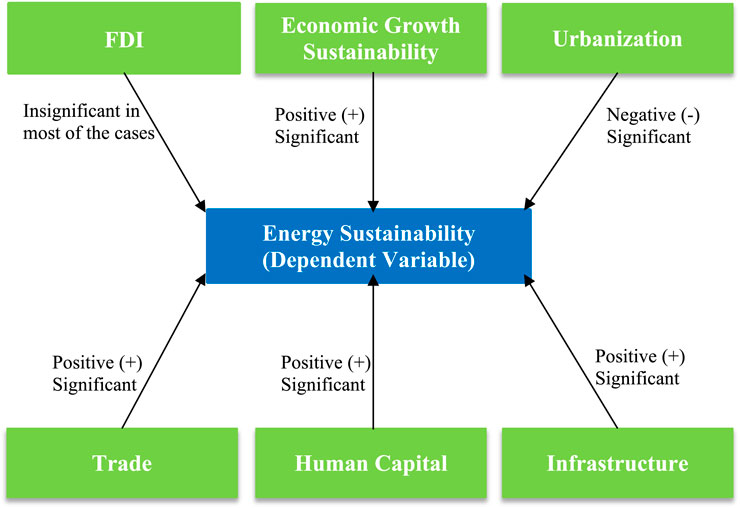
Figure 2. Summary of panel quantile regression results.
LnGDPit consistently exhibits a significant positive impact on ESIit across all quantiles. It indicates that higher LnGDPit levels lead to better ESIit outcomes. Many studies have therefore confirmed this relationship by identifying that economic growth generally improves ESIit through the stimulus of investments in energy infrastructure and efficiency. For example, Mohammadi et al. (2023) identify that economic growth has considerably improved ESIit in both developed and developing countries. Ayres et al. (2007) also explained that through better management rather than a carbon tax, which only raises the price of energy, economic growth can be sustained along with mitigated GHG emissions while improving energy efficiency and promoting sustainable growth.
URBit has a significant negative impact on ESIit across most quantiles. This suggests that URBit increases energy consumption due to higher energy demands for transportation and the modernization of agriculture. Jones (1991) notes that URBit increases overall energy consumption due to these factors, which is consistent with the findings of this analysis. However, the impact of URBit on ESIit diminishes in higher quantiles, possibly reflecting better energy management and efficiency measures in more urbanized regions. Kammen and Sunter (2016) emphasize that cities must develop low-carbon, resilient energy systems to manage the high energy demands of growing populations.
TRit shows a positive impact on ESIit across all quantiles, with significant positive coefficients indicating that increased TRit activities contribute to better ESIit. This agrees with findings by Narula (2018) who argues that energy trade is key to attaining sustainable energy security since it assures the availability of energy and sustains environmental and economic activities. Another positive effect of TRit on ESIit may reflect the gains from technology transfers and innovation associated with international trade. According to Osabuohien-Irabor and Drapkin (2022), trade openness enhances the advantage that technological innovation has on energy use toward a more sustainable environment in its use, which goes to underscore this analysis.
HCIit significantly and positively impacts ESIit across all quantiles, highlighting the importance of education, skills, and health conditions in promoting sustainable energy use. The positive coefficients across all quantiles indicate that higher levels of HCIit are associated with better ESIit outcomes. Azam (2019) found that HCIit significantly contributes to economic growth and energy sustainability in BRICS countries, reinforcing the critical role of HCIit in energy management and sustainability. Higher levels of education and skills can lead to more efficient energy use and the adoption of sustainable energy practices, supporting the positive relationship observed in this analysis.
INit development also shows a significant positive impact on ESIit across all quantiles. The positive coefficients indicate that investments in INit, particularly in green energy and logistics, enhance ESIit by reducing carbon emissions and improving energy efficiency. An et al. (2021) found that high-quality transport INit significantly reduces carbon emissions through energy conservation in the supply chain, promoting ESIit. Similarly, Tan et al. (2023) highlighted the critical role of clean energy inclusion in the energy mix for ensuring ESIit in BRI nations, finding that financial and trade openness coupled with INit development significantly promote sustainable energy transitions.
The empirical findings in Table 7 highlight the importance of economic growth, international trade, education, and infrastructure in promoting energy sustainability. The negative impact of URBit at suggests that rapid URBit poses challenges to ESIit, which can be mitigated through effective energy policies and management practices.
4.2 Causal impact of BRI on energy sustainability
During the period following the signing of MoUs under the BRI, the causal impact on the ESI reveals a diverse range of outcomes among the energy-deficient Asian countries. The findings reported in Table 8 and Figure 3 show the varying responses to the BRI initiatives.
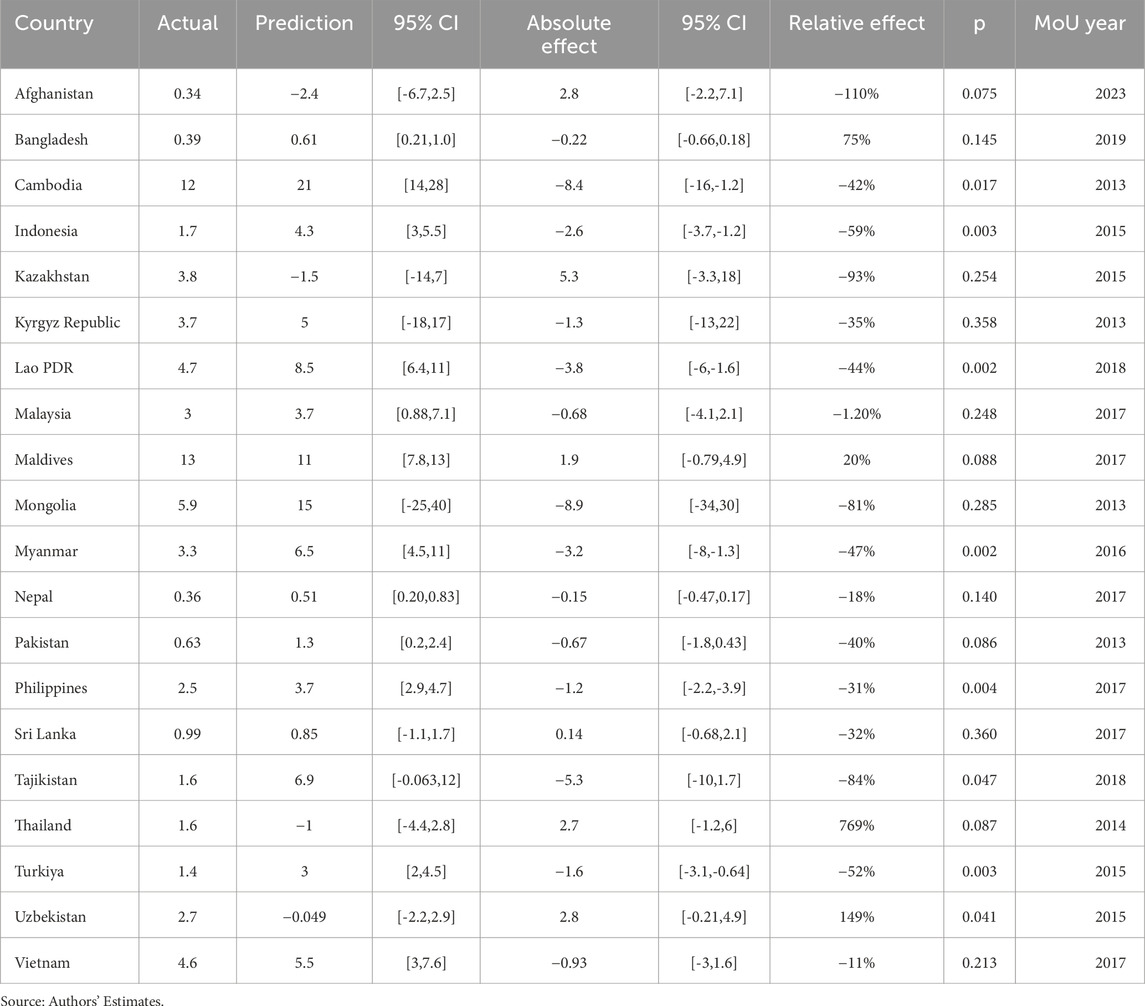
Table 8. Causal impact on ESI after MoU on BRI.
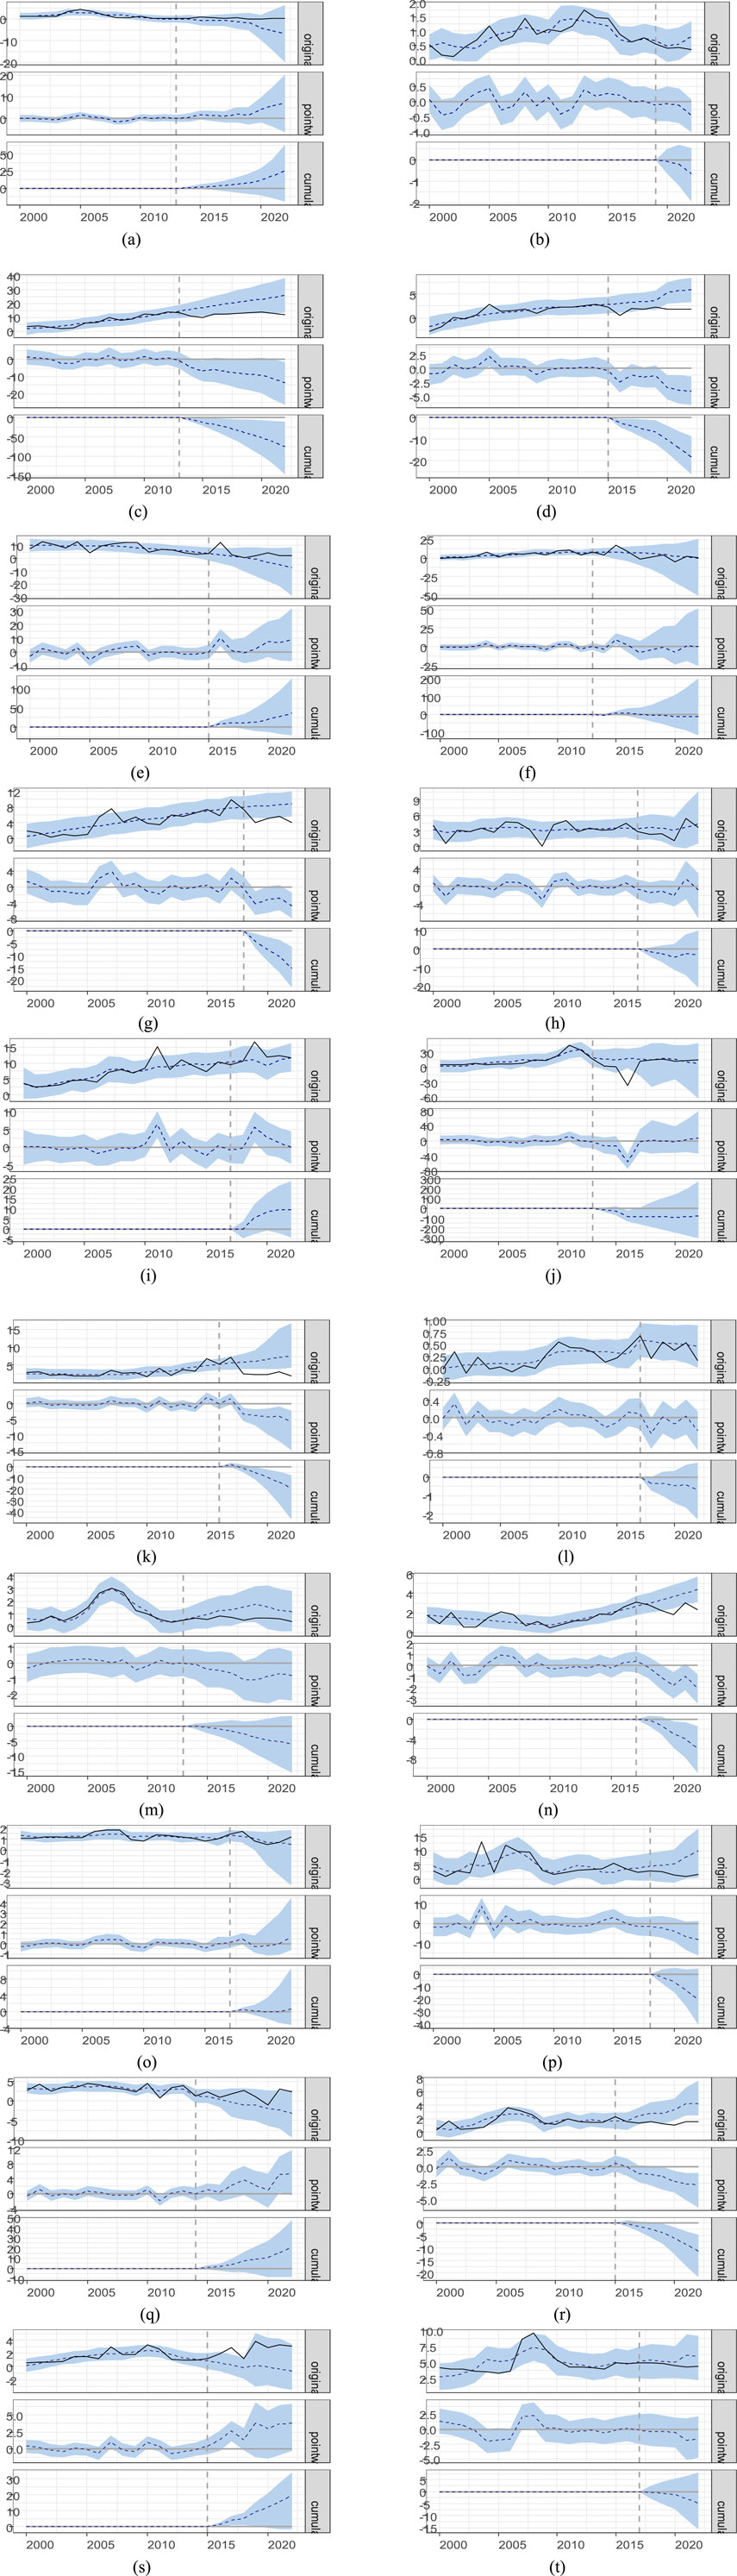
Figure 3. Causal Impact of BRI initiatives on ESI. (a) Afghanistan; (b) Bangladesh; (c) Cambodia; (d) Indonesia; (e) Kazakhstan; (f) Kyrgyz Republic; (g) Lao PDR; (h) Malaysia; (i) Maldives; (j) Mongolia; (k) Myanmar; (l) Nepal; (m) Pakistan; (n) Philippines; (o) Sri Lanka; (p) Tajikistan; (q) Thailand; (r) Turkey; (s) Uzbekistan; (t) Vietnam.
In Afghanistan, the actual ESI was 0.34 compared to the predicted −2.4, with a 95% confidence interval (CI) ranging from −6.7 to 2.5. This resulted in an absolute effect of 2.8, indicating a 110% relative effect, albeit with a p-value of 0.075, suggesting a modest increase in energy sustainability. This positive outcome can be attributed to the infusion of foreign investments and infrastructure development under the BRI, which can improve energy access and efficiency (He et al., 2021).
Bangladesh exhibited a different trend with an actual ESI of 0.39 versus a predicted 0.61, leading to an absolute effect of −0.22 and a 75% relative effect, though the p-value of 0.145 indicates that this result is not statistically significant. This outcome may reflect initial disruptions or adjustments in energy policies and infrastructures post-MoU signing.
Cambodia displayed a substantial negative absolute effect. The actual ESI was 12 compared to a predicted 21, with a 95% CI of 14–28. The absolute effect was −8.4, resulting in a relative effect of −42%, which is statistically significant with a p-value of 0.017. This negative impact might be due to the increased energy consumption from rapid industrialization and urbanization spurred by BRI projects, which often precede improvements in energy sustainability (Barsky and Kilian, 2001).
Indonesia also showed a significant negative absolute effect with an actual ESI of 1.7 compared to a predicted 4.3, yielding an absolute effect of −2.6 and a relative effect of −59%, with a significant p-value of 0.003. Similar to Cambodia, the negative impact may be attributed to increased energy demand outstripping the improvements in energy infrastructure initially (Mohammadi et al., 2023).
Kazakhstan’s actual ESI was 3.8 versus a predicted −1.5, resulting in an absolute effect of 5.3, with a 95% CI of −3.3 to 18. Although this indicates a 93% relative effect, the p-value of 0.254 suggests it is not statistically significant. The positive but insignificant impact might reflect the early stages of BRI projects where benefits are yet to fully materialize (Zhang et al., 2021). In contrast, the Kyrgyz Republic showed an actual ESI of 3.7 against a predicted 5, leading to an absolute effect of −1.3 and a relative effect of −35%, with a p-value of 0.358, indicating no significant impact. This could be due to the limited scale or slower implementation of BRI projects in the region (Khan et al., 2021).
Lao PDR exhibited a negative absolute effect, wherein the actual ESI was 4.7 while it was predicted to be at 8.5; therefore, having an absolute effect of −3.8 while the relative effect was −44%, thus indicating evidence of some negative impact on energy sustainability of BRI. This may be due to characteristics of the infrastructure programs being more initial energy-intensive than their sustainability attributes in the long term (Gu and Zhou, 2020).
In the case of Malaysia, its actual ESI was 3 compared with a predicted value of 3.7; the absolute effect was thus −0.68 and the relative effect −1.20% with a p-value of 0.248, making it not significant. The Maldives’ case turned in an actual ESI of 13 as against the predicted 11, hence having an absolute effect of 1.9 and a relative effect of 20%, the p-value is 0.088, which implies that it is again not statistically significant. Such outcomes may be a reflection of the BRI projects’ moderate scale and effect in these countries (Osabuohien-Irabor and Drapkin, 2022).
Mongolia’s actual ESI was 5.9 compared to a predicted 15, yielding an absolute effect of −8.9 and a relative effect of −81%, with a p-value of 0.285, indicating no significant impact. Myanmar demonstrated a significant negative absolute effect with an actual ESI of 3.3 versus a predicted 6.5, resulting in an absolute effect of −3.2 and a relative effect of −47%, with a p-value of 0.002. Nepal’s actual ESI was 0.36 compared to a predicted 0.51, leading to an absolute effect of −0.15 and a relative effect of −18%, with a p-value of 0.140, indicating no significant impact. These results might be due to the varying stages of implementation and scale of BRI projects (Adams et al., 2020).
The actual ESI for Mongolia was 5.9 compared with a predicted 15, producing an absolute effect of −8.9 and a relative effect of −81%, while the p-value was 0.285, indicating no significant impact. Myanmar had an absolute significant negative effect where the actual ESI was 3.3 against the predicted 6.5, producing an absolute effect of −3.2 and a relative effect of-47% with a p-value of 0.002. The actual ESI of Nepal against the predicted 0.51 was 0.36. Its absolute effect was therefore −0.15, whereas the relative effect stood at −18% with a p-value of 0.140, hence no significant impact. These results might be due to the varying stages of implementation and scale of BRI projects (Adams et al., 2020).
Pakistan followed an actual ESI of 0.63 against the predicted 1.3, resulting in −0.67 absolute effect and a relative effect of −40%, with a p-value of 0.086 which indicate that the present result is definite at almost probably modest negative impact. The Philippines, however, had a very strong absolute effect wherein the actual ESI was 2.5 against the predicted 3.7, hence giving it an absolute effect of −1.2 and a relative effect of −31% with a p-value of 0.004. These negative effects are postulated to be possibly caused by the immediate increase in energy consumption driven by such infrastructure development (Saidi and Hammami, 2015).
Sri Lanka’s actual ESI was 0.99 versus a predicted 0.85, leading to an absolute effect of 0.14 and a relative effect of −32%, with a p-value of 0.360, indicating no significant impact. Tajikistan demonstrated a significant negative absolute effect with an actual ESI of 1.6 against a predicted 6.9, resulting in an absolute effect of −5.3 and a relative effect of −84%, with a p-value of 0.047. This could reflect the short-term disruptions and increased energy consumption associated with large-scale infrastructure projects (Futcher and Mills, 2013).
Thailand’s actual ESI was 1.6 compared to a predicted −1, yielding an absolute effect of 2.7 and a relative effect of 769%, with a p-value of 0.087, suggesting a significant positive impact. This positive impact may be due to effective integration of BRI projects with existing energy infrastructure (Tan et al., 2023). Turkiya exhibited a significant negative absolute effect with an actual ESI of 1.4 compared to a predicted 3, resulting in an absolute effect of −1.6 and a relative effect of −52%, with a p-value of 0.003. Uzbekistan’s actual ESI was 2.7 versus a predicted −0.049, yielding an absolute effect of 2.8 and a relative effect of 149%, with a p-value of 0.041, indicating a significant positive impact. Vietnam’s actual ESI was 4.6 against a predicted 5.5, resulting in an absolute effect of −0.93 and a relative effect of −11%, with a p-value of 0.213, suggesting no significant impact.
These findings underscore the diverse impacts of BRI initiatives on ESI across different countries. While some countries like Cambodia, Indonesia, and Turkiya showed significant negative impacts, others like Thailand and Uzbekistan exhibited positive effects. These results highlight the varied economic and environmental responses to BRI initiatives, emphasizing the need for tailored policy interventions to enhance energy sustainability in participating countries (Abbas et al., 2021; He et al., 2021). The varying impacts can be theoretically supported by the differences in the scale, implementation, and integration of BRI projects, as well as the initial conditions of the countries’ energy infrastructures and policies (Khan et al., 2021; Osabuohien-Irabor and Drapkin, 2022).
5 Conclusion, policy recommendations, and limitations of the study
The findings of this study provide significant insight into the relationship between BRI initiatives and energy sustainability in selected energy-deficit Asian countries. The study establishes the strong positive effect of economic growth on energy sustainability. Indeed, the assertion is that countries, when growing economically, are ready to put more investments into technologies and infrastructure for sustainable energy, thereby enhancing their energy sustainability. Economic growth provides wherewithal to invest in energy efficiency and renewable energy projects. The positive effect of trade openness on energy sustainability indicates that international trade can be instrumental in inducing access to advanced energy technologies and practices. Human capital also evidences a correspondingly significant positive effect on energy sustainability. This result underlines how education, skills, and health conditions can promote sustainable energy use. On the contrary, urbanization exerts a negative effect on energy sustainability at most quantiles. This negative relationship means that increased urbanization is related to higher energy consumption, since greater energy is needed for transportation.
Causal impact analysis clearly confirms that BRI initiatives have different impacts on energy sustainability in Asian countries, especially through MoUs. For instance in Maldives and Uzbekistan, the immense change in energy sustainability after the signing of the MoU proves the efficiency in regard to BRI investment for the betterment of energy infrastructure and its efficiency. On the other hand, this issue remains a challenge for most of the countries, meaning thereby that the impact of the BRI initiative is not homogeneous and depends on the context and implementation strategies put into place by each country.
For policymakers and stakeholders, the findings provide valuable insights into how BRI initiatives can be managed to maximize their positive impact on energy sustainability. The study suggests that targeted investments in human capital and infrastructure are crucial for enhancing energy sustainability. Policymakers should focus on creating a conducive environment for economic growth and trade, which can provide the resources needed for sustainable energy investments. Additionally, the negative impact of urbanization highlights the need for urban planning and policies that promote energy efficiency and the adoption of sustainable energy technologies.
Furthermore, countries like Afghanistan, Maldives and Uzbekistan showed positive causal impacts, should continue to encourage and expand investments in energy projects by attracting FDI for energy infrastructure. In nations such as Bangladesh and Pakistan, where the initial impacts are modest or slightly negative, it is crucial to manage short-term disruptions by stabilizing energy policies and infrastructures post-MoU signing. Cambodia, Indonesia, and Turkey, which experienced significant negative impacts, need policies that balance rapid industrialization and urbanization with sustainable energy practices, including implementing energy efficiency measures and promoting cleaner technologies. Thailand’s positive outcomes suggest the importance of integrating BRI projects with existing energy infrastructure, a strategy that other countries should adopt for better planning and coordination.
Lastly, in the gradual implementation of BRI projects, Kazakhstan and the Kyrgyz Republic should also be backed with positive but not significant impacts, and support by regular monitoring to ensure that benefits materialize fully. Other countries should take a lead from Uzbekistan and give primacy to investing in human resources and R&D through education, training programs, and incentives for innovation in the energy sector. In the short run, for countries like Myanmar and Tajikistan, which face some of the most negative impacts of large infrastructure, stringent mitigation measures for the environment and green construction methods become necessary.
Despite its contributions, this study has limitations. The scope of countries analyzed and potential data constraints may limit the generalizability of the findings. Future research could expand the analysis to include more countries and longer time frames, and explore additional variables that may influence energy sustainability. Moreover, further studies could investigate the specific mechanisms through which BRI initiatives impact energy sustainability, providing a more detailed understanding of the causal relationships involved.
Data availability statement
Publicly available datasets were analyzed in this study. This data can be found here: https://data.worldbank.org; https://data.imf.org/.
Author contributions
AO: Writing – original draft, Conceptualization, Supervision. GZ: Funding acquisition, Methodology, Validation, Writing – review and editing. LS: Funding acquisition, Resources, Writing – review and editing.
Funding
The author(s) declare that financial support was received for the research and/or publication of this article. This work was supported by the 2023 Foreign Experts Project of the Ministry of Science and Technology of China (Grant #: DL2023202002L).
Conflict of interest
The authors declare that the research was conducted in the absence of any commercial or financial relationships that could be construed as a potential conflict of interest.
Generative AI statement
The author(s) declare that no Generative AI was used in the creation of this manuscript.
Publisher’s note
All claims expressed in this article are solely those of the authors and do not necessarily represent those of their affiliated organizations, or those of the publisher, the editors and the reviewers. Any product that may be evaluated in this article, or claim that may be made by its manufacturer, is not guaranteed or endorsed by the publisher.
References
Abbas, H. S. M., Xu, X., and Sun, C. (2021). Role of foreign direct investment interaction to energy consumption and institutional governance in sustainable GHG emission reduction. Environ. Sci. Pollut. Res. 28, 56808–56821. doi:10.1007/s11356-021-14650-7
Adams, S., Boateng, E., and Acheampong, A. O. (2020). Transport energy consumption and environmental quality: does urbanization matter? Sci. Total Environ., 744, 140617. doi:10.1016/j.scitotenv.2020.140617
An, H., Razzaq, A., Nawaz, A., Noman, S. M., and Khan, S. A. R. (2021). Nexus between green logistic operations and triple bottom line: evidence from infrastructure-led Chinese outward foreign direct investment in Belt and Road host countries. Environ. Sci. Pollut. Res. 28 (37), 51022–51045. doi:10.1007/s11356-021-12470-3
Ayres, R. U., Turton, H., and Casten, T. (2007). Energy efficiency, sustainability and economic growth. Energy 32 (5), 634–648. doi:10.1016/J.ENERGY.2006.06.005
Azam, M. (2019). Relationship between energy, investment, human capital, environment, and economic growth in four BRICS countries. Environ. Sci. Pollut. Res. 26 (33), 34388–34400. doi:10.1007/s11356-019-06533-9
Barsky, R. B., and Kilian, L. (2001). Do we really know that oil caused the great stagflation? A monetary alternative. NBER Macroecon. Annu. 16, 137–183. doi:10.1086/654439
Box, G. E., and Tiao, G. C. (2011). Bayesian inference in statistical analysis. John Wiley and Sons.
Breusch, T. S., and Pagan, A. R. (1980). The Lagrange multiplier test and its applications to model specification in econometrics. Rev. Econ. Stud. 47 (1), 239–253. doi:10.2307/2297111
Brodersen, K. H., Gallusser, F., Koehler, J., Remy, N., and Scott, S. L. (2015). Inferring causal impact using Bayesian structural time-series models. Ann. Appl. Stat. 9. doi:10.1214/14-AOAS788
Broto, V. C. (2017). Energy landscapes and urban trajectories towards sustainability. Energy Policy 108, 755–764. doi:10.1016/j.enpol.2017.01.009
Futcher, J. A., and Mills, G. (2013). The role of urban form as an energy management parameter. Energy Policy 53, 218–228. doi:10.1016/j.enpol.2012.10.080
Gajdzik, B., Wolniak, R., Nagaj, R., Žuromskaitė-Nagaj, B., and Grebski, W. W. (2024). The influence of the global energy crisis on energy efficiency: a comprehensive analysis. Energies 17 (4), 947. doi:10.3390/en17040947
Gu, A., and Zhou, X. (2020). Emission reduction effects of the green energy investment projects of China in belt and road initiative countries. Ecosyst. Health Sustain. 6 (1), 1747947. doi:10.1080/20964129.2020.1747947
He, J., Chen, J., Peng, H., and Duan, H. (2021). Exploring the effect of renewable energy on low-carbon sustainable development in the Belt and Road Initiative countries: evidence from the spatial-temporal perspective. Environ. Sci. Pollut. Res. 28, 39993–40010. doi:10.1007/s11356-021-13611-4
Irfan, M., and Ojha, R. K. (2023). Foreign direct investment inflows and energy diversification in emerging seven economies: evidence from a panel data analysis. Int. J. Emerg. Mark. 18 (12), 5545–5564. doi:10.1108/ijoem-09-2020-1137
Jia, H., Fan, S., and Xia, M. (2023). The impact of renewable energy consumption on economic growth: evidence from countries along the Belt and Road. Sustainability 15 (11), 8644. doi:10.3390/su15118644
Jiang, H.-D., Pradhan, B. K., Dong, K., Yu, Y.-Y., and Liang, Q.-M. (2024). An economy-wide impacts of multiple mitigation pathways toward carbon neutrality in China: a CGE-based analysis. Energy Econ. 129, 107220. doi:10.1016/j.eneco.2023.107220
Jiang, H.-D., Purohit, P., Liang, Q.-M., Liu, L.-J., and Zhang, Y.-F. (2023). Improving the regional deployment of carbon mitigation efforts by incorporating air-quality co-benefits: a multi-provincial analysis of China. Ecol. Econ. 204, 107675. doi:10.1016/j.ecolecon.2022.107675
Jones, D. W. (1991). How urbanization affects energy-use in developing countries. Energy Policy 19 (7), 621–630. doi:10.1016/0301-4215(91)90094-5
Kammen, D. M., and Sunter, D. A. (2016). City-integrated renewable energy for urban sustainability. Science 352 (6288), 922–928. doi:10.1126/science.aad9302
Khan, A., Chenggang, Y., Hussain, J., and Kui, Z. (2021). Impact of technological innovation, financial development and foreign direct investment on renewable energy, non-renewable energy and the environment in belt and Road Initiative countries. Renew. Energy 171, 479–491. doi:10.1016/J.RENENE.2021.02.075
Koenker, R. (2005). Quantile regression, 38. Cambridge, United Kingdom: Cambridge University Press. doi:10.1017/CBO9780511754098
Koenker, R., and Bassett, G. (1978). Regression quantiles. Econ. J. Econ. Soc. 46, 33–50. doi:10.2307/1913643
Liu, Z., Zhang, H., Zhang, Y.-J., and Qin, C.-X. (2020). How does income inequality affect energy efficiency? Empirical evidence from 33 Belt and Road Initiative countries. J. Clean. Prod. 269, 122421. doi:10.1016/j.jclepro.2020.122421
Mohammadi, H., Saghaian, S., and Zandi Dareh Gharibi, B. (2023). Renewable and non-renewable energy consumption and its impact on economic growth. Sustainability 15 (4), 3822. doi:10.3390/su15043822
Murshed, M. (2020). An empirical analysis of the non-linear impacts of ICT-trade openness on renewable energy transition, energy efficiency, clean cooking fuel access and environmental sustainability in South Asia. Environ. Sci. Pollut. Res. 27 (29), 36254–36281. doi:10.1007/s11356-020-09497-3
Murshed, M., Elheddad, M., Ahmed, R., Bassim, M., and Than, E. T. (2021). Foreign direct investments, renewable electricity output, and ecological footprints: do financial globalization facilitate renewable energy transition and environmental welfare in Bangladesh? Asia-Pacific Financ. Mark. 29, 33–78. doi:10.1007/S10690-021-09335-7
Narula, R. (2018). Multinational firms and the extractive sectors in the 21st century: can they drive development? J. World Bus.53 (1), 85–91. doi:10.1016/j.jwb.2017.09.004
Narula, K., and Narula, K. (2019). “Energy trade—the backbone of sustainable energy security,” in The maritime dimension of sustainable energy security, 73–93. doi:10.1007/978-981-13-1589-3_4
Nyeadi, J. D. (2023). The impact of financial development and foreign direct investment on environmental sustainability in Sub-Saharan Africa: using PMG-ARDL approach. Econ. Research-Ekonomska Istraživanja 36 (2). doi:10.1080/1331677x.2022.2106270
Osabuohien-Irabor, O., and Drapkin, I. M. (2022). The impact of technological innovation on energy consumption in OECD economies: the role of outward foreign direct investment and international trade openness. Int. J. Energy Econ. Policy 12 (4), 317–333. doi:10.32479/ijeep.13091
Pesaran, M. H. (2007). A simple panel unit root test in the presence of cross-section dependence. J. Appl. Econ. 22(2), 265–312. doi:10.1002/jae.951
Pesaran, M. H. (2021). General diagnostic tests for cross-sectional dependence in panels. Empir. Econ. 60 (1), 13–50. doi:10.1007/s00181-020-01875-7
Rickwood, P., Glazebrook, G., and Searle, G. (2008). Urban structure and energy—a review. Urban Policy Res. 26 (1), 57–81. doi:10.1080/08111140701629886
Saidi, K., and Hammami, S. (2015). The impact of energy consumption and CO2 emissions on economic growth: fresh evidence from dynamic simultaneous-equations models. Sustain. Cities Soc. 14, 178–186. doi:10.1016/J.SCS.2014.05.004
Seto, K. C., Golden, J. S., Alberti, M., and Turner, B. L. (2017). Sustainability in an urbanizing planet. Proc. Natl. Acad. Sci. 114 (34), 8935–8938. doi:10.1073/pnas.1606037114
Tan, Y., Qamruzzaman, M., and Karim, S. (2023). An investigation of financial openness, trade openness, gross capital formation, urbanization, financial development, education and energy nexus in BRI: evidence from the symmetric and asymmetric framework. Plos One 18 (12), e0290121. doi:10.1371/journal.pone.0290121
Tsaurai, K. (2021). Macroeconomic determinants of energy consumption in BRICS (Brazil, Russia, India, China, South Africa). Int. J. Econ. and Bus. Adm. (IJEBA) 9 (2), 405–423. doi:10.35808/IJEBA/711
Ullah, A., Kui, Z., Pinglu, C., and Sheraz, M. (2022). Effect of financial development, foreign direct investment, globalization, and urbanization on energy consumption: empirical evidence from Belt and Road initiative partner countries. Front. Environ. Sci. 10, 937834. doi:10.3389/fenvs.2022.937834
Yang, X., Wang, Y., Sun, M., Wang, R., and Zheng, P. (2018). Exploring the environmental pressures in urban sectors: an energy-water-carbon nexus perspective. Appl. Energy 228, 2298–2307. doi:10.1016/j.apenergy.2018.07.090
Yang, Y., Liu, J., Lin, Y., and Li, Q. (2019). The impact of urbanization on China’s residential energy consumption. Struct. Change Econ. Dyn. 49, 170–182. doi:10.1016/j.strueco.2018.09.002
Yu, K., Lu, Z., and Stander, J. (2003). Quantile regression: applications and current research areas. J. R. Stat. Soc. Ser. D Statistician 52(3), 331–350. doi:10.1111/1467-9884.00363
Keywords: Bayesian structural time series, causal impact, economic growth, energy sustainability, infrastructure, panel quantile regression
Citation: Omar AB, Zeng G and Salykova LN (2025) Evaluating energy sustainability and causal impact of belt and road initiatives (BRI) in energy-deficient Asian countries. Front. Energy Res. 13:1513569. doi: 10.3389/fenrg.2025.1513569
Received: 25 October 2024; Accepted: 16 May 2025;
Published: 17 June 2025.
Edited by:
Solomon Giwa, Olabisi Onabanjo University, NigeriaReviewed by:
Hong-Dian Jiang, China University of Geosciences, ChinaBożena Gajdzik, Silesian University of Technology, Poland
Copyright © 2025 Omar, Zeng and Salykova. This is an open-access article distributed under the terms of the Creative Commons Attribution License (CC BY). The use, distribution or reproduction in other forums is permitted, provided the original author(s) and the copyright owner(s) are credited and that the original publication in this journal is cited, in accordance with accepted academic practice. No use, distribution or reproduction is permitted which does not comply with these terms.
*Correspondence: Abdullah Bin Omar, YWJkdWxsYWgub21hckBldW0uZWR1LnBr
†ORCID: Abdullah Bin Omar, orcid.org/0000-0001-6320-4295; Gang Zeng, orcid.org/0000-0003-3788-7832; Leila N. Salykova, orcid.org/0000-0003-0766-4363