 Michael Lehning
 Jérôme Dujardin
 Albin Cintas
- 1CRYOS, School of Architecture, Civil and Environmental Engineering, EPFL Alpole, Sion, Switzerland
- 2WSL Institute for Snow and Avalanche Research SLF, Davos, Switzerland
As many societies transition to renewable wind and solar energy, the challenge of managing the high volatility of these generators becomes increasingly important. Given the spatiotemporal variability of weather—and thus energy production—the optimal placement of new installations can be determined based on average weather (or climate) patterns to enhance demand matching within a grid environment. At the same time, as weather forecasts improve in accuracy, it becomes increasingly feasible to predict wind and solar production in advance, offering valuable planning insights for both electricity consumers and producers within a specific market. This study uses a hypothetical 2050 Swiss electricity system, in which demand is predominantly met by existing hydropower alongside wind and solar PV systems, to demonstrate the value of integrating weather forecasts into system-wide dispatchable hydropower operations. By constructing a scenario in which the upcoming weather conditions are unknown and comparing it to one with a perfect weekly forecast, we use the OREES optimal power flow model to show that weather knowledge significantly reduces the need for electricity imports. The incorporation of weather forecasts results in a 36% reduction in electricity import costs and contributes to a more stable and less volatile grid operation, with reduced energy transfers even at the regional level.
1 Introduction
The global share of renewable energy production, wind and solar energy generation in particular, is experiencing a nonlinear growth rate (IEA, 2024). The combination of wind and solar generation has been shown to be beneficial for existing grid and storage infrastructures, significantly reducing supply volatility compared to the operation of either source independently (Weschenfelder et al., 2020; Dujardin et al., 2017). Moreover, studies have highlighted the benefits of the anti-correlation between solar and wind power generation, contributing to a more stable renewable energy supply and improved grid stability (Scala et al., 2019; Surmonte et al., 2021). In many regions, wind power peaks at night or in winter, whereas solar power is concentrated during the daytime and in summer. This combined integration is particularly advantageous for reducing fluctuations in renewable electricity supply. However, day-to-day production volatility persists and must be managed through storage systems such as pumped-storage plants (Lustfeld, 2022). Individual energy producers are increasingly using short-term weather and production forecasts to manage their wind, solar, and hydro assets (Vennila et al., 2022). However, system-wide management is typically not implemented. Peterssen et al. (2024) estimated the upper bound of a perfect annual forecast’s value by comparing the results from a linear optimization model with those from a priority dispatch list on a simplified German grid. Another study by Rasku et al. (2020) on the Nordic power system compared the impact of increasing the forecast horizon from 36 h to 15 days, but only focused on hydro-thermal scheduling. Using the case of a future hypothetical national electricity grid with a high penetration of wind, solar, and hydropower generation, we show the benefits of integrating weather forecasts into overall system operations. This results in an economic advantage, for example, a reduction in the overall cost of electricity generation. Specifically, we integrate weather forecasts into an optimized procedure for operating hydro dams and demonstrate their impact on the national electricity grid’s trade value. In Switzerland, hydropower is the primary technology for managing electricity production and storage, with 37.1 TWh produced in 2023, accounting for 61.5% of domestic consumption. Of this, 47.2% is derived from reservoir-based plants, while approximately 4.2% is from pumped-storage power plants—both of which are dispatchable sources (SFOE, 2023b). As Switzerland plans to phase out nuclear energy by 2050 (SFOE, 2023a), it will become increasingly dependent not only on hydropower but also on decentralized renewable energy sources, particularly solar and wind (Díaz Redondo and Van Vliet, 2015). High-resolution and accurate forecasts are essential to predict the energy demand and potential production from these renewable energy plants.
2 Methods
We use the OREES model (Dujardin et al., 2021), which optimizes the future placement of wind and solar power generators, taking into account Switzerland’s existing hydropower infrastructure, based on user-defined criteria. The model is a two-step optimization process that uses an evolutionary strategy to determine the optimal locations for wind and solar installations, based on known weather patterns and the economic value of these installations as the optimization target. In a separate step, the model solves the power flow for the given infrastructure and generators. In this second step, reservoir operations are adjusted to maintain a realistic seasonal filling level while aiming to stabilize imports and exports, ensuring that electricity demand is met and grid constraints are satisfied. It is important to note that the model could also be configured to strictly minimize imports, which would result in a higher number of wind installations. This variant is not explored further here. For this work, OREES uses the same setup as in scenario R45 from the study by Van Liedekerke et al. (2024), which involved the generation of 45 TWh from PV panels, wind turbines, and biomass. This scenario is set to represent the year 2050 in Europe, with an expected demand structure in Switzerland (76 TWh), run-of-river hydropower generation (17 TWh), and net transfer capacities with neighboring countries (14 GW), as outlined in the ENTSO-e Ten-Year Network Development Plan (TYNDP), which outlines projections for the future energy system across ENTSO-e member countries (ENTSO, 2022). For solar, wind, and hydropower production, we use historical weather data from 2018. New solar and wind power installations are optimally located to maximize their net income.
When applied to the R45 scenario with perfect 7-day-ahead forecasts for weather, load, and renewable energy generation, OREES provides two primary outputs. The first output is the optimal placement of renewable resources to meet the 45 TWh production requirement. The second is the energy dispatch for this placement, specifically the operation of storage and pumped-storage hydropower, along with electricity imports and exports.
This forms the basis for our sensitivity analysis, which includes two scenarios: 1) the base scenario, in which we use the energy dispatch from the R45 scenario (corresponding to the second model output). 2) In the blind scenario, information about the coming week is arbitrarily replaced by a repetition of the previous 24 h, since persistence is often used as a benchmark in assessing weather forecast accuracy. Specifically, at each simulation time step, the predicted load and solar and wind generation for the next 7 days are constructed by repeating the time series of the previous 24 h 7 times. Thus, the optimal placement (first output) remains unchanged, while the power flow module of OREES is rerun to optimize the hydropower operation under the persistent forecast procedure. This approach results in a different dispatch pattern for hydropower and electricity imports/exports. The exact process for defining these scenarios is described in Figure 1.
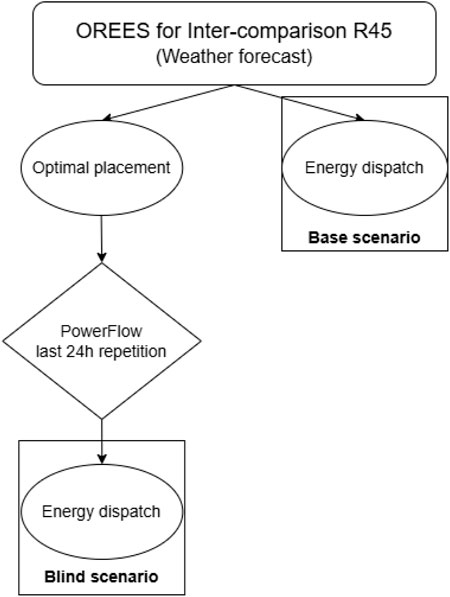
Figure 1. Flowchart of scenario definitions.
It is important to note that the optimization is conducted holistically at the national grid level. This optimization would not happen in practice, as individual companies aim to maximize their income, and flexibility is limited by long-term energy delivery contracts at fixed prices. Nonetheless, it is useful to examine this effect, as it assigns an economic value to the optimization of dispatchable resources when incorporating forecasts of non-dispatchable renewable energy sources.
3 Results
3.1 Optimized siting of new renewable installations
We analyze the optimal combination of “new renewables” with Switzerland’s existing hydropower infrastructure as an example. Switzerland possesses abundant hydropower resources and substantial capacity from reservoir, run-of-river, and pumped-storage installations. Figure 2 shows the spatial outcome for the optimal placement of wind and solar installations across the Swiss landscape in the base scenario, i.e., when the objective is to maximize productivity and net income. In this scenario, wind installations total 12.1 GW peak capacity and are located along the Jura mountain range and in selected Alpine locations, while solar installations reach 16.1 GW peak capacity and are more broadly distributed throughout the country in mid- and high-altitude areas that benefit from increased solar radiation. Figure 2 shows the transmission grid used for this optimization.
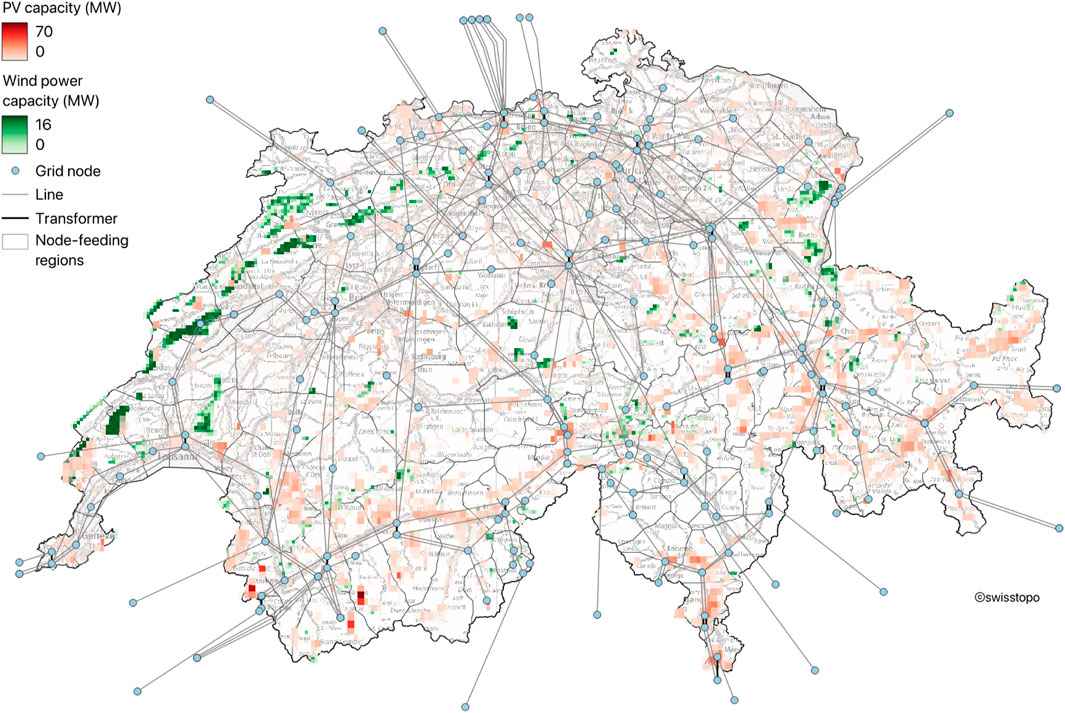
Figure 2. Spatial location of PV and wind power installations across Switzerland.
3.2 The value of weather forecasts
The optimal placement and power flow solutions were obtained by assuming known weather patterns. We are able to artificially discard this assumption solely for the power flow calculation, leading to the blind scenario described in Section 2. Figure 3 shows the magnitude of electricity imports for the base and blind scenarios. Total imports increase from 10.4 to 13.8 TWh when persistence is assumed. Consequently, the associated cost of electricity imports increases from 1.25 to 1.70 billion CHF. More importantly, Figures 3 and 4 show that the system becomes less balanced overall, especially in winter, leading to increased electricity imports at certain times. Figure 3 shows that the interquartile range in the blind scenario is significantly larger than in the base scenario, indicating that high import levels are frequently required with greater variability in imports. Figure 4 confirms that the distribution of import occurrences exceeding 5000 MW is significantly more frequent in the blind scenario, while large imports are not required in the base scenario. This behavior is due to better hydropower management when weather forecasts are available, as reserves can be maintained in anticipation of challenging periods. This phenomenon is most pronounced in winter, when electricity demand is higher and hydroelectric reserves are lower. In practice, the blind scenario leads to nearly full utilization of the border transfer capacity at certain times, reducing the transfer capacity through Switzerland for the trading between its neighboring countries. This is common but not considered a constraint in this simulation. Furthermore, grid stability is impacted by these extreme and sporadic events, which may cause damage to the grid infrastructure.
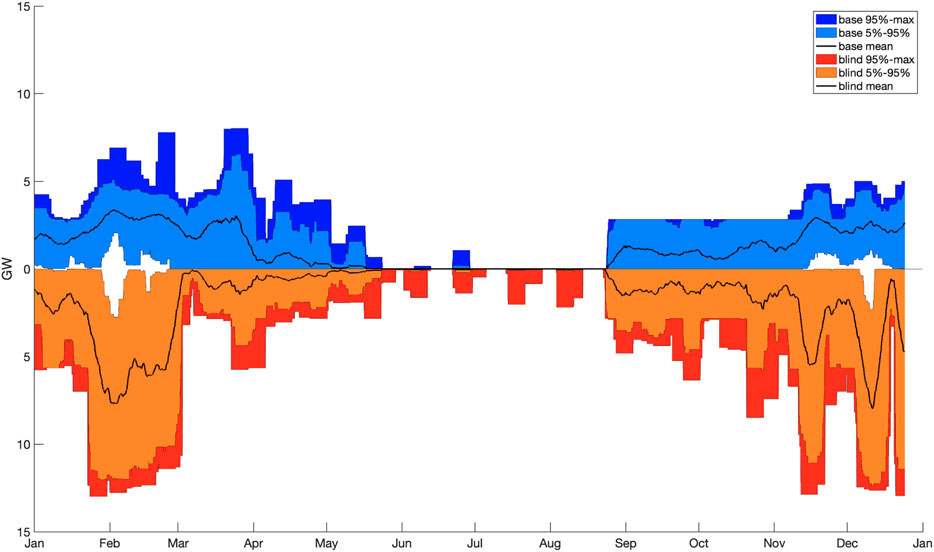
Figure 3. Import time series in the base scenario (blue) and the blind scenario (red).
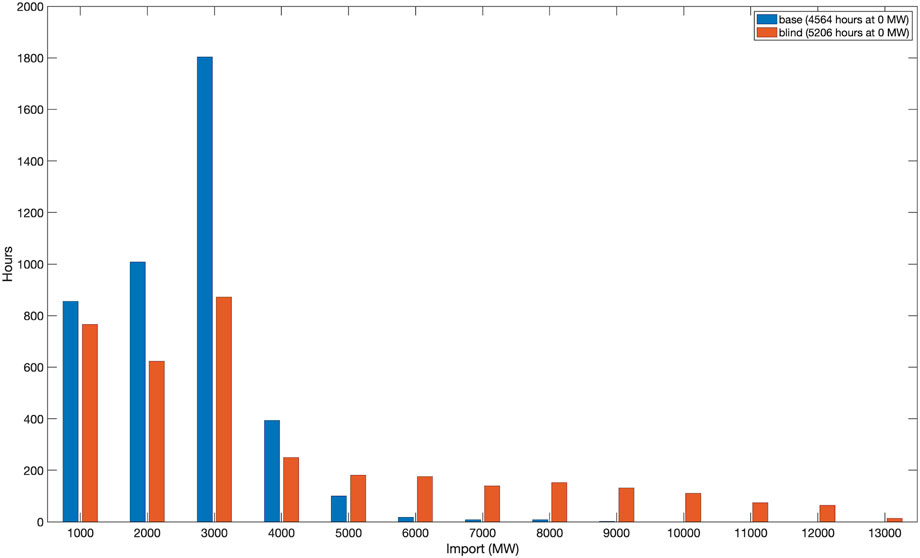
Figure 4. Import distribution showing the required import volumes and their corresponding durations in the two scenarios.
3.3 Regional analysis
With the shift toward renewable energy generation, local-to-regional demand–supply matching becomes increasingly important, especially if grid expansion is to be minimized. Switzerland has three dominant landscape types, each with differing supply–demand relationship potentials. The landscape types and their significance in terms of decentralized energy considerations are discussed in detail by Wen et al. (2024). The Alps and the Jura, for example, have high renewable energy production potential but generally low consumption, whereas urban centers in the Midlands have significantly higher demand but, in general, less access to wind and solar resources. The agricultural midlands of the Swiss Midlands lie somewhere in between. Figure 5a shows the seasonal energy transfers between the landscape units of the Alps, Jura, and Midlands, each categorized into urban, periurban, and rural regions (Wen et al., 2024). Although the Alps and the Jura regions exhibit overproduction potential for rural and periurban areas (Figure 5), the Midlands experience energy deficits across all landscape types in both summer and winter. Figure 5b shows the same energy transfers between landscape units when weather forecasts are not considered. The main difference is observed in the Alps, where the majority of energy production is sourced from hydropower. In fact, the rural areas of the Alps produce more electricity because they host the majority of hydropower plants and benefit from improved hydropower management when weather forecasts are available. The right panels of Figure 5 that the increase in import for the blind scenario reaches a significant size when compared to the electricity balancing within the country. We understand in this analysis that the balancing originally made by hydropower in the Alps to provide electricity in demanding urban areas cannot be anticipated when weather forecast is not known, leading to high import events for the high demand periods, mostly in winter.

Figure 5. Transfer of electricity between landscape units. (a) Electricity balancing under the base scenario. (b) Electricity balancing under the blind scenario.
4 Discussion
In a future renewable energy system, our analysis demonstrates how the joint spatial distribution of wind and solar PV generators can be optimized to achieve stable demand–supply matching while maximizing revenue within the existing grid infrastructure. This system benefits from forecasting the weather accurately in advance. In the blind scenario, we simulate a situation in which the weather forecasts are unavailable in advance. Using Switzerland as an example, which has abundant hydropower facilities that assist in demand–supply matching, we show that the required imports would increase by 32.7%, with high import demands occurring more frequently. There are economic consequences as a result of the more imbalanced system. We calculate that the total cost of importing electricity will increase by 36% per year. We acknowledge that these numbers cannot be generalized to other weather years or countries with different energy systems. However, these results demonstrate that the day-to-day operation of dispatchable generators, such as hydropower, benefits substantially from having weather forecasts in advance. By analyzing the energy transfer between Switzerland’s dominant landscape types, we show that the base scenario requires a significant energy transfer from the Jura and Alpine regions to the Midlands, particularly to the cities. This is due to the fact that the most productive locations are chosen for the whole of Switzerland. In principle, when considering wind installations and, for example, agri-PV, the Midlands could produce sufficient energy on its own, at least in the summer, but less efficiently than in the mountains. It is also clear that urban centers will rely on importing energy from their surrounding areas if the system is optimized according to our productivity criteria. However, without weather forecasting, rural areas would experience higher deficits, leading to increased imports from neighboring countries to meet the demands of urban centers. This study is based on a strong assumption: a nationwide optimization primarily based on production potential. Although accessibility, land use, and land protection have been considered, many of the locations chosen by the model may face restrictions not considered in this study. Furthermore, the implementation of installations will depend on local population acceptance, investor interest, and technical feasibility. For example, our approach does not differentiate between different types of PV installations—from rooftop to high-Alpine systems—which may have differing subsidies and incentives, including personal preferences. Furthermore, the combination of wind and solar resources is highly specific to a given climate, and as such, our results cannot be quantitatively transferred to other regions. Nonetheless, this study demonstrates how weather forecasts can support the optimized operation of a given mix of renewable generators at both national and regional levels, leading to improved economic outcomes and a more balanced energy system.
Data availability statement
The raw data supporting the conclusions of this article will be made available by the authors without undue reservation.
Author contributions
ML: Conceptualization, funding acquisition, investigation, methodology, supervision, writing – original draft, writing – review and editing. JD: Conceptualization, data curation, investigation, methodology, software, visualization, writing – original draft, writing – review and editing. AC: Investigation, methodology, software, writing – original draft, writing – review and editing.
Funding
The author(s) declare that financial support was received for the research and/or publication of this article. Open access funding was provided by the Swiss Federal Institute for Forest, Snow and Landscape Research (WSL).
Acknowledgments
The research published in this report was carried out with the support of the Swiss Federal Office of Energy SFOE as part of the SWEET consortium EDGE. The authors bear sole responsibility for the conclusions and results. We further acknowledge important collaboration within the EDGE consortium in particular with ETHZ (Ambra van Liederkerke), ZHAW (Regina Betz) and University of Bern (Jonas Schmid). The scenarios for 2050 have been defined across the whole EDGE consortium based on the earlier CROSS effort. The authors are also part of the SPEED2ZERO, and UrbanTwin consortia, Joint Initiatives co-financed by the ETH Board.
Conflict of interest
The authors declare that the research was conducted in the absence of any commercial or financial relationships that could be construed as a potential conflict of interest.
The author(s) declared that they were an editorial board member of Frontiers at the time of submission. This had no impact on the peer review process and the final decision.
Generative AI statement
The author(s) declare that no Gen AI was used in the creation of this manuscript.
Publisher’s note
All claims expressed in this article are solely those of the authors and do not necessarily represent those of their affiliated organizations, or those of the publisher, the editors and the reviewers. Any product that may be evaluated in this article, or claim that may be made by its manufacturer, is not guaranteed or endorsed by the publisher.
References
Díaz Redondo, P., and Van Vliet, O. (2015). Modelling the energy future of Switzerland after the phase out of nuclear power plants. Energy Procedia 76, 49–58. doi:10.1016/j.egypro.2015.07.843
Dujardin, J., Kahl, A., Kruyt, B., Bartlett, S., and Lehning, M. (2017). Interplay between photovoltaic, wind energy and storage hydropower in a fully renewable Switzerland. Energy 135, 513–525. doi:10.1016/j.energy.2017.06.092
Dujardin, J., Kahl, A., and Lehning, M. (2021). Synergistic optimization of renewable energy installations through evolution strategy. Environ. Res. Lett. 16, 064016. doi:10.1088/1748-9326/abfc75
ENTSO (2022). TYNDP 2022 scenario report, version. April 2022. Tech. Rep. Available online at: https://2022.entsos-tyndp-scenarios.eu/.
IEA (2024). Enewables 2023 – analysis. Tech. Rep. Available online at: https://www.iea.org/reports/renewables-2023.
Lustfeld, H. (2022). Energy supply based on wind-solar power in Germany. Discov. Energy 2, 2. doi:10.1007/s43937-022-00007-9
Peterssen, F., Schlemminger, M., Lohr, C., Niepelt, R., Hanke-Rauschenbach, R., and Brendel, R. (2024). Impact of forecasting on energy system optimization. Adv. Appl. Energy 15, 100181. doi:10.1016/j.adapen.2024.100181
Rasku, T., Miettinen, J., Rinne, E., and Kiviluoma, J. (2020). Impact of 15-day energy forecasts on the hydro-thermal scheduling of a future Nordic power system. Energy 192, 116668. doi:10.1016/j.energy.2019.116668
Scala, A., Facchini, A., Perna, U., and Basosi, R. (2019). Portfolio analysis and geographical allocation of renewable sources: a stochastic approach. Energy Policy 125, 154–159. doi:10.1016/j.enpol.2018.10.034
SFOE (2023a). Energy Strategy. Available online at: https://www.bfe.admin.ch/bfe/en/home/politik/energiestrategie-2050.html.
SFOE (2023b). Hydropower. Available online at: https://www.bfe.admin.ch/bfe/en/home/versorgung/erneuerbare-energien/wasserkraft.html.
Surmonte, F., Perna, U., Scala, A., Rubino, A., and Facchini, A. (2021). A data-driven approach to renewable energy source planning at regional level. Energy Sources, Part B Econ. Plan. Policy 16, 1064–1075. doi:10.1080/15567249.2021.1926598
Van Liedekerke, A., Gjorgiev, B., Savelsberg, J., Wen, X., Dujardin, J., Darudi, A., et al. (2024). Policy-relevance of a model inter-comparison: Switzerland in the european energy transition. Appl. Energy. doi:10.1016/j.apenergy.2025.125906
Vennila, C., Titus, A., Sudha, T. S., Sreenivasulu, U., Reddy, N. P. R., Jamal, K., et al. (2022). Forecasting solar energy production using machine learning. Int. J. Photoenergy 2022, 1–7. doi:10.1155/2022/7797488
Wen, X., Gonzalez Contreras, J., Stadelmann-Steffen, I., Sasse, J.-P., and Trutnevyte, E. (2024). High sensitivity to methodological choices when integrating social acceptance data in electricity system modeling. Technol. Forecast. Soc. Change. doi:10.2139/ssrn.5027456
Keywords: decentralized energy, load balancing, electricity import, grid constraints, hydropower, Switzerland, OREES model
Citation: Lehning M, Dujardin J and Cintas A (2025) The value of weather forecasts for optimally placed wind and solar electricity generators. Front. Energy Res. 13:1533778. doi: 10.3389/fenrg.2025.1533778
Received: 24 November 2024; Accepted: 31 March 2025;
Published: 02 May 2025.
Edited by:
Monjur Mourshed, Cardiff University, United KingdomReviewed by:
Antonio Scala, National Research Council (CNR), ItalyAliashim Albani, University of Malaysia Terengganu, Malaysia
Copyright © 2025 Lehning, Dujardin and Cintas. This is an open-access article distributed under the terms of the Creative Commons Attribution License (CC BY). The use, distribution or reproduction in other forums is permitted, provided the original author(s) and the copyright owner(s) are credited and that the original publication in this journal is cited, in accordance with accepted academic practice. No use, distribution or reproduction is permitted which does not comply with these terms.
*Correspondence: Michael Lehning, bWljaGFlbC5sZWhuaW5nQGVwZmwuY2g=