 Hu Shouchao
 Li Dong
 Chang Zengliang
 Tong Hongju
 Gao Xingguo
 Cao Qian
- Shandong Electirc Power Engineering Consulting Institute Corp. Ltd., Jinan, China
Introduction: With the acceleration of urbanization and the continuous growth in energy demand, distributed photovoltaic (PV) systems have attracted increasing attention as a sustainable energy solution. In practical deployment, the 3-D structure of buildings significantly affects their photovoltaic potential.
Methods: To more comprehensively assess the underlying mechanism, this study employs ENVI-met to conduct daily-scale solar irradiance simulations on seven building models across three typical urban block types. The 3-D characteristics of buildings are characterized from two perspectives: urban block type and three-dimensional structural parameters. The analysis covers four radiation components: total radiation, direct radiation, diffuse radiation, and reflected radiation. To enhance the real-world applicability of the study, LiDAR-derived real 3-D building models are introduced, and surface radiation distributions are simulated for the full year as well as for typical solar terms (Summer Solstice, Winter Solstice, and Spring/Autumn Equinox).
Results: Daily-scale simulation results indicate significant differences in photovoltaic potential among different building layouts. Central-type blocks exhibit the most favorable irradiance performance under conditions of moderate building height, appropriate spacing, and balanced Sky View Factor; vertical-type blocks rank second; while hybrid-type blocks, despite having higher rooftop area ratios and coverage ratios, suffer from severe shading effects due to staggered building heights, resulting in the lowest photovoltaic potential. Full-year scale simulation results using LiDAR-derived real 3-D building models show strong consistency with the daily-scale models in identifying optimal building types, verifying the consistency of the influence mechanism of building structures on photovoltaic potential across different temporal scales.
Discussion: The results confirm that, even when accounting for environmental obstructions such as vegetation, central-type structures retain a stable advantage in solar energy generation. This study provides both theoretical support and practical guidance for the scientific deployment of urban photovoltaic systems.
1 Introduction
Photovoltaic energy has gained significant attention due to its wide application range, mature technology and relatively low cost (Guen et al., 2018). Installing rooftop photovoltaic systems in urban areas can utilize existing building structures without requiring additional land, thereby reducing material consumption (Allegrini et al., 2015). This approach has shown great potential in mitigating energy issues within high-density urban environments (Gassar and Cha 2021; Martinopoulos 2020). Distributed rooftop photovoltaic systems on urban buildings are the most widely applied form of photovoltaic energy generation (Freitas et al., 2015; Debbarma et al., 2017), building structure and layout directly influence the reception of solar radiation by photovoltaic systems (Amado and Poggi 2014; Li et al., 2022). Therefore, studying the impact of different building structures on photovoltaic potential in urban areas is essential to optimizing building design for maximum photovoltaic energy efficiency (Zhang et al., 2019; Han et al., 2022; Shi et al., 2021; Sarralde et al., 2015), thus providing scientific guidance for urban energy planning.
Studies on photovoltaic energy applications in urban areas vary in focus and approach (Khan et al., 2023; Mokhtara et al., 2021; Ordóñez et al., 2010; Akpolat et al., 2019; Dehwah et al., 2020; Kutlu et al., 2022). Large-scale studies often assess photovoltaic potential by analyzing factors like building orientation and rooftop area. Wiginton et al. (2010) calculated the usable photovoltaic area on rooftops using coefficient-based methods, considering building orientation’s effect on available photovoltaic area, though this method may not accurately reflect real usable rooftop area. With advancements in deep learning, many studies have utilized image recognition technology to extract rooftop photovoltaic potential. Mohajeri et al.(2018) combined Support Vector Machine (SVM) and Geographic Information System (GIS) to model solar potential on rooftops at various scales, enabling automatic extraction of rooftop types. Assouline et al. (2018) further enhanced this approach by using building characteristics as input variables in a random forest algorithm to evaluate photovoltaic potential with higher spatial resolution. Huang et al. (2019) used U-Net to identify usable rooftop photovoltaic area in satellite images and calculated rooftop photovoltaic potential in Wuhan based on meteorological data. Remote sensing images are often influenced by lighting conditions and shadow effects, leading to a growing interest in 3-D change detection (Mahaya et al., 2022; Brito et al., 2019). LiDAR point cloud data has become a common method for reconstructing building structures for photovoltaic potential calculations (Ramachandra et al., 2011), as it provides a 3-D view of urban landscapes. Gagnon et al. (2018) integrated GIS and LiDAR datasets with regression statistics to estimate rooftop photovoltaic potential across the United States. These methods, relying on extensive regional data, may overlook building details, resulting in discrepancies between calculated photovoltaic potential and real data, thus limiting their support for distributed photovoltaic system planning. Consequently, a series of studies have emerged focusing on building-scale photovoltaic potential analysis, taking into account building layout elements within urban areas (Martín-Jiménez et al., 2020). Chatzipoulka et al. (2016) used morphological parameters to simulate surface and facade solar radiation in real urban blocks. Martins et al. (2016) analyzed the influence of several morphological parameters, such as building density and aspect ratio, on the available solar radiation on buildings. Lobaccaro et al. (2017) studied the facade and height-to-width ratio of 45 urban blocks and proposed optimized urban block design examples. Kaleshwarwar, (2023) analyzed the photovoltaic potential of five morphological parameters across five urban block forms using local climate data. Although these studies perform parameterized photovoltaic potential analysis based on urban or block-scale building models, they lack in-depth exploration of solar transmission mechanisms and photovoltaic potential distribution principles (Belbedj et al., 2023). As a result, they face limitations in application and model adaptability to real urban building forms.
Common software tools for simulating irradiance on building surfaces (Dondariya et al., 2018) include Solar photovoltaic System, EnergyPlus, and ArcGIS Pro’s solar radiation module, generally exhibit low accuracy in modeling reflected radiation on building surfaces. In contrast, ENVI-met (Tsoka et al., 2018), the software used in this study, is a microclimate simulation tool with extensive applications in dense urban environments (Gusson and Duarte 2016), primarily due to its significant advantages in simulating radiation fields within complex urban contexts. ENVI-met can accurately simulate shortwave and longwave radiation exchanges on building surfaces, and it is particularly effective at accounting for mutual shading between buildings in high-density settings. Furthermore, ENVI-met is capable of simultaneously computing direct, diffuse, and reflected radiation, and can precisely model reflected radiation on building surfaces, which is critical for assessing urban photovoltaic potential. Dalong et al. (2019) compared several urban climate simulation tools and found that, relative to others, RayMan provides limited radiation parameters, SOLWEIG produces higher errors, and both EnergyPlus and ArcGIS Pro lack sufficient accuracy when dealing with complex building-scale radiation simulations. Among these, ENVI-met showed the highest consistency with measured data for urban radiation simulations. Therefore, ENVI-met is considered an ideal tool for evaluating photovoltaic potential and radiation fields in complex urban environments.
In this study, ENVI-met was used to simulate surface irradiance on building models throughout the entire day. Based on the linear relationship between irradiance and photovoltaic potential (Figure 1), the study reveals how the three-dimensional structure of buildings in urban areas influences their photovoltaic generation potential. Building on this foundation, 3-D information of real buildings was extracted from LiDAR data, and simulations of radiation energy were conducted at both annual and seasonal scales. These results serve as cross-validation with the outcomes from the daily-scale simulations.
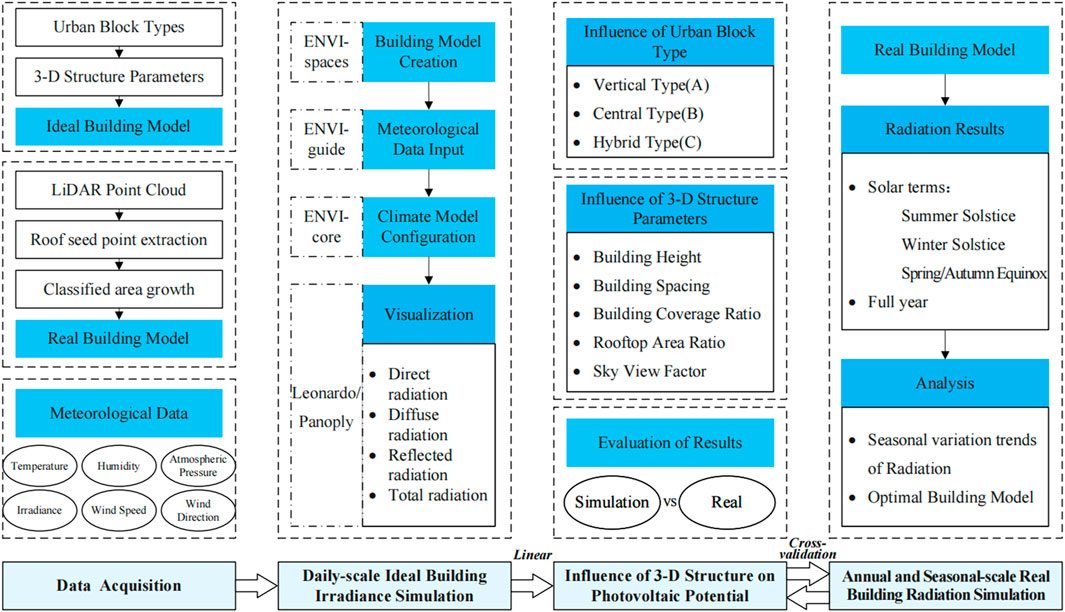
Figure 1. Methodology of the study.
2 Data and methods
2.1 Data
2.1.1 Study area
The study area is located in Gulou District, Nanjing, Jiangsu Province (Figure 2), which lies in a subtropical monsoon climate zone and receives a high annual total solar radiation. With a 100% urbanization rate and a high-density building layout, the district offers ideal conditions for rooftop and facade photovoltaic deployment (Mirkovic and Alawadi 2017). As a core mixed-use commercial and residential area, its continuously growing energy demand, coupled with policy incentives, drives the development of distributed photovoltaic systems (Bensehla, Lazri, and Brito 2021), making it advantageous both in terms of solar resource potential and practical application scenarios.
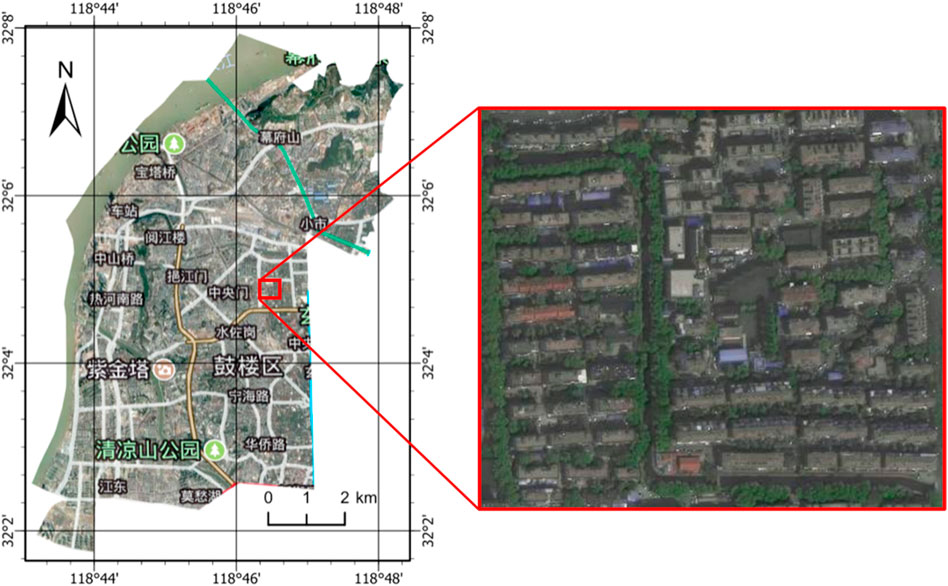
Figure 2. Satellite map of Gulou District, Nanjing (some buildings in the area are shown on the right).
2.1.2 Meteorological data sources
Meteorological data for the study area were obtained from the XiHe Energy Meteorological Big Data platform (www.xihe-energy.com), which provides hourly meteorological data from 1:00 to 23:00 on 1 August 2023, in Gulou District, Nanjing (specific location: 118.77°E, 32.07°N). The platform not only offers key meteorological variables for the study area but also supplies actual ground-level horizontal radiation data, forming a solid basis for validating the subsequent simulation results. To ensure the accuracy of radiation data, the platform employs the Direct Insolation Simulation Code (DISC) model to estimate direct normal irradiance. This model uses the clearness index in conjunction with solar position, extraterrestrial horizontal irradiance, and air mass parameters to convert global horizontal irradiance into direct normal irradiance. Additionally, the platform incorporates a Global Tilted Irradiance (GTI) model, which comprehensively accounts for direct, diffuse, and reflected radiation, enabling precise simulation of irradiance on photovoltaic array surfaces.
2.1.3 Acquisition of LiDAR-Derived real building models
The experimental area (Figure 3) is a multifunctional site with an approximate area of 0.20
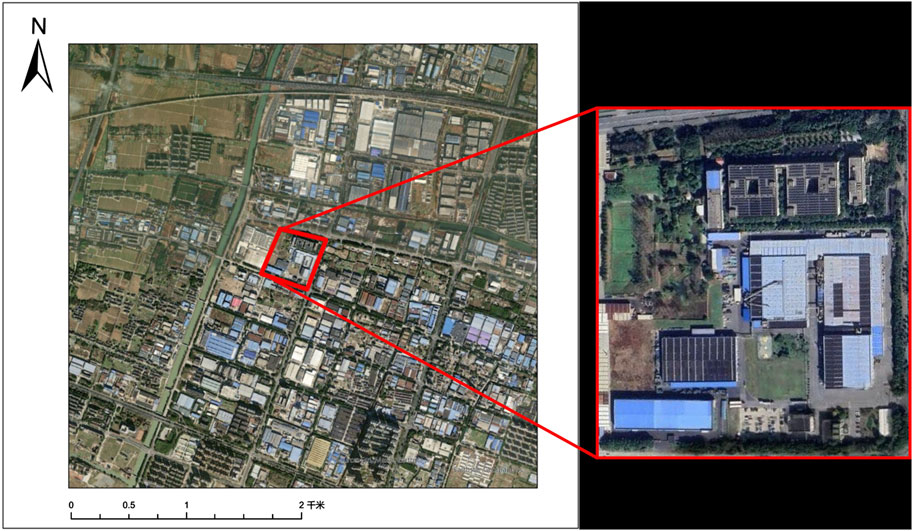
Figure 3. Satellite map of real building models.
2.2 Materials and methods
2.2.1 Building 3-D structure characterization system
The 3-D structure of buildings is characterized from two perspectives: urban block types and three-dimensional structural parameters of the building. Three common urban block types were selected, and seven urban block models were defined accordingly. Based on these models, five three-dimensional structural parameters were defined to refine building model characteristics, thus providing a comprehensive framework for analyzing the influence of building 3-D structural characteristics on photovoltaic potential. In this study, “urban block” is defined as the spatial unit within an urban street layout. The three typical urban block types analyzed are: vertical-type buildings, which consist of independent buildings with a square footprint; central-type buildings, which comprise low-rise buildings around the periphery with high-rise buildings in the center; hybrid-type buildings, which is a combination of buildings of varying heights without enclosed spaces.
These types are examined to assess the impact of building 3-D structure on photovoltaic potential. According to ENVI-met’s parameters, each urban block model is generated in a 10 m × 10 m × 30 m grid (with 10 m spacing representing typical street widths). The height of high-rise buildings is set at 40 m, and low-rise buildings at 20 m, with hybrid-type building heights as illustrated below. All other basic urban planning parameters remain identical to establish a foundation for comparing simulation results under the same planning conditions. The following building three-dimensional structural parameters are defined based on the common urban block types: building height; building spacing, which refers to the parallel distance between buildings; building coverage ratio, representing the percentage of the site area covered by a building; rooftop area ratio, which is the ratio of a building’s roof area to its total surface area; Sky View Factor (calculated from ENVI-met simulations), quantifies the degree of occlusion at a given point on the building surface, based on the ratio of visible sky measured in stereo angles within a specific physical environment.
This is used to characterize the spatial and geometric features of the building. The three-dimensional structural parameters were calculated for each model according to the definitions (Figure 4).
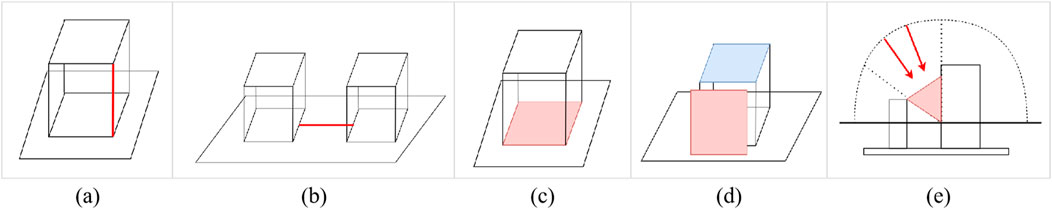
Figure 4. Urban Building three-dimensional structural parameters: (a) Building Height; (b) Building Spacing; (c) Building Coverage Ratio; (d) Rooftop Area Ratio; (e) Sky View Factor.
2.2.2 Calculation principles for building photovoltaic potential
Photovoltaic potential refers to the capacity of a specific area or site to generate electricity using photovoltaic technology, typically expressed as the maximum power output achievable under given conditions. As different photovoltaic technologies vary in conversion efficiency, system design quality also influences the degree to which photovoltaic potential can be realized (Calcabrini et al., 2021; Ebhota and Tabakov 2022; Cristea et al., 2020). In this study, all urban block building models are assumed to use the same photovoltaic components and cover the same total area of photovoltaic modules.
According to the Design Specification for Photovoltaic Power Stations, photovoltaic power for a building can be calculated as follows (Equation 1):
Where
The above formula demonstrates that photovoltaic power is linearly correlated with shortwave solar radiation reaching the ground, allowing the calculation of regional photovoltaic power to be transformed into calculations of shortwave solar radiation reaching the ground. Since the experimental assumptions are based on the same time frame, the linear relationship between photovoltaic power and photovoltaic potential remains consistent throughout the study. Irradiance, a key metric for quantifying radiation, represents the energy received per unit area over time and can assess the solar energy resource richness in a specific area, thus guiding the design and installation of solar energy facilities.
The total radiation received on the ground comprises direct, diffuse, and reflected radiation (Figure 5). Direct radiation is the sunlight reaching the Earth’s surface without atmospheric scattering or absorption, primarily influenced by the solar position and the slope and orientation of the receiving surface. When neighboring objects cast shadows, the target point cannot receive direct solar radiation. Diffuse radiation results from sunlight scattered or deflected by atmospheric particles such as gases, aerosols, or clouds. Different atmospheric conditions significantly affect diffuse radiation. Reflected radiation refers to sunlight reflected off the ground or other surfaces, influenced by the material and 3-D structure of the building.
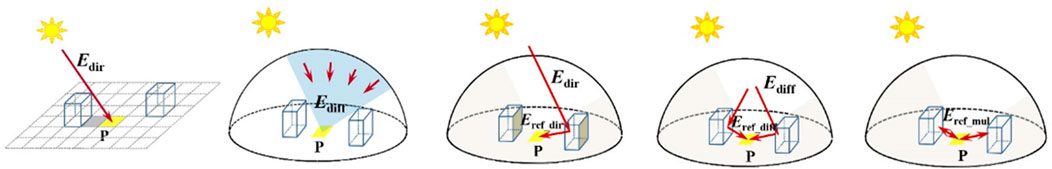
Figure 5. Schematic diagram of solar radiation (Hu et al., 2020) (direct, scattered, and reflected radiation).
This study uses ENVI-met, a microclimate simulation tool capable of modeling the exchange of shortwave and longwave radiation in complex urban environments. Its radiation transmission model utilizes attenuation coefficients between 0 and 1 to account for the obstruction of shortwave and longwave radiation by buildings. Shortwave radiation in space considers the effects of direct, diffuse, and reflected radiation. Irradiance is usually expressed in terms of solar radiant power received per unit area. Radiant intensity represents the density of radiant flux radiated outward by a light source. Both of the above variables are expressed in units of. Based on the built-in 3-D radiation transmission model in ENVI-met, the shortwave irradiance at any point in the study area can be expressed as follows (Equation 2):
Where
2.2.3 Building surface irradiance simulation
This study employed ENVI-met to simulate building surface irradiance, involving four main steps (Figure 6).

Figure 6. Simulation flowchart of ENVI-met.
Building Model Creation: Based on seven building models under three urban block types, the simulation domain is defined by setting the location, dimensions, building layout, height, spacing, and surface materials. Upon completion, 3D visualization adjustments are applied.
Meteorological Data Input: According to meteorological data provided by the XiHe platform (Table 1), atmospheric parameters, surface conditions, and urban parameters for the study area are configured, along with the simulation time and duration.
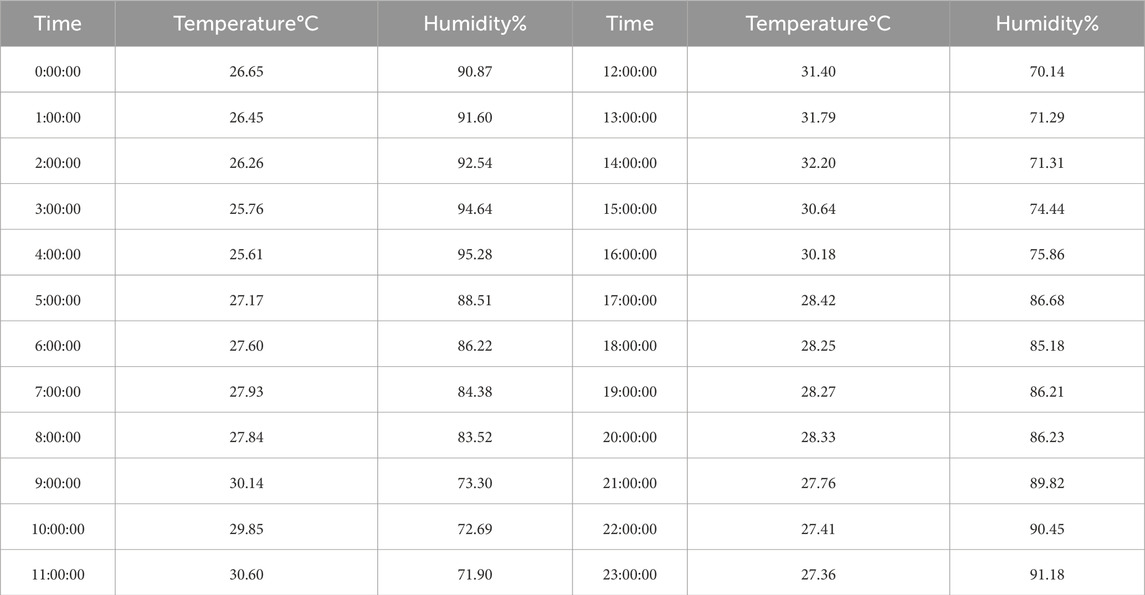
Table 1. Temperature and humidity data.
Climate Model Configuration: Boundary conditions are defined, and the radiation module (MRT) is selected. The six-direction weighted method is used to calculate mean radiant temperature, and the ACRT (Advanced Canopy Radiation Transfer) module is introduced to more accurately simulate the radiation transmission process. In the building module, the indoor temperature is set to 20°C to reflect the difference from the external surface temperature of 28.5°C under air-conditioning control.
Result Visualization: Simulation outputs are visualized and analyzed using Leonardo and Panoply software.
3 Results
3.1 Analysis of simulated irradiance on building surface
Based on the simulation results, this study analyzed direct, diffuse, and reflected radiation (Bianchi et al., 2020) as well as total irradiance, across different times, urban block types, and three-dimensional structural parameters of buildings. To visually compare the variations in irradiance distribution across different building models, 7:00 and 12:00 were selected as representative time points due to their contrasting solar conditions. At 7:00, the low solar altitude leads to extensive shading and increased atmospheric scattering, reducing direct radiation but allowing moderate diffuse radiation—highlighting the effects of morning shadows on photovoltaic potential. At 12:00, the sun is at its highest, minimizing atmospheric loss and maximizing direct radiation, reflecting peak photovoltaic system performance. These two times capture the extremes of diurnal radiation, serve as benchmarks for model validation, and lay the groundwork for analyzing full-day radiation patterns.
Direct radiation reaches the ground directly and is mainly influenced by solar altitude. A comparison of the average direct radiation received by different urban block building models reveals that the differences among models are most pronounced when the sun is at its highest point (Figure 7). In the morning (6:00–9:00), vertical-type buildings receive more radiation due to higher Sky View Factors, and building height is inversely related to radiation intensity at noon. During midday (11:00–13:00), central-type buildings, despite having lower rooftop area ratios, achieve the highest peak value (497 W·m−2) due to their relatively low average building height. In the afternoon (14:00–18:00), hybrid-type buildings—especially model C2—maintain relatively stable radiation levels (Figure 8).
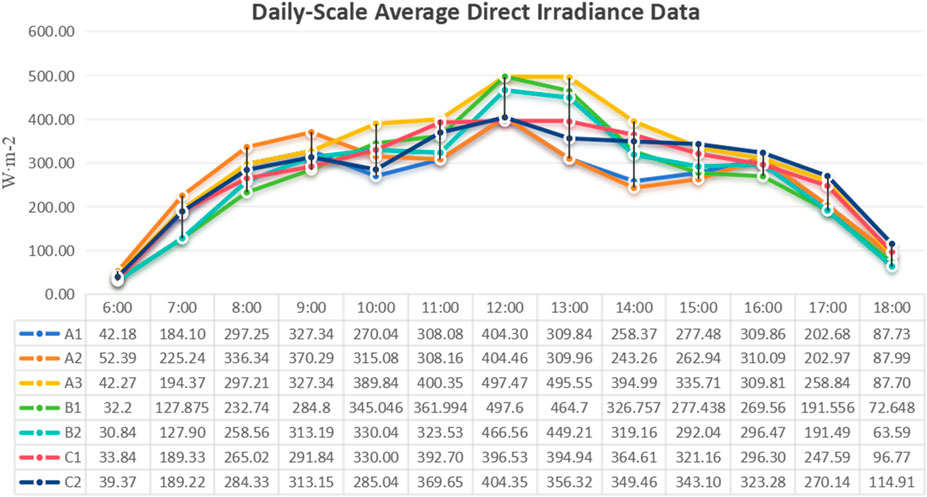
Figure 7. Line graph of daily-scale average direct irradiance data.
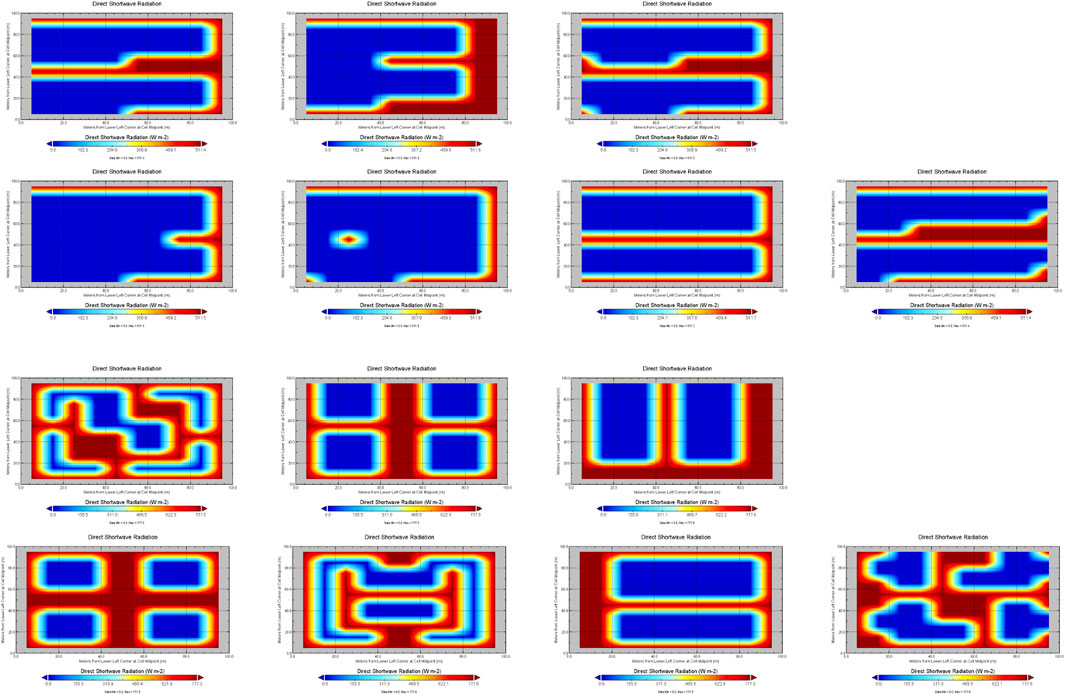
Figure 8. Daily-scale direct irradiance simulation results (the results are arranged as shown in Figure 9, with simulation results at 7:00 and 12:00 arranged from top to bottom respectively).
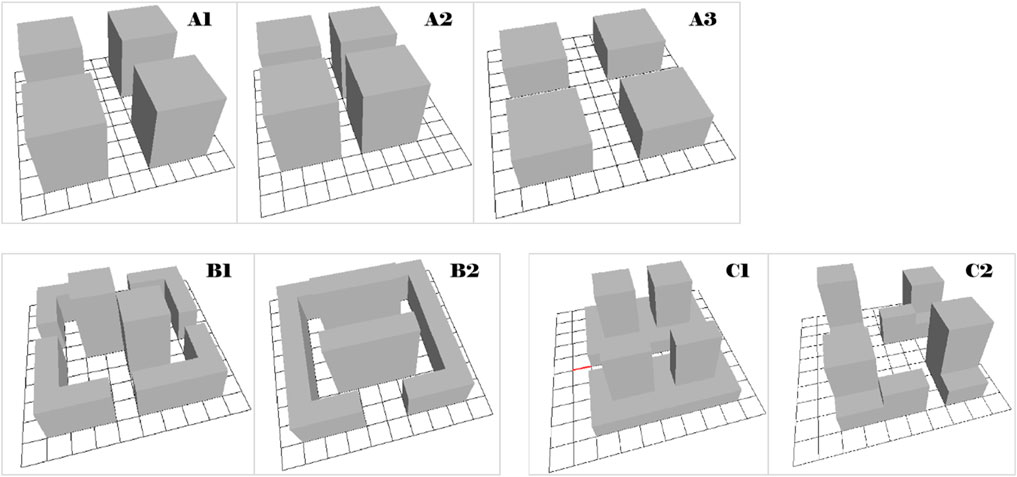
Figure 9. Urban block Type: A (vertical-Type, A1/2/3), B (central-Type, B1/2), C(hybrid-Type, C1/2).
Diffuse radiation is affected primarily by atmospheric moisture, aerosols, atmospheric particulate matter, and the path length of sunlight through the atmosphere. For all building types, diffuse radiation follows a parabolic pattern, peaking between 12:00 and 13:00 as surface solar radiation increases. Vertical-type buildings, particularly model A3, perform best, reaching a maximum of 103.92 W·m−2 at noon. This is followed by the hybrid-type C2 model (96.59 W·m−2), where the mixed building heights create complex surface geometries that enhance the capture of scattered light. In contrast, central-type buildings receive the least diffuse radiation due to their relatively dispersed layout, which reduces opportunities for multiple scattering (Figure 10).
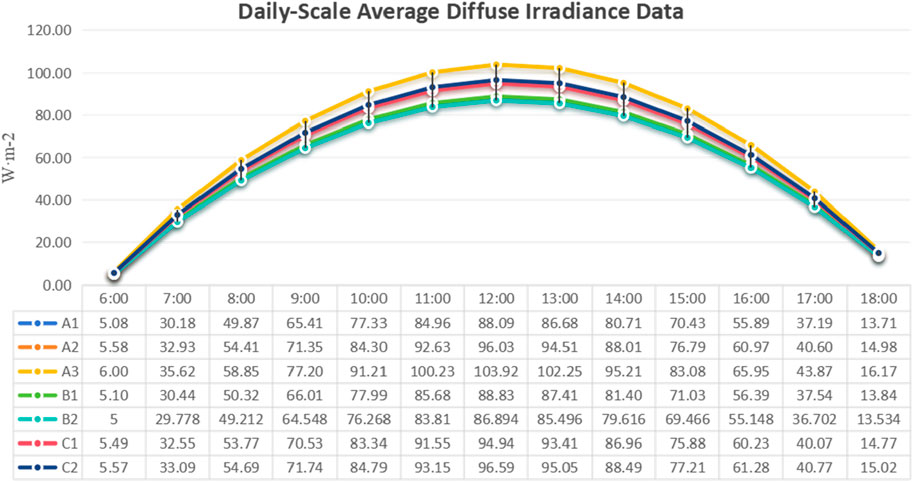
Figure 10. Line graph of daily-scale average diffuse irradiance data.
Reflected radiation is the portion of radiation bounced back from building surfaces, and it correlates positively with the amount of direct radiation received by building surfaces. This form of radiation is primarily influenced by the 3-D structure and material properties of the buildings. The vertical-type A3 model and the hybrid-type C1 model exhibit the highest levels of reflected radiation, attributed to their spatial configurations that facilitate multiple reflections. However, within the same vertical-type category, A1 and A2 show noticeably weaker reflected radiation compared to A3, indicating that even within the same typology, variations in specific 3-D configurations can significantly affect reflective behavior. Central-type buildings perform well between 12:00 and 13:00 but experience a rapid decline in reflected radiation afterward, suggesting that their spatial layout may be less favorable for sustaining reflected solar energy (Figure 11).
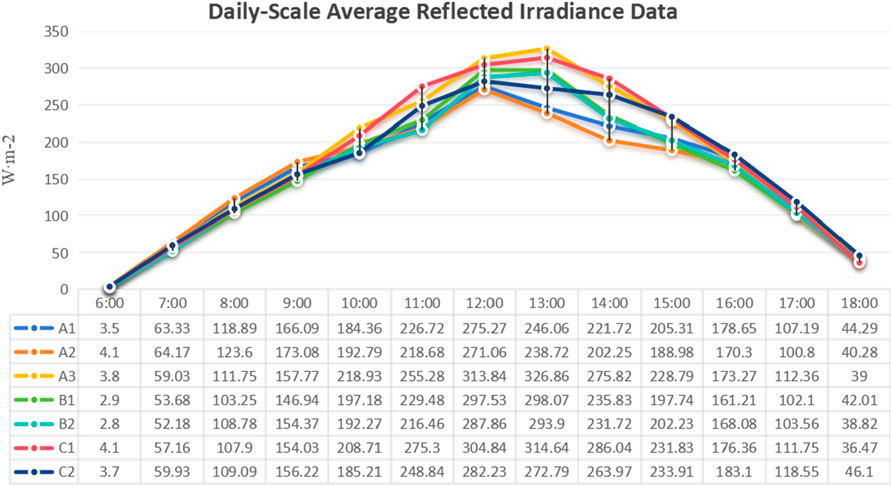
Figure 11. Line graph of daily-scale average reflected irradiance data.
Total radiation received by building surfaces includes direct, diffuse, and reflected radiation. The weighting of each component’s influence on total radiation varies according to region, weather conditions, and other factors (Figure 12). Comparing total radiation at 7:00 and 12:00, due to the dominant role of direct radiation, we observe that the spatial distribution characteristics of radiation remain consistent across both times. Diffuse radiation increases with humidity at 7:00, though its contribution to total radiation remains secondary to direct radiation. Reflected radiation is primarily determined by surface features and environmental conditions and has a relatively minor influence on total radiation (Figure 13).

Figure 12. Line graph of daily-scale average total irradiance data.
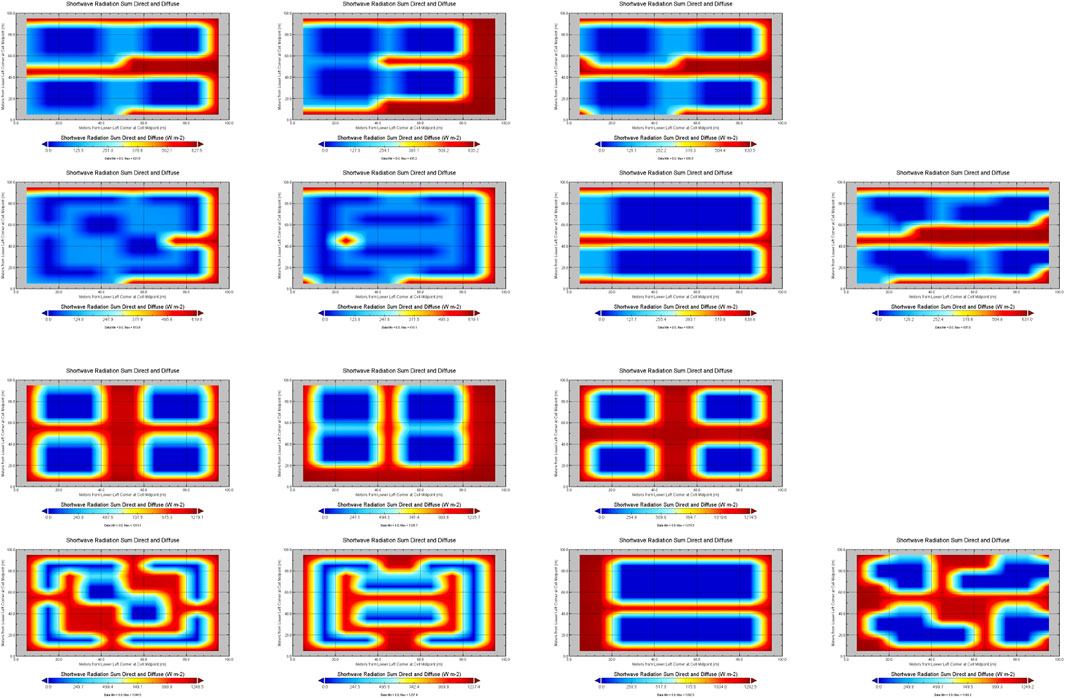
Figure 13. Daily-scale total irradiance simulation results (the results are arranged as shown in Figure 9, with simulation results at 7:00 and 12:00 arranged from top to bottom respectively.).
3.2 Analysis of the influence of 3-D structure on building photovoltaic potential
In this study, the urban block models are assumed to share the same photovoltaic module coverage area and components, making photovoltaic potential linearly related to irradiance on building surfaces.
3.2.1 Influence of urban block types on building photovoltaic potential
By comparing surface irradiance results across the full day, it is evident that central-type buildings demonstrate the highest photovoltaic potential, particularly during peak solar hours. The B1 model reaches a peak irradiance of 736.2–754.56 W·m−2 between 12:00 and 13:00, with the B2 model also showing outstanding performance. These results confirm that although central-type buildings have lower building coverage and rooftop area ratios, their optimized height and spacing configurations reduce shading effects, allowing them to effectively receive radiation during times of maximum solar altitude. Notably, from 11:00 to 14:00, central-type buildings consistently outperform the other types, indicating that their spatial configuration is particularly well-suited to maximizing irradiance during peak sunlight hours.
Vertical-type buildings rank second overall but exhibit unique advantages during specific periods. The A3 model reaches the highest single-point irradiance of the day—805.71 W·m−2 at 13:00—indicating that vertical layouts also offer high potential at certain times. The data support the idea that uniform building heights in vertical blocks help minimize mutual shading, especially in the early morning (7:00–9:00), when vertical-type buildings—particularly the A2 model—receive more radiation than other types.
Hybrid-type buildings show comparatively weaker performance across most periods of the day, confirming their lowest photovoltaic potential. Although they have the highest building coverage and rooftop area ratios, the peak total irradiance of both C1 and C2 is significantly lower than that of the other two types, especially around noon. This confirms that the staggered building heights typical of hybrid layouts create serious shading problems, particularly where taller buildings obstruct sunlight from reaching shorter ones. The differences in photovoltaic potential across urban block types indicate that each three-dimensional structural parameter influences photovoltaic performance to varying degrees.
3.2.2 Influence of building 3-D structural parameters on photovoltaic potential
Differences in photovoltaic potential across urban block types reveal that each 3-D structural parameter affects photovoltaic potential to varying extents.
Building height has a time-dependent impact on radiation. Under lower solar altitudes, lower building heights help reduce shading—for example, while central-type models perform poorly in the morning, the A3 model receives more radiation than A1 and A2. As solar altitude increases, the effect of building height diminishes, and at noon, the lower vertical-type A3 and moderately high central-type models perform best, reaching 695.48 W/m2 and 751.16 W/m2, respectively.
Building spacing has a more complex relationship with radiation. A2 outperforms A1 in the morning due to its smaller spacing, which enhances reflected radiation under low solar altitude. However, by 12:00, their irradiance levels are nearly identical, indicating that the impact of spacing weakens under high solar angles. Central-type buildings, with wider spacing, perform best during peak photovoltaic hours, confirming that appropriate spacing reduces shading and enhances solar gain.
Building coverage ratio should be evaluated in conjunction with other structural parameters. A moderately low coverage ratio appears to be optimal—for example, B2 reaches the highest irradiance of 751.16 W/m2 at 12:00. In contrast, although hybrid-type buildings have the highest coverage ratios, they exhibit the weakest total irradiance due to excessive shading.
Rooftop area ratio contributes to total irradiance, but this effect is strongly modulated by building arrangement and height variation. At 12:00, A3 receives more radiation than A1 and A2, confirming that rooftop area plays a role in midday peak irradiance. The data suggest that an optimal rooftop area ratio must balance vertical surface area and shading effects. The moderate rooftop area ratios observed in central-type buildings are consistent with their superior performance.
Sky View Factor quantifies the visible portion of the sky at a given point (The formula is expressed as shown in Equation 3), which directly correlates with the extent to which buildings obstruct the sky. The Sky View Factor values for each three-dimensional building model are provided in Table 2, and these results were derived from the built-in model of ENVI-met. The Sky View Factor is highly correlated with direct radiation, and areas with high Sky View Factor exhibit strong performance in total radiation throughout the day. Sky View Factor plays a more critical role under low solar altitude conditions—for instance, vertical-type buildings (A) outperform other types in the morning and afternoon.
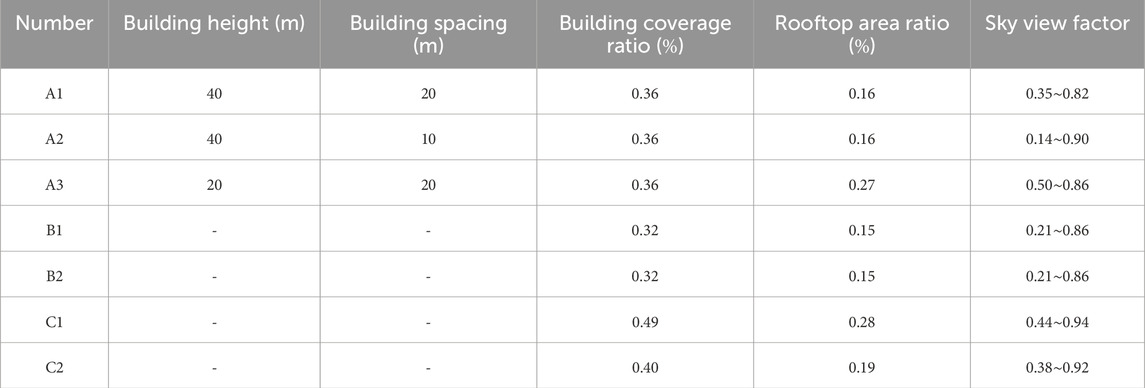
Table 2. Calculated results of three-dimensional structural parameters.
3.2.3 Evaluation of experimental results
Figure 14 compares the simulated and actual total radiation data received by the three urban block building models. Both the models and the measured data exhibit similar diurnal variation patterns—gradually increasing in the morning, peaking at noon, and declining in the afternoon—indicating that the simulation results generally reflect actual radiation trends. At most time points, the simulated values are higher than the measured ones, with the largest discrepancies occurring during the morning hours (6:00–9:00), primarily due to the idealized conditions of the simulation environment. When the solar altitude is at its highest, the simulated and actual data align most closely, as direct radiation dominates during this period and the influence of diffuse radiation is minimal.
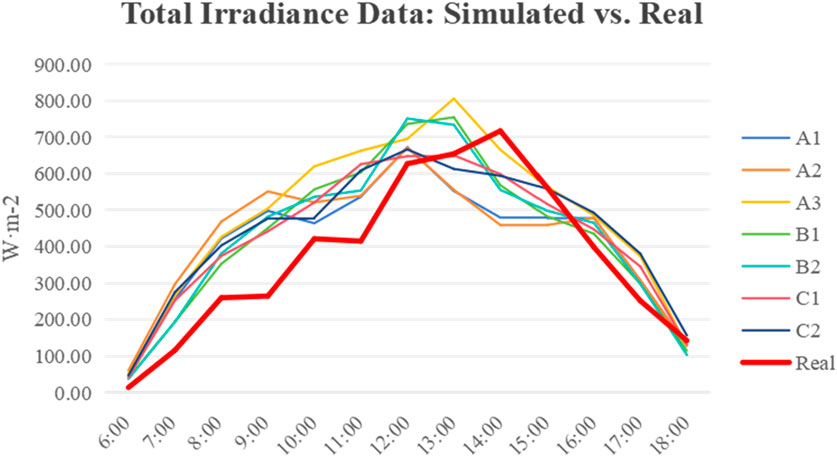
Figure 14. Total irradiance data: simulated vs. real (from the Xihe energy meteorological big data platform).
3.3 Annual and seasonal scale simulation results and analysis on real building radiation
When analyzing the impact of building structures on regional photovoltaic potential, we found that while the trends in simulated and actual data were generally consistent, the simulated radiation values were generally higher due to the idealized conditions of the simulation environment, which did not account for obstructions such as vegetation. To better account for the influence of complex urban environments on photovoltaic potential, this study extracted 3-D information of real buildings from LiDAR data and selected representative real buildings of three types for radiation simulations. These were conducted at the annual scale (Figure 15) and for four key solar terms: Spring/Autumn Equinox, Summer Solstice, and Winter Solstice (Figure 16).
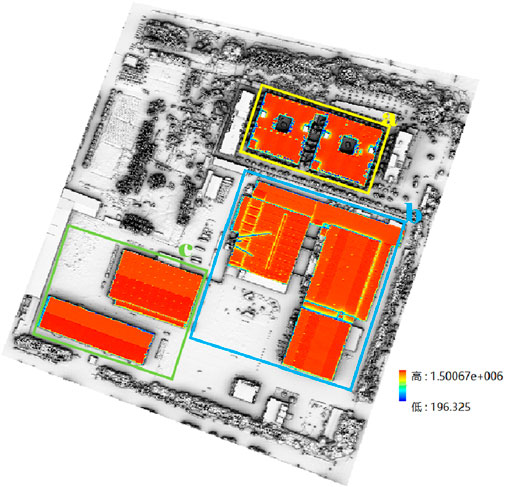
Figure 15. Average annual radiation energy of real buildings in 2023 (unit:Wh/m2): a (yellow) represents vertical-type buildings, b (blue) represents central-type buildings, and c (green) represents hybrid-type buildings.
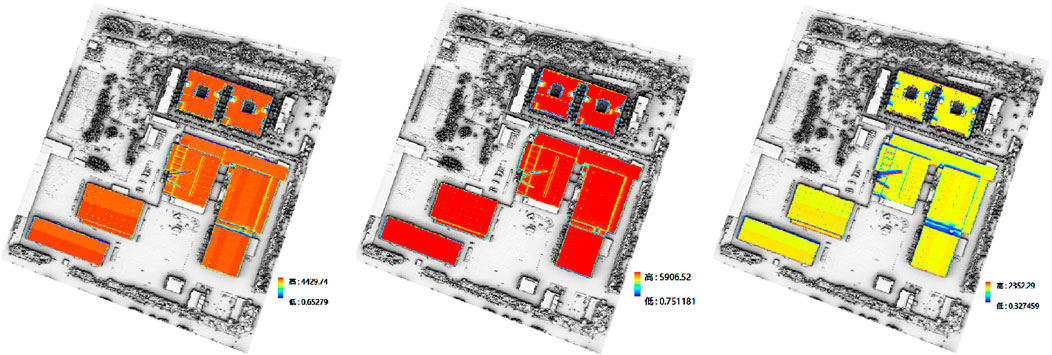
Figure 16. Radiation of real buildings on four key solar terms in 2023 (unit:Wh/m2): from left to right—Spring/Autumn Equinox, Summer Solstice, Winter Solstice.
According to the simulation data of real buildings, the three building types exhibit distinct characteristics in radiation reception (Table 3). At the annual scale, expanding the temporal dimension tends to smooth out some of the key differences observed at the daily scale. Hybrid-type buildings receive the highest average annual radiation, followed by central-type and vertical-type buildings. Seasonal variation reveals that hybrid-type buildings lead in summer, with central-type buildings close behind (only 64.24 Wh/m2 lower), which aligns with the daily-scale finding that central-type buildings perform best at midday under high solar altitude. High sun angles maximize the benefits of the central-type’s optimized height and spacing configuration, reducing mutual shading. In spring and autumn, the performance gap between hybrid-type and central types increases slightly to 81.32 Wh/m2, again consistent with daily-scale findings where central-type buildings lead from 11:00 to 14:00—indicating strong adaptability of central-type buildings to solar altitude variations. In winter, when the solar altitude is low, differences among the three types diminish, supporting the earlier finding that vertical-type buildings perform better in the morning. Their uniform building heights reduce mutual shading under low-angle sunlight.

Table 3. Annual and seasonal scale real building radiation (unit: Wh/m2).
By integrating results from both daily-scale idealized models and annual/seasonal-scale real models, discrepancies emerge due to differences between idealized assumptions and real-world complexity. The strong annual performance of hybrid-type buildings may be attributed to simplifications in real models compared to their ideal counterparts: real hybrid-type buildings often lack enclosed courtyards and internal shading structures, leading to minimal self-shading and greater rooftop exposure, enhancing their radiation reception. Although central-type buildings rank second in annual radiation, their optimized spatial layout enables peak performance during critical periods, providing uniform radiation distribution and efficient space utilization. They are particularly well-suited for applications where photovoltaic efficiency is highly sensitive to time-of-day performance. Vertical-type buildings, while showing the lowest annual radiation, perform better under low solar angles and have unique advantages during morning, evening, and winter periods, with relatively uniform radiation distribution.
The structural differences between idealized and real buildings are the primary reason for variation in photovoltaic performance across building types. Additionally, the real building models incorporate environmental factors, especially vegetation, which are absent in the idealized models. Vegetation is a crucial environmental element in urban settings and significantly affects solar radiation distribution on building surfaces. Canopies and tall vegetation block sunlight, substantially reducing the amount of direct radiation received. Studies show that urban vegetation canopies may lead to an annual average radiation loss of 3%–11%, with more pronounced losses in winter (Fogl and Moudrý, 2016; Rory Tooke et al., 2011). In shallow cumulus–vegetation systems, direct radiation not transmitted or absorbed can be scattered by leaves or the ground, converting it into internal diffuse radiation (Pedruzo-Bagazgoitia et al., 2017). Vegetation also alters surface reflectivity, affecting reflected radiation received by buildings. For example, green roof systems with vegetation can reduce surrounding air temperatures and thermal emissions from building surfaces, thereby influencing the intensity of reflected radiation (Sailor, Anand, and King 2021).
Compared to central-type and vertical-type buildings, real hybrid-type buildings are generally free from vegetation obstruction, enabling unobstructed solar radiation reception throughout the day. As such, in real conditions, hybrid-type buildings not only benefit from reduced self-shading due to structural simplification, but also gain an advantage from sparse surrounding vegetation, further enhancing their radiation reception capacity.
4 Discussion
This study uses ENVI-met to simulate irradiance on building model surfaces and reveals the influence of urban building 3-D structures on photovoltaic potential through the linear relationship between irradiance and photovoltaic potential. As a microclimate simulation tool, ENVI-met accounts for reflected radiation and offers high accuracy in small-scale simulations. Compared to previous studies, this research refines the radiation analysis by separately evaluating direct, diffuse, and reflected radiation components, providing a more comprehensive understanding of how different urban morphological parameters impact the distribution of solar energy.
Based on the simulation results, the study sequentially analyzes the impact of 3-D structures on different types of radiation from the perspective of radiation transmission mechanisms. This allows for a deeper exploration of the relationship between building 3-D structure and its photovoltaic potential, as well as the influencing processes, ultimately identifying urban block building models with superior photovoltaic potential. Due to the higher solar altitude, the irradiance received on building surfaces at 12:00 is significantly higher than at 7:00. At both time points, the trend of changes in radiation due to variations in building 3-D structural parameters is generally similar across different radiation types, though some opposite trends are also observed. For example, in the case of reflected radiation, when building height decreases, mutual shading between buildings is reduced, allowing more sunlight to reach the ground and consequently reducing the reflected radiation received by building surfaces. However, for diffuse radiation, the reduction in shaded areas increases direct radiation, leading to more scattered radiation in the atmosphere, and as a result, the building surfaces receive more diffuse radiation.
The building structure is characterized from two perspectives: urban block types and three-dimensional structural parameters of the building. Significant differences in photovoltaic potential exist across different urban block types. Central-type urban block models show significantly higher photovoltaic potential than vertical and hybrid types models. Although their building coverage ratios and rooftop area ratios are lower than the other two types, their taller buildings and greater spacing result in less shading, similar to industrial areas in urban regions, which have greater photovoltaic potential. Vertical and hybrid types building models, resembling residential and commercial areas, have higher building density and varying heights which lead to more shading. Therefore, lower photovoltaic potential compared to central-type models. The weight of the influence of different 3-D building structural parameters on photovoltaic potential varies. The impact of building height and spacing on irradiance depends on radiation type, solar altitude, and climatic conditions. In some cases, building coverage ratios and rooftop area ratios may even have an opposite effect on photovoltaic potential, particularly when area is limited. The Sky View Factor, which is directly related to the extent of building obstruction to the sky, has a significant impact on photovoltaic potential. Since direct radiation constitutes the majority of the shortwave radiation received on the surface, Sky View Factor directly influences a building’s photovoltaic potential by allowing more direct radiation to reach the surface.
Based on the analysis of ideal building models, analysis at annual and seasonal scales for real buildings has been added. Although ideal building models facilitate controlled variable studies for specific parameters, their simplified characteristics make it difficult to fully reflect the complex situation of solar radiation received by buildings in real urban environments. Additionally, extending from daily to annual and seasonal scale analysis provides a more comprehensive evaluation of the photovoltaic potential performance of different building forms over longer time scales, offering more valuable reference data for practical applications. According to simulation data from real buildings, the three building models exhibit different radiation reception characteristics. From annual average radiation and seasonal variation data, expanding the time dimension may mask some important differences at the daily scale. The hybrid-type building receives the highest annual average radiation, followed by the central-type building, with the vertical-type building receiving the lowest - which shows some deviation from the results of idealized models at the daily scale. The hybrid-type building’s leading position in annual radiation may be due to the significant simplification of real hybrid-type buildings compared to ideal models and the basic absence of vegetation obstruction in their surroundings. Although the central-type building receives less annual radiation than the hybrid-type model, its optimized spatial layout allows it to perform best during key peak periods, with good uniformity in radiation distribution, high spatial utilization efficiency, and suitability for maximizing photovoltaic generation efficiency during midday high solar angle periods.
However, this research has some limitations. Although the deviation between ENVI-met simulation results and actual data is relatively small, the real building models in the current study still have relatively simplified environmental features. In real cities, vegetation is often more dense and complexly distributed, accompanied by complex factors such as building density, height variations, and urban canyon effects. Further research should increase consideration of spatial scale, expanding from single building clusters to larger urban areas, to more comprehensively evaluate the impact of different urban forms on photovoltaic potential. This would yield more comprehensive, universally applicable, and forward-looking research conclusions, providing more reliable scientific basis for planning and designing urban building photovoltaic systems.
5 Conclusion
The layout and form of urban buildings have significant impacts on photovoltaic energy applications. This research uses three-dimensional building structures as an entry point to explore their influence on the photovoltaic generation potential of urban buildings, and quantifies the radiation reception characteristics of different building forms at daily, annual, and seasonal scales through ENVI-met simulation methods.
First, the results show significant differences in how building three-dimensional structures respond to different types of radiation (direct, diffuse, reflected). Direct radiation is most significantly affected by solar altitude, reaching its peak at noon; diffuse radiation plays a compensatory role in high-density areas; reflected radiation is mainly related to surface structure and layout, showing a certain lag effect. Second, building parameters such as height, spacing, coverage ratio, roof area ratio, and sky view factor collectively determine the spatial distribution of photovoltaic potential. Low coverage ratio with moderate Sky View Factor configuration is more conducive to reducing obstruction and enhancing irradiance reception levels.
After further introducing LiDAR-derived real building models, it was found that at the annual scale, hybrid-type buildings show the highest radiation reception, but their advantage partly stems from simplified structure and lack of vegetation obstruction. Central-type buildings, despite slightly lower annual average radiation, demonstrate optimal performance during high solar angle periods, making them suitable for efficient photovoltaic deployment. Vertical-type buildings perform well at low solar altitudes, suitable for winter or morning/evening power generation applications.
This research emphasizes that when evaluating building photovoltaic potential, the combined action mechanisms of building form, structural parameters, seasonal variations, and urban environmental elements (such as vegetation) should be comprehensively considered. In the future, the accuracy and practicality of assessments can be further improved by introducing more complex urban forms, dynamic meteorological conditions, and multi-scale obstruction factors.
Data availability statement
The datasets presented in this study can be found in online repositories. The names of the repository/repositories and accession number(s) can be found below: www.xihe-energy.com.
Author contributions
HS: Conceptualization, Methodology, Project administration, Supervision, Writing – original draft. LD: Conceptualization, Funding acquisition, Software, Writing – original draft. CZ: Investigation, Validation, Writing – review and editing. TH: Formal Analysis, Resources, Writing – review and editing. GX: Data curation, Visualization, Writing – review and editing. CQ: Writing – review and editing.
Funding
The author(s) declare that financial support was received for the research and/or publication of this article. This research was funded by Technical Development Contract for Power Generation Modeling Based on Multi-Source Remote Sensing Data, grant number 824084216.
Acknowledgments
The authors gratefully acknowledge the support from Xihe Energy Meteorological Big Data Platform, which provides the meteorological condition variables and real radiation data of the study area. The authors would also like to thank the reviewers for their insightful comments and valuable suggestions.
Conflict of interest
Authors HS, LD, CZ, TH, GX, and CQ were employed by Shandong Electirc Power Engineering Consulting Institute Corp. Ltd.
Generative AI statement
The authors declare that no Generative AI was used in the creation of this manuscript.
Publisher’s note
All claims expressed in this article are solely those of the authors and do not necessarily represent those of their affiliated organizations, or those of the publisher, the editors and the reviewers. Any product that may be evaluated in this article, or claim that may be made by its manufacturer, is not guaranteed or endorsed by the publisher.
References
Akpolat, A. N., Dursun, E., Emin Kuzucuoğlu, A., Yang, Y., Blaabjerg, F., and Baba, A. F. (2019). Performance analysis of a grid-connected rooftop solar photovoltaic system. Electronics 8 (8), 905. doi:10.3390/electronics8080905
Allegrini, J., Orehounig, K., Mavromatidis, G., Ruesch, F., Dorer, V., and Evins, R. (2015). A review of modelling approaches and tools for the simulation of district-scale energy systems. Renew. Sustain. Energy Rev. 52 (December), 1391–1404. doi:10.1016/j.rser.2015.07.123
Amado, M., and Poggi, F. (2014). Solar urban planning: a parametric approach. Energy Procedia 48 (January), 1539–1548. doi:10.1016/j.egypro.2014.02.174
Assouline, D., Mohajeri, N., and Scartezzini, J.-L. (2018). Large-scale rooftop solar photovoltaic technical potential estimation using random forests. Appl. Energy 217 (May), 189–211. doi:10.1016/j.apenergy.2018.02.118
Belbedj, L., Benlaloui, I., Fezzani, A., Hadj-Mahammed, I., Zaghba, L., Boutabba, T., et al. (2023). “Estimating energy parameters for photovoltaic modules using mathematical models,” in 2023 International Conference on Electrical Engineering and Advanced Technology (ICEEAT), Batna, Algeria, 05-07 November 2023 (IEEE), 1–4.
Bensehla, S., Lazri, Y., and Brito, M. C. (2021). Solar potential of urban forms of a cold semi-arid city in Algeria in the present and future climate. Energy Sustain. Dev. 62 (June), 151–162. doi:10.1016/j.esd.2021.04.004
Bianchi, C., Overby, M., Willemsen, P., Smith, A. D., Stoll, R., and Pardyjak, E. R. (2020). Quantifying effects of the built environment on solar irradiance availability at building rooftops. J. Build. Perform. Simul. 13 (2), 195–208. doi:10.1080/19401493.2019.1679259
Brito, M. C., Redweik, P., Catita, C., Freitas, S., and Santos, M. (2019). 3D solar potential in the urban environment: a case study in lisbon. Energies 12 (18), 3457. doi:10.3390/en12183457
Calcabrini, A., Weegink, R., Manganiello, P., Zeman, M., and Isabella, O. (2021). Simulation study of the electrical yield of various PV module topologies in partially shaded urban scenarios. Sol. Energy 225 (September), 726–733. doi:10.1016/j.solener.2021.07.061
Chatzipoulka, C., Compagnon, R., and Nikolopoulou, M. (2016). Urban geometry and solar availability on façades and ground of real urban forms: using London as a case study. Sol. Energy 138 (November), 53–66. doi:10.1016/j.solener.2016.09.005
Cristea, C., Cristea, M., Birou, I., and Tîrnovan, R.-A. (2020). Economic assessment of grid-connected residential solar photovoltaic systems introduced under Romania’s new regulation. Renew. Energy 162 (December), 13–29. doi:10.1016/j.renene.2020.07.130
Dalong, L. I. U., Xiaowei, J. I. A., Yang, J., and Dong, G. (2019). Analyses of urban radiative field simulations. J. Tsinghua Univ. Technol. 59 (3), 243–248. doi:10.16511/j.cnki.qhdxxb.2018.26.051
Debbarma, M., Sudhakar, K., and Baredar, P. (2017). Thermal modeling, exergy analysis, performance of BIPV and BIPVT: a review. Renew. Sustain. Energy Rev. 73 (June), 1276–1288. doi:10.1016/j.rser.2017.02.035
Dehwah, A. H. A., Asif, M., Budaiwi, I. M., and Alshibani, A. (2020). Techno-economic assessment of rooftop PV systems in residential buildings in hot–humid climates. Sustainability 12 (23), 10060. doi:10.3390/su122310060
Dondariya, C., Porwal, D., Awasthi, A., Kumar Shukla, A., Sudhakar, K., Murali Manohar, S. R., et al. (2018). Performance simulation of grid-connected rooftop solar PV system for small households: a case study of ujjain, India. Energy Rep. 4 (November), 546–553. doi:10.1016/j.egyr.2018.08.002
Ebhota, W. S., and Tabakov, P. Y. (2022). Assessment of solar PV potential and performance of a household system in Durban North, durban, South Africa. Clean Technol. Environ. Policy 24 (4), 1241–1259. doi:10.1007/s10098-021-02241-6
Fogl, M., and Moudrý, V. (2016). Influence of vegetation canopies on solar potential in urban environments. Appl. Geogr. 66 (January), 73–80. doi:10.1016/j.apgeog.2015.11.011
Freitas, S., Catita, C., Redweik, P., and Brito, M. C. (2015). Modelling solar potential in the urban environment: state-of-the-art review. Renew. Sustain. Energy Rev. 41 (January), 915–931. doi:10.1016/j.rser.2014.08.060
Gagnon, P., Margolis, R., Jennifer, M., Phillips, C., and Ryan, E. (2018). Estimating rooftop solar technical potential across the US using a combination of GIS-based methods, lidar data, and statistical modeling. Environ. Res. Lett. 13 (2), 024027. doi:10.1088/1748-9326/aaa554
Gassar, A. A. A., and Cha, S. H. (2021). Review of geographic information systems-based rooftop solar photovoltaic potential estimation approaches at urban scales. Appl. Energy 291 (June), 116817. doi:10.1016/j.apenergy.2021.116817
Guen, M.L., Mosca, L., Perera, A. T. D., Coccolo, S., Mohajeri, N., and Scartezzini, J.-L. (2018). Improving the energy sustainability of a Swiss village through building renovation and renewable energy integration. Energy Build. 158 (January), 906–923. doi:10.1016/j.enbuild.2017.10.057
Gusson, C. S., and Duarte, D. H. S. (2016). Effects of built density and urban morphology on urban microclimate - calibration of the model ENVI-met V4 for the subtropical Sao Paulo, Brazil. Procedia Eng. 169 (January), 2–10. doi:10.1016/j.proeng.2016.10.001
Han, J.-Y., Chen, Y.-C., and Li, S.-Y. (2022). Utilising high-fidelity 3D building model for analysing the rooftop solar photovoltaic potential in urban areas. Sol. Energy 235 (March), 187–199. doi:10.1016/j.solener.2022.02.041
Hu, D., Liu, M., Di, Y., Chen, Y., and Wang, Y. (2020). USRT: a solar radiative transfer model dedicated to estimating urban 3D surface reflectance. Urban Sci. 4 (4), 66. doi:10.3390/urbansci4040066
Huang, Z., Mendis, T., and Xu, S. (2019). Urban solar utilization potential mapping via deep learning technology: a case study of wuhan, China. Appl. Energy 250 (September), 283–291. doi:10.1016/j.apenergy.2019.04.113
Kaleshwarwar, A., and Bahadure, S. (2023). Assessment of the solar energy potential of diverse urban built forms in Nagpur, India. Sustain. Cities Soc. 96 (September), 104681. doi:10.1016/j.scs.2023.104681
Khan, M. I., Al Huneidi, D. I., Asfand, F., and Al-Ghamdi, S. G. (2023). Climate change implications for optimal sizing of residential rooftop solar photovoltaic systems in Qatar. Sustainability 15 (24), 16815. doi:10.3390/su152416815
Kutlu, E. C., Durusoy, B., Ozden, T., and Akinoglu, B. G. (2022). Technical potential of rooftop solar photovoltaic for ankara. Renew. Energy 185 (February), 779–789. doi:10.1016/j.renene.2021.12.079
Li, J., Wang, Y., and Xia, Y. (2022). A novel geometric parameter to evaluate the effects of block form on solar radiation towards sustainable urban design. Sustain. Cities Soc. 84 (September), 104001. doi:10.1016/j.scs.2022.104001
Lobaccaro, G., Carlucci, S., Croce, S., Paparella, R., and Finocchiaro, L. (2017). Boosting solar accessibility and potential of urban districts in the nordic climate: a case study in trondheim. Sol. Energy 149 (June), 347–369. doi:10.1016/j.solener.2017.04.015
Mahaya, C., Zemmouri, N., Benharra, H., and Elnokaly, A. (2022). Solar access assessment in semi-arid urban context: an application study for ten urban forms of existing apartment buildings districts in Batna city, Algeria. Sustain. Cities Soc. 83 (August), 103909. doi:10.1016/j.scs.2022.103909
Martín-Jiménez, J., Del Pozo, S., Sánchez-Aparicio, M., and Lagüela, S. (2020). Multi-scale roof characterization from LiDAR data and aerial orthoimagery: automatic computation of building photovoltaic capacity. Automation Constr. 109 (January), 102965. doi:10.1016/j.autcon.2019.102965
Martinopoulos, G. (2020). Are rooftop photovoltaic systems a sustainable solution for Europe? A life cycle impact assessment and cost analysis. Appl. Energy 257 (January), 114035. doi:10.1016/j.apenergy.2019.114035
Martins, T. A. L., Adolphe, L., Bastos, L. E. G., and de Lemos Martins, M. A. (2016). Sensitivity analysis of urban morphology factors regarding solar energy potential of buildings in a Brazilian tropical context. Sol. Energy 137 (November), 11–24. doi:10.1016/j.solener.2016.07.053
Mirkovic, M., and Alawadi, K. (2017). The effect of urban density on energy consumption and solar gains: the study of abu dhabi’s neighborhood. Energy Procedia 143 (December), 277–282. doi:10.1016/j.egypro.2017.12.684
Mohajeri, N., Assouline, D., Guiboud, B., Bill, A., Gudmundsson, A., and Scartezzini, J.-L. (2018). A city-scale roof shape classification using machine learning for solar energy applications. Renew. Energy 121 (June), 81–93. doi:10.1016/j.renene.2017.12.096
Mokhtara, C., Negrou, B., Settou, N., Bouferrouk, A., and Yao, Y. (2021). Optimal design of grid-connected rooftop PV systems: an overview and a new approach with application to educational buildings in arid climates. Sustain. Energy Technol. Assessments 47 (October), 101468. doi:10.1016/j.seta.2021.101468
Ordóñez, J., Jadraque, E., Alegre, J., and Martínez, G. (2010). Analysis of the photovoltaic solar energy capacity of residential rooftops in andalusia (Spain). Renew. Sustain. Energy Rev. 14 (7), 2122–2130. doi:10.1016/j.rser.2010.01.001
Pedruzo-Bagazgoitia, X., Ouwersloot, H. G., Sikma, M., van Heerwaarden, C. C., Jacobs, C. M. J., and Vilà-Guerau de Arellano, J. (2017). “Direct and diffuse radiation in the shallow cumulus–vegetation system,” in Enhanced and decreased evapotranspiration regimes. doi:10.1175/JHM-D-16-0279.1
Ramachandra, T. V., Jain, R., and Krishnadas, G. (2011). Hotspots of solar potential in India. Renew. Sustain. Energy Rev. 15 (6), 3178–3186. doi:10.1016/j.rser.2011.04.007
Rory Tooke, T., Coops, N. C., Voogt, J. A., and Meitner, M. J. (2011). Tree structure influences on rooftop-received solar radiation. Landsc. Urban Plan. 102 (2), 73–81. doi:10.1016/j.landurbplan.2011.03.011
Sailor, D. J., Anand, J., and King, R. R. (2021). Photovoltaics in the built environment: a critical review. Energy Build. 253 (December), 111479. doi:10.1016/j.enbuild.2021.111479
Sarralde, J. J, Quinn, D. J., Wiesmann, D., and Steemers, K. (2015). Solar energy and urban morphology: scenarios for increasing the renewable energy potential of neighbourhoods in London. Renewable Energy 73, 10–17. doi:10.1016/j.renene.2014.06.028
Shi, Z., Fonseca, J. A., and Schlueter, A. (2021). A parametric method using vernacular urban block typologies for investigating interactions between solar energy use and urban design. Renew. Energy 165 (March), 823–841. doi:10.1016/j.renene.2020.10.067
Tsoka, S., Tsikaloudaki, A., and Theodosiou, T. (2018). Analyzing the ENVI-met microclimate model’s performance and assessing cool materials and urban vegetation applications–A review. Sustain. Cities Soc. 43 (November), 55–76. doi:10.1016/j.scs.2018.08.009
Wiginton, L. K., Nguyen, H. T., and Pearce, J. M. (2010). Quantifying rooftop solar photovoltaic potential for regional renewable energy policy. Comput. Environ. Urban Syst. 34 (4), 345–357. doi:10.1016/j.compenvurbsys.2010.01.001
Keywords: photovoltaic potential, 3-D building structure, ENVI-met, urban blocks, 3-D structure parameters
Citation: Shouchao H, Dong L, Zengliang C, Hongju T, Xingguo G and Qian C (2025) Impact of the 3-D structure on the photovoltaic potential in Urban areas. Front. Energy Res. 13:1534576. doi: 10.3389/fenrg.2025.1534576
Received: 01 December 2024; Accepted: 15 May 2025;
Published: 04 June 2025.
Edited by:
Qian Sun, RMIT University, AustraliaReviewed by:
Slavica Prvulovic, University of Novi Sad, SerbiaYongli Lu, Massachusetts Institute of Technology, United States
Copyright © 2025 Shouchao, Dong, Zengliang, Hongju, Xingguo and Qian. This is an open-access article distributed under the terms of the Creative Commons Attribution License (CC BY). The use, distribution or reproduction in other forums is permitted, provided the original author(s) and the copyright owner(s) are credited and that the original publication in this journal is cited, in accordance with accepted academic practice. No use, distribution or reproduction is permitted which does not comply with these terms.
*Correspondence: Cao Qian, MjQxMzA5MDIwMDMyQGhodS5lZHUuY24=