 Ligang Zhou1
 Yanhai Rong
- 1State Grid Electric Vehicle Service Hubei Co., Ltd., Wuhan, China
- 2College of Lilac, Harbin Institute of Technology at Weihai, Weihai, China
The reliable power supply and economic analysis of ship charging and swapping station are crucial for promoting the electrification of the shipping industry and achieving the dual carbon goals. This paper focuses on the development of an economic analysis method for ship charging and swapping stations within smart grid application scenarios. Firstly, the cost model is established by considering the construction, operation, maintenance, and equipment replacement of ship charging and swapping stations. Secondly, an operational model is defined, outlining the constraints for charging and discharging processes as well as backup power capabilities. Thirdly, an economic analysis framework is developed to minimize total investment and operational costs, incorporating factors such as thermal power unit operation, wind power curtailment, and deep peak shaving of thermal units. Finally, the proposed models are validated through a case study using modified IEEE 9-bus and IEEE 30-bus systems, and the results demonstrate significant improvements in economic efficiency and system performance when incorporating ship charging and swapping station.
1 Introduction
The shipping industry plays a significant role in the economic development of countries and regions. By the end of 2021, China’s inland waterways had a navigable length of 128,000 km, including over 16,000 km of high-grade waterways, 20,867 production berths, and 2,659 berths for ships of 10,000 tons or more (Gu and Li, 2022).
Under the carbon peaking and carbon neutrality goals, clean energy supply options for ships, such as electricity and hydrogen, have become essential (Calabrese et al., 2024). Recent studies highlight both the potential and the challenges of hydrogen as a clean fuel for maritime applications. For instance, hydrogen-powered ships using polymer electrolyte membrane fuel cells (PEMFCs) have shown promise in improving sustainability, yet they are constrained by high infrastructure investment, safety concerns, and regulatory challenges (Dall’Armi et al., 2023). Furthermore, case studies on general cargo ships indicate that replacing traditional diesel generators with hydrogen fuel cells can significantly reduce emissions and meet international carbon intensity standards, but at the cost of increased operational complexity and expenses (Inal et al., 2024). Despite these hurdles, hydrogen’s high energy density makes it a strong candidate for long-distance shipping, though its low energy conversion efficiency and infrastructure requirements remain critical barriers (Kumar et al., 2023). Therefore, Hydrogen-powered ships have higher energy density, making them more suitable for long voyages, but they face issues such as lower energy conversion efficiency, high storage and infrastructure costs, and safety risks, especially in densely populated port areas (Van Hoecke et al., 2021).
Electricity-powered ships offer high energy transmission efficiency and operational simplicity, making them a preferred clean energy source for maritime transportation. However, powering large ships with electricity on a global scale remains challenging due to current limitations in battery energy density and the significant investment required for global charging infrastructure. Additionally, charging large-capacity batteries can take several hours, potentially affecting the efficiency of global shipping operations. These challenges may disrupt the global supply chain in the short term due to increased costs and delays. As a result, electric propulsion is currently more practical for small and medium-sized ships, where operational efficiency and charging logistics present fewer obstacles (Moon et al., 2024). It is anticipated that an industrial cluster of small and medium-sized electric ships will emerge in the future, serving as the backbone of short- and medium-distance transportation as well as medium- and small-volume freight transport (Wang, 2022).
As the connecting link between the power grid and electric ships, the safe, efficient, and economical operation of ship charging and swapping station is an important guarantee for the green transformation and development of the modern shipping industry. In recent years, the development of charging infrastructure for electric ships has become a focal point in promoting sustainable marine transportation. Various studies have explored different approaches to optimize this infrastructure. One study proposed a demand-side management strategy that incentivized electric cruise ship users to charge during off-peak times, reducing load fluctuations and enhancing grid efficiency, which in turn lowered user costs and optimized grid management (Ling et al., 2020). Another study conducted a preliminary evaluation of offshore marinized charging station, demonstrating the economic viability of these station, particularly those powered by floating nuclear power plants, for supporting long-distance electric vessels (Yuan and Nian, 2020) Research also compared AC, DC, and inductive shore-to-ship fast charging systems, finding that DC charging offered superior energy efficiency, especially for AC-based propulsion systems, while inductive charging, despite its complexity, provided competitive energy efficiency along with additional benefits such as safety and reliability (Karimi et al., 2020). Additionally, a universal shore-to-ship charging system was proposed to address the lack of interoperability between different vessel configurations, introducing a flexible multi-vessel architecture with an onshore battery system that optimized power distribution during grid outages (Karimi et al., 2024). Another approach focused on optimizing the location of charging station using a backup coverage model, ensuring efficient fulfillment of ship energy demands while balancing construction costs and service capabilities (Zhang et al., 2020). Offshore floating charging station was evaluated, with proposals for innovative accessibility solutions such as remotely operated power carrier vehicles and pole-based charging points to facilitate recharging at sea (Sruthy et al., 2020). Furthermore, standalone onshore charging station powered by hybrid offshore renewable energy systems were modeled, showing that hybrid systems provided a better match for battery-powered electric ferries’ electricity demand compared to individual energy sources (Frković et al., 2023). Lastly, an operational feasibility study of an FCS at a North Sea offshore location demonstrated a significant reduction in reliance on backup energy sources through a reconfigurable energy management strategy, paving the way for further studies on FCS siting and marine spatial planning (Sruthy and Preetha, 2024).
The design of ship charging and swapping station not only needs to ensure a high-reliability power supply but also should fully consider economic efficiency to achieve a sustainable operational model. Up to now, there has been limited research on the economic analysis of ship charging and swapping station. Due to the energy storage attributes of ship charging and swapping station, this paper primarily analyzes the existing economic analysis techniques for energy storage station. In Kapila et al. (2017), the boundaries of the energy storage system were determined based on system capacity, taking into account factors such as the location and scale of storage facilities, and a techno-economic model for the energy storage system was established. In Chen et al. (2019), lifecycle cost was used as an indicator to evaluate the economic efficiency of energy storage equipment, along with the development of both dynamic and static models. The current status and trends of large-scale sustainable energy storage technologies were discussed in Habib and Sou (2018), highlighting key developments in the field. Additionally, (Hauer and Teuffel, 2015), elaborated on the development status of energy storage systems by analyzing technical levels, application scenarios, practical significance, and economic efficiency. The functional positioning and application value of energy storage devices in smart grid were explored in Jing et al. (2021), which also proposed value recovery mechanisms for different business models, including competitive, regulated, and hybrid frameworks. In Morais et al. (2022), four feasible economic operation modes for energy storage systems were proposed, offering operational strategies. Finally, (Ruibao et al., 2021), established an economic analysis model to assess the operational efficiency of energy storage devices, focusing on peak-valley price differences and overall value modes.
The above literature highlights various approaches to the economic analysis of energy storage systems, but there remains a gap in applying these methods specifically to ship charging and swapping station. Unlike traditional energy storage systems, ship charging and swapping station not only need to integrate with complex port infrastructure but also incur significant costs related to construction, maintenance, and operational reliability. Furthermore, the fluctuation in energy demand from electric ships adds additional complexity to the economic model. Thus, a comprehensive economic analysis framework that takes into account the unique characteristics of ship charging and swapping station is crucial to ensuring their long-term profitability and sustainability within the smart grid. This paper aims to address these gaps by proposing a specialized economic evaluation model for ship charging and swapping station, which will be critical to supporting their role in the green transformation of the shipping industry.
2 Cost and operational model of ship charging and swapping station for smart grid application scenarios
2.1 Cost model of ship charging and swapping station
The various types of costs for ship charging and swapping station mainly include construction costs, operation and maintenance costs, and equipment replacement costs, namely, Equation 1:
Among the various types of costs for ship charging and swapping station, the construction cost
Generally,
Notably, the costs of other equipment (the
The operation and maintenance costs of ship charging and swapping station are divided into annual fixed maintenance costs and variable maintenance costs. The former is mainly determined by the scale of the ship charging and swapping station, while the latter is related to the energy throughput of the station Equation 4.
The expression for the replacement cost of the ship charging and swapping station is as follows Equation 5:
where k is the total number of replacements for the ship charging and swapping station during the project period, rounded up to the nearest whole number if it is not an integer.
2.2 Operational model of ship charging and swapping station
The operational model of ship charging and swapping station describes the constraints that need to be met during operation, mainly including output constraints, single condition operation constraints, and backup constraints.
The output constraints of ship charging and swapping station require that the power absorbed (or released) during the charging (or discharging) process stays within the upper and lower limits, namely, Equation 6:
where
The single condition operation constraint requires that the ship charging and swapping station can only operate in one condition or be completely idle, namely, Equation 7:
The ship charging and swapping station has the ability to provide both positive and negative reserves under different operating conditions. However, due to the potential issue of reserve discontinuity when providing reserves across different conditions, this paper does not consider providing reserves across different conditions. The specific constraint expressions are as follows Equation 8:
The provision of positive and negative reserve power by the ship charging and swapping station comes at the expense of reducing the range of charging and discharging power. The relationship between them is as follows Equations 9, 10:
3 Economic analysis method
3.1 Objective function
In this study, thermal generation is utilized as the main supply due to its foundational role in many power systems. Thermal power plants are reliable and provide consistent baseload power, making them essential for maintaining grid stability, especially in scenarios with fluctuating renewable energy sources. Thermal generation plays a crucial role in frequency regulation and balancing power supply and demand in the grid, and is often used as a key backup source to ensure stable and predictable electricity supply, which is critical in the operational model for ship charging and swapping stations within smart grid applications. Additionally, wind power has become a key renewable energy source due to its scalability, cost-effectiveness, and low environmental impact once deployed. In this study, incorporating wind power generation allows the model to reflect the growing importance of renewable energy in modern grids, where reducing dependency on fossil fuels is a priority. In summary, this paper considers both thermal and wind power generation in the economic analysis method for ship charging and swapping stations in smart grid applications.
To minimize the total investment and operating costs, a typical daily optimal scheduling model for ship charging and swapping station in smart grid application scenarios is constructed. The total investment and operating costs mainly include the total operating costs of thermal power units, the total costs of ship charging and swapping station, and the cost of wind power curtailment. The expression is Equation 11
In the process of deep peak shaving of thermal power units, the operating cost needs to consider both the basic operating costs of the units, such as fuel cost, start-up cost, and reserve cost, and the additional costs, such as deep peak shaving loss cost, deep peak shaving fuel cost, and deep peak shaving subsidy income. The specific expression is as follows Equation 12:
The expressions for the above six cost items are as follows Equation 13:
The expression for wind power curtailment penalty cost is as follows Equation 14:
3.2 Constraints
The operational constraints of the model mainly include power balance constraints, reserve constraints, renewable energy output constraints, thermal power unit operation constraints, and constraints on ship charging and swapping station, which are explained sequentially below.
The power balance constraint is primarily used to ensure the real-time balance between the system’s electricity supply and demand Equation 15.
The reserve constraints require the system to maintain a certain amount of positive and negative spinning reserve capacity to mitigate the impacts of uncertainties in wind power and load forecasting, ensuring the safe and stable operation of the system, namely, Equation 16
The renewable energy output constraint requires that the actual wind power dispatch output cannot exceed the wind power forecast output, namely, Equation 17
The operational constraints for thermal power units include output constraints, start-up and shutdown constraints, ramping constraints, and reserve constraints. The specific calculation expressions for these constraints are as follows.
The output constraints for thermal power units consider the output limits during conventional peak shaving, non-oil deep peak shaving, and oil-fired deep peak shaving, namely, Equations 18, 19
where
The ramping constraints and start-up/shutdown time constraints for thermal power units are as follows Equation 20.
The reserve constraints for thermal power units are as follows Equations 21, 22.
The operational constraints for ship charging and swapping station are detailed in Section 2.2 and will not be elaborated here.
The decision variables of the model mainly include: the output of thermal power units, wind power output, the charging and discharging power of ship charging and swapping station, the reserve output of thermal power units and ship charging and swapping station, and various state variables.
While the developed model is primarily designed for ship charging and swapping stations within smart grid application scenarios, its universality extends to other regions and countries with appropriate adjustments. Different geographic locations often feature unique infrastructures, regulations, and environmental conditions that may require modifications to the original model. Incorporating region-specific constraints into the model can enhance its applicability across diverse geographical settings. For example, countries with stricter environmental regulations may require additional emissions constraints or noise control measures at charging stations (Sun et al., 2021). Areas with limited grid stability or intermittent renewable energy supply may need to incorporate more robust power balancing or energy storage constraints (Suberu et al., 2014). Similarly, regions with high congestion in port areas might require additional safety constraints related to energy storage and discharge processes (Roy et al., 2020). These location-based constraints can be integrated into the model to improve its reliability and ensure it aligns with local operational requirements. Through the incorporation of various adjustable parameters, the model can be fine-tuned to reflect the specific needs of different locations, whether by modifying operational constraints, adjusting cost functions, or introducing additional factors such as seasonal variations in shipping demand or grid capacity. This flexibility makes the model suitable for a variety of geographical contexts, supporting its potential adoption in global smart grid applications.
4 Case study
4.1 Studied system and structure of ship charging and swapping station
The case studies are conducted based on the modified IEEE 9-bus and IEEE 30-bus systems. The IEEE 9-bus system is shown in Figure 1A. In this system, the wind farm is connected to node 23, and the ship charging and swapping station is connected to node 23. The schematic diagram of the IEEE 30-bus system structure is shown in Figure 1B, and the wind farm and ship charging and swapping station are connected at node 23 of the system.
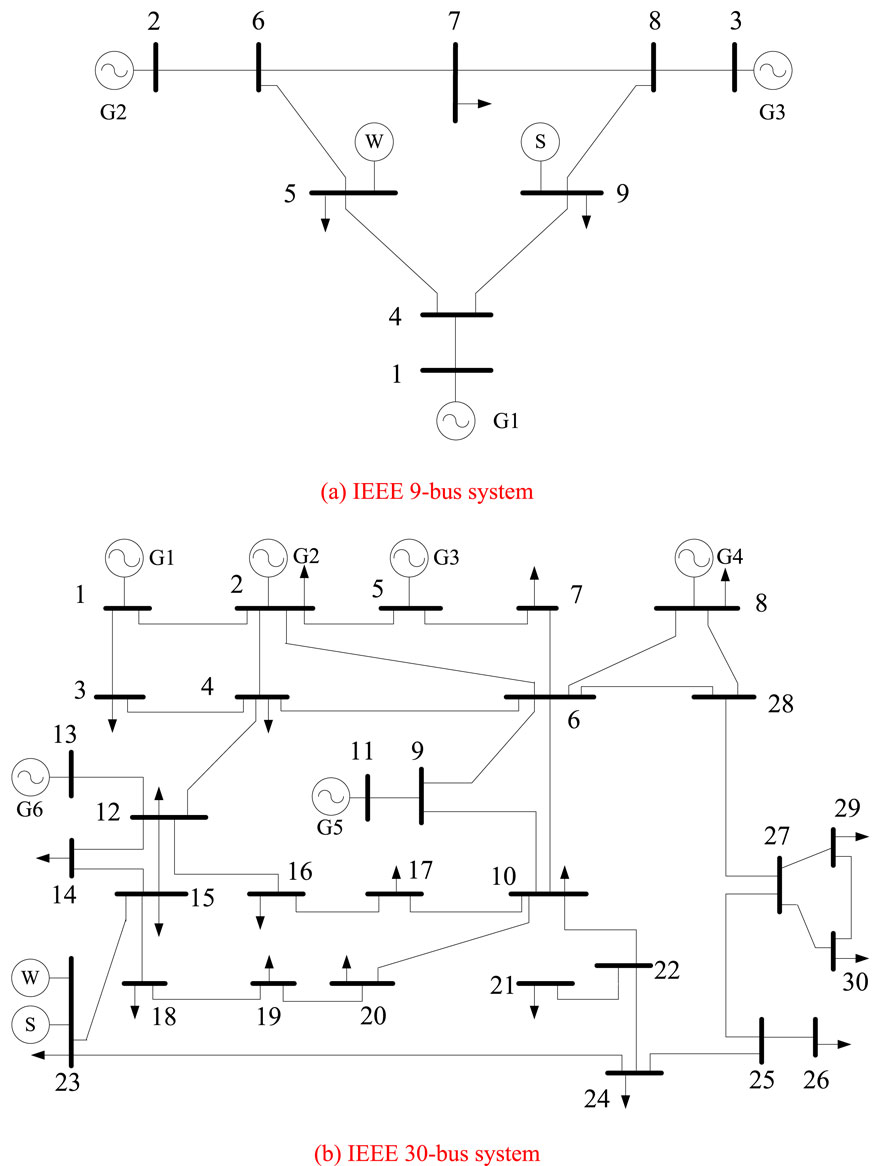
Figure 1. (A) IEEE 9-bus system. (B) IEEE 30-bus system. Modified IEEE 9-bus system and IEEE 30-bus system structure diagram.
The minimum output of thermal power units during normal operation, non-oil deep peak shaving, and oil-fired deep peak shaving is 60%, 45%, and 30% of the rated output, respectively. The operational impact coefficients for non-oil and oil-fired deep peak shaving stages are 1.2 and 1.5, respectively. The oil price is set at 6130 yuan/ton, and the oil consumption for oil-fired deep peak shaving is 4.8 tons/hour per unit time. The unit electricity compensation prices for non-oil and oil-fired deep peak shaving are 0.2 yuan/kWh and 0.4 yuan/kWh, respectively. The unit power cost of the thermal power unit is 636.81 $/kW.
Due to the distinct seasonal characteristics of wind power and load, this chapter considers setting four typical days for analysis: spring, summer, autumn, and winter. Referring to the relevant data of typical days for each season in a certain region of China, the forecast curves for load and wind power on typical days in each season are shown in Figures 2, 3, respectively.
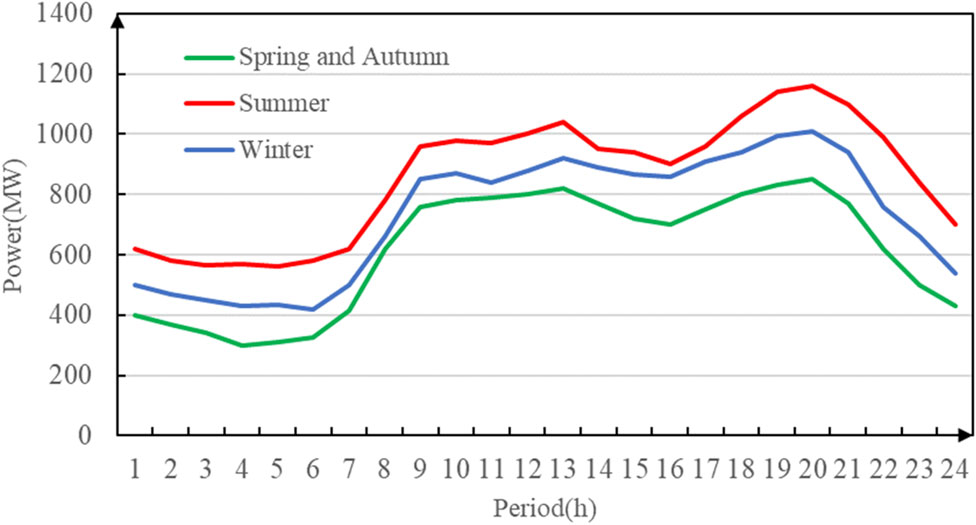
Figure 2. Load forecast curves for typical days in each season.
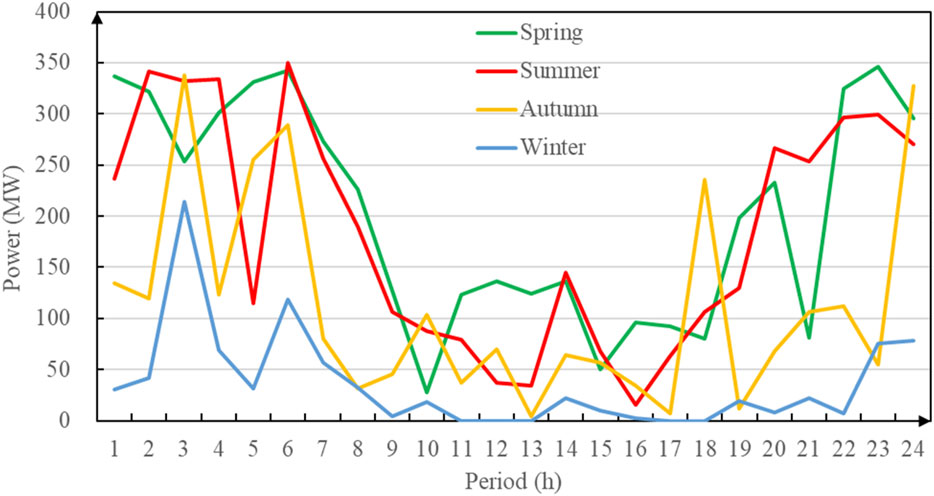
Figure 3. Wind power output forecast curves for typical days in each season.
The average daily operating cost for the system over a year is obtained by performing weighted calculations based on the proportion of typical days in each season within a year. This is used to illustrate the economic benefits brought by the participation of the ship charging and swapping station system in system operations. The proportions for spring, summer, autumn, and winter are set to 0.17, 0.33, 0.17, and 0.33, respectively. Assuming the maximum forecast errors for load and wind power output are 5% and 20%, respectively, the unit capacity wind curtailment penalty cost is set to 200 $/MW.
To compare the economic efficiency of various types of ship charging and swapping station in detail, four scenarios are set up: Scenario 1 involves no participation of any ship charging and swapping station, only considering conventional thermal power units with deep peak shaving capability and wind power. Scenarios 2 to 4 build on Scenario 1 by respectively adding ship charging and swapping station with dual-ring network wiring mode, “double-petal” wiring mode, and two-main-two-backup wiring mode. It should be noted that the three wiring modes are widely-used in current substation. The followings are the brief overviews of these three wiring modes.
Dual-ring network wiring mode: The schematic diagram of the dual-ring network wiring mode is shown in Figure 4. In this mode, the two power sources of the first-level switching station come from different bus bars of the same substation or from different substations. The two power sources of the second-level switching station come from different bus bars of the upper-level switching station, and there are two dedicated tie lines between the two second-level switching stations. Four switching stations form a dual-sided power chain wiring. This wiring mode can meet the “N-2” shutdown requirements during maintenance and is easy to maintain, provided that the line transmission capacity is sufficiently large. However, this mode also requires the construction of dedicated tie lines, necessitating additional investment.
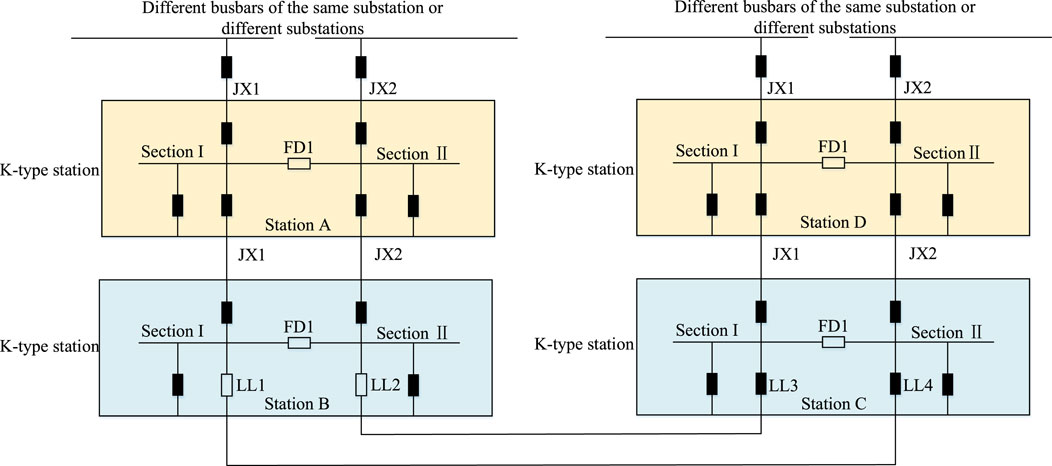
Figure 4. The schematic diagram of the dual-ring network wiring mode.
“Double-petal” wiring mode: The schematic diagram of the “double-petal” wiring mode is shown in Figure 5. Each substation’s main transformer leads out two lines, which, together with the two lines led out by the main transformers of other substations, form a “double-petal” wiring configuration. This wiring mode has relatively easily controlled short-circuit currents, which is beneficial for system stability and safety. When the line transmission capacity is sufficiently large, this mode can meet the “N-2” shutdown requirements during maintenance, further improving power supply reliability. However, the load transfer process between rings in this mode is relatively complex and requires distribution automation to complete load transfer during faults.
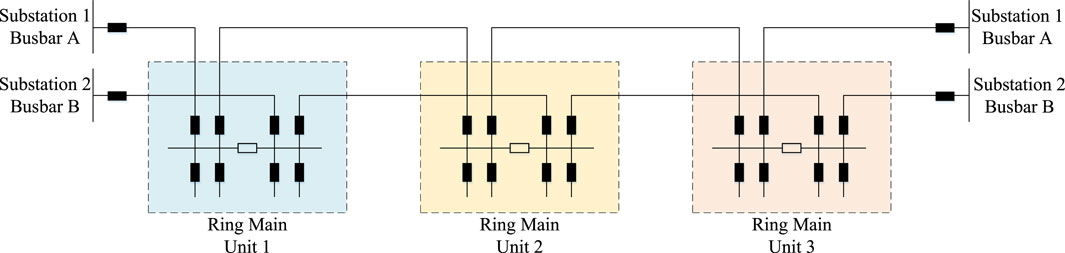
Figure 5. The schematic diagram of the “double-petal” wiring mode.
Two-main-two-backup wiring mode: The schematic diagram of the two-main-two-backup wiring mode is shown in Figure 6. In this wiring mode, the two power sources of the switching station come from different bus bars of the same substation or from different substations, and dedicated tie lines are set up between switching stations. In the event of losing both upper-level power sources, the switching station can still transfer loads, achieving lateral backup. Each bus bar segment of the switching station reserves one slot for a tie line, forming a hand-in-hand structure with adjacent switching stations. Compared to the “double-petal” wiring mode, this wiring mode provides more balanced load transfer during the ring network formation process, effectively improving the load rate of the switching station after a fault.
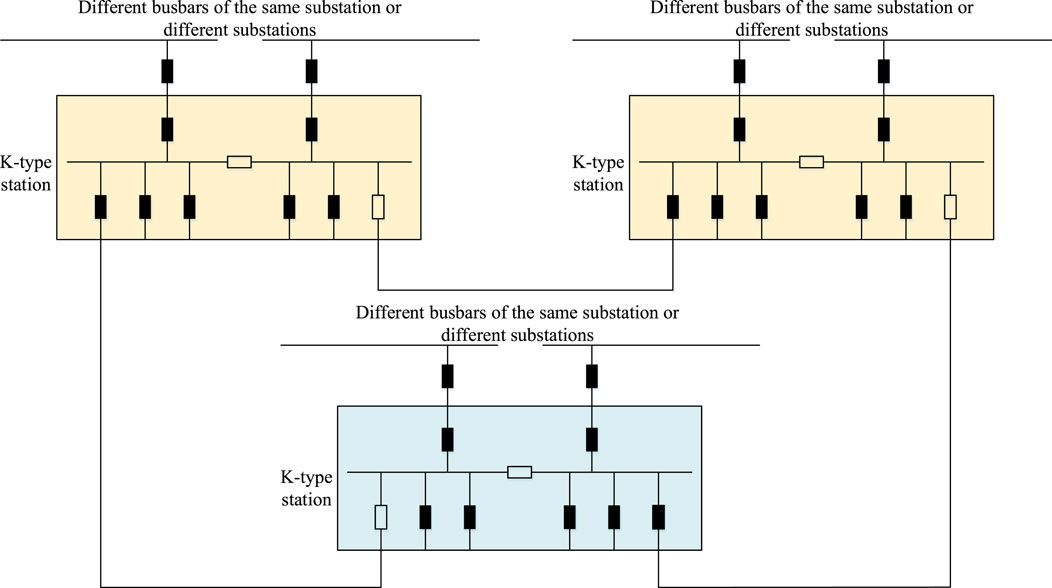
Figure 6. The schematic diagram of the two-main-two-backup wiring mode.
4.2 Analysis of IEEE 9-bus system
Table 1 demonstrates the simulation results of system investment and operating costs for the IEEE 9-bus system under four scenarios, highlighting significant cost variations. Scenario 1 incurs the highest total cost ($357,916.30) due to the elevated operating costs of thermal power units ($277,442.41) and wind curtailment costs ($34,957.78). In contrast, Scenario 3 achieves the lowest total cost ($302,611.11), attributed to reduced reserve costs ($15,982.79) and wind curtailment costs ($6,622.31). Scenario 2 also shows notable cost reductions with the lowest deep peak shaving loss cost ($627.55) and deep peak shaving fuel cost ($431.00), indicating enhanced operational efficiency. While Scenario 4 slightly increases total costs ($321,121.58) due to the investment in ship charging and swapping stations, it reflects the system’s effort to integrate renewable energy and electrification infrastructure. These results suggest that Scenarios 2 and 3 effectively balance operational efficiency and cost savings, with Scenario 3 emerging as the most economically optimal.
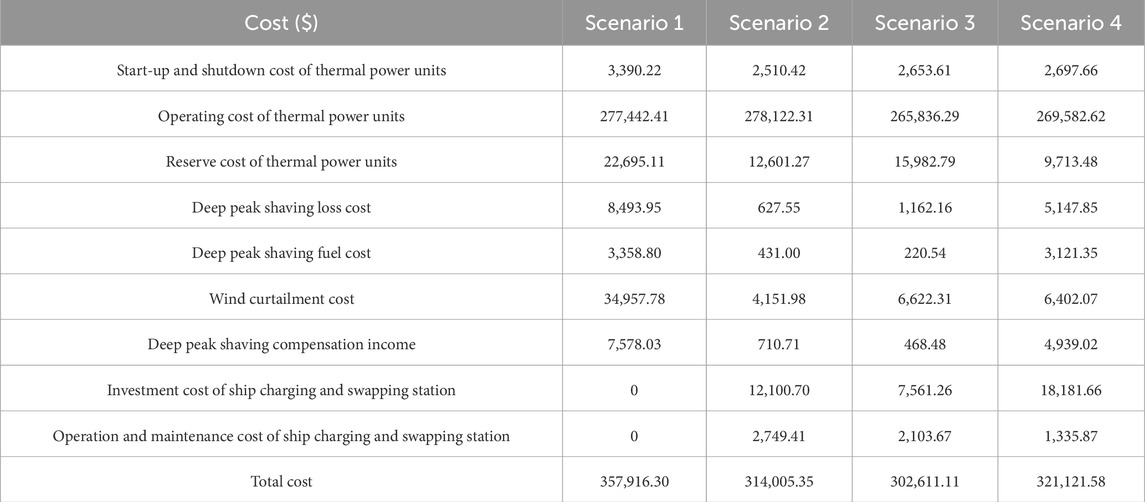
Table 1. Simulation results of system investment and operating costs for IEEE 9 bus system in different scenarios.
Table 2 highlights the comparative economic benefits of ship charging and swapping stations under different scenarios for the IEEE 9-bus system. Scenario 3 demonstrates the most favorable economic outcome, with the lowest investment and operation cost ($9,364.18) and the highest output-to-input ratio (195.28%), indicating superior cost efficiency. Scenario 2 also exhibits strong economic benefits, with an output-to-input ratio of 128.03% and moderate costs ($14,571.11). In contrast, Scenario 4 shows the highest cost ($19,244.97) and the lowest output-to-input ratio (88.49%), suggesting reduced cost-effectiveness. These results underscore the importance of optimizing investment strategies to achieve economic efficiency in deploying ship charging and swapping stations.
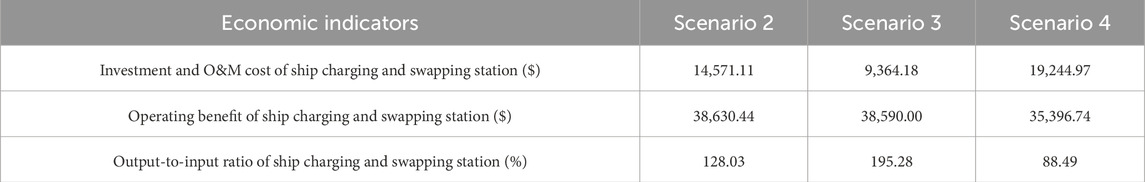
Table 2. Comparative analysis of economic benefits of ship charging and swapping station for IEEE 9 bus system in different scenarios.
4.3 Analysis of IEEE 30-bus system
The simulation results of the IEEE 30 system investment and operating costs for scenarios 1 to 4 are shown in Table 3. Analyzing the data in Table 3 reveals that although the introduction of ship charging and swapping station brings additional investment and maintenance costs, the overall economic efficiency of the system is still effectively improved. Various operating costs of thermal power units have decreased to different extents, with the reserve costs and deep peak shaving related costs of thermal power units showing significant reductions, decreasing by at least approximately 27.7% and 31.2%, respectively. Further analysis shows that the total system cost decreases the most in Scenario 3, by approximately 11.1%, and decreases the least in Scenario 4, by approximately 10.4%. In addition, the introduction of ship charging and swapping station significantly reduces wind curtailment, with wind curtailment costs generally decreasing by more than 80%.
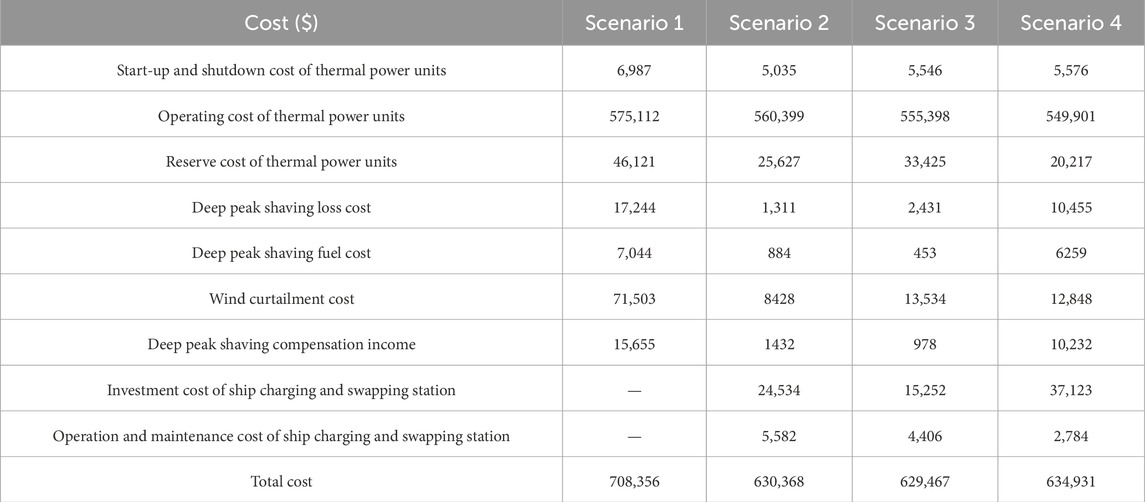
Table 3. Simulation results of system investment and operating costs in different scenarios.
For ease of analysis, the sum of the investment cost and the operation and maintenance cost of the ship charging and swapping station is referred to as the “investment and O&M cost of ship charging and swapping station.” The reduction in the total system operating cost after the introduction of ship charging and swapping station is referred to as the “operating benefit of ship charging and swapping station.” At the same time, the concept of the output-to-input ratio of the ship charging and swapping station is introduced, which is the ratio of the operating benefit to the investment and O&M cost of the ship charging and swapping station. The comparison of the economic benefits of different types of ship charging and swapping station is shown in Table 4. As can be seen from the table, the ship charging and swapping station with the dual-ring network wiring mode has the highest overall economic benefits, followed by the station with the “double-petal” wiring mode, and finally the station with the two-main-two-backup wiring mode.
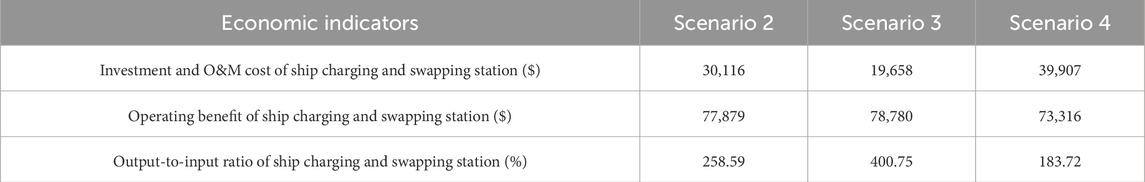
Table 4. Comparative analysis of economic benefits of ship charging and swapping station in different scenarios.
Taking a typical winter day as an example, the operational conditions of the system in different scenarios are analyzed to compare the impacts brought by the introduction of different ship charging and swapping station. The operational conditions of the system on a typical winter day for scenarios 1 to 4 are shown in Figures 7–10. From the figures, it can be seen that when there are no ship charging and swapping station in the system, the thermal power units undertake all the regulation tasks and reserve requirements. Deep peak shaving of the thermal power units occurs more frequently, often during load valleys and high wind power output. During these times, fewer thermal power units are in operation, and their output is lower, necessitating deep peak shaving to provide space for wind power integration. After the introduction of ship charging and swapping station, the system’s flexible regulation capability is significantly enhanced. The frequency of deep peak shaving for thermal power units is markedly reduced, with part of the system’s reserve tasks also being shared. Additionally, the “low charge, high discharge” operation mode of the ship charging and swapping station effectively promotes the large-scale integration of wind power, improving the economic efficiency of system operations.
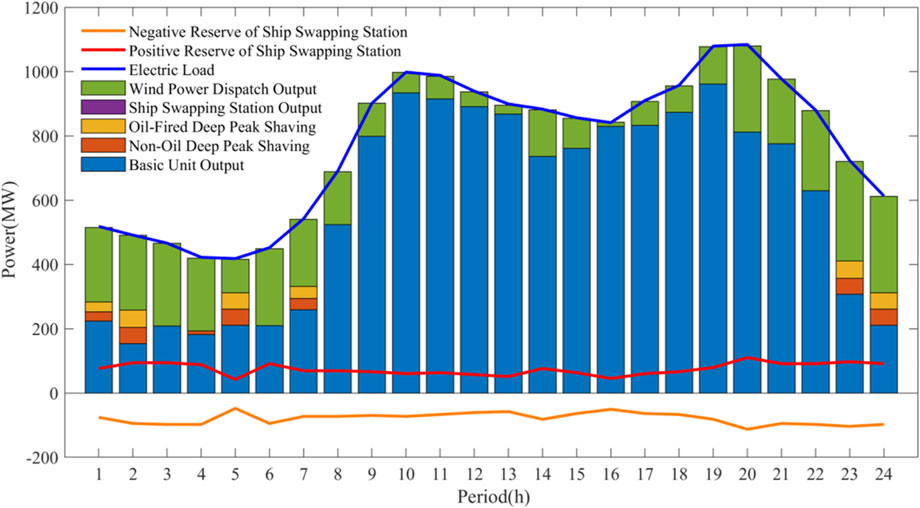
Figure 7. System operation on a typical winter day in scenario 1.
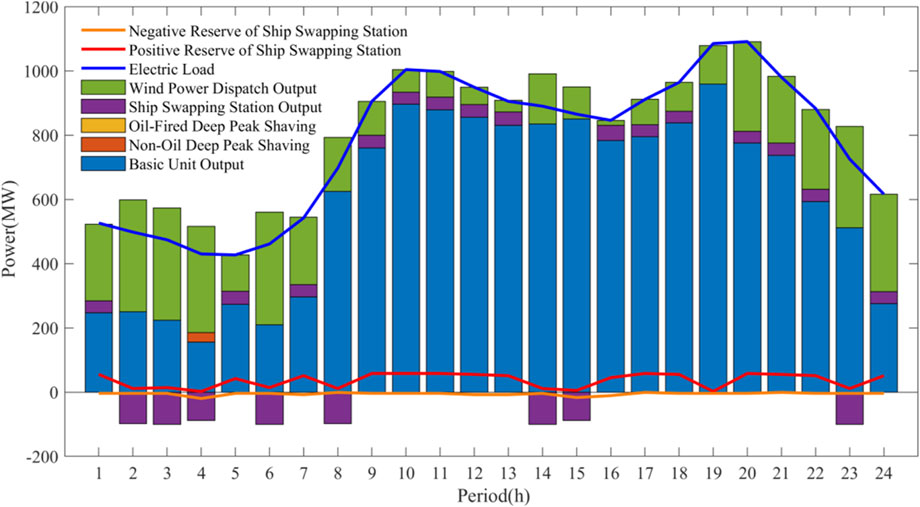
Figure 8. System operation on a typical winter day in scenario 2.
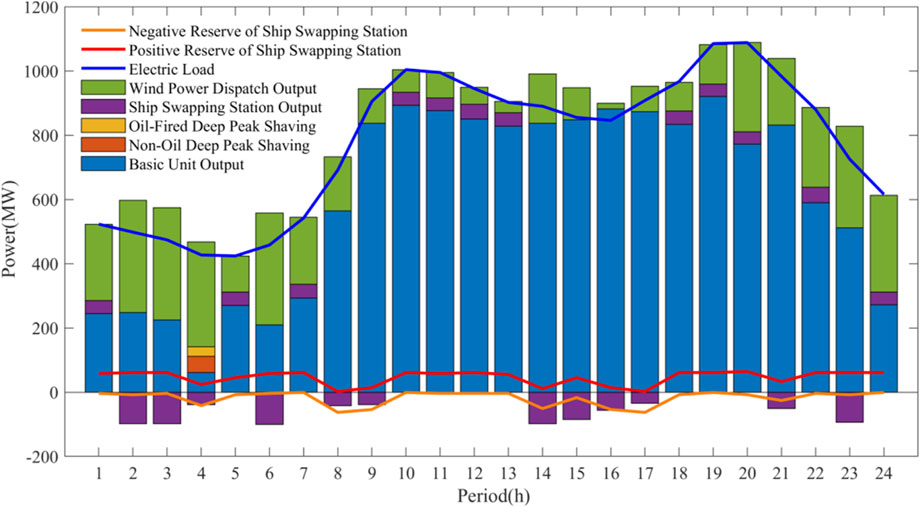
Figure 9. System operation on a typical winter day in scenario 3.
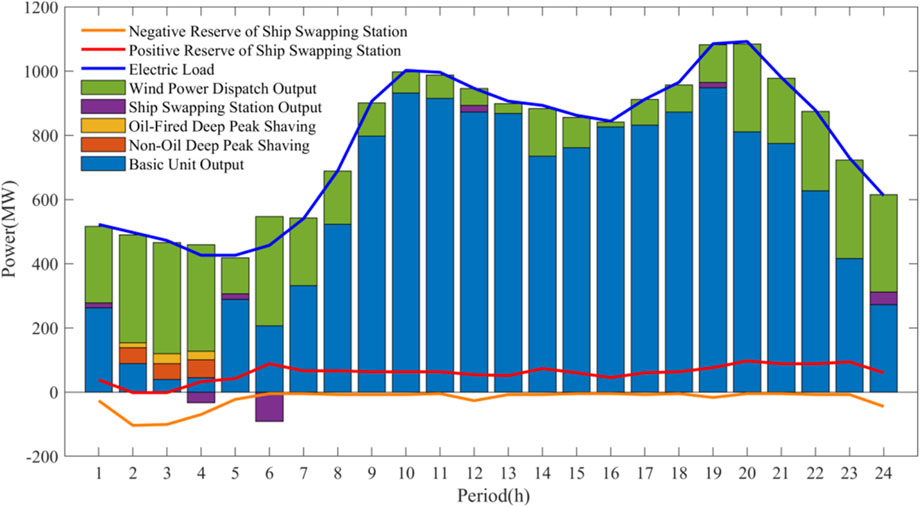
Figure 10. System operation on a typical winter day in scenario 4.
To further analyze the impact of the capacity configuration of ship charging and swapping station on system operation, the installed capacity of the ship charging and swapping station is changed while keeping other conditions unchanged. The operational benefits of different types of ship charging and swapping station under different capacities are analyzed based on the parameters in this chapter. The simulation results are shown in Table 5, and the trends are illustrated in Figure 11.
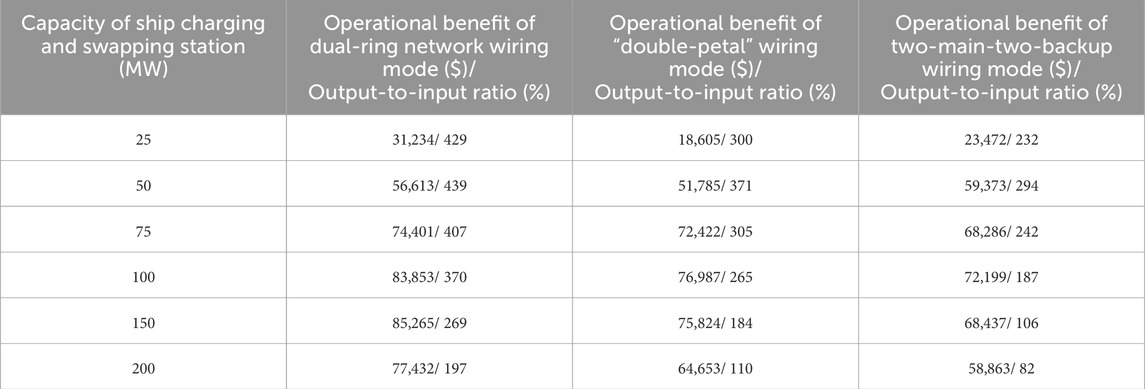
Table 5. Operational benefits of different types of ship charging and swapping station under different installed capacities.
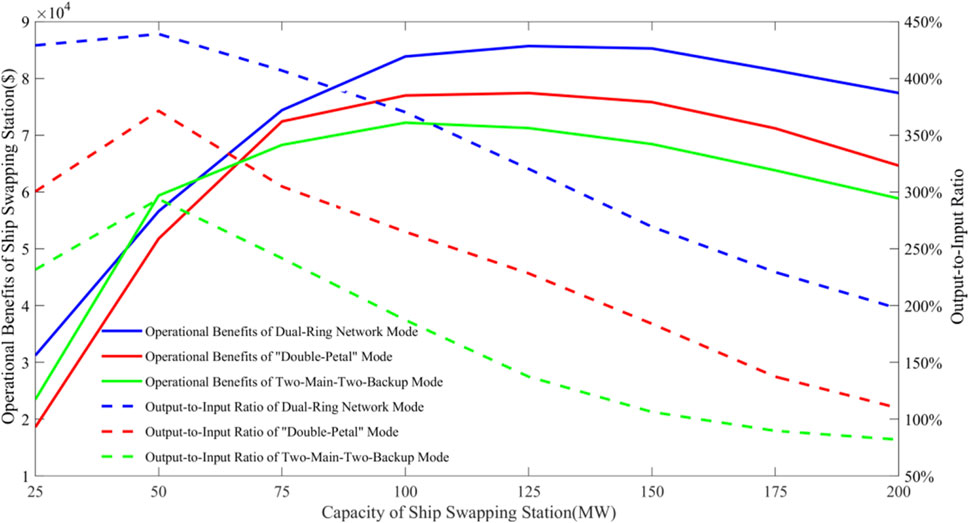
Figure 11. Trend of operational benefits of ship charging and swapping station with changes in installed capacity.
Analyzing Figure 11, it can be observed that as the installed capacity of ship charging and swapping station increases, the operational benefits and the output-to-input ratio of various types of ship charging and swapping station initially increase and then decrease. This is mainly because: when the installed capacity of ship charging and swapping station is relatively low, their investment and maintenance costs are also relatively low. Meanwhile, their benefits in reducing the operating, reserve, and deep peak shaving costs of thermal power units and in promoting large-scale wind power integration are significant. Additionally, the operational benefits brought by the increase in the capacity of ship charging and swapping station exceed the growth in investment and maintenance costs. Therefore, at this stage, the output-to-input ratio of ship charging and swapping station continues to rise. Later, as the installed capacity of ship charging and swapping station further increases, the demand and benefits of the station within the system gradually reach saturation. However, the rise in installed capacity continues to increase the investment and maintenance costs of the ship charging and swapping station, leading to a decrease in operational benefits and a decline in the output-to-input ratio.
5 Conclusion
This paper presents an economic analysis method for ship charging and swapping stations within the context of smart grid applications. By developing comprehensive cost and operational models, this study outlines the factors impacting the construction, operation, and maintenance of these stations. Additionally, an economic analysis framework was proposed to minimize the total investment and operating costs, considering thermal power unit operation, wind power curtailment, and deep peak shaving.
The models were validated through a case study using a modified IEEE 30-bus system. The results demonstrated that the integration of ship charging and swapping stations led to significant economic improvements. Specifically, total system costs were reduced by approximately 11.1% in the most efficient scenario, while wind power curtailment costs decreased by over 80%. Additionally, the study revealed that the dual-ring network wiring mode provided the highest economic benefit.
These findings underscore the potential of ship charging and swapping stations to enhance both economic efficiency and system performance, promoting the green transformation of the shipping industry in alignment with the dual carbon goals. Future research could focus on optimizing station locations and exploring advanced coordination strategies with renewable energy sources to further maximize economic benefits.
Data availability statement
The original contributions presented in the study are included in the article/supplementary material, further inquiries can be directed to the corresponding author.
Author contributions
LZ: Methodology, Writing–original draft, Writing–review and editing. TQ: Methodology, Writing–original draft, Writing–review and editing. YR: Data curation, Formal Analysis, Writing–original draft, Writing–review and editing. SP: Software, Supervision, Writing–original draft, Writing–review and editing. WL: Project administration, Resources, Writing–original draft, Writing–review and editing. LX: Visualization, Writing–original draft, Writing–review and editing.
Funding
The author(s) declare that no financial support was received for the research, authorship, and/or publication of this article.
Conflict of interest
Authors LZ, TQ, YR, SP, and WL were employed by State Grid Electric Vehicle Service Hubei Co., Ltd.
The remaining author declares that the research was conducted in the absence of any commercial or financial relationships that could be construed as a potential conflict of interest.
Generative AI statement
The author(s) declare that no Generative AI was used in the creation of this manuscript.
Publisher’s note
All claims expressed in this article are solely those of the authors and do not necessarily represent those of their affiliated organizations, or those of the publisher, the editors and the reviewers. Any product that may be evaluated in this article, or claim that may be made by its manufacturer, is not guaranteed or endorsed by the publisher.
References
Calabrese, M., Portarapillo, M., Di Nardo, A., Venezia, V., Turco, M., Luciani, G., et al. (2024). Hydrogen safety challenges: a comprehensive review on production, storage, transport, utilization, and CFD-based consequence and risk assessment. Energies 17 (6), 1350. doi:10.3390/en17061350
Chen, B., Xiang, K., and Yang, L. (2019). “Economic analysis of energy storage system based on LCC,” in 2019 IEEE 3rd conference on energy internet and energy system integration (EI2). Changsha, China.
Dall’Armi, C., Pivetta, D., and Taccani, R. (2023). Hybrid PEM fuel cell power plants fuelled by hydrogen for improving sustainability in shipping: state of the art and review on active projects. Energies 16 (4), 2022. doi:10.3390/en16042022
Frković, L., Ćosić, B., Pukšec, T., and Vladimir, N. (2023). Modelling of the standalone onshore charging station: the nexus between offshore renewables and all-electric ships. Energies 16, 5789. doi:10.3390/en16155789
Gu, W., and Li, S. (2022). Exploring Low-Carbon development strategies for Xi Jiang inland waterway shipping. Low. Carbon World 12 (10), 157–159. doi:10.16844/j.cnki.cn10-1007/tk.2022.10.023
Habib, A., and Sou, C. (2018). Analytical review on the trends and present situation of large-scale sustainable energy storage technology. 2(3), 31, doi:10.20897/ejosdr/86200
Hauer, A., and Teuffel, A. (2015). Integration of energy storage into energy systems. Handb. Clean Energy Syst., 1–14. doi:10.1002/9781118991978.hces215
Inal, O. B., Zincir, B., Dere, C., and Charpentier, J. F. (2024). Hydrogen fuel cell as an electric generator: a case study for a general cargo ship. J. Mar. Sci. Eng. 12 (3), 432. doi:10.3390/jmse12030432
Jing, L., Ming, W., and Li, Z. (2021). “Energy storage system value analysis and value recovery mechanism research,” in Conference on energy internet and energy system integration. Taiyuan, China, 22–24.
Kapila, S., Oni, A. O., and Kumar, A. (2017). The development of techno-economic models for large-scale energy storage systems. Energy 140, 656–672. doi:10.1016/j.energy.2017.08.117
Karimi, S., Zadeh, M., and Suul, J. A. (2020). “Evaluation of energy transfer efficiency for shore-to-ship fast charging systems,” in 2020 IEEE 29th international symposium on industrial electronics (ISIE). doi:10.1109/ISIE45063.2020.9152219
Karimi, S., Zadeh, M., and Suul, J. A. (2024). A multi-vessel universal shore-to-ship charging system: configuration and control architecture. IEEE Trans. Energy Convers. 39, 2119–2133. doi:10.1109/TEC.2024.3384339
Kumar, K., Sharma, M., and Shukla, A. K. (2023). “Hydrogen as a fuel for power generation—a review,” in Recent advances in mechanical engineering (FLAME 2022) (Cham, Switzerland: Lecture Notes in Mechanical Engineering), 249–262. Available at: https://link.springer.com/chapter/10.1007/978-981-99-1894-2_21
Ling, Y., Xu, N., Zhou, B., Li, X., Liu, J., Xu, N., et al. (2020). Charging load management of electric cruise ships based on price incentive. IOP Conf. Ser. Earth Environ. Sci. 598, 012092. doi:10.1088/1755-1315/598/1/012092
Moon, H. S., Park, W. Y., Hendrickson, T., Phadke, A., and Popovich, N. (2024). Exploring the cost and emissions impacts, feasibility and scalability of battery electric ships. Nat. Energy 10, 41–54. doi:10.1038/s41560-024-01655-y
Morais, R. C., Lopes, M. P. C., Bellido, M. M. H., Pereira, A. O., and Castelo Branco, D. A. (2022). Energy storage for photovoltaic power plants: economic analysis for different ion-lithium batteries. Energy Storage 4 (6), e376. doi:10.1002/est2.376
Roy, A., Auger, F., Olivier, J.-C., Schaeffer, E., and Auvity, B. (2020). Design, sizing, and energy management of microgrids in harbor areas: a review. Energies 13 (20), 5314. doi:10.3390/en13205314
Ruibao, S., Min, W., and Lei, W. (2021). “Research on economy of electrochemical energy storage system under peak-valley price difference and whole value mode,” in Conference on energy internet and energy system integration. Taiyuan, China, 22–24.
Sruthy, V., and Preetha, P. K. (2024). Implementation and operational feasibility of an offshore floating charging station for sustainable marine transportation. Environ. Dev. Sustain 26, 20931–20962. doi:10.1007/s10668-023-03512-6
Sruthy, V., Raj, B., and Preetha, P. K. (2020). An offshore floating charging station for electric ships: accessibility enhancement schemes for recharging. J. Mar. Sci. Technol. 10, 1143–1150. doi:10.1080/17445302.2020.1816748
Suberu, M. Y., Mustafa, M. W., and Bashir, N. (2014). Energy storage systems for renewable energy power sector integration and mitigation of intermittency. Renew. Sustain. Energy Rev. 35, 499–514. doi:10.1016/j.rser.2014.04.009
Sun, L., Zhang, T., Liu, S., Wang, K., Rogers, T., Yao, L., et al. (2021). Reducing energy consumption and pollution in the urban transportation sector: a review of policies and regulations in Beijing. J. Clean. Prod. 285, 125339. doi:10.1016/j.jclepro.2020.125339
Van Hoecke, L., Laffineur, L., Campe, R., Perreault, P., Verbruggen, S. W., and Lenaerts, S. (2021). Challenges in the use of hydrogen for maritime applications. Energy Environ. Sci. 14, 815–843. doi:10.1039/d0ee01545h
Wang, L. (2022). Study on the current situation and countermeasures of the development of China’s electric ship industry. China Marit. Saf. (08), 65–68. doi:10.16831/j.cnki.issn1673-2278.2022.08.021
Yuan, J., and Nian, V. (2020). A preliminary evaluation of marinized offshore charging station for future electric ships. ADBI Work. Pap. Ser. 1199. doi:10.1088/1755-1315/598/1/012092
Zhang, W., Yan, X. P., and Zhang, D. (2020). Charging station location optimization of electric ship based on backup coverage model. J. Mar. Sci. Eng. 11 (2), 137–141. doi:10.12716/1001.11.02.16
Nomenclature
Abbreviations
AC alternating current
DC direct current
FCS floating charging station
O&M operation and management
Cost and operational model
k total number of replacements
Objective function
T number of periods in typical daily scheduling cycle
Keywords: ship charging and swapping station, electric ships, economic analysis, cost model, smart grid
Citation: Zhou L, Qiu T, Rong Y, Peng S, Li W and Xie L (2025) An economic analysis method for ship charging and swapping station in smart grid. Front. Energy Res. 13:1536201. doi: 10.3389/fenrg.2025.1536201
Received: 28 November 2024; Accepted: 17 February 2025;
Published: 12 March 2025.
Edited by:
Lun Yang, Xi’an Jiaotong University, ChinaReviewed by:
Ahmad Farid Abidin, Faculty of Electrical Engineering UiTM, MalaysiaMarcin Wołowicz, Warsaw University of Technology, Poland
Copyright © 2025 Zhou, Qiu, Rong, Peng, Li and Xie. This is an open-access article distributed under the terms of the Creative Commons Attribution License (CC BY). The use, distribution or reproduction in other forums is permitted, provided the original author(s) and the copyright owner(s) are credited and that the original publication in this journal is cited, in accordance with accepted academic practice. No use, distribution or reproduction is permitted which does not comply with these terms.
*Correspondence: Yanhai Rong, cm9uZ3lhbmhhaV82ODU1QDE2My5jb20=