 Pang Jinian
 Li Juan2
- 1State Grid Jiangsu Electric Power Co., Ltd., Suqian Power Supply Branch, Suqian, Jiangsu, China
- 2Electric Power Research Institute of Jiangsu Electric Power Co., Ltd., Nanjing, Jiangsu, China
To address the self-healing challenges caused by increasingly complex distribution network topologies after faults, this study proposes an integrated area division scheme for distribution networks. The proposed scheme combines fault section location, correlation analysis, and network correlation matrix analysis. It pre-divides network topology areas through correlation identification, utilizing node connectivity structures derived from node-branch correlation matrices. The method enables rapid identification of control target areas through fault section location. This facilitates system self-healing via flexible load control post-fault. The regional division scheme effectively enhances distribution network self-healing efficiency and improves post-fault load recovery levels.
1 Introduction
The proportion of renewable energy is increasing, and the demand for safe and reliable power supply continues to increase. The microgrid facilitates the flexible consumption of renewable energy and directly serves power users. Its performance improvement is particularly important in the construction of the power load side of the new power system (Weinand et al., 2022; Liu et al., 2022; Cheng et al., 2024a). In addition, the sixth assessment report of the United Nations Special Committee on Climate Change pointed out that the frequency of extreme natural disaster events in the world is increasing (Huber et al., 2024). Because the proportion of power outages caused by extreme natural disaster events among all power outages is increasing, the losses caused by extreme natural disaster events are becoming more and more serious, and the ability of microgrid fault handling and self-healing recovery needs to be improved urgently (Wei et al., 2023; Gazijahani et al., 2021; Jarrahi et al., 2020).
The term “self-healing” is usually used in the power grid to refer to the ability of automatic detection, operation analysis, coordinated control, system optimization, and fault isolation. Power system topology identification and fault location, as key technologies to improve system resilience and autonomy, provide decision-making basis for self-healing control and are the basis for rapid fault recovery. At present, scholars have conducted extensive research on the above topology identification.
The existing power system topology identification schemes are divided into real-time measurement information method (i.e., power flow method) and historical topology information method (i.e., matrix method) (Xu et al., 2024). The electrical quantity power flow method relies on the power flow constraints. The electrical quantity is used to construct the network structure constraint equation, and the iterative algorithm is used to traverse the structure combination to realize the identification of the power system structure. The calculation is complex, and the dependence on the sampling data is high. Based on the initial results calculated using the linear power flow model, Wang et al. (2024a) introduced a two-stage topology parameter identification scheme to obtain topology identification and network parameter estimation results. In order to solve the problem that the lack of network information leads to poor node identification in the case of dynamic network, Babakmehr et al. (2016) built a power flow mapping framework and introduced sparse-TI technique. Fan et al. (2023) constructed the network model of the new power system by introducing the network power flow information, and the key degree of the power grid nodes is identified, which improves the level of node identification in the case of complex networks. In contrast, the topology identification method based on the structural matrix can extract the complex electrical connection structure, and then form the connection 0/1 element matrix and use the logical operation to realize the following presentation of the topology change. However, the existing scheme fails to incorporate electrical quantities, to realize the utilization of multi-source features, and to extract the operation information (Shen Y. et al., 2020; Zhang et al., 2024; Wang Y. et al., 2024).
For the fault location technology of microgrid, Pappu et al. (2018), KAR et al. (2017), Bukhari et al. (2022), and Tariq et al. (2022) proposed a fault location scheme based on network data processing for the problem of inaccurate fault location caused by the complex and changeable topology of microgrid, which improved the accuracy of fault location. Considering the difficulty of microgrid fault location under the access of new energy sources such as photovoltaics (PVs) and wind turbines, Roy et al. (2023) Wang et al. (2024c), and Wu et al. (2022) proposed a targeted fault location scheme, such as improved empirical wavelet transform and long short-term memory (LSTM) model. Based on the background of power grid big data, Pignati et al. (2017), Casagrande et al. (2014), Almasoudi (2023), and Srivastava and Parida (2022) proposed a microgrid fault location scheme based on machine learning or the fusion algorithm. Regarding fault detection and recovery technologies in distribution networks, Satea et al. (2024) proposed a high-resistance fault detection scheme based on the third harmonic and wavelet algorithms. Elgamasy et al. (2024) proposed a fault partitioning and accurate fault section location scheme based on passive traveling waves. However, the abovementioned fault identification and location scheme only uses the steady-state electrical quantity of the fault and is based on the amplitude characteristics of the global electrical quantity. Its application in microgrids with power flow fluctuations and complex structural connections always has sensitivity and effectiveness problems.
With the rapid development of communication technology and the increasing complexity of the power grid, the smart grid integrates communication technology and power engineering technology to enhance the security and reliability of the complex interactive power system. Shen F. et al. (2020) introduced the self-healing method of the distribution network and proposed that the self-healing of the distribution network is actually an optimization process of network reconfiguration. In the study, we pointed out that the self-healing of the distribution network should meet the requirements of self-healing efficiency, recovery time, and network loss. Based on 5G communication technology, a self-healing scheme of the distribution network considering mixed integer linear programming (MILP) was proposed by Lu et al. (2024), which optimizes the operation of the distribution network by linearizing the switching function. Mousavizadeh et al. (2021) coordinated the power generation resources of microgrid and used the power generation redundancy of microgrid to solve the problem of energy coordination after distribution network failure. In order to improve the operation stability of the power system, many research workers, both domestically and internationally, have explored power system interaction modes and flexible resource aggregation technologies. Lv et al. (2023) proposed a decentralized energy regulation scheme to deal with the risk of distribution network operation and used the ADMN algorithm to accelerate the iterative optimization process. Cheng et al. (2024b) proposed an evolutionary game theory based on the deep Q-learning network (DQN), which aims to improve the stability of dynamic strategies by using deep learning algorithms. The abovementioned scheme focuses on algorithm improvement or enhancing the distribution network’s fault self-healing capability through microgrid integration.
In order to improve the recovery ability of the power system, in this paper, we propose a distribution network topology division and fault section location scheme, which combines flexible load resources to serve microgrid fault recovery and self-healing. (1) Structure identification module: based on the correlation discrimination and the node–branch correlation matrix, the micro-grid network area division is realized by using logical operation; (2) fault location module: based on the microgrid network area division, the fault section location is realized by using the edge voltage difference in the region; and (3) based on the results of network area division, the flexible load resources in the relevant areas are regulated, the power distribution of the distribution network after the fault is optimized, and the self-healing of the distribution network is realized. Finally, the feasibility and effectiveness of the proposed method are verified using the IEEE33 node simulation model.
2 Self-healing scheme for distribution network fault recovery
In this section, we construct a structure identification module and a fault location module to achieve distribution network segmentation for fault recovery. The overall process is shown in Figure 1.
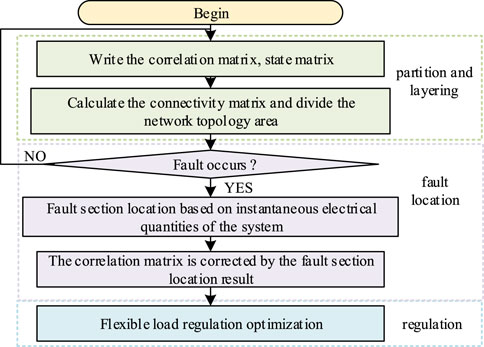
Figure 1. Overall flowchart.
The process shown in Figure 1 can be divided into three parts:
a) The first part is the preliminary division of the distribution network area based on the correlation calculation. This part obtains the preliminary regional division result of the distribution network through the correlation analysis of the electrical quantity of the power flow calculation result of the distribution network. According to the existing historical location data of electrical components, the node–branch correlation matrix, the branch switch state matrix, and the distributed power–node correlation matrix are listed. Then, the regional division of network topology is carried out. Each node in the correlation matrix is either a power supply or a transformer, and each branch represents a power transmission line.
b) The second part is the fault section location link. In this link, the system detects the change in electrical quantity in each region in real time. According to the change in the instantaneous voltage difference at the edge of the region, the starting criterion of the fault section location is realized, and the voltage difference is calculated based on the instantaneous edge to realize the fault section identification.
c) The third part is the flexible load resource control link, which is based on the fault section discrimination results to obtain the regional nodes related to the fault section. By regulating the corresponding reduced load and transferable load of the relevant regional nodes, the self-healing control process after the distribution network fault is completed.
3 Electrical network area division
During the power grid division stage, the correlation of the network power flow calculation is considered, and the node and branch connection matrix is used to achieve regional division. The flowchart of the distribution network connectivity area division is shown in Figure 2.
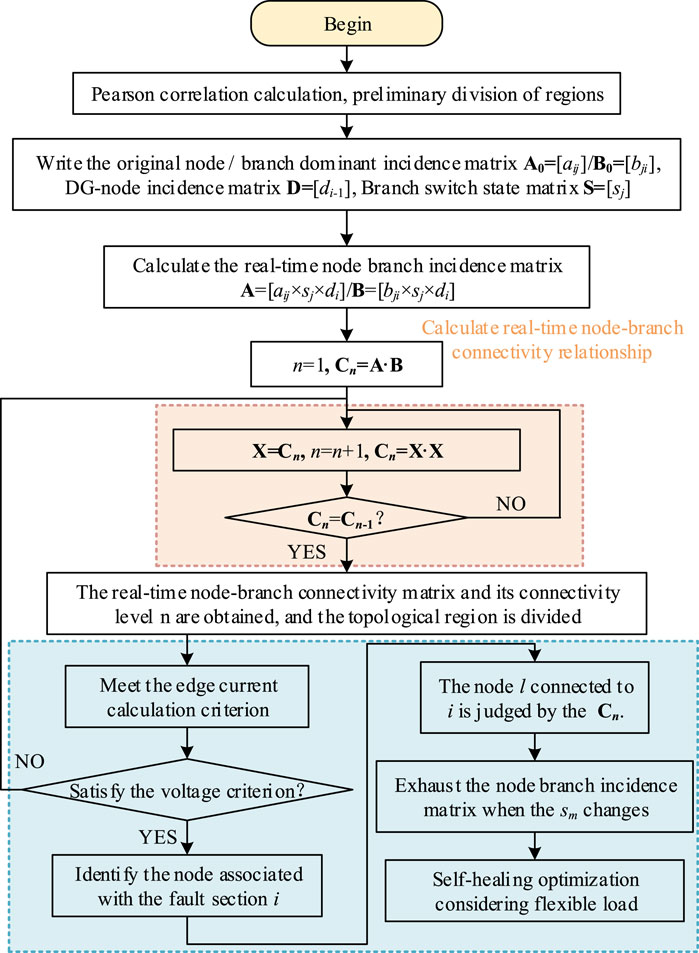
Figure 2. Connected area division flowchart.
3.1 Node correlation calculation
First, to calculate the power flow correlation degree between network nodes and avoid the low correlation degree of the divided area, the Pearson correlation formula is introduced in Equation 1 to preliminarily divide the network topology.
In the formula, ρ represents the correlation coefficient between datasets. The larger the correlation coefficient is, the closer the data relationship is. n is the number of datasets, Xi and Yi are the ith data of two different datasets, and
To ensure the correctness of the correlation calculation results, before performing the correlation calculation, the DistFlow model is used to make the energy of the distribution network node, meeting the following equilibrium conditions as depicted in Equations 2, 3:
In the formula,
3.2 Distribution network structure identification
The topology identification method of the distribution network is generally based on impedance measurement and machine learning methods. Among them, the machine learning method requires the system to have sufficient data volume, and because of the large amount of calculation, it is difficult to meet the requirements of rapidity after fault (Xu et al., 2024; Zhang et al., 2024; Ziyue et al., 2024). Impedance measurement methods require high sensor accuracy, and to avoid the data offset, estimation algorithms are generally used to correct the calculation results, which increase the amount of calculation (Halihal et al., 2024; Fernandes et al., 2023). Therefore, in this paper, we propose a topology identification method that only considers the electrical network association matrix, edge current, and double-ended voltage criterion.
It is assumed that the number of branches corresponds to the number of switches in the topology identification process and that the global number is equal. The real-time branch switch state matrix S of the microgrid is written in parallel. According to the historical information of the microgrid, the original correlation matrices A0 and B0 dominated by nodes and branches are listed, respectively, and its expression is depicted in Equation 4:
In the formula, i is the number of microgrid nodes, j is the number of microgrid branches, 0 and 1 represent the connected state of nodes and branches, respectively, and 0 and 1 represent connected and disconnected, respectively.
According to the known distributed power supply information, the distributed power supply–node correlation matrix is written, as shown in Formula 5. At the same time, according to the original correlation matrix of the microgrid network topology, the real-time branch switching state matrix, and the distributed power–node correlation matrix, the real-time node–branch correlation matrix can be obtained. The expression is as follows:
In the formula, A is the node-dominated incidence matrix, B is the branch-dominated incidence matrix, and D is the distributed power–node correlation matrix.
The following definition is first introduced: if nodes 1 and 2 need to be connected through at least 2n branches, then nodes 1 and 2 are called n-level connected nodes, and the corresponding connectivity matrix is the n-level connectivity matrix. According to the correlation between A and B, the first-level connectivity C1 is calculated, and the connectivity relationship between each node in the microgrid network topology can be obtained. The expression of the connectivity C1 is depicted in Equation 6:
In the formula, C is the transition matrix, the symbol
In the formula, C′ is the transition matrix and Cn-1 is a connected matrix of order n-1.
The node connectivity process stops until the first Cn = Cn-1; that is, the microgrid network topology is at most n-level connectivity, and the amount of the same row or column in the highest-level connectivity matrix is not zero.
3.3 Fault section location
Considering the significant fluctuation of the distributed power flow in the microgrid and the weakening of the difference in electrical characteristics caused by the transmission characteristics of the cable line, it is necessary to avoid the misjudgment of regional location by a single criterion. The fault location module in this paper combines the partition results of the topology identification module, based on the line distribution parameter model, and uses the double-ended instantaneous electrical quantity to form the verification section location criterion. The implementation steps are as follows.
Based on the region division result of topology identification, the execution of system fault location is judged according to the edge current value of the region. At the same time, the result of region division is related to the location of distributed power supply, so the change in electrical positive and negative sequence components at distributed power supply is considered. The positive and negative sequence current expressions of the distributed power supply are depicted in Equation 8:
In the formula,
Based on the inconsistency of the external characteristics of the electrical positive and negative sequence components of the distributed power supply under symmetrical/asymmetrical faults, to ensure the effectiveness of the positioning criteria under all fault conditions, it is necessary to consider the changes in the positive and negative sequence components at the same time. Therefore, the following positioning start-up criteria are derived, as shown in Equation 9:
In the formula,
As shown in Figure 3, DG1 uses local measurement of instantaneous electrical quantities to calculate the transient voltages
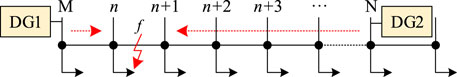
Figure 3. Schematic diagram of the fault location module principle.
The transient voltage of all nodes in the calculation area is traversed, and the transient voltage difference between two adjacent nodes is calculated, as shown in Equation (10), in which
According to the circuit theory, (a) if there is no fault point in the region from M-terminal to N-terminal, the difference is only the voltage decrease caused by a section of line, in which
According to the difference, the fault section is considered. From the above analysis, it can be observed that the difference between the transient voltage calculation values of the two nodes adjacent to the fault point is small, whereas the difference between the transient voltage calculation values of the other two nodes that do not contain the fault point is large. Based on this, the criterion can be designed, as shown in Equation 11:
In the formula, the difference threshold value
Considering the high-resistance fault scenario, the fault current flowing through the line is very small, and the amplitude of
In Equation 12,
Taking the identified fault section as the target section, the fault-related node i is located according to the discriminant result. At this time, the correction matrix X can be written according to the fault location result:
In Equation 13, 0 represents the branch fault and 1 represents the branch without fault.
At this time, the node–branch correlation matrix is modified, and the expression is depicted in Equation 14:
4 Self-healing regulation of the distribution network considering flexible load
4.1 Flexible load
Flexible load resources refer to loads that can flexibly adjust energy consumption behavior and have flexible characteristics, including controllable electrical appliances, energy storage equipment, and electric vehicle charging and discharging. Such load resources can participate in system regulation using power reduction and transfer operation time, which is of great significance for improving system flexibility. In this section, two types of flexible loads, namely, reducible loads and transferable loads, are considered, and their corresponding models are established.
4.1.1 Reducible loads
The reducible loads reduce part of the corresponding power according to the actual situation of the system to meet the system requirements. Its mathematical model is depicted in Equation 15:
In the formula,
The constraints of reducible loads are depicted in Equation 16:
In the formula,
4.1.2 Transferable loads
The transferable load can be operated within an acceptable transfer time period by transferring power from one period to another to meet the needs of system regulation. Therefore, the transferable load needs to meet the three constraints, namely, transfer power range, total transfer power, and transfer time. The formula is as follows.
The transfer power range constraint is depicted in Equation 17:
In the formula,
The transferable load should ensure that the total power of the load participating in the regulation remains unchanged within the acceptable transfer time, so the total transfer power constraint is depicted in Equation 18:
In the formula,
The transition time constraint is presented in Equation 19:
In the formula,
4.2 Self-healing evaluation objective function
The load recovery after a distribution network fault, the number of line switch operations, and the coverage of flexible load regulation are used as evaluation indices in the self-healing process of the distribution network. The optimal evaluation index is used as the objective function to achieve fault self-healing.
4.2.1 Self-healing recovery rate
To fit the actual situation of the distribution network, the load is divided into three levels: 1, 2, and 3, according to the importance of the load of the distribution network node.
When a fault occurs in the distribution network, fault detection and line protection cooperate to isolate the fault section. In the process of fault persistence, the recovery of the remaining load of the distribution network should be considered. This process restores the power supply according to the importance of the load. Based on the load recovery in the self-healing process, the self-healing recovery rate index
In the formula,
The self-healing recovery rate index indicates the power supply situation of loads at all levels under the control of the recovery strategy of the distribution network. The higher the index, the better the recovery degree of the distribution network.
4.2.2 Number of switching operations
In addition to flexible load regulation in the self-healing operation process, the self-healing scheme of the distribution network proposed in this paper also involves isolation operations, load removal operations, and line transfer power supply operation in the islandable operation area. Therefore, the number of operations of the line switch is used as the evaluation index of the self-healing process.
In Equation 21,
In the self-healing process of the distribution network, each switch operation will have an impact on the network and affect the operation stability of the distribution network. Therefore, the operation frequency index of the switch is introduced in the self-healing process of the distribution network, and the operation reliability of the distribution network is improved by reducing the number of changes in the network topology.
4.2.3 Flexible load regulation index
After the grid fault occurs, due to the exit of the fault section, the original power flow distribution balance will be destroyed. At this time, to stabilize the power flow, the power of each line in the distribution network should be changed accordingly. Obviously, the adjustment of the flexible load is more conducive to the power flow recovery of the distribution network.
The influence degree of the fault section on each node will change with the distance and the correlation between nodes. Based on the above considerations, a flexible load regulation index
In the formula,
The flexible load regulation index describes the participation of the flexible load after the fault occurs. The farther the flexible load participating in the distribution network regulation is from the fault section, the smaller the regulation influence is. At the same time, it is necessary to reduce the number of flexible loads involved in the regulation of the distribution network and the workload in the process of distribution network regulation.
4.2.4 Self-healing control cost
In the post-fault regulation stage of the power grid, the distributed power operation cost CDG, the load electricity income CL, the network loss cost Closs, and the flexible load regulation cost CFL are involved. To improve the regulation effect, it is necessary to maximize the regulation cost. Therefore, the objective function Fc of the regulation cost based on the self-healing of the power grid is constructed, and its expression is as follows:
In Equation 23, pWT and pPV are the unit output costs of wind turbine and photovoltaic, respectively; cWT and cPV are the penalty unit prices of abandoning scenery; PtWT and PtWT are the output of wind turbine and photovoltaic in t period, respectively; ΔPtWT and ΔPtWT are the amount of abandoned wind and light in t period, respectively; closs is the unit cost of network loss; Iij,t is the current of line ij at time t; cds is the electricity price of the distribution network load;
The self-healing control cost represents the expense incurred by the power grid during the implementation of the self-healing control process. Under the premise of ensuring the self-healing effect, it is necessary to minimize the self-healing control cost as much as possible.
4.3 Stochastic load model
Relevant research shows that the random variation of electrical network loads exhibits certain regularity. By analyzing a large amount of historical load data and constructing the corresponding probability density function, the grid-connected parameters of each node load are simulated using the Monte Carlo method. Monte Carlo simulation obtains the probability density function of each random process by analyzing historical data, thereby generating a large number of random numbers that follow the probability distribution and extracting random numbers from them to simulate the problem to be solved. The flowchart of each node load simulated using the Monte Carlo method is shown in Figure 4.
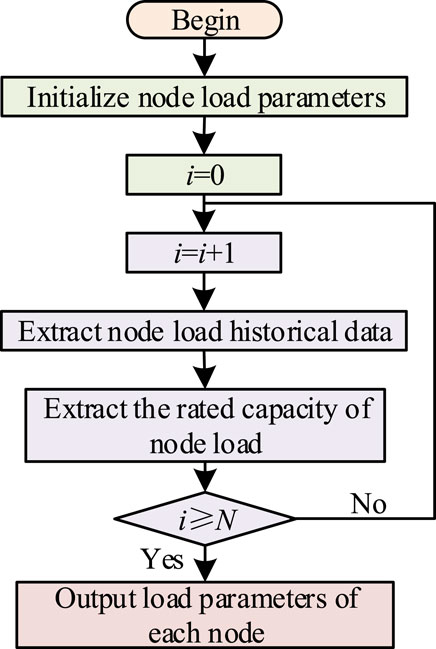
Figure 4. Flowchart of each node load simulated using the Monte Carlo method.
4.4 Other constraints
4.4.1 DistFlow model constraints
Formulas (2) and (3) represent the active and reactive power constraints in the power flow constraint of the distribution network, respectively. Formulas (24) and (25) are the voltage decrease constraint and branch current constraint of the system, respectively.
In the formulas,
4.4.2 Voltage constraints
In Equation 26,
4.4.3 Constraints of the reactive power compensation device
In the formula,
5 Simulation analysis
The standard IEEE33 node model shown in Figure 5 is built in PSCAD/EMTDC. Three DGs, each with a capacity of 400 kW, are connected to nodes 4, 13, and 27, as photovoltaic inverter power supplies. The sampling frequency of the measuring device is set to 10 kHz, and the data window length is selected as T = 20 ms. The unit cost of active power loss is USD 0.8/kWh, the unit output cost of the wind turbine is USD 0.3/kWh, and the unit compensation cost for flexible load participation in regulation is USD 0.25/kWh.
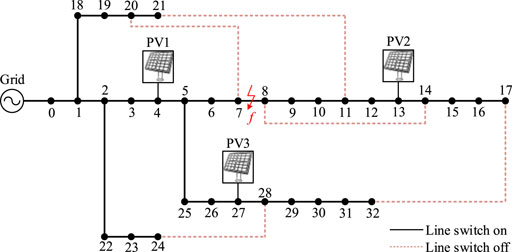
Figure 5. Standard IEEE33 node model A. Electrical network area division simulation.
5.1 Electrical network area division simulation
Through the microgrid network topology partition identification in Section 3.A, the IEEE33 node is divided into several regions. First, the region is initially divided based on correlation calculation. The correlation calculation results are shown in Figure 6.
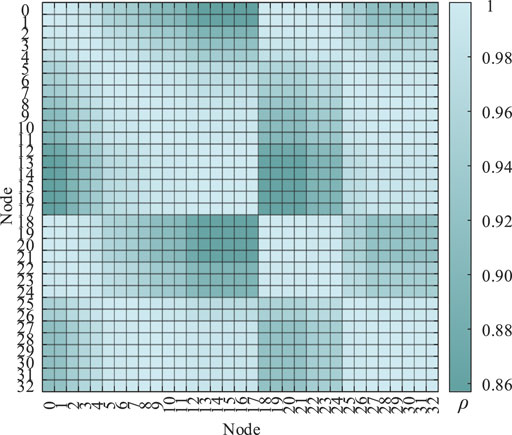
Figure 6. Correlation coefficient calculation result.
The correlation results of Figure 6 are calculated based on the full connected network topology, resulting in varying degrees of correlation strength among nodes. First, the strongest correlation nodes are used as the preliminary basis for the division of topological regions. The preliminary division results are shown in Table 1.
The results of regional division are shown in Table 1. It can be observed from Table 1 that the region can be divided into five subregions according to the strength of the correlation, but the region divisions of 7, 8, 9, 10, 11, and 12 are still missing. This is because these six nodes are located between multiple power sources and their power flow distribution is uncertain.
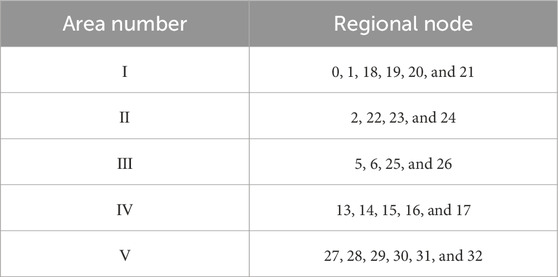
Table 1. Preliminary results of regional division.
As shown in Table 2, the IEEE33 node network topology can be divided into four different regions. Region I is directly connected to the large power grid, and regions II, III, and IV are connected to a distributed power supply.
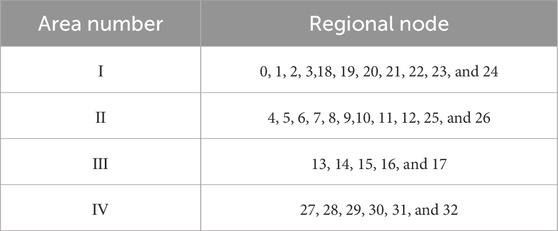
Table 2. Results of the regional division.
As shown in Table 3, the connected node-level table is obtained under the case where the power node is the main connection node. This table represents the connectivity level of each node and the power node in each region.
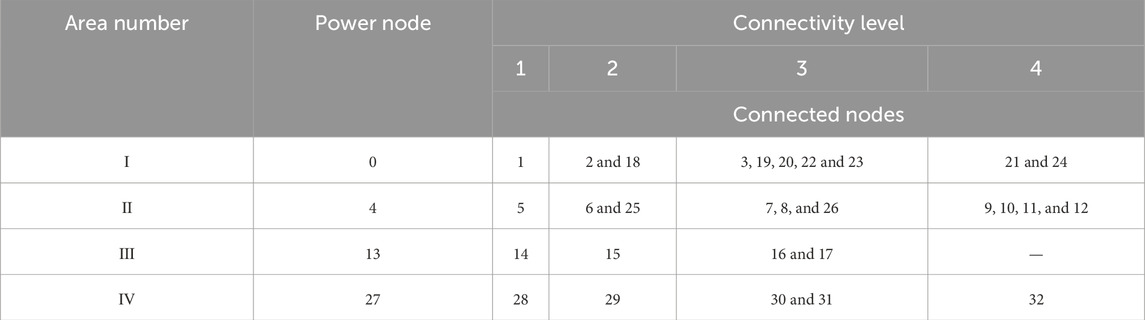
Table 3. Connected node-level table.
5.2 Fault location simulation
The single-phase metal grounding fault at point f, located between nodes 7 and 8, is taken as an example.
First, according to the fault location start criterion (9), Iset1 = 7A and Iset2 = 35 A. After the fault, the negative sequence current appears and exceeds the starting threshold, and the fault location module starts correctly.
Then, using the voltage and current measured on both sides of the PV, the transient voltage of adjacent nodes is calculated according to the differential equation of the line. Voltage
In the time window, the amplitude of
Considering different transition resistances, the difference between two adjacent nodes is calculated, as shown in Table 4.
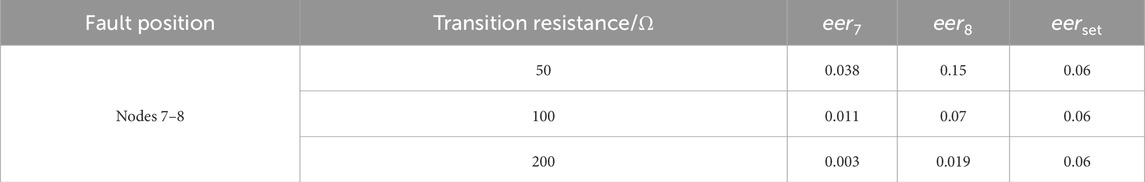
Table 4. Difference with transition resistance.
It can be observed from Table 4 that the criterion
5.3 Distribution network self-healing control optimization simulation
Taking the single-phase metal grounding fault at point f between nodes 7 and 8 as an example, the connectivity levels of other nodes in the network with nodes 7 and 8 are shown in Table 5.
Due to the ideal action of protection, according to the node connection relationship in Table 5, there are four related nodes with a connectivity level of 1, and the local topology diagram is shown in Figure 7. The self-healing evaluation results of the distribution network are shown in Table 6.

Table 5. Nodes 7 and 8 connectivity relationship level.
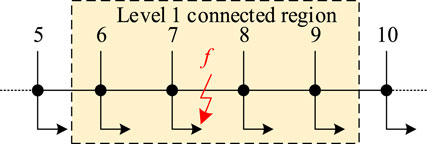
Figure 7. Local topology diagram with connectivity level of 1 (related to nodes 7 and 8).

Table 6. Difference with transition resistance.
The active power and voltage diagrams of distribution network nodes are optimized in Figure 8. The optimization scenario realizes the self-healing of the distribution network fault through the flexible load resource regulation of the first-level connected region. It can be observed from Figure 7 that when the distribution network fails, the self-healing of the distribution network can be realized by regulating the flexible resources of the primary connected region, and the self-healing rate of the distribution network can reach 93.73%. Meanwhile, to ensure the stable operation of the load connected to node 8, the tie-line switch between nodes 11 and 22 needs to be reclosed.
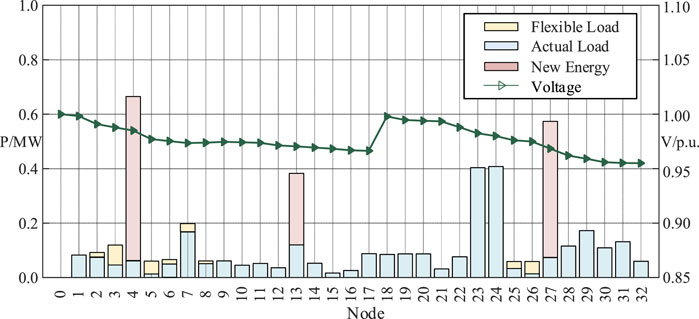
Figure 8. Results of voltage deviation and power change after self-healing regulation.
It can be observed from Figure 8 that after the flexible resource regulation, the voltage values of each node of the distribution network are kept within the voltage constraints, and there is no phenomenon of voltage over-limit.
To further reflect the superiority of the self-healing optimization results based on region division, the following scenarios are optimized and compared.
Case 1: 1-level connectivity. Case 2: 2-level connectivity. Case 3: 3-level connectivity. Case 4: 4-level connectivity. Case 5: global optimization. The flexible load in the abovementioned cases is regulated respectively to realize the self-healing of the distribution network after the fault. The regulation results are shown in Table 7.
From Table 7, it can be observed that in terms of the grid self-healing rate indicator, resource regulation through level-2 connected regions achieved an optimal result of 94.32%, representing a 0.59% improvement compared to Case 1. For the flexible load regulation indicator, resource coordination via level-1-connected regions yielded an optimal value of 0.8337, which is an increase of 0.0659 compared to Case 2. Regarding the self-healing control cost indicator, Case 2 achieved the highest self-healing rate of 94.32%, with fewer flexible load adjustments, resulting in a control cost of $11442.50, which is $2621.20 lower than that of Case 5.
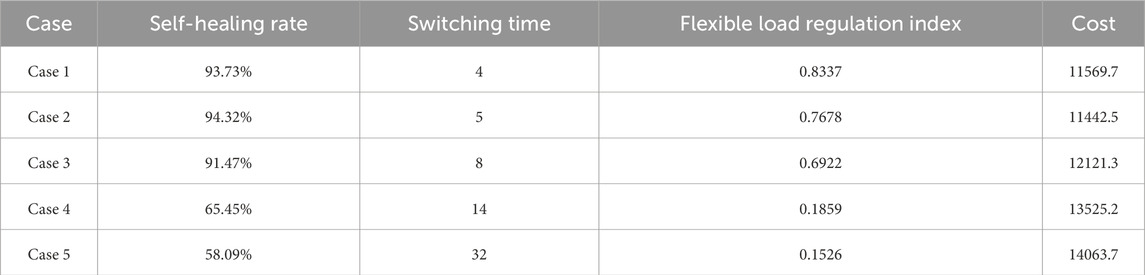
Table 7. Comparison of regulation results.
In general, the control results of Cases 1, 2, and 3 show more than 90% self-healing rate of the distribution network. However, with the increase in flexible load resource regulation, the flexible load regulation index is greatly reduced. At the same time, to ensure the sufficient flexible load regulation index, the self-healing rate of power grid in Case 3 is reduced to 91.47%. The transition from Case 3 to Case 4 indicates that increasing the scope of flexible resource regulation does not necessarily lead to better results. Compared with that in case 1, the flexible load in Cases 2 and 3 covers more areas (e.g., smaller flexible load regulation index). To balance the value of the flexible load regulation index and the self-healing rate, the self-healing rate will gradually decrease. At the same time, the following conclusions can be drawn: with the increase in flexible load regulation resources, the self-healing rate of the distribution network does not increase significantly.
6 Conclusion
In this paper, a flexible load resource regulation method considering electrical network topology partition is proposed to solve the self-healing problem after distribution network fault. The specific conclusions are as follows:
1) By combining power flow correlation analysis, the electrical network correlation matrix, and the fault section location method, the flexible load area that should be involved in self-healing regulation after the distribution network fault is found. The self-recovery of the distribution network after a fault is achieved through flexible load regulation in the target area, reducing the time needed to identify the regulation target.
2) An objective function that combines the self-healing rate of the distribution network, the number of required switches, and flexible load regulation is proposed. The self-healing of the distribution network is achieved with minimal flexible load regulation. While ensuring the self-healing rate of the distribution network, the number of switches required for the self-healing process is reduced, and the coverage area of flexible load regulation is minimized.
3) Through self-healing control measures, the grid self-healing rate was effectively improved to 94.32%, the number of switching operations during the self-healing process was reduced, and the overall cost of the self-healing control process was decreased by $2,621.2 compared to global control strategies.
Data availability statement
The original contributions presented in the study are included in the article/Supplementary Material; further inquiries can be directed to the corresponding author.
Author contributions
PJ: conceptualization, project administration, supervision, validation, writing – original draft, and writing – review and editing. LJ: validation, conceptualization, methodology, writing – review and editing, and resources. WX: writing – review and editing, resources, and software. JY: writing – review and editing and formal analysis. XF: writing – review and editing and investigation.
Funding
The author(s) declare that financial support was received for the research and/or publication of this article.
Conflict of interest
Authors PJ, WX, and XF were employed by State Grid Jiangsu Electric Power Co., Ltd.
Authors LJ and JY were employed by Electric Power Research Institute of Jiangsu Electric Power Co., Ltd.
The authors declare that This research was funded by the Technology Project of State Grid Jiangsu Power Electric Co., Ltd., grant number J2023163. The funder was involved in the research conducted for this study, contributed to the writing and revision of the manuscript, and participated in the decision to submit the article for publication.
Generative AI statement
The author(s) declare that no Generative AI was used in the creation of this manuscript.
Publisher’s note
All claims expressed in this article are solely those of the authors and do not necessarily represent those of their affiliated organizations, or those of the publisher, the editors and the reviewers. Any product that may be evaluated in this article, or claim that may be made by its manufacturer, is not guaranteed or endorsed by the publisher.
References
Almasoudi, F. M. (2023). Enhancing power grid resilience through real-time fault detection and remediation using advanced hybrid machine learning models. Sustainability 15, 8348. doi:10.3390/su15108348
Babakmehr, M., Simões, M. G., Wakin, M. B., and Harirchi, F. (2016). Compressive sensing-based topology identification for smart grids. IEEE Trans. Industrial Inf. 12 (2), 532–543. doi:10.1109/TII.2016.2520396
Bukhari, S. B. A., Wadood, A., Khurshaid, T., Mehmood, K. K., Rhee, S. B., and Kim, K.-C. (2022). Empirical wavelet transform-based intelligent protection scheme for microgrids. Energies 15, 7995. doi:10.3390/en15217995
Casagrande, E., Woon, W. L., Zeineldin, H. H., and Svetinovic, D. (2014). A differential sequence component protection scheme for microgrids with inverter-based distributed generators. IEEE Trans. Smart Grid 5 (1), 29–37. doi:10.1109/tsg.2013.2251017
Cheng, L., Wei, X., Li, M., Huang, P., and Chen, Y. (2024a). Study of flexibility transformation in thermal power enterprises under multi-factor drivers: application of complex-network evolutionary game theory. MATHEMATICS 12 (16), 2537. doi:10.3390/math12162537
Cheng, L., Wei, X., Li, M., Tan, C., Yin, M., Shen, T., et al. (2024b). Integrating evolutionary game-theoretical methods and deep reinforcement learning for adaptive strategy optimization in user-side electricity markets: a comprehensive review. Mathematics 12 (20), 3241. doi:10.3390/math12203241
Elgamasy, M. M., Elezzawy, A. I., Kawady, T. A., Elkalashy, N. I., and Elsadd, M. A. (2024). Tracing passive traveling surge-based fault management control scheme in unearthed distribution systems. Electr. Eng. 106, 5603–5624. doi:10.1007/s00202-024-02283-1
Fan, B., Shu, N., Li, Z., and Li, F. (2023). Critical nodes identification for power grid based on electrical topology and power flow distribution. IEEE Syst. J. 17 (3), 4874–4884. doi:10.1109/JSYST.2022.3227632
Fernandes, T. R., Venkatesh, B., and de Almeida, M. C. (2023). Distribution system topology identification via efficient MILP-based WLAV state estimation. IEEE Trans. Power Syst. 38 (1), 75–84. doi:10.1109/TPWRS.2022.3164600
Gazijahani, F. S., Salehi, J., Shafie-khah, M., and Catalao, J. P. S. (2021). Spatiotemporal splitting of distribution networks into self-healing resilient microgrids using an adjustable interval optimization. IEEE Trans. Industrial Inf. 17 (08), 5218–5229. doi:10.1109/tii.2020.3033560
Halihal, M., Routtenberg, T., and Poor, H. V. (2024). Estimation of complex-valued laplacian matrices for topology identification in power systems. IEEE Trans. Signal Process. 72, 3626–3640. doi:10.1109/TSP.2024.3436524
Huber, J., Imperiali, L., Menzi, D., Musil, F., and Kolar, J. W. (2024). Energy efficiency is not enough. IEEE Power Electron. 11 (01), 18–31. doi:10.1109/mpel.2024.3354013
Jarrahi, M. A., Samet, H., and Ghanbari, T. (2020). Novel change detection and fault classification scheme for AC microgrids. IEEE Syst. J. 14 (3), 3987–3998. doi:10.1109/JSYST.2020.2966686
Kar, S., Samantaray, S. R., and Zadeh, M. D. (2017). Data-mining model based intelligent differential microgrid protection scheme. IEEE Syst. J. 11 (2), 1161–1169. doi:10.1109/jsyst.2014.2380432
Liu, L., Zhang, Z., Wang, N., Zhang, H., and Zhang, Y. (2022). Online resource management of heterogeneous cellular networks powered by grid-connected smart micro grids. IEEE Trans. Wirel. Commun. 21 (10), 8416–8430. doi:10.1109/TWC.2022.3165975
Lu, J., Su, J., Zhao, R., Chen, F., Wang, Q., and Yan, W. (2024). A fast and accurate self-healing scheme for intelligent distribution networks using mixed integer linear programming. IEEE Access 12, 21586–21595. doi:10.1109/ACCESS.2024.3362798
Lv, C., Liang, R., and Chai, Y. (2023). Decentralized bilateral risk-based self-healing strategy for power distribution network with potentials from central energy stations. J. Mod. Power Syst. Clean Energy 11 (1), 179–190. doi:10.35833/MPCE.2022.000436
Mousavizadeh, S., Alahyari, A., Movahhed Ghodsinya, S. R., and Haghifam, M.-R. (2021). Incorporating microgrids coupling with utilization of flexible switching to enhance self-healing ability of electric distribution systems. Prot. Control Mod. Power Syst. 6 (3), 24–11. doi:10.1186/s41601-021-00197-9
Pappu, S. J., Bhatt, N., Pasumarthy, R., and Rajeswaran, A. (2018). Identifying topology of low voltage distribution networks based on smart meter data. IEEE Trans. Smart Grid 9 (5), 5113–5122. doi:10.1109/TSG.2017.2680542
Pignati, M., Zanni, L., Romano, P., Cherkaoui, R., and Paolone, M. (2017). Fault detection and Faulted line identification in active distribution networks using synchrophasors-based real-time state estimation. IEEE Trans. Power Deliv. 32 (1), 381–392. doi:10.1109/TPWRD.2016.2545923
Roy, B., Adhikari, S., Datta, S., Devi, K. J., Devi, A. D., Alsaif, F., et al. (2023). Deep learning based relay for online fault detection, classification, and Fault Location in a grid-connected microgrid. IEEE Access 11, 62674–62696. doi:10.1109/ACCESS.2023.3285768
Satea, M., Elsadd, M., Zaky, M., and Elgamasy, M. (2024). Reliable high impedance fault detection with experimental investigation in distribution systems. Eng. Technol. Appl. Sci. Res. 14 (5), 17248–17255. doi:10.48084/etasr.8292
Shen, F., Wu, Q., and Xue, Y. (2020b). Review of service restoration for distribution networks. J. Mod. Power Syst. Clean Energy 8 (1), 1–14. doi:10.35833/MPCE.2018.000782
Shen, Y., Fu, X., Giannakis, G. B., and Sidiropoulos, N. D. (2020a). Topology identification of directed graphs via joint diagonalization of correlation matrices. IEEE Trans. Signal Inf. Process. Over Netw. 6, 271–283. doi:10.1109/TSIPN.2020.2984131
Srivastava, A., and Parida, S. K. (2022). A robust fault detection and location prediction module using support vector machine and Gaussian process regression for AC microgrid. IEEE Trans. Industry Appl. 58 (01), 930–939. doi:10.1109/tia.2021.3129982
Tariq, R., Alhamrouni, I., Rehman, A. U., Tag Eldin, E., Shafiq, M., Ghamry, N. A., et al. (2022). An optimized solution for fault detection and location in underground cables based on traveling waves. Energies 15, 6468. doi:10.3390/en15176468
Wang, C., Feng, L., Hou, S., Ren, G., and Wang, W. (2024c). A method for single-phase ground fault section location in distribution networks based on improved empirical wavelet transform and graph isomorphic networks. Information 15, 650. doi:10.3390/info15100650
Wang, C., Lou, Z., Li, M., Zhu, C., and Jing, D. (2024a). Identification of distribution network topology and line parameter based on smart meter measurements. Energies 17, 830. doi:10.3390/en17040830
Wang, Y., Shen, X., Tang, X., and Liu, J. (2024b). A joint estimation method of distribution network topology and line parameters based on power flow graph convolutional networks. Energies 17, 5272. doi:10.3390/en17215272
Wei, C., Tu, C., Song, W., and Xiao, F. (2023). Fault seamless self-healing method of regional distributed network based on the cooperation of source-load-storage. Sustainability 15, 8099. doi:10.3390/su15108099
Weinand, J. M., Ried, S., Kleinebrahm, M., McKenna, R., and Fichtner, W. (2022). Identification of potential off-grid municipalities with 100% renewable energy supply for future design of power grids. IEEE Trans. Power Syst. 37 (4), 3321–3330. doi:10.1109/TPWRS.2020.3033747
Wu, T., Cai, S., Dai, W., Zhu, Y., Liu, X., and Li, X. (2022). Interturn short fault detection and location of permanent magnet wind generator based on negative sequence current residuals. Energies 15, 9441. doi:10.3390/en15249441
Xu, D., Wu, Z., Xu, J., and Hu, Q. (2024). Data-model hybrid driven topology identification framework for distribution networks. CSEE J. Power Energy Syst. 10 (4), 1478–1490. doi:10.17775/CSEEJPES.2021.06260
Zhang, X., Li, Z., Wang, Y., Huang, Y., Tian, X., and Li, X. (2024). “Research on topology identification algorithm for distribution network with distributed photovoltaics based on deep forest,” in 2024 IEEE 7th advanced information technology, electronic and automation control conference (IAEAC). Chongqing, 1316–1320. doi:10.1109/IAEAC59436.2024.10503811
Keywords: distribution network, fault self-healing, correlation analysis, flexible load, correlation matrix
Citation: Jinian P, Juan L, Xiuru W, Yunlong J and Fei X (2025) Distribution network fault self-healing scheme based on network partition and flexible resource aggregation. Front. Energy Res. 13:1538033. doi: 10.3389/fenrg.2025.1538033
Received: 02 December 2024; Accepted: 11 June 2025;
Published: 01 July 2025.
Edited by:
Yiji Lu, University of Glasgow, United KingdomReviewed by:
Ehsan Naderi, Arkansas State University, United StatesMahmoud Elsadd, Damanhour University, Egypt
Copyright © 2025 Jinian, Juan, Xiuru, Yunlong and Fei. This is an open-access article distributed under the terms of the Creative Commons Attribution License (CC BY). The use, distribution or reproduction in other forums is permitted, provided the original author(s) and the copyright owner(s) are credited and that the original publication in this journal is cited, in accordance with accepted academic practice. No use, distribution or reproduction is permitted which does not comply with these terms.
*Correspondence: Pang Jinian, d3dkXzg4MjAyMkAxNjMuY29t