 Tian Zhao1
 Meilu Sun
- 1School of Economics and Management, Shandong University of Science and Technology, Qingdao, China
- 2School of Economics and Management, Shanghai University of Political Science and Law, Shanghai, China
Introduction: Analyzing the dynamic evolution and convergence of innovation efficiency in China’s new energy enterprises is critical for optimizing energy structures and guiding high-quality development under dual-carbon goals. This study examines spatiotemporal patterns and drivers from 2015–2023.
Methods: Innovation efficiency was measured via SFA model, differentiating R&D and transformation phases. σ- and β-convergence tracked disparities and catch-up dynamics. A threshold regression model identified nonlinear macroeconomic impacts on convergence, using 2,182 firm-year observations across 30 provinces.
Results: (1) The innovation efficiency of China’s new energy enterprises is relatively low, with significant spatial and temporal differences but a consistent upward trend. Specifically, the innovation efficiency of China’s new energy enterprises ranges from 0.55 to 0.71 in the R&D phase and from 0.13 to 0.51 in the transformation phase. (2) 1/3 of the new energy enterprises show a high R&D-high transformation mode, while another 1/3 operate under a low R&D-low transformation mode. The σ-convergence of innovation efficiency across provinces is not evident, except for the R&D phase of enterprises in the eastern and western regions, where substantial β-convergence is observed. (3) The threshold model suggests that urbanization construction and economic development play a crucial role in influencing the convergence of innovation efficiency among China’s new energy enterprises.
Discussion: Persistent R&D-transformation gaps necessitate region-specific policies. Western China should enhance technology absorption, while central/eastern regions require optimized innovation ecosystems.
1 Introduction
The dual carbon goals, especially carbon neutrality, have had global consequences. As of the end of 2024, over 151 nations had adopted the carbon neutrality targets. China, being a major manufacturing power, is increasing its carbon emissions along with its expanding production capacity, making it the greatest emitter of greenhouse gases according to data from the International Energy Agency. China has set the target of peaking carbon dioxide emissions by 2030 and achieving carbon neutrality by 2060. However, it faces the challenge of relative scarcity of natural resources such as oil and gas, which hinders the high-quality economic development. New energy, with its wide distribution, large reserves and low pollution, has become the strategic direction of energy industry development in various countries, and is a key industry to cope with climate change and achieve the goal of carbon neutrality. Since 2015, China’s new energy sectors (including wind power, solar PV and lithium-ion batteries) have been developing rapidly, and the success of these sectors depends on the cost-cutting effect of continuous innovation. Given the relatively low barriers to entry in the new energy industry, inefficient investment and excessive competition are widespread, leading to a mismatch between input and output and hindering the improvement of innovation efficiency. Furthermore, the innovation efficiency of China’s new energy enterprises varies significantly over time and space, which directly affects the competitiveness of the energy industry and the dual carbon process.
The regions to which new energy enterprises belong have natural differences in R&D input and innovation output due to differences in their economy, technology, natural endowment and other aspects. Understanding how to strengthen the complementary innovation resources between enterprises and regions, how to help low-efficiency enterprises achieve high-quality innovative development, and whether high-efficiency enterprises should be more open or more cautious in the middle and later stages of operation, has positive practical significance for the long-term healthy, stable and orderly development of the new energy industry. There are two problems in the research literature on innovation efficiency of new energy firms. First, most researches measure innovation efficiency from a static point of view, without fully investigating the different performances of innovation activities at different stages. Therefore, this paper uses Stochastic Frontier Analysis (SFA) to dynamically evaluate the innovation efficiency of new energy enterprises in China, and analyses it from the perspective of input and transformation, which is helpful to improve the calculation accuracy. Second, most researches stop at the convergence analysis, and the non-linear influence of related factors is not sufficiently investigated. Therefore, this paper establishes a threshold model based on β-convergence, and examines whether representative factors have a nonlinear influence on the convergence of innovation efficiency of new energy enterprises from a macro perspective.
The structure of this paper is as follows. Firstly, a literature review is provided to identify potential areas for improving the calculation of innovation efficiency in new energy enterprises. Then, the paper applies the SFA method to evaluate and compare the innovation efficiency of China’s new energy enterprises from 2015 to 2023, considering both R&D input and transformative performance. The dynamic development of innovation efficiency is analyzed using the σ-convergence and β-convergence methods, complemented by the threshold model, to identify crucial factors influencing the convergence trend. Finally, the paper concludes with a summary of the main findings and policy recommendations.
2 Literature review
2.1 Measurement methods of innovation efficiency
Research on innovation efficiency originated with Scherer (1965), and although the Cobb-Douglas function and Solow’s (1957) analysis of technological progress indirectly reflected innovation efficiency, there was a significant gap between their assumptions and reality. Today, there are various methods of measuring innovation efficiency. The most widely used methods are Data Envelopment Analysis (DEA) and Stochastic Frontier Approach (SFA). DEA, based on linear programming, does not depend on specific functional forms, but is sensitive to errors and missing sample data. SFA, on the other hand, uses econometrics techniques for maximum likelihood estimation, resulting in stable efficiency measures, but requires the a priori specification of the production function and the consideration of stationary and cointegration relationships between variables. As methods for measuring innovation efficiency have evolved, more studies have included the influence of spatial-temporal factors. Consequently, the three-stage DEA method (Lartey et al., 2021), the two-stage dynamic network DEA model (Xiong et al., 2018), the method combining the SBM model (Shah et al., 2024), the Malmquist index (Mitrovic, 2020), the non-radial super-efficiency model (Chang et al., 2013), and the Malmquist-Luenberger index (Romano et al., 2021) have been developed based on the DEA or SFA method.
2.2 Analysis methods of dynamic evolution
Currently, studies into the dynamic evolution of efficiency primarily takes into account the perspectives of heterogeneous segments or spatial correlation (Zhu et al., 2019; Magnani et al., 2022), with the most commonly employed method being convergence analysis. The focus on convergence stems from the investigation of the limit of series in mathematics. The analysis of economic convergence can be traced back to Ramsey’s (1928) work on economic growth rate and per capita income. Baumol (1986) was the pioneer in conducting empirical testing of economic development convergence trends, grounded on Solow’s neoclassical growth model. The scope of convergence research has widened with extensive research on capacity utilization rate convergence (Gahn and González, 2022), regional growth rate convergence (Battisti and Vaio, 2008), energy intensity conditions convergence (Lin and Zhu, 2021) and other related topics. Regarding the efficiency convergence, σ-convergence and β-convergence (Zhang et al., 2022) have been predominant. However, these methods can sometimes mask underlying disparities or convergence patterns due to their broad evaluative scope. Club convergence (Cassetta et al., 2022) builds on β-convergence by identifying subgroups displaying distinct convergence behaviors, but it still may not account for the full spectrum of multi-dimensional influences affecting sectoral efficiency, such as innovation policies, global market integration, and regional economic systems.
2.3 Relevant research on the innovation of new energy enterprises
Research on new energy enterprise innovation predominantly centers on the new energy vehicle industry. Various scholars have examined the effect of trade policy uncertainty on enterprise innovation (Hs and Fei, 2021), the impact of multi-dimensional proximity on cooperative innovation (Yu et al., 2018), and the efficacy of different forms of subsidies on enterprise innovation and progress (Liu et al., 2022). However, current research on innovation within the new energy industry at the national level concentrates mainly on measuring investment or production efficiency, without exploring innovation efficiency in depth. Wen et al. (2022) conducted a study using data from China’s listed new energy firms from 2007 to 2019 to examine the link between fiscal policy uncertainty and enterprise innovation investment was examined. The research findings indicate that the uncertainty surrounding fiscal policies significantly reduced the investment in innovation by new energy enterprises. In another study by Chen et al. (2022), the innovation efficiency of the new energy vehicle industry was analyzed from the perspective of the industrial chain. The study highlighted the significant contribution of management efficiency in driving industrial innovation efficiency. Wang et al. (2021) examined the determinants affecting the innovation performance of new energy enterprises in China under industrial policy’s purview, utilizing a genetic algorithm for evaluation purposes.
In conclusion, the existing literature has laid a solid foundation for studying the innovation efficiency of new energy enterprises, and identifies gaps for further exploration in the following areas: First, the existing literature primarily concentrates on static analysis. Nonetheless, the disproportionate growth of China’s new energy in different regions emphasize the need for dynamic approaches. The static measurement approach inadequately investigates the impact of spatial factors. Consequently, this has compromised the precision of the measurement outcomes. Though some studies have implemented the frontier analysis method, it has not sufficiently distinguished between distinct phases of R&D activities. Second, for the trend analysis of evolution typically, σ-convergence and β-convergence methods are utilized. However, a lack of thorough discussion exists concerning the primary drivers of innovation efficiency evolution in new energy firms. Although conditional β-convergence may be employed for linear analysis of influencing factors, it fails to fully reflect the intricate and nonlinear impact of related factors on the innovation efficiency of the new energy industry. This consideration is especially crucial considering the industry’s rapid development in recent years. This paper tackles the mentioned matters by the SFA model to assess the innovation efficiency of China’s new energy enterprises, and proposed a threshold model grounded on β-convergence to investigate the main factors’ impact on the innovation efficiency’s dynamic evolution.
3 Calculation process and results
3.1 Methods and models
3.1.1 Research method
Innovation efficiency refers to the input-output ratio of innovation behavior. There are different techniques for measuring efficiency, each with its own strengths and weaknesses. The frontier analysis method is commonly used in research on innovation efficiency. The frontier analysis method is widely accepted in research on innovation efficiency. In this study, the SFA model is implemented for the following reasons: Firstly, the primary objective of this paper is to examine the innovation efficiency of new energy enterprises and their dynamic evolution, requiring comparable innovation efficiency values over various frames. However, the DEA method, while calculating efficiency values, lacks horizontal comparability due to mostly relying on static data. Although certain academics have derived the two-phase variation of efficiency value by integrating the Malmquist index or other methodologies, it necessitates high data quality and requires a balanced panel data, which may result in data loss and introduce sample selection bias and other issues. Secondly, SFA is a parametric method, which assumes the specific forms of production functions and estimates the parameters in these functions, which can provide the basis for the subsequent convergence test and analysis of influencing factors in this paper. As a nonparametric method, DEA, although flexible, cannot provide such in-depth statistical analysis. Thirdly, in the process of innovation development, various unpredictable and stochastic factors exert a significant impact on innovation output. The DEA model creates distinct production frontiers for different time periods, typically labeling any actual output below the frontiers as technical inefficiencies without considering the influence of random factors. On the other hand, the SFA model incorporates this theoretical logic and constructs a unique production frontier using panel data. Hence, the SFA model can be designed based on innovation efficiency and data features. Furthermore, taking into account that innovation activities are usually assessed based on input and output, the innovation efficiency of China’s listed new energy companies can be evaluated in the two phases: R&D and transformation, which enables a categorized and comparative analysis.
3.1.2 SFA model
The model’s specific form is established based on Solow’s analysis framework for economic growth, assuming that the non-efficiency term μ has time-varying characteristics. The innovation efficiency of new energy enterprises is separately measured during the phases of R&D and transformation. To be more precise, Equation 1 selects the selection of output variables during the R&D phase, directly reflecting the number of patent applications. On the other hand, variables such as the count of personnel engaged in R&D and the total capital investment allocated to R&D can be interpreted as input indicators.
In Equation 2, the output variable of the transformation phase is represented by total profit. While other scholars have used the sales revenue of new products to evaluate the outcome of innovation transformation (Hall and Mairesse, 1995), this study chooses to measure the output of the second phase with the metric of total profit. This decision takes into account the distinctive attributes of new energy enterprises and the two-fold purposes of technological advancement, which include minimizing expenses and elevating operational earnings. Regarding the input factors, they are denoted by means of metrics like the number of R&D personnel, the aggregation of R&D capital, and knowledge capital.
In Equations 1,2, each sample firm is identified as a Decision Making Unit (DMU), with
Let
3.2 Variables and data
As of the end of 2024, a total of 189 stocks related to the new energy concept were accounted for in China’s combined A-Shares (including Main Board, Small and Medium-Sized Board, Growth Enterprise Board, Science and Technology Innovation Board) and B-Shares. To obtain a comprehensive dataset, China’s listed companies’ data was cross-referenced, which led to the acquisition of 2,182 valid samples representing new energy enterprises. These samples were obtained by excluding missing or zero-value data from patent applications, R&D personnel, and R&D investment indicators. The relevant variables were obtained from the CSMAR database and the Wind databases. Given the significant growth of China’s new energy sector in the past decade, this study examines the period from 2015 to 2023. It is noteworthy that the process of accumulating R&D input requires capital transformation via R&D investment; however, the knowledge capital factor can only be calculated subsequently.
3.2.1 Capital accumulation
Since the collected data in this study constitutes unbalanced panel data, it is vital that the research findings comprehensively reflect the innovative development of new energy enterprises. To handle missing values, we refrain from using methods such as deletion or interpolation filling, instead of calculating the accumulation of R&D capital based on specific assumptions to create a balanced panel. Specifically, the assumption is that all enterprises were established in 1998 initially, with R&D investment made in each year between the start of 1998 and the sample year. Also, it is assumed that the growth rate of R&D enterprise investment for a particular province is identical to the growth rate of R&D internal expenditure of the province, enabling the computation of enterprises’ R&D investment in previous years since 1998. By employing the fixed asset price index of each province, the annual investment’s nominal value of the annual investment can be deflated to calculate the actual investment amount. The depreciation rate is set at 15% based on various classical literature assumptions, and the perpetual inventory method is used for determining the capital accumulation of R&D:
3.2.2 Knowledge capital
The calculation of knowledge capital follows the same logic as that of capital accumulation using the perpetual inventory method:
3.3 Measurement results and interpretation
The Maximum Likelihood Estimate is used to estimate the stochastic frontier production function displayed in Equations 1,2, and to estimate the SFA model parameters, as shown in Table 1.
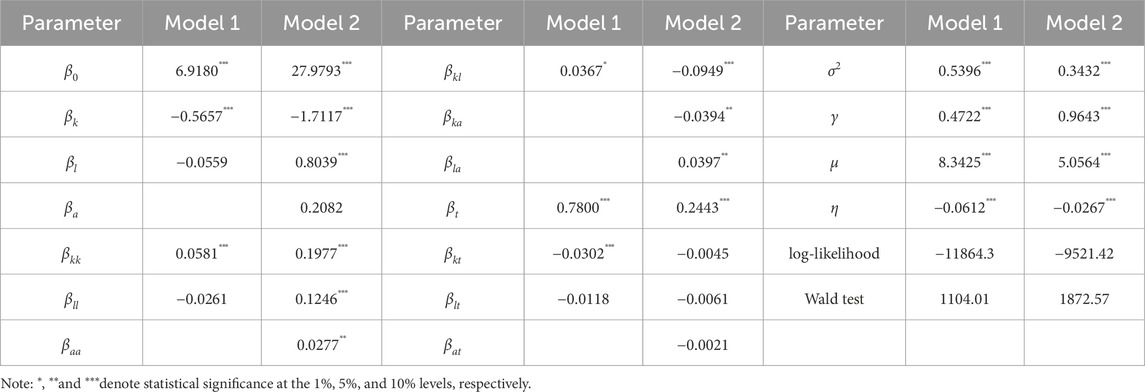
Table 1. Estimated coefficients of the SFA model.
Most of the parameters in the two models have passed the significance test. Additionally, both
3.3.1 Measurement results
The SFA model is employed to measure the innovation efficiency of China’s listed new energy companies throughout the R&D and transformation period from 2015 to 2023. The data pertaining to the innovation efficiency of the selected enterprises has been systematized and condensed based on their respective provinces to enable easy representation and examination. The results are shown in Table 2.

Table 2. Innovation efficiency by SFA model.
Consistent with the majority of existing literature’s static measurements, China’s new energy enterprises continue to exhibit low innovation efficiency. After breaking down the various of R&D innovation, this paper finds that the mean innovation efficiency in the technology R&D phase is 0.64, while the mean innovation efficiency in the achievement transformation phase is 0.37.
From the perspective of R&D, new energy enterprises throughout 30 provinces demonstrate innovation efficiency ranging from 0.55 to 0.71, with a median of 0.635. The top six provinces in terms of innovation efficiency, with a range of 0.69–0.71, are Liaoning, Hubei, Shanghai, Zhejiang, Shandong and Henan. The five provinces with the lowest innovation efficiency, ranging from 0.55 to 0.58, are Jiangxi, Nei Mongol, Shanxi, Shaanxi and Hunan. The innovation efficiency of new energy enterprises during the technological R&D phase is relatively even (0.16), suggesting a balanced state. Among them, Liaoning displays the highest level of innovation efficiency (0.71) due to the local government’s support policies for new energy and the traits of the enterprises. The new energy battery materials produced by Oxiran Shares, such as their vinyl carbonate series, serves as a remarkable example of world-renowned innovation accomplishments. The materials demonstrate a remarkable control mechanism in the industrial and supply chain, providing a robust basis for increased innovation investment. In contrast, Hunan exhibits the lowest innovation efficiency (0.55) amongst the provinces. Similarly, provinces holding extensive conventional coal reserves like Shanxi and Nei Mongol rank comparably low in new energy innovation efficiency. It is imperative to address the issue of phased retreat from fossil fuels and the implementation of renewable energy. Achieving an optimal balance between coal and new energy resources is an essential aspect of the dual carbon strategy.
From the perspective of transformation, the innovation efficiency of new energy enterprises across 30 provinces varies between 0.13 and 0.51, with a median of 0.37. The top five provinces based on innovation efficiency are Hebei, Gansu, Anhui, Jiangxi and Liaoning, with efficiency levels ranging from 0.43 to 0.51. On the other hand, the bottom five provinces are Shanxi, Nei Mongol, Hunan, Yunnan and Chongqing, with innovation efficiency ranging from 0.13 to 0.28. Hebei exhibits the highest innovation efficiency (0.51), whereas Chongqing has the lowest (0.12). The range of innovation efficiency during the transformation phase is considerably wider. Hebei’s figure is around 4 times that of Chongqing. This discrepancy may be due to the limited innovation accomplishments of Chongqing’s small number and scale of new energy firms, leading to lower transformation efficiency. On the other hand, new energy enterprises in Hebei are not only numerous but also excel in the transformation process. For example, Tonhe Technology’s smart power grid and new energy vehicle module products, as well as Baobian Electric’s transformer proprietary technologies, are globally recognized for their pioneering advancements. This highlights the significant influence of innovation transformation in these industries.
The coastal provinces exhibit higher levels of innovation efficiency in the R&D phase, whereas inland provinces exhibit relatively low efficiency. The significant economic growth in the coastal regions provides new energy businesses with improved access to resources, consequently promoting a continuous enhancement of innovative efficiency. However, it is noteworthy that while there is an overall decreasing trend in innovation efficiency from the southeast coastal area to the northwest inland area, Ningxia and Xinjiang display higher levels of innovation efficiency in the R&D phase. Conversely, Gansu, Ningxia, and Sichuan provinces show greater innovation efficiency during the transformation phase. This outcome suggests that specific energy enterprises in the western provinces have unique traits in taking advantage of their late-mover benefits and pursuing enhanced innovation effectiveness, emphasizing the need for additional guidance and development.
3.3.2 Results of different regions
Figure 1 illustrates a critical analysis of innovation efficiency levels observed during the R&D and transformation phases across the eastern, central, and western regions. This comparison is visualized through a bitmap representation. The results indicate a noticeable, stepwise decline pattern in the innovation efficiency of new energy enterprises. The average innovation efficiencies for the eastern, central, and western regions during the R&D phase are 0.67, 0.62, and 0.61, respectively. The innovation efficiency is greater in the eastern region than the national average of 0.64, although it is in close alignment with it. Notably, there are significant disparities in the innovation efficiencies between enterprises across different regions, particularly within the central area. When transitioning to the transformation phase, it can be observed that the innovation efficiencies of new energy enterprises in the eastern, central, and western regions are 0.40, 0.38, and 0.32, correspondingly. The innovation efficiencies in the eastern and central regions surpass the national average level of 0.37, with the eastern region exhibiting an innovation efficiency 1.25 times that of the western region. The eastern and western regions exhibit the most noticeable differences among themselves in terms of innovation efficiency, while the central region demonstrates the most similarity, which is particularly true for new energy enterprises.
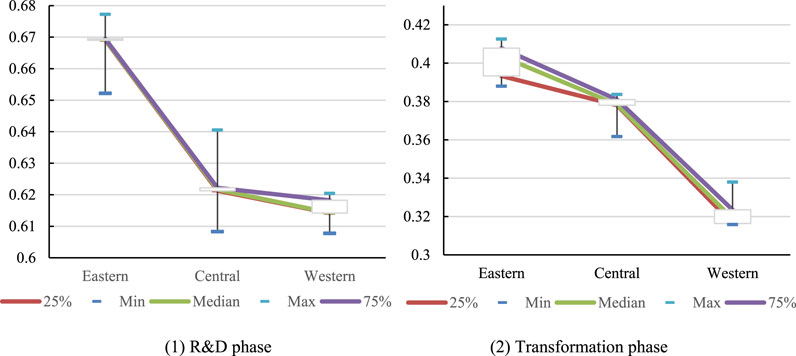
Figure 1. (1) R&D phase (2) Transformation phase. Comparison of innovation efficiency in different regions.
3.3.3 Results of differentiated R&D model
The previous discussion on classification highlights considerable variations in the innovation efficiencies of new energy enterprises throughout different phases, indicating that a simplistic classification fails to fully reflect attributes. Consequently, taking the median of the innovation efficiency (0.635 and 0.380) in the R&D and transformation phases as the dividing line, the innovation modes of China’s new energy enterprises can be categorized by province as illustrated in Table 3.
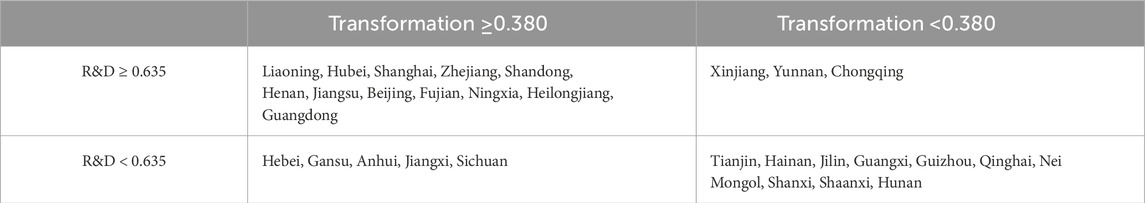
Table 3. Modes of new energy enterprises in each province.
Mode 1, high R&D-high transformation: The innovation efficiency is ≥0.635 in the R&D phase and ≥0.380 in the transformation phase. This mode consists of 12 provinces, which make up over 1/3 of the total sample, with eight of them situated in the eastern region. This exhibits a relatively efficient innovation model. Hubei, Shanghai, Zhejiang, Beijing and Fujian perform the best in the R&D phase. However, their innovation efficiency during the transformation phase falls between 0.38 and 0.39, indicating a comparatively lower status.
Mode 2, high R&D-low transformation: The innovation efficiency is ≥0.635 in the R&D phase and <0.380 in the transformation phase. This mode comprises three provinces, all situated in the western region. These provinces demonstrate insufficient transformation capability with their innovation efficiency ranging from 0.64 to 0.65 in the R&D phase. However, during the transformation phase, their efficiency falls below the median, with Yunnan and Chongqing in particular, occupying the last two positions in this phase. To improve the situation, the next step should concentrate on improving the uptake and utilization of existing scientific and technological progress. Policies that aid the transformation of scientific and technological advancements, enhance the innovation ecosystem for transformation, and improve the efficiency of converting scientific and technological achievements should be introduced.
Mode 3, with low R&D-high transformation: The innovation efficiency is <0.635 in the R&D phase and ≥0.380 in the transformation phase. This mode comprises five provinces. Sichuan is ranked 17th among these provinces in terms of innovation efficiency for new energy enterprises in both the R&D and the transformation phases indicating its relative proximity to the median value. The innovation efficiency in Hebei, Gansu, Anhui, and Jiangxi in the R&D phase concentrates within the range of 0.58–0.62, meeting the lower-middle level. In contrast, they rank amongst the top four in the transformation phase and exhibit an impressive capability to innovate, despite their limited research and development capacity. Therefore, new energy enterprises in these four provinces should raise their investment in the R&D phase.
Mode 4, low R&D-low transformation: The innovation efficiency is <0.635, and <0.380 in the transformation phase. This model comprises 10 provinces, accounting for 1/3 of the total sample. Additionally, provinces in the western region account for 1/2 of the total sample. The innovation efficiency of new energy enterprises with this mode is generally low, thus necessitating the implementation of preferential policies by the government to stimulate their innovation potential.
4 Convergence analysis
To examine the evolutionary trend and characteristics of the innovation efficiency gap among new energy enterprises, convergence analysis can be employed. This study utilizes σ-convergence, absolute β-convergence, and conditional β-convergence as dynamic and comprehensive approaches to investigate the aforementioned aspects. This leads to a greater understanding of the evolutionary patterns related to innovation efficiency in new energy enterprises over time.
4.1 σ-convergence
σ-convergence describes the narrowing average gap in innovation efficiency between new energy enterprises over time. This notion aligns with real-world convergence in reality and assesses the changing dispersion degree of innovation efficiency. A rise in σ indicates regional differences closing and converging towards the mean value. The presence of σ-convergence implies a gradual reduction of the innovation efficiency gap between energy businesses across various regions over a period of time.
The methods for measuring σ-convergence encompass the coefficient of variation, Theil index, Herfindahl index, Gini coefficient, etc. For this study, the most widely used coefficient of variation is selected for measurement, as shown in Equation 3:
During the R&D phase, based on Table 4, the coefficient of variation ranges between 0.030 and 0.044, indicating considerable disparities in innovation efficiency across these enterprises. The coefficient of variation first increased, which means that the differences in innovation efficiency of sample enterprises began to expand, probably because a series of supporting policies helped some enterprises develop new technologies or improve production processes after 2015. With the passage of time, the coefficient of variation starts to decrease again, that is, the growth rate of the former leading enterprises slows down, and the latecomers begin to catch up, resulting in a narrowing of the difference in innovation efficiency. However, there is limited evidence of σ-convergence. In the eastern region of China, the variation coefficient of innovation efficiency ranges from 0.041 to 0.058. The trend shows a clear decrease in dispersion, with a gradual stability between 2015 and 2023, indicating a significant σ-convergence among new energy enterprises in the R&D phase within the eastern region. Within the central region, the variation coefficient of innovation efficiency ranges from 0.093 to 0.123. The level of variation fluctuates, suggesting the negligible σ-convergence during the R&D phase of new energy enterprises in the central region. Conversely, the western region displays a variation coefficient within the range of 0.060–0.093, with a slight decrease in variation. Despite showing an upward trend in 2017, the overall trend demonstrates a downward trajectory, suggesting there is σ-convergence in the R&D phase within the western region.
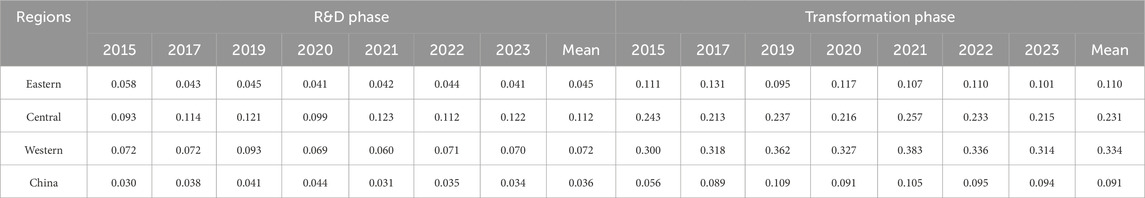
Table 4. σ-convergence.
During the transformation phase, the data presented in Table 4 demonstrates an initially increases and then decreases in the dispersion of innovation efficiency amongst new energy enterprises across the country. The coefficient of variation is within the range of 0.056–0.109, indicating substantial variation in innovation efficiency throughout the country but no significant σ-convergence. In the eastern region, the variability coefficient of innovation efficiency ranges from 0.095 to 0.131. There has been minimal change in the overall dispersion, indicating a relatively stable state with no significant σ-convergence. In the central region, the variation coefficient of innovation efficiency ranges from 0.213 to 0.257. The degree of dispersion remains relatively stable nationwide, indicating no significant σ-convergence. In the western region, variation coefficient of innovation efficiency ranges between 0.300 and 0.383 with the degree of dispersion showing an increasing trend and no significant σ-convergence.
4.2 β-convergence
4.2.1 Model and variable design
To investigate the possibility that provinces with low innovation efficiency among new energy enterprises are effectively catching up, a β-convergence test is performed for each province. This test includes absolute β-convergence, where the innovation efficiency of all samples converges to the same steady state, and conditional β-convergence, where each province converges to its own steady state. Equations 4, 5 are derived with reference to Barro and Sala-i-Martin (1992) analysis of economic convergence.
Convergence rate:
In the equation, the constant term is denoted as α, the convergence coefficient as β, the period as T (spanning 9 years), the random error term as εit, and X represents a set of control variables. Following the approach of Amin and Dogan (2021), Yin et al. (2022), the selected key variables include GDP (gdp), which reflects the level of economic development; the ratio of tertiary industry value added to secondary industry value added (uis), which reflects the upgrading of industrial structure; the ratio of urban population to permanent population at the end of the year (urb), which reflects the level of urbanization construction; the ratio of total import and export volume to GDP (open), which measures the degree of openness index; and the density of rail and road mileage (inf), which reflects the level of transport infrastructure development. To ensure data comparability, GDP, secondary sector value added and tertiary sector value added are adjusted for inflation using 2015 as the base year. At the same time, all variables undergo a logarithmic transformation in the calculation process to address the likelihood of heteroskedasticity. Table 5 provides a comprehensive overview of the descriptive statistical characteristics, including the mean, standard deviation, minimum, and maximum values for each variable.
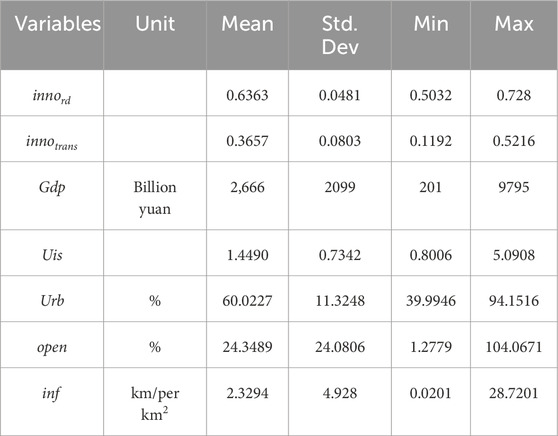
Table 5. Descriptive statistics of relevant data.
4.2.2 Absolute β-convergence
Model (4) is used to test the absolute β-convergence of innovation efficiency among China’s new energy enterprises, and the results are presented in Table 6. Overall, the nationwide β value of innovation efficiency in both the R&D phases and the transformation phases is negative and passes the 1% significance test. This result indicates the existence of absolute β-convergence in the innovation efficiency of new energy enterprises. Taking into account the initial innovation efficiency, provinces with a lower initial level experience an accelerated growth rate of innovation efficiency, resulting in a gradual narrowing of the gap between these provinces and those with higher initial innovation efficiency. Finally, the innovation efficiency levels of new energy enterprises in each province converges to a common steady state. The results also highlight the significant technology spillover effect within the new energy industry. New energy enterprises in different provinces can effectively imitate, learn and adopt the development experience of more advanced counterparts. Enterprises with lower R&D and transformation levels can catch up with advanced new energy enterprises faster, while enterprises with high innovation efficiency become more cautious in the middle and late stages of research.
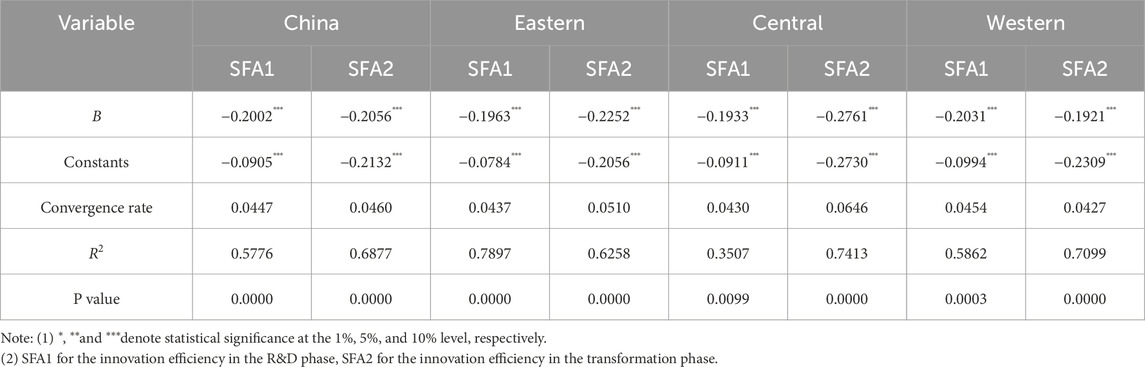
Table 6. Absolute β-convergence.
From a regional perspective, in both the R&D and transformation phases, the β coefficients in the eastern and western regions are less than 0 and pass the significance test at the 1% level, indicating the presence of absolute β-convergence. Regions with lower innovation efficiency experience higher growth rates, leading to the eventual convergence of innovation efficiency of new energy enterprises in all regions. In the R&D phase, the convergence rate in the eastern and central regions is slower than the national rate, while the convergence rate in the western regions is faster. However, the overall convergence rates are similar. In the transformation phase, the convergence rate in the eastern and central regions is faster than the national rate, while the convergence rate in the western regions is slower. This can be attributed to the relatively developed economies of the eastern and central regions, which have attracted a large number of new energy enterprises due to their economic and locational advantages. In addition, they have already started to focus on technology transformation at the R&D phase, leading to a more significant technology spillover effect. On the other hand, the development of new energy enterprises in the western region started relatively late and is currently focused on R&D investments. Although there is significant knowledge transfer and technology spillover among these enterprises, there are some shortcomings in the transformation of achievements.
4.2.3 Conditional β-convergence
Model (5) is used to test the conditional β-convergence of innovation efficiency among China’s new energy enterprises, and the results are presented in Table 7. In both the R&D and transformation phases, the β coefficient shows a negative value with significant significance at the 1% level, suggesting the existence of substantial conditional β-convergence. However, the difference lies in the factors influencing this convergence. At the R&D phase, the upgrading of industrial structure, openness, economic development and the construction of transportation infrastructure all contribute to the convergence of innovation efficiency in new energy enterprises. Conversely, urbanization has an inhibiting effect. But the influence of these variables is not significant. On the other hand, during the transformation phase, both urbanization and openness have inhibiting effects on convergence.
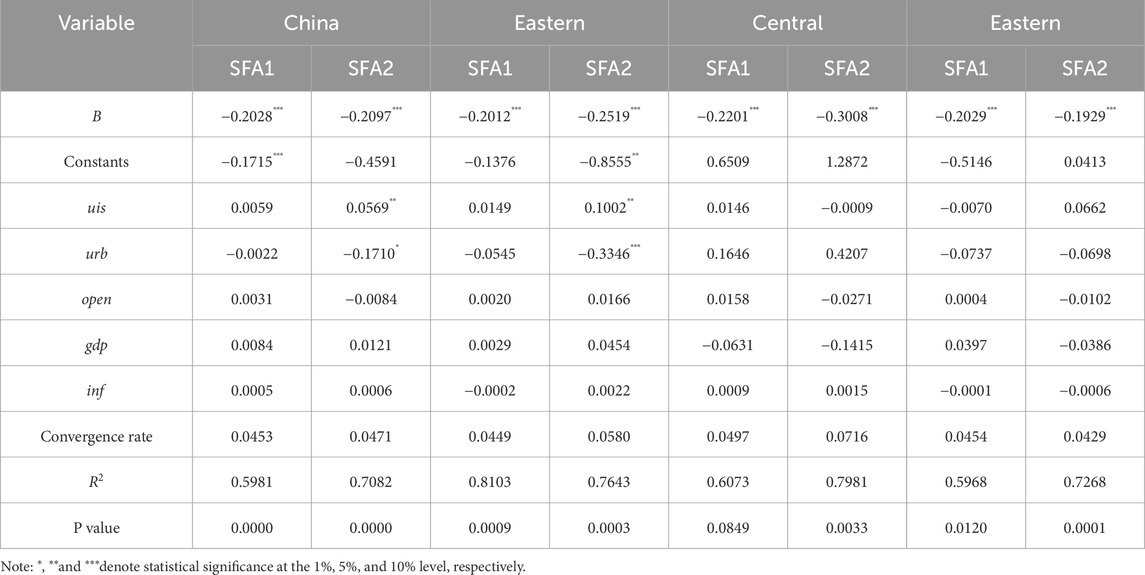
Table 7. Conditional β-convergence.
The reason for this lies in the overall volume perspective, where the characteristics of new energy development contribute to the generally large size of domestic new energy enterprises. Achieving further breakthroughs in innovation efficiency becomes more difficult when dealing with larger volumes, leading to a natural long-term convergence trend. From the perspective of regional structure, although all provinces have implemented new energy development plans, there are significant differences in resource endowments and construction priorities, resulting in differences in the convergence rate of innovation efficiency. From the perspective of influencing factors, both domestic economic development and foreign capital entry conditions can externally change the innovation conditions of China’s new energy enterprises. The differences in the above factors of the sample enterprises lead to different convergence trends. However, in-depth research is still needed to understand in detail how these different factors influence the dynamic development of innovation efficiency in China’s new energy enterprises.
4.3 Robustness test
To address potential sample-selection bias from excluding firms with missing/zero patent data—which may overlook low-efficiency enterprises—we implement a two-step imputation: first, fill in the missing values with the provincial median, and then replace the zero value with 50% of the industry’s minimum non-zero value. The interpolated results show that the average innovation efficiency in the R&D phase decreased from 0.64 to 0.62, and the average efficiency in the transformation phase dropped from 0.37 to 0.34. Provinces with lower innovation efficiency experienced a relatively larger decline, with Chongqing’s transformation efficiency decreasing by 19%.
Crucially, all convergence patterns remain robust. σ-convergence persists regionally for R&D but remains absent in transformation. Absolute β-convergence retains statistical significance, with the western region still converging fastest, particularly in transformation. Conditional β-convergence shows stable coefficients and convergence rate shifts below 5%. Thus, core conclusions withstand sample-composition adjustments.
5 Influencing factors of the dynamic evolution
5.1 Threshold model
The above convergence results show that economic development, industrial structure upgrading, urbanization and openness are important factors affecting the innovation efficiency of new energy enterprises. To further explore the non-linear influence of these factors on the innovation efficiency of new energy enterprises, the threshold model is used for further analysis, and Equations 6, 7 are constructed:
Where, I (·) is the indicator function, thr is the threshold variable, η is the threshold to be estimated, and
5.2 Threshold effect
Before analyzing the threshold model, the stationary test and co-integration test are first conducted on the logarithmic form of each variable. It is found that the panel data of each variable is stationary, and the innovation efficiency of new energy enterprises in the phase of R&D and transformation has a co-integration relationship with the other five variables. Let η = lnuis, lnurb, lnopen, lngdp, lninf, using Stata15, the threshold regression of bootstrap 500 times is performed for Equation 6 and Equation 7 respectively.
As can be seen from Table 8, in the R&D phase, the threshold model of five variables, including the upgrading of industrial structure, urbanization, openness, economic development and transportation infrastructure construction, shows that under the condition of absolute β-convergence, three variables, such as industrial structure, urbanization and economic development, have a threshold effect on the convergence of innovation efficiency of new energy enterprises. Under the situation of conditional β-convergence, industrial structure, openness and transportation infrastructure construction have no threshold effect.
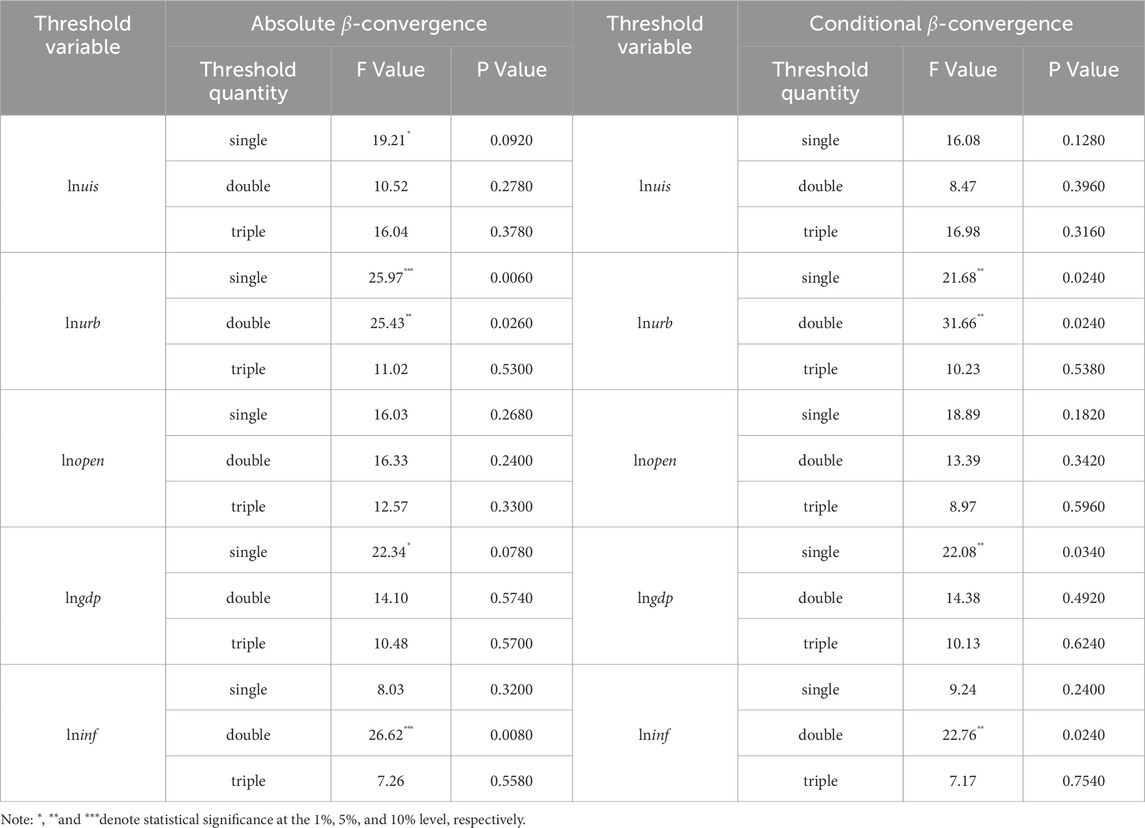
Table 8. β-convergence threshold effects—R&D phase.
Based on the results presented in Table 9, it can be observed that during the transformation phase, the convergence of innovation efficiency among new energy enterprises is influenced by the industrial structure and economic development variables, which show threshold effects in the context of the estimation of absolute β-convergence. Furthermore, when considering conditional β-convergence, the threshold effects of the five control variables are consistent with those observed in absolute β-convergence.
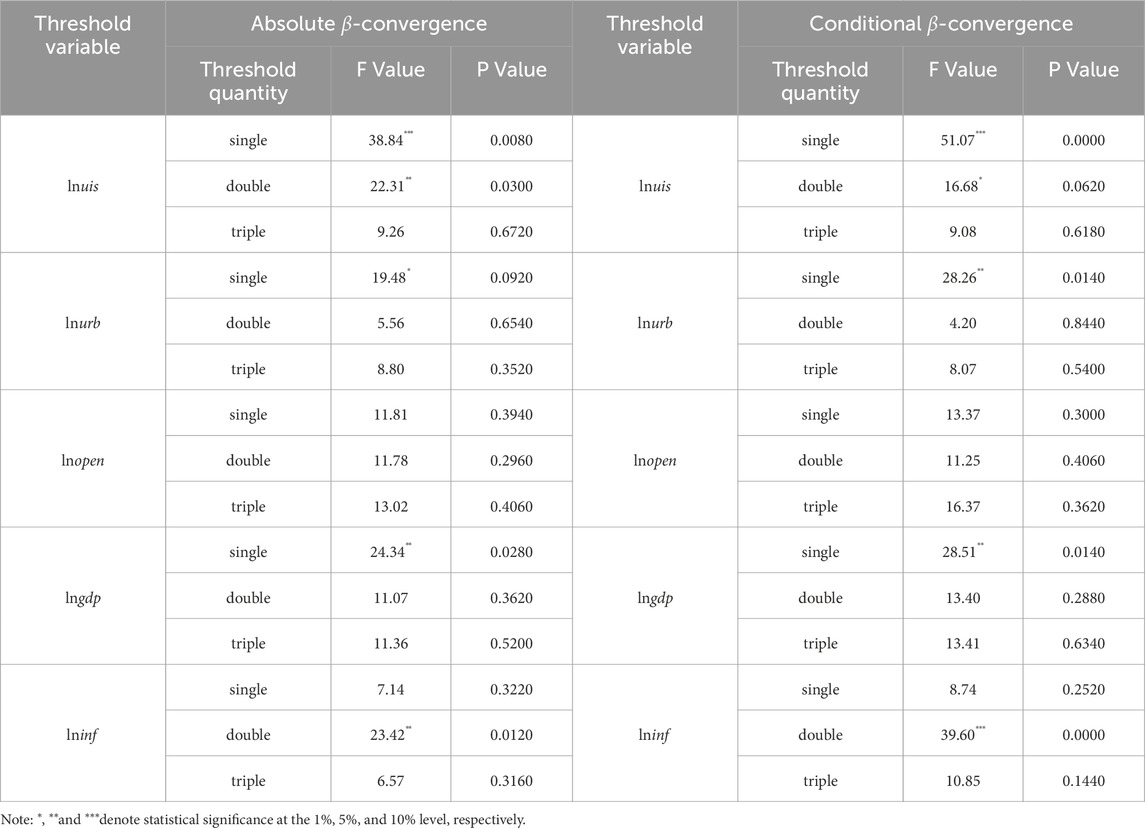
Table 9. β-convergence threshold effect—transformation phase.
Tables 10,11 show the threshold value and 95% confidence interval of each variable with a threshold effect in the innovation process of new energy enterprises, respectively. To reflect the threshold search process more clearly, the Likelihood Ratio Logarithm (LRL) corresponding to each threshold search under the conditional β-convergence in the R&D phase is presented in Figure 2 using lnurb as an example.
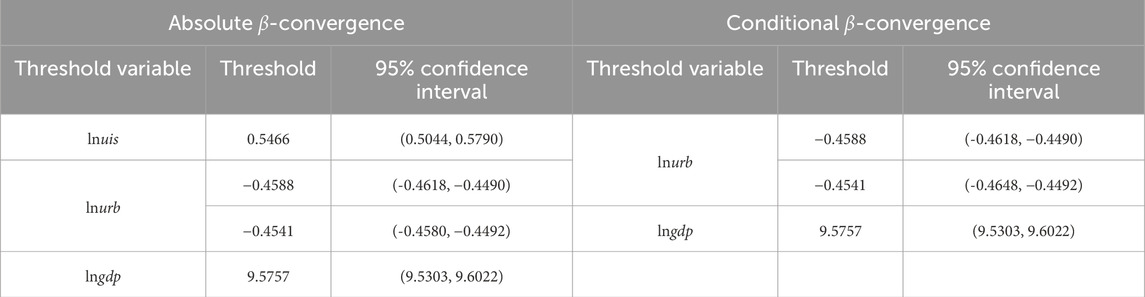
Table 10. Estimated threshold value of β-convergence - R&D phase.
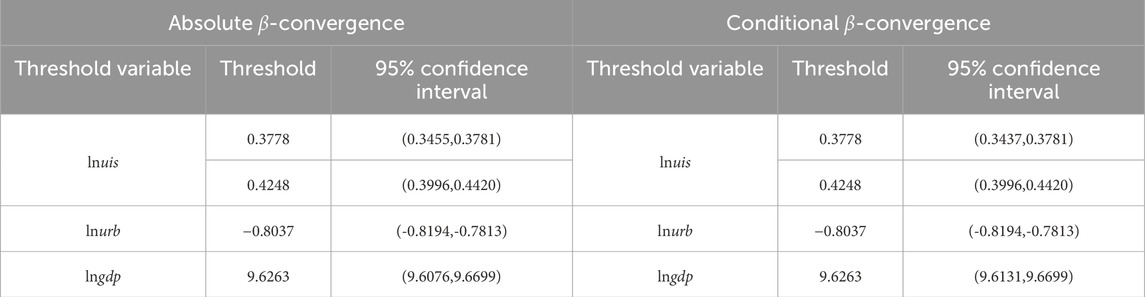
Table 11. Estimated threshold value of β-convergence - transformation phase.
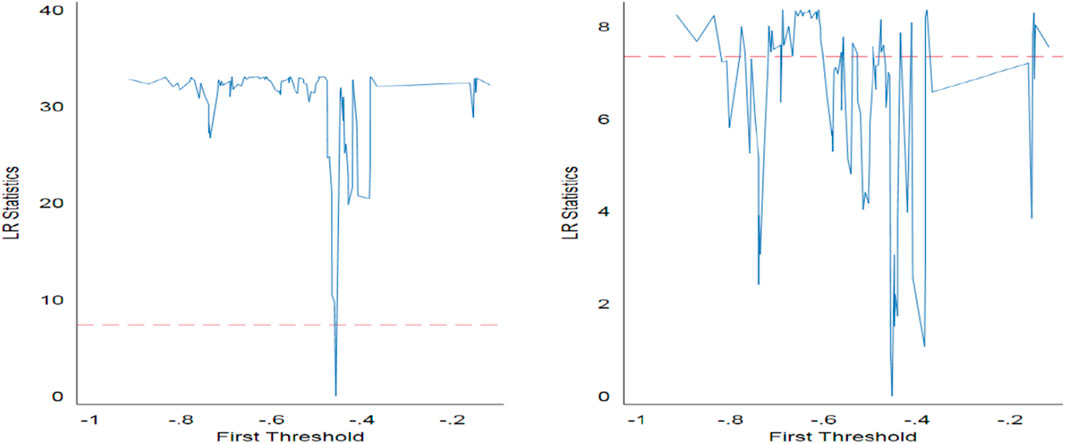
Figure 2. LRL of lnurb under conditional β-convergence in the R&D phase. Note: The dashed lines are the corresponding critical values at the 5% significance level.
5.3 Estimation and analysis of threshold model
Tables 12,13 show the regression results of different threshold variables under absolute β-convergence and conditional β-convergence in the innovation process of new energy enterprises, respectively. As this paper focuses on the convergence characteristics and dynamic changes of innovation efficiency of new energy enterprises, the parameter estimates of control variables are not listed in the regression results under conditional β-convergence.
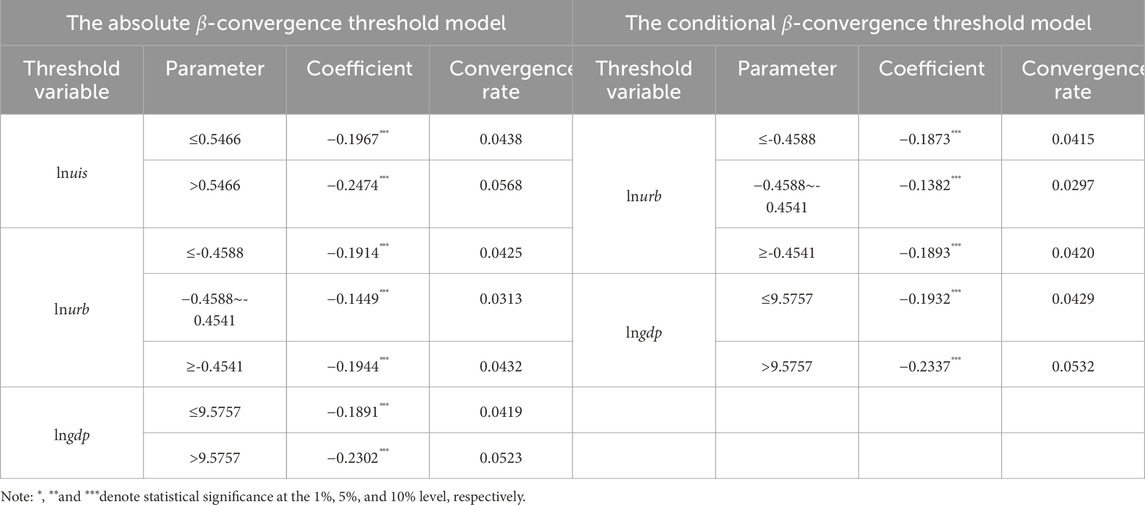
Table 12. Regression results of threshold model—R&D phase.
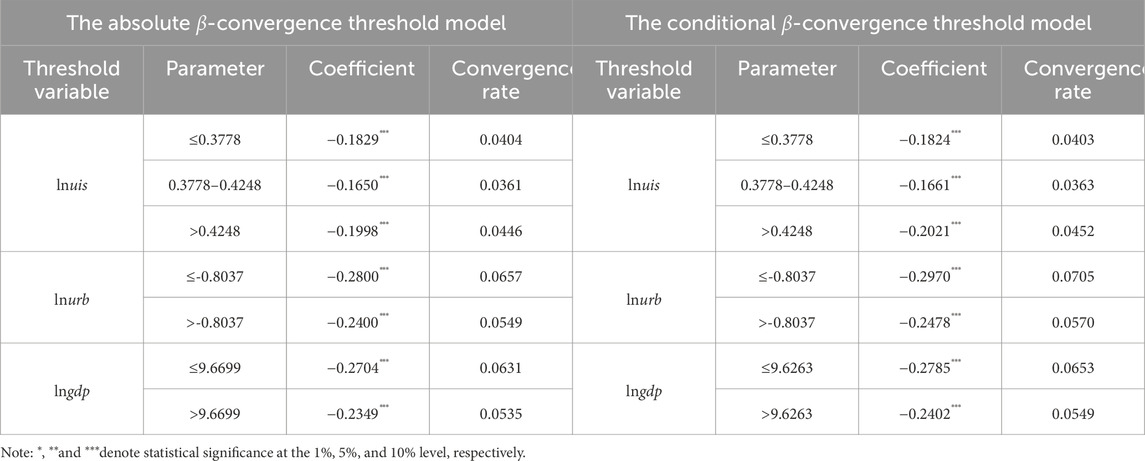
Table 13. Regression results of threshold model - transformation phase.
In the R&D phase, industrial structure, urbanization, and economic growth emerge as pivotal determinants of innovation efficiency in new energy enterprises. Our analysis, focusing specifically on industrial structure as the threshold variable in absolute β-convergence, reveals that when the ratio of the tertiary sector’s value-added to the secondary sector’s value-added surpasses the threshold value of 0.5466, there is a notable increase in the innovation efficiency convergence rate from 4.38% to 5.68%. This improvement can be attributed to the direct or indirect promotion of the development of new energy enterprises through industrial structure upgrading. Consequently, it creates a larger market demand and development space for these enterprises, thus accelerating the convergence rate of innovation efficiency. Moreover, the results of the absolute β-convergence regression, using urbanization as a threshold variable, show convergence rates of 4.25%, 3.13%, and 4.32% in the three phases, suggesting that urbanization also plays an important role in promoting the convergence of firms’ innovation. However, as urbanization progresses, this supportive effect follows a U-shaped curve. The process of urbanization has brought new requirements for the optimization of the energy structure and provided business opportunities for the development of the new energy industry. For instance, China’s wind and solar energy enterprises represented by Goldwind Technology and Micoe Group have become industry leaders largely due to their proactive strategies and ability to seize market opportunities. The absolute β-convergence regression results with economic development as the threshold variable show that lngdp takes 9.5757 as the threshold value, and the convergence rate of innovation efficiency of new energy enterprises presents an accelerating trend, with the convergence rate of 4.38% and 5.68% in the two phases, respectively. The reason for this phenomenon is that, although the innovation efficiency of new energy enterprises in provinces with lower economic development levels grows faster overall, the improvement in economic development will drive the input of R&D in the process of increasing GDP from a lower level (<RMB 1,441 billion) to a higher level (≥RMB 1,441 billion). As a result, the growth rate of innovation efficiency of new energy enterprises will accelerate.
The regression results of conditional β-convergence using urbanization as a threshold variable show a double threshold (−0.4588 and −0.4541) for lnurb. The convergence rate of innovation efficiency for new energy enterprises decreases from 4.17% to 2.97% and then increases to 4.20%. This suggests that urbanization has similar characteristics to absolute β-convergence taking into account differences in relevant factors across provinces. Considering the economic development level as a variable threshold, the value of the lngdp threshold is determined to be 9.5757. Once the economic development level exceeds this threshold, the convergence rate accelerates, indicating that economic development plays a facilitating role in the convergence of innovation efficiency in new energy enterprises.
In the transformation phase, the results of the absolute β-convergence regression, using the upgrading of industrial structure as a threshold variable, show that the convergence rate of innovation efficiency decreases from 4.04% to 3.61%, followed by an increase to 4.46%. This corresponds to the threshold values of lnuis of 0.3778 and 0.4248 respectively. The phenomenon is due to the growing importance of the tertiary sector as a result of the modernization of the industrial structure. As a result, it influences the development and profitability of new energy enterprises through industrial agglomeration, policy incentives, and other factors, ultimately slowing down the growth rate of innovation efficiency in the sector. However, as the industrial structure continues to upgrade, a better business environment, infrastructure and policy support will be created, which in turn will promote the improvement of innovation efficiency. The absolute β-convergence regression results with the level of urbanization as a single threshold variable show that lnurb takes −0.8037 as the threshold value. When the level of urbanization exceeds 44.77%, the convergence rate of innovation efficiency of new energy enterprises decreases from 6.57% to 5.49%. This is because as urbanization improves, the space for new energy enterprises such as wind power generation and geothermal energy use will be squeezed, so the convergence rate of innovation efficiency of new energy enterprises will be weakened. The results of the absolute β-convergence regression with the level of economic development as the threshold variable show that when lngdp takes 9.6699 as the threshold, the convergence rate of innovation efficiency of new energy enterprises slows down to some extent. The convergence rates for the two phases are 6.31% and 5.35% respectively. This can be attributed to the increase in economic development, which leads to an increase in the cost of labor, capital, land and other production factors. As a result, these cost escalations affect the profitability of new energy enterprises, thereby slowing down the pace at which innovation efficiency in the sector increases.
The conditional β-convergence regression results are consistent with the absolute results, showing that industrial structure, urbanization, and economic development act as threshold variables that contribute to the convergence of innovation efficiency with new energy enterprises. The conditional β-convergence regression results with industrial structure upgrading as a threshold variable show that lnuis has a double threshold effect (0.3778 and 0.4248), and the convergence rate of innovation efficiency of new energy enterprises decreases from 4.03% to 3.63% and then increases to 4.52%. This means that taking into account the differences in industrial structure upgrading, urbanization, openness, economic development, transport infrastructure and other factors among provinces, the industrial structure has similar characteristics to the absolute β-convergence regression. The conditional β-convergence regression results with urbanization as the threshold variable show that lnurb has a single threshold effect. With −0.8037 as the threshold, the convergence rate decreases from 7.05% to 5.70%, which is consistent with the conditional β-convergence regression results. Similarly, the conditional β-convergence regression results using economic development as the threshold variable show that lngdp at 9.5757 as the threshold value. When the level of economic development exceeds the threshold, the convergence rate slows down, falling from 6.53% to 5.49%, which is consistent with the conditional β-convergence regression results.
6 Conclusions and practical implications
6.1 Research conclusions
The innovation efficiency of China’s new energy enterprises shows significant spatial and temporal variations. Based on the results of the SFA model, the innovation efficiency of these enterprises ranges from 0.55 to 0.71 in the R&D phase during the period of 2015–2023, exceeding the range of 0.13–0.51 in the transformation phase. This difference indicates a higher level of innovation efficiency in the R&D phase than in the transformation phase, highlighting the need for further improvement in the latter. Overall, there has been a steady increase in innovation efficiency. In particular, the innovation efficiency of new energy enterprises in coastal provinces is significantly higher than that of inland provinces at the R&D phases. 1/3 of the innovation efficiency of new energy enterprises is in the high R&D -high transformation mode, and nearly 1/3 is in the low R&D - low transformation mode.
The innovation efficiency of Chinese new energy enterprises does not exhibit clear σ-convergence, but significant β-convergence is observed. Analysis of the σ-convergence results reveals a fluctuating pattern in the innovation efficiency of these enterprises from 2015 to 2023, characterized by an initial increase followed by a subsequent decline. Specifically, σ-convergence is observed between the eastern and western regions during the R&D phase, while no σ-convergence is found during the transformation phase. As time progresses, the innovation efficiency gap between new energy enterprises widens. However, there is a notable absolute β-convergence and conditional β-convergence. The innovation efficiency of enterprises in the western region converges at a faster pace, with those exhibiting relatively lower innovation efficiency making greater efforts to catch up.
The convergence of innovation efficiency in China’s new energy enterprises is mainly influenced by the upgrading of industrial structure, urbanization construction and economic development. This study conducts a convergence analysis and establishes a threshold model to examine the key factors affecting the dynamic development of innovation efficiency in these enterprises. The analysis shows that the upgrading of industrial structure plays an important role in accelerating the convergence rate of innovation efficiency in new energy enterprises. In addition, the progress of urbanization has a significant impact on the convergence rate of innovation efficiency. Moreover, the progress in economic development stimulates the increase in R&D investment by enterprises, leading to a higher growth rate of innovation efficiency.
6.2 Practical implications
Enhance policy support for spatio-temporal disparities in the energy sector. While preserving the diversified innovation investment strategies in Eastern and Central China, the Western region should concentrate on fortifying its capacities for embracing and driving innovation. By integrating the Western region’s abundant renewable energy sources with the advanced infrastructure from national strategic energy hubs, including the Beijing-Tianjin-Hebei urban cluster, the Yangtze River Delta, and the Pearl River Delta, we can foster a synergistic public service platform. This platform will support the formation of an effective science and technology innovation collaboration system across the Eastern and Western regions. One innovative approach could be to establish industrial clusters through ‘enclave’ cooperation models that leverage China’s leadership in the digital economy sector. By constructing infrastructural platforms that encompass services such as cloud computing and big data analytics, new energy firms can harness state-of-the-art digital tools to refine their production workflows, boost the proficiency of energy management, and smartly navigate market expansion. Such cooperative mechanisms are geared to provide pivotal technological underpinnings that are instrumental in overcoming the key challenges faced during the advancement of the dual carbon strategy and the continued growth of the industry.
Refine the transformation mechanisms of innovative performance of new energy enterprises. Given the pronounced disparities in innovation performance among provinces during the maturation phase of new energy enterprises’ innovations, it is imperative for policymakers to craft bespoke strategies that align with the specific regional nuances, rendering targeted support. It is crucial to encourage interdepartmental collaboration and establish a cohesive synergy between industry, academia, and research entities, all centered around market needs. The government can facilitate the fruitful actualization of innovation endeavors by implementing tax incentives, fiscal stimuli, pathways for commercialization, and safeguarding intellectual property rights. Concurrently, concerted efforts must be made to amplify local innovation capacities, ensuring enterprises are equipped to intensify market analysis and integrate user feedback from the inception of product development. This approach guarantees that R&D trajectories are intimately entwined with market demands. Moreover, advocating for the adoption of established and sophisticated models for transformation, such as platforms for the transition of scientific and technological achievements, can expedite the path to technology commercialization, augment the communal sharing of innovative resources, and sequentially bridge the provincial divide in innovation efficiency.
Cultivate an optimal external environment of the new energy industry. New energy serves as a crucial catalyst in ushering a paradigm shift towards sustainable development, and China is uniquely positioned with intrinsic strengths in bolstering the new energy sector. However, the focus of the external environment also includes the chokepoint caused by the incomplete autonomy and control of the value chain and supply chain, the limitation of licenses and foreign patents caused by the lack of original technology accumulation, and the lack of international influence and authority of products caused by the imperfect testing and certification system. To this end, it is incumbent upon the government to augment infrastructure and buttress service networks that underscore the operational milieu of new energy enterprises. Enhancing this framework includes the provision of requisite facilities such as expansive charging networks, modernized smart grids, and efficient logistics systems. Such advancements are vital to forge seamless pathways for the fabrication and distribution of new energy commodities. Addressing these pivotal concerns will not only reinforce the foundation for innovation-driven development but will also elevate the stature of China’s new energy industry on the world stage.
6.3 Discussion
First, data constraints may affect measurement precision. While total profit is a conventional output metric for the transformation phase, its susceptibility to non-innovation factors (e.g., market volatility or policy shifts) must be acknowledged. Additionally, excluding firms with missing/zero patent or R&D data risks sample selection bias, potentially underrepresenting low-efficiency enterprises. Robustness checks confirm core findings, though future research could delve into refined indicators such as innovation-specific revenue and advanced models like Tobit SFA for more precise analyses.
Second, macro - level analysis struggles to fully explain firm - level heterogeneities. Provincial data masks micro - mechanisms behind efficiency differences, such as R&D management, technology absorption, and local policy execution. Future research should bridge this gap by conducting case studies on representative firms across different efficiency models, like high - R&D - low - transformation clusters. Integrating field interviews, operational surveys, and archival research can add context to macro - level trends and sharpen policy - relevant insights.
Data availability statement
The original contributions presented in the study are included in the article/supplementary material, further inquiries can be directed to the corresponding author.
Author contributions
TZ: Conceptualization, Data curation, Formal Analysis, Funding acquisition, Methodology, Project administration, Validation, Visualization, Writing – original draft. MS: Data curation, Formal Analysis, Investigation, Project administration, Resources, Software, Validation, Writing – original draft. JZ: Data curation, Investigation, Resources, Software, Visualization, Writing – original draft, Writing – review and editing.
Funding
The author(s) declare that financial support was received for the research and/or publication of this article. Shandong Natural Science Fund Project (ZR2024MG016); Shandong Digital Economy Research Base Project (SDSZJD202301); Shanghai University of Political Science and Law Fund Project (2024XQN05).
Conflict of interest
The authors declare that the research was conducted in the absence of any commercial or financial relationships that could be construed as a potential conflict of interest.
Generative AI statement
The author(s) declare that no Generative AI was used in the creation of this manuscript.
Publisher’s note
All claims expressed in this article are solely those of the authors and do not necessarily represent those of their affiliated organizations, or those of the publisher, the editors and the reviewers. Any product that may be evaluated in this article, or claim that may be made by its manufacturer, is not guaranteed or endorsed by the publisher.
References
Amin, A., and Dogan, E. (2021). The role of economic policy uncertainty in the energy-environment nexus for China: evidence from the novel dynamic simulations method. J. Environ. Manag. 292, 112865. doi:10.1016/j.jenvman.2021.112865
Battisti, M., and Vaio, G. D. (2008). A spatially filtered mixture of β-convergence regressions for EU regions, 1980-2002. Empir. Econ. 34 (1), 203. doi:10.1007/s00181-007-0169-7
Barro, R. J., and Sala-i-Martin, X. (1992). Convergence. J. Political Econ. 100 (2), 223–251. doi:10.1086/261816
Baumol, W. J. (1986). Productivity growth, convergence, and welfare: what the long-run data show. Am. Econ. Rev., 1072–1085. doi:10.2307/1816469
Cassetta, E., Nava, C. R., and Zoia, M. G. (2022). EU electricity market integration and cross-country convergence in residential and industrial end-user prices. Energy Policy 165, 112934. doi:10.1016/j.enpol.2022.112934
Chang, Y. T., Zhang, N., and Danao, D. (2013). Environmental efficiency analysis of transportation system in China: a non-radial DEA approach. Energy Policy 58 (7), 277–283. doi:10.1016/j.enpol.2013.03.011
Chen, Y., Ni, L., and Liu, K. (2022). Innovation efficiency and technology heterogeneity within China’s new energy vehicle industry: a two-stage NSBM approach embedded in a three-hierarchy meta-frontier framework. Energy Policy 161 (2), 112708–112708.15. doi:10.1016/j.enpol.2021.112708
Gahn, S. J., and González, A. (2022). On the empirical content of the convergence debate: cross-country evidence on growth and capacity utilization. Metroeconomica 73 (3), 825–855. doi:10.1111/meca.12383
Hall, B. H., and Mairesse, J. (1995). Exploring the relationship between R&D and productivity in French manufacturing firms. J. Econ. 65 (1), 263–293. doi:10.1016/0304-4076(94)01667-7
Hs, A., and Fei, H. B. (2021). Trade policy uncertainty and corporate innovation evidence from Chinese listed firms in new energy vehicle industry. Energy Econ. 97 (5), 105217.1–105217.12. doi:10.1016/j.eneco.2021.105217
Lartey, T., James, G. A., and Danso, A. (2021). Interbank funding, bank risk exposure and performance in the UK: a three-stage network DEA approach. Int. Rev. Financial Analysis 75 (5), 101753. doi:10.1016/j.irfa.2021.101753
Lin, B., and Zhu, J. (2021). Impact of China’s new-type urbanization on energy intensity: a city-level analysis. Energy Econ. 99, 105292. doi:10.1016/j.eneco.2021.105292
Liu, C., Liu, Y., Zhang, D., and Xie, C. (2022). The capital market responses to new energy vehicle (NEV) subsidies: an event study on China. Energy Econ. 105, 105677. doi:10.1016/j.eneco.2021.105677
Magnani, J., Rabanal, J. P., Rud, O. A., and Wang, Y. (2022). Efficiency of dynamic portfolio choices: an experiment. Rev. Financial Stud. 35 (3), 1279–1309. doi:10.1093/rfs/hhab071
Mitrovic, D. (2020). Measuring the efficiency of digital convergence. Econ. Lett. 188 (3), 108982.1–108982.3. doi:10.1016/j.econlet.2020.108982
Ramsey, F. P. (1928). A mathematical theory of saving. Econ. J. 38 (152), 543–559. doi:10.2307/2224098
Romano, G., Molinos-Senante, M., Carosi, L., Llanquileo-Melgarejo, P., Sala-Garrido, R., and Mocholi-Arce, M. (2021). Assessing the dynamic eco-efficiency of Italian municipalities by accounting for the ownership of the entrusted waste utilities. Util. Policy 73, 101311. doi:10.1016/j.jup.2021.101311
Scherer, F. M. (1965). Firm size, market structure, opportunity, and the output of patented inventions. Am. Econ. Rev. 55 (5), 1097–1125.
Shah, W. U. H., Zhu, N., Hao, G., Yan, H., and Yasmeen, R. (2024). Energy efficiency evaluation, technology gap ratio, and determinants of energy productivity change in developed and developing G20 economies: DEA super-SBM and MLI approaches. Gondwana Res. 125, 70–81. doi:10.1016/j.gr.2023.07.017
Solow, R. M. (1957). Technical change and the aggregate production function. Rev. Econ. and Statistics 39 (3), 312–562. doi:10.2307/1926047
Wang, Z. D., Jin, T. L., Yue, L. P., and He, H. (2021). Research on the factors affecting the innovation performance of China’s new energy type enterprises from the perspective of industrial policy. J. Therm. Analysis Calorim. 144 (5), 1681–1688. doi:10.1007/s10973-020-10394-7
Wen, H., Lee, C. C., and Zhou, F. (2022). How does fiscal policy uncertainty affect corporate innovation investment? Evidence from China’s new energy industry. Energy Econ. 105 (1), 105767–12. doi:10.1016/j.eneco.2021.105767
Xiong, X., Yang, G. L., and Guan, Z. C. (2018). Assessing R&D efficiency using a two-stage dynamic DEA model: a case study of research institutes in the Chinese academy of sciences. J. Inf. 12 (3), 784–805. doi:10.1016/j.joi.2018.05.004
Yin, S., Zhang, N., Ullah, K., and Gao, S. (2022). Enhancing digital innovation for the sustainable transformation of manufacturing industry: a pressure-state-response system framework to perceptions of digital green innovation and its performance for green and intelligent manufacturing. Systems 10, 72. doi:10.3390/systems10030072
Yu, S., Zheng, S., Zhang, X., Gong, C., and Cheng, J. (2018). Realizing China’s goals on energy saving and pollution reduction: Industrial structure multi-objective optimization approach. Energy Policy 122, 300–312. doi:10.1016/j.enpol.2018.07.041
Zhang, M., Wu, Y., Tong, L., and Deng, Y. (2022). Does IFRS convergence promote corporate innovation? Preliminary evidence from China. Asia-Pacific J. Account. and Econ. 29 (1), 255–274. doi:10.1080/16081625.2019.1673185
Zhu, L., Wang, Y., Shang, P., Qi, L., and Yang, G. (2019). Improvement path, the improvement potential and the dynamic evolution of regional energy efficiency in China: based on an improved non-radial multidirectional efficiency analysis. Energy Policy 133, 110883–13. doi:10.1016/j.enpol.2019.110883
Keywords: new energy enterprises, innovation efficiency, dynamic evolution, convergence, threshold effect
Citation: Zhao T, Sun M and Zhang J (2025) Dynamic evolution of innovation efficiency of China’s new energy enterprises. Front. Energy Res. 13:1543420. doi: 10.3389/fenrg.2025.1543420
Received: 16 December 2024; Accepted: 21 July 2025;
Published: 12 August 2025.
Edited by:
Le Wen, Auckland University of Technology, New ZealandReviewed by:
Crenguța-Ileana Sinisi, University POLITEHNICA from Bucharest, RomaniaArkadiusz Kowalski, Warsaw School of Economics, Poland
Copyright © 2025 Zhao, Sun and Zhang. This is an open-access article distributed under the terms of the Creative Commons Attribution License (CC BY). The use, distribution or reproduction in other forums is permitted, provided the original author(s) and the copyright owner(s) are credited and that the original publication in this journal is cited, in accordance with accepted academic practice. No use, distribution or reproduction is permitted which does not comply with these terms.
*Correspondence: Meilu Sun, MjczMTkwNDc3MkBxcS5jb20=