 Alexander Jülich
 Maximilian Blum
 Ole Zelt
 Peter Viebahn
- Research Division Future Energy and Industry Systems, Wuppertal Institute for Climate, Environment and Energy, Wuppertal, Germany
Hydrogen emissions arise from leakage during its production, transport, storage and use, leading to an increase in atmospheric hydrogen concentrations. These emissions also cause an indirect climate effect, which has been quantified in the literature with a global warming potential over 100 years (GWP100) of about 11.6, placing hydrogen between carbon dioxide (1) and methane (29.8). There is increasing debate about the climate impact of an energy transition based on hydrogen. As a case study, we have therefore evaluated the expected climate impact of switching from the long-distance natural gas transmission network to the outlined future “hydrogen core network” in Germany. Our analysis focuses on the relevant sources and network components of emissions. Our results show that the emissions from the network itself represent only about 1.8% of total emissions from the transmission of hydrogen, with 98% attributed to energy-related compressor emissions and only 2% to fugitive and operational hydrogen leakage. Compared to the current natural gas transmission network, we calculate a 99% reduction in total network emissions and a 97% reduction in specific emissions per transported unit of energy. In the discussion, we show that when considering the entire life cycle, which also includes emissions from the upstream and end-use phases, the switch to hydrogen reduces the overall climate impact by almost 90%. However, while our results show a significantly lower climate impact of hydrogen compared to natural gas, minimising any remaining emissions remains crucial to achieve carbon neutrality by 2045, as set in Germany’s Federal Climate Action Act. Hence, we recommend further reducing the emissions intensity of hydrogen supply and minimising the indirect emissions associated with the energy supply of compressors.
1 Introduction
In recent years, hydrogen (H2) has emerged as a promising energy carrier, touted as a “clean” fuel capable of supporting the transition to a carbon-neutral economy and the only viable solution for hard to abate sectors like energy-intensive industry (IEA, 2024). With the announcement to establish of a future “hydrogen core network”, Germany has taken on a pioneering role in developing a nationwide hydrogen infrastructure, and also sees hydrogen as an integral part of achieving its ambitious climate neutrality targets by 2045 (BMWK, 2023).
However, recent studies suggest that even green hydrogen produced solely from renewable energy sources may not be completely climate neutral (Archibald et al., 2023; Chen et al., 2024; Ocko and Hamburg, 2022; Sand et al., 2023; Warwick et al., 2022). Global warming associated with hydrogen emissions has not been given much consideration in the research to date as only comparatively small amounts of hydrogen are currently being produced, and the resulting emissions are therefore negligible (Bertagni et al., 2022; Hauglustaine et al., 2022). However, as hydrogen production is set to increase rapidly in the near future and a global hydrogen economy is beginning to emerge, hydrogen emissions will also increase sharply, making it imperative that more attention is paid to the potential climate impacts of hydrogen (Cooper et al., 2022; FN Consultancy, 2022; Sun et al., 2024). Although hydrogen is currently not classified as a reportable greenhouse gas (GHG) under frameworks such as the UNFCCC and the IPCC conventions (IPCC, 2023; UNFCCC, 1997), it has a measurable, indirect climate impact. This impact depends on several parameters, including the amount of hydrogen produced, leakage rates, transport conditions and atmospheric interactions (Mar et al., 2024; Ocko and Hamburg, 2022). Due to significant uncertainties with regard to quantifying these variables, predicting the future climate impact of hydrogen remains challenging. Nevertheless, understanding the global warming potential (GWP) of hydrogen and its atmospheric effects is essential for evaluating its role in climate policy. Today’s research and political debate, however, is primarily focusing on how to ramp up the hydrogen infrastructure as quickly as possible, how much hydrogen is needed, where it should be produced, and at what cost, not on the climate impact of switching from natural gas to hydrogen and the warming potential of hydrogen emissions themselves (Lakshmanan and Bhati, 2024). However, with significant hydrogen use anticipated in scenarios for climate neutrality in Germany (Agora Think Tanks, 2024; BWMK, 2024; Lechtenböhmer and Samadi, 2022), and global roadmaps for hydrogen deployment (IEA, 2024; IRENA, 2024), its emissions deserve greater consideration in future systems analyses. Accurate data on hydrogen leakage in existing and future value chains remain scarce and are largely based on theoretical models or simulations rather than direct measurements (Fan et al., 2022).
Over the past two decades, studies have attempted to estimate hydrogen emissions at both the systems-wide and component levels using a variety of methodologies. The reviews in Cooper et al. (2022), Esquivel-Elizondo et al. (2023), FN Consultancy (2022) and Riemer and Wachsmuth (2022) summarise these efforts but highlight the considerable variability in assumptions and methodologies. Estimates of hydrogen leakage range widely from 0.2% to 20%, reflecting differences in life cycle stages, technologies and processes. High emission rates are most pronounced in production, distribution and storage, especially for liquified hydrogen (LH2), where losses occur during liquefaction, regasification and handling (FN Consultancy, 2022). Previous studies assumed significant hydrogen use in transportation and building heating (Tromp et al., 2003; Vogt et al., 2009), but more recent research emphasises electrification as the dominant pathway (Araújo and de Medeiros, 2023; Cooper et al., 2022; Warwick et al., 2022). Outliers such as the 20% leakage rate in Tromp et al. (2003) have been deemed unrealistic, and new analyses suggest that such rates are limited to extreme cases such as uncontrolled evaporation from LH2 tanks (Esquivel-Elizondo et al., 2023; Schultz et al., 2003). This variability underscores the difficulty of reliably characterising hydrogen leakage rates and poses challenges for assessing their true climate impact.
To the best of the authors’ knowledge, there is no study to date that assesses the climate impact of an entire country’s supra-regional hydrogen transmission network in detail with respect to hydrogen emissions and by analysing different component levels. However, a recent systems-analytic assessment by Mar et al. (2024) considers the climate impacts of a future hydrogen transmission network for Germany with regard to the indirect climate impacts of hydrogen emissions as part of the entire hydrogen value chain. While they modelled GHG emissions of the hydrogen supply chain and in particular the production stage in detail, emissions from hydrogen transport in Germany were only roughly assessed. Based on Mendelevitch and Heinemann (2024), who reported hydrogen losses of 0.04%–0.24% per 1,000 km of pipeline transport, Mar et al. (2024) calculated less than 0.05 Mt CO2e/a for a low leakage case and 0.18 Mt CO2e/a for a high leakage case for transportation and in particular domestic transmission. Another study by Elgowainy et al. (2024) also analysed different hydrogen technology pathways in the US. Although they did not consider hydrogen losses relating to gaseous transport and distribution in general, they addressed energy-related emissions for compression near the production site using local grid electricity. Cooper et al. (2022) also assessed hydrogen emissions from different supply chains and their associated climate impacts, including specific calculation of emission rates for the transportation of hydrogen via pipelines. Based on converting actual natural gas emission rates to hydrogen emission rates using empirical equations that reflect the type of leak, flow and physical properties of the gases, the study covers both pipeline and compressor leakage (0.14%–0.27%).
The aim of this study is therefore to analyse the potential magnitude of the climate impact of switching from natural gas to hydrogen transmission taking the example of Germany’s hydrogen core network scheduled for 2032. This includes providing an overview of the relevant network components where significant emissions occur. Looking at the component level, including operational and fugitive methane and hydrogen emissions, allows for a more detailed understanding of the potential climate impact of a future hydrogen economy. However, our study focuses only on transport as one part of the overall hydrogen economy and therefore does not include either upstream or downstream processes. It also examines the transmission network in isolation from any closely linked distribution networks or intermediate storage facilities. In addition, our study does not claim to precisely quantify all network emissions, but rather focuses on raising awareness and stimulating debate about pipeline transport of hydrogen and its associated emissions and climate impact. As a first of its kind study, it should therefore be seen as an initial reference point that should be revised over time as more real data on hydrogen transport becomes available.
The remainder of this article is divided into four sections. The methodology Section 2 deals with the state of research on the climate impact of hydrogen emissions. This section also outlines the objectives and scope of the case study of the German transmission network, describing the status quo of the natural gas transmission network as well as plans for the future hydrogen infrastructure. Next, the methodology used to estimate future emissions in a hydrogen network is described. Section 3 presents the results of the analysis of hydrogen emissions associated with hydrogen transmission in Germany and the relevant network components with the highest emission levels. To assess the associated net climate impact, a comparison is made with the current natural gas transmission network. In Section 4, the results are discussed, including both a sensitivity analysis regarding differences between the use of GWP100 and GWP20, an overview of potential shortcomings and limitations on our research, and highlighting the need for further research. Finally, Section 5 concludes the article by summarising the findings and recommending a more detailed assessment of the role of hydrogen in mitigating climate change.
2 Materials and methods
This section provides the central methodological specifications required to answer the research question. On the one hand, there is the magnitude of the climate impact of hydrogen derived from existing studies. On the other hand, the key parameters of both the existing long-distance natural gas transmission network and the outlined future “hydrogen core network” in Germany needed to compare their GHG emissions are specified.
2.1 Magnitude of the climate impact of hydrogen
To compare the relative impact of different GHGs on global warming, emissions metrics are used, with Global Warming Potential (GWP) being the standard metric. The GWP is defined as the cumulative radiative forcing exerted by a unit of mass of a GHG over a given period of time, usually 100 years (GWP100) and relative to that of carbon dioxide (CO2). It is therefore often expressed as CO2-equivalents (CO2e), enabling comparative analysis across GHGs with varying atmospheric lifetimes and radiative properties (IPCC, 2023). The GWP100 metric is commonly used in emissions reporting and climate policy because it provides a consistent framework for assessing and comparing the impact of different gases on climate change, facilitating consistent measurement and decision-making across different sectors and jurisdictions. The time period of 100 years is chosen because CO2 persists in the atmosphere for over a century, while short-lived gases like methane (CH4) and hydrogen (H2) have much shorter atmospheric lifetimes – approximately 12 years for CH4 and 2 years for H2 (IPCC, 2023; Prather et al., 2012; Sand et al., 2023). The GWP100 can, however, understate the impact of short-lived gases. In contrast, GWP20 – evaluating warming potential over 20 years – may provide a better estimate of short-term warming effects, highlighting the significant initial climate impact of gases like hydrogen and methane. Recent scientific discussions have pointed out some limitations and inconsistencies in the use of GWP100 for short-lived substances such as hydrogen. For example, the GWP100 may underestimate the climate impact of hydrogen due to its short residence time, while the GWP20 may exaggerate its short-term effects relative to CO2 because CO2 continues to influence atmospheric chemistry well beyond the 20-year window (Cohen-Shields et al., 2023; Duan and Caldeira, 2022; Sand et al., 2023). In addition to GWP, there are other emission metrics that can be used to estimate the climate impact of GHGs, such as GTP (Hauglustaine et al., 2022; Megill et al., 2024) or TWP (Sun et al., 2024). However, these are not as widely used in reporting or climate policy and are therefore not considered here. Providing actual emission levels in our study nevertheless allows the recalculation of our results with these metrics in follow-up studies.
Despite its limitations, GWP100 remains the standard metric because CO2 is the most common GHG and the Kyoto Protocol recommends a common time frame for all GHGs to ensure consistency in reporting. However, recent IPCC reports suggest that individual emissions metrics should be chosen based on specific policy goals, potentially prioritising direct reporting of emissions over aggregated CO2e values (Arrigoni and Bravo Diaz, 2022; IPCC, 2018; 2023). Accordingly, both GWP as well as separate emissions data for H2 and CH4 are reported here for increased transparency.
2.1.1 Global warming effect of hydrogen emissions
Against this background, the mere process of hydrogen combustion is usually considered climate neutral1, because it only produces water vapour without radiatively active CO2. In addition, hydrogen itself neither absorbs nor emits infrared radiation that causes (direct) global warming (Roueff et al., 2019). However, it is known for a long time (Derwent et al., 2001) and increasingly re-evaluated in recent studies that any amount of hydrogen released into the atmosphere contributes indirectly to global warming (Sand et al., 2023). Such emissions occur as a result of leakage during its production, storage, transport and use, leading to an increased concentration of hydrogen molecules in the atmosphere (Arrigoni and Bravo Diaz, 2022). This increased concentration in turn leads to three main atmospheric effects (Lakshmanan and Bhati, 2024; Ocko and Hamburg, 2022; Warwick et al., 2022).
Effect (1) is an increased tropospheric lifetime of methane. Hydrogen that is emitted and released into the atmosphere is oxidised in the troposphere via the reaction shown in Equation 1:
Hydrogen molecules (H2), released unhindered into the troposphere, oxidise with free hydroxyl radicals (
Effect (2) results from an increase in tropospheric ozone (O3) formation (Sand et al., 2023). Hydrogen atoms (H) released by H2 oxidation participate in chain reactions with oxygen (O2) and nitrogen oxides (NOX), leading to increased tropospheric O3. Unlike stratospheric ozone, which forms the protective ozone layer, tropospheric O3 contributes to global warming through its infrared radiation properties (Bryant et al., 2024; Hauglustaine et al., 2022). High concentrations of ground-level O3 can also cause respiratory issues and eye irritation (UBA, 2020).
Effect (3), in contrast to the two previous effects, occurs in the stratosphere, where increased water vapour (H2O) is produced not only through the oxidation of hydrogen, but also of CH4 and other trace gases, further amplifying effect (1). The stratospheric H2O vapour itself then increases the infrared radiation capacity, altering the energy balance of the atmosphere. This cools the stratosphere, increasing energy release to space and Earth, while warming the troposphere and contributing to global temperature rise (Forster and Shine, 2002; Ocko and Hamburg, 2022; Paulot et al., 2021). In addition, stratospheric H2O vapour can accelerate ozone depletion over the polar regions, reducing the ability of the atmosphere to absorb UV-B radiation. Increased UV-B exposure can damage cells in organisms (Feck et al., 2008). However, the H2-related burden is currently thought to be small (Tromp et al., 2003; Vogt et al., 2009; Warwick et al., 2022).
Since atmospheric chemistry reacts strongly to changes in the concentration of certain trace substances (e.g., hydrogen) and at the same time influences global warming, all three implications have an indirect influence on global warming and can therefore be regarded as indirect climate effects. The global warming potential of hydrogen is therefore the sum of integrated effective radiative forcing (ERF) components due to methane, tropospheric ozone and stratospheric water vapour (Chen et al., 2024; Sand et al., 2023). There are, however, a number of other tropospheric and stratospheric effects induced by hydrogen emissions, but they are thought to play a minimal role, if any, and are therefore not included in our analysis (Hauglustaine et al., 2022; Sand et al., 2023).
2.1.2 Deriving the magnitude of the climate impact of hydrogen emissions for this study
To quantify the indirect global warming effects of hydrogen described, various studies that incorporate these implications into climate models and provide estimates of hydrogen’s GWP were reviewed. Table 1 shows both GWP100 and GWP20 values where available. While GWP100 remains the primary metric for consistency, GWP20 is used in our sensitivity analysis to examine short-term impacts.
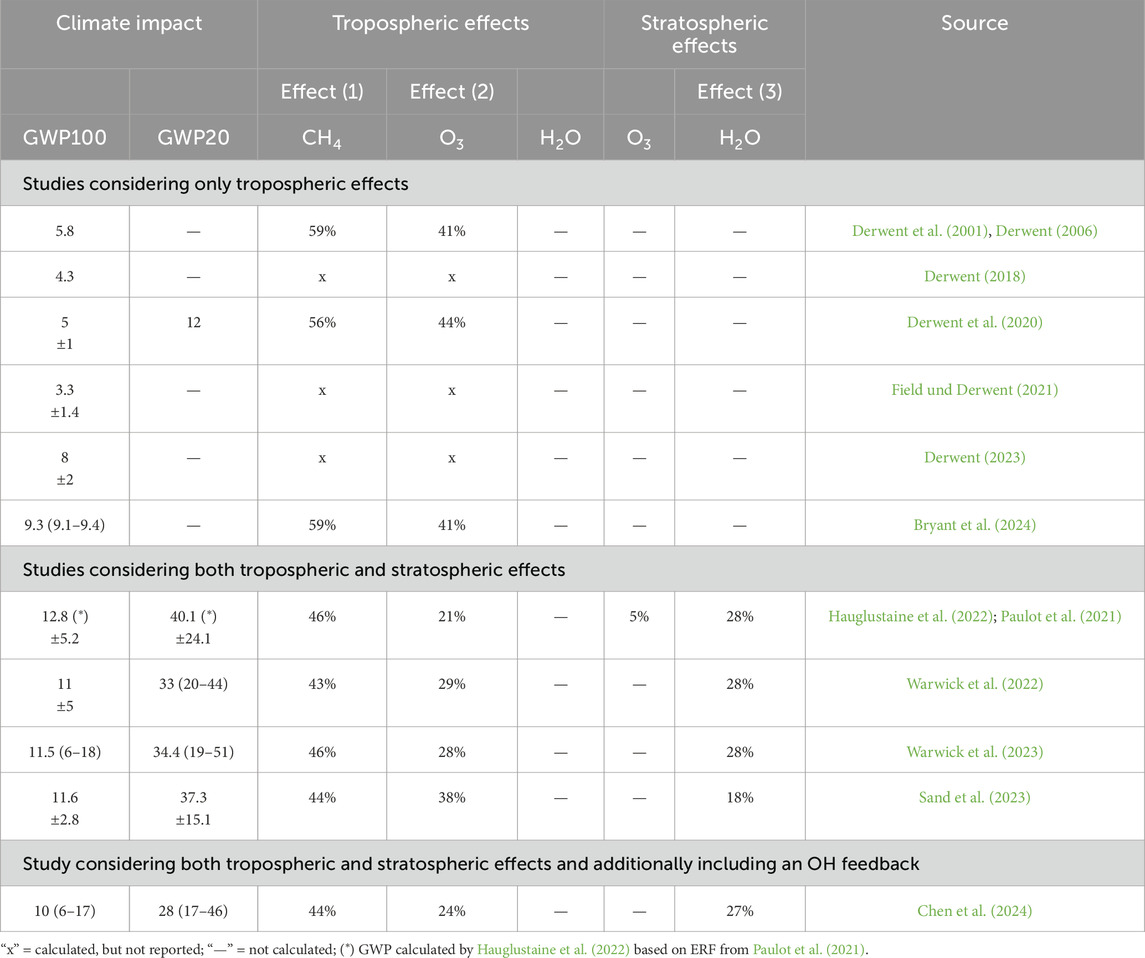
Table 1. GWP values and atmospheric effects of hydrogen as reported in existing studies (own compilation).
Tropospheric effects (1) and (2) were first modelled in climate models more than two decades ago and have been continuously refined since then (Derwent et al., 2001). In order to quantify the climate impact and compare it with other greenhouse gases, the findings and observations of the model results have been converted into a GWP for hydrogen (Bryant et al., 2024; Derwent et al., 2001; 2006; 2020; Derwent 2018; 2023; Field and Derwent, 2021). Due to considerable uncertainties, as were also reported by the authors, the calculated GWP100 varies from 1.9 at the lower end (Field and Derwent, 2021) to 9.3 at the upper end (Bryant et al., 2024), with studies published up to 2021 in the range of about 5. The latest studies by Bryant et al. (2024) and Derwent (2023) meanwhile arrive at a higher GWP100 of 8 and 9.3, respectively, which is mainly due to the assumption of a longer perturbation period for methane and hydrogen. In general, however, the weighting of effects (1) and (2) can be assumed to be roughly equal in all studies, with 60% attributed to the increased methane lifetime and the remainder to the formation of tropospheric ozone.
However, according to Warwick et al. (2022), tropospheric effects (1) and (2) only contribute roughly two-thirds of the total climate impact of hydrogen. Therefore, in more recent studies that also take into account the formation of stratospheric water vapour (effect 3), the climate impact becomes significantly stronger. Paulot et al. (2021) conducted research that included all three effects, but did not calculate a GWP for hydrogen. Nevertheless, they estimated an ERF of 0.13 mW m−2 ppbv−1, which is about one-third higher than in the previously mentioned studies (0.08 mW m−2 ppbv−1), justifying the assumption that the GWP100 would also increase by one-third. Warwick et al. (2022), Warwick et al. (2023) and Hauglustaine et al. (2022) calculated a GWP that includes all three effects, and their values tend to be higher. For example, Warwick et al. (2022) report a GWP100 of 11 ± 5. They also state a GWP100 of 7.9 ± 3.6 when neglecting the stratospheric effect (3), which is roughly comparable to the higher range of the other studies not including this effect. Their results were updated in Warwick et al. (2023), resulting in a slightly higher GWP of 11.5 ± 5.5. Hauglustaine et al. (2022) report a similarly high GWP100 of 12.8 ± 5.2, based on the ERF calculated by Paulot et al. (2021).
In summary, the studies reviewed for this paper indicate substantial variability in GWP100 estimates, ranging from 3.3 to 12.8. The variations stem from different assumptions regarding the duration of methane and hydrogen interference with atmospheric chemistry, as well as differing model inputs and assumptions. What most studies have in common, however, is that about half of the climate impact associated with hydrogen can be attributed to effect (1), i.e., the extension of methane’s lifetime by hydrogen. If the GWP20 is also calculated, it is about three times higher than the GWP100 in all of the studies. However, the range of uncertainties is much larger here because, as described above, the atmospheric implications of hydrogen occur in the first 20 years after initial release. According to Sand et al. (2023), their study is the most comprehensive assessment of the climate impact of hydrogen to date thanks to the advanced and novel use of existing climate models, which underlines the robustness of the results across different models. For this reason, the GWP values in Sand et al. (2023) given as 11.6 ± 2.8 are used as the mean default values in this study and are adopted for our calculations.
However, in contrast to most previous studies, a recent study by Chen et al. (2024), which was published after our study had been completed, uses a comprehensive photochemical box model and shows that analogous four-equation systems like (Ocko and Hamburg, 2022; Warwick et al., 2022; 2023) miss a critical
2.2 Deriving the main parameters for the gas transmission network infrastructure in Germany
In this section we provide an overview of the source of emissions along the transmission network components considered, first for the existing natural gas transmission network and then for the future hydrogen core network as outlined for 2032. We briefly explain the origin of these emissions and discuss their expected magnitude based on current measurements or further estimates – for hydrogen we also present a methodology for estimating the magnitude of emissions, as no actual measurements are available as yet. The assumed emission rates used as inputs to our calculations are explained in the relevant subsections. Despite their uncertainty, they serve as a starting point and should be updated over time as valid primary data become available. Already today, there are first attempts to detect industrial hydrogen emissions. While Westra et al. (2024) use precise mobile measurements to quantify hydrogen emissions from an industrial site in the Netherlands for production and storage, their approach cannot be directly applied to long-distance transmission networks. Hormaza Mejia et al. (2020) and Thawani et al. (2023) also quantified emission rates for hydrogen equipment. However, their analyses focus only on low-pressure infrastructure and therefore cannot be directly applied to high-pressure infrastructure such as transmission networks.
2.2.1 Current natural gas transmission network
An appropriate starting point for assessing the climate impact of future long-distance hydrogen transport in Germany builds on the existing natural gas transmission network–also serving as a valuable reference for our analyses. To assess the climate impact of the existing natural gas transmission network, CO2 emissions resulting from the energy usage of compressor stations as well as emissions from leakage within the network are considered. To quantify the climate impact of leaking natural gas, it is assumed that it consists solely of methane (CH4). In the following, the terms methane, CH4 and natural gas are therefore used as synonyms. A GWP100 of 29.8 based on the latest IPCC assessment report (AR6) is applied for methane without including further feedback mechanisms or uncertainty ranges (IPCC, 2023). However, as uncertainty ranges are generally not used in common reporting formats, we also use only the central GWP value for methane in our calculations.
Natural gas transmission networks consist of several components that contribute to the overall methane emissions to a different extent. Most transmission system operators (TSO) in Germany joined the Oil and Gas Methane Partnership 2.0 (UNEP, 2024), which is an initiative for reporting and mitigating methane emissions. Within the OGMP, emission factors for different network components are derived from field measurements. Therefore, in 2021, the TSOs launched a large-scale measurement initiative to improve the accuracy of reported emissions, some of which were significantly outdated (Fischer et al., 2021). In order to increase transparency, an independent service provider (The Sniffers) – recognised by both the gas industry and NGOs – was commissioned. The data can therefore be considered much more trustworthy than the older emission factors previously used for reporting under the National Inventory Report (FNB Gas, 2025). Other studies also show that some reporting data based mainly on bottom-up estimates can be more than a decade old and thus considered outdated (Riddick et al., 2024; Riddick and Mauzerall, 2023), highlighting the need for further measurement initiatives. Therefore, although the reporting is based on submissions from TSOs, we consider the reported factors to be the best available data. However, while we are not aware of any fundamental criticism of the OGMP2.0 methodology, we acknowledge that additional independent verification would help to increase the reliability of the reported data. To meet the requirements of this reporting initiative, the TSOs are obliged to report their methane emissions from the transportation of natural gas. For our analysis, the following activity factors (AFCH4), total annual emissions and specific emission factors for natural gas (EFCH4), which were reported as part of OGMP2.0 (Table 2), were provided by the German Association of Transmission System Operators Gas (FNB Gas e.V.) – all data provided were jointly agreed in advance in several consultations and are compiled in FNB Gas (2024a), which is available from the authors on request.
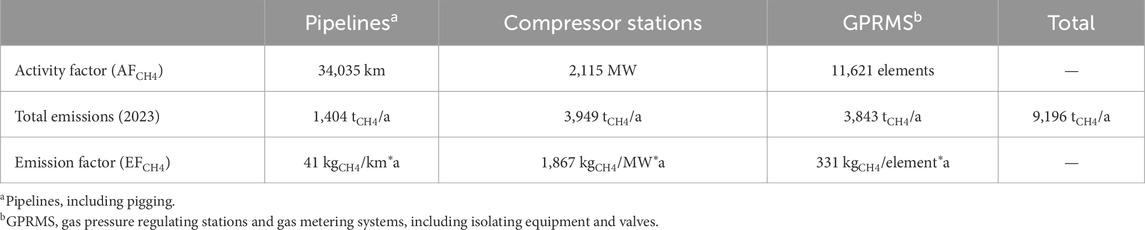
Table 2. Activity factors, emissions factors and total network emissions for the current natural gas transmission network in Germany (FNB Gas, 2024a).
Germany’s current natural gas transmission network consists of approximately 34,035 km of pipelines, which require 2,115 MW of compressor capacity to transport the gas through the pipeline at the intended pressure. The network also includes 11,621 Gas Pressure Regulating Stations and Gas Metering Systems, including isolating equipment and valves (hereinafter referred to as GPRMS). According to OGMP2.0 reporting, all of the components together cause 9,196 tons of methane emissions per year, equivalent to 274 kt CO2e (using GWP100). Based on the activity factors (AFCH4), the specific emission factors (EFCH4) are calculated by dividing the AFCH4 by the total methane emissions. In Section 2.2.2.2, these EFCH4 are used to derive specific emission factors for the future hydrogen transmission network by applying an empirical gas conversion factor.
Apart from methane leakage, other GHG emissions also occur due to the energy supply to compressor stations. Today, compressor stations in the German natural gas transmission network are partly fuelled by natural gas and electricity. According to FNB Gas (2024a), the GHG emissions of gas fired compressors come to 1,187 kt CO2e. In addition, the electrically driven compressors consume 364 GWhel of electricity, which results in 162 kt CO2e, if the 2023 emission factor for the German electricity mix of 445 g CO2e/kWhel is taken into account (Icha and Lauf, 2024). However, it is presumed that this emission factor will decrease to 198 g CO2e/kWhel by 2032 (Table 3), assuming that the aim of Germany’s Federal Climate Change Act can be achieved (BMWK, 2021). In fact, this will reduce energy-related emissions from electrically driven compressors in the future, which is particularly important for the future hydrogen network starting in 2032 (see section 2.2.2.1).
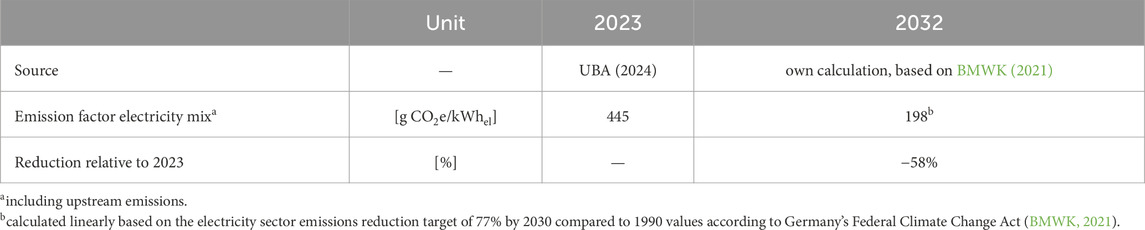
Table 3. Current and assumed future emission factor of the German electricity mix.
As the current natural gas transmission network and the future hydrogen transmission network are unequal in size and capacity, the comparison is made in terms of both absolute and specific emissions per kWhLHV of transported gas. To calculate specific values, the overall amount of transported natural gas is calculated using data from the German Federal Network Agency (BNetzA), which monitors all quantities of natural gas being imported from and exported to neighbouring countries (BNetzA, 2024a). To avoid including loop-flows (reimportation of exported amounts), only amounts from countries with a net positive balance were considered. Based on these data, a transportation of 963 TWhLHV of natural gas was identified for 2023, which is used for further calculations in this study.
In order to estimate the hydrogen leakage for a future hydrogen network, it is also necessary to consider an average operating pressure for both the future hydrogen and the current natural gas transmission pipelines. As pressure rates vary according to distance between compressor stations and different network throughputs, an assumption must be made for the average operation pressure at which leaks occur. According to the date provided by FNB Gas, 60 bar can be taken as the average operational pressure rate of the current natural gas transmission network (FNB Gas, 2024a).
Another assumption to be made in order to calculate the network emissions relates to the classification of emissions as operational or fugitive emissions. Whereas operational emissions, which mainly occur due to maintenance, are of the same volume for hydrogen as for methane, an empirical conversion factor has to be applied for fugitive emissions (see Section 2.2.2.2), which mainly consist of unintentional leakage from network components. According to FNB Gas, it can be assumed that operational and fugitive emissions each account for 50% of emissions from today’s natural gas transmission network. However, due to the different fluid dynamics of hydrogen and methane, this ratio is likely to shift in the future hydrogen network.
2.2.2 Future hydrogen transmission network
2.2.2.1 Extrapolation to a future hydrogen network topology
The basis for the future hydrogen transmission network in Germany we assume for our calculations is what is called the “hydrogen core network 2032” (see Figure 1) approved by BNetzA on 22 October 2024 (BNetzA, 2024b; FNB Gas, 2024b). The core network, based on a detailed modelling framework, was previously submitted by the German Transmission System Operators (TSOs) in a joint application and refined during several stakeholder consultations over the last few years. The core network is intended to form the basic framework for the development of a nationwide hydrogen infrastructure in Germany and, together with the European Hydrogen Backbone (EHB), to secure the energy infrastructure throughout Europe for the future (ehb, 2024). The total network length will be 9,040 km, of which 60% will be repurposed natural gas pipelines and 40% newly built pipelines. The first pipeline conversions are planned for 2025, while the core network will be successively constructed up until 2032. Feed-in and offtake capacity will be approximately 101 GWth and 87 GWth, respectively, of which 58 GWth will be imported via cross-border points and 15 GWth will come from domestic electrolysis capacity. The remainder is expected to come from storage or other unspecified sources. With this capacity, the expected annual feed-in volume will be around 278 TWhHHV or 238 TWhLHV in terms of energy. As the core network does not yet define specific quantities for purchases, the feed-in is also used as an approximation for the amount of hydrogen that will be transported through the hydrogen transmission network in 2032.
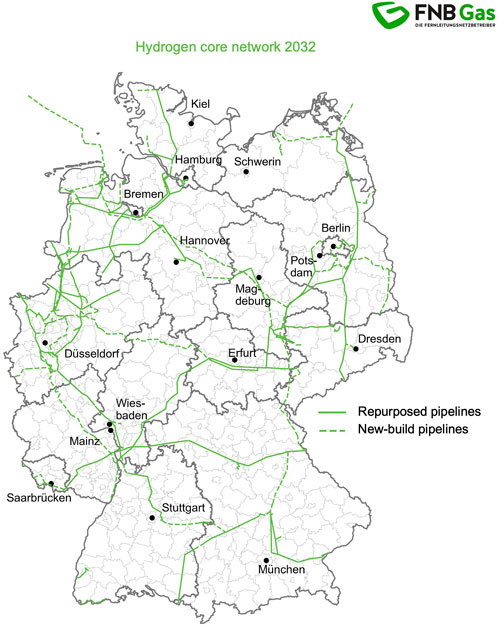
Figure 1. Map of the hydrogen core network in 2032 according to the approval of 22 October 2024 (based on FNB Gas 2024b).
The operating pressure of the network is another critical parameter, as it is expected to differ significantly between methane and hydrogen systems. For example, Wang et al. (2021) suggest that the optimal operating pressure for the European Hydrogen Backbone (EHB) may be lower than that of current natural gas transmission networks, particularly in the case of repurposed natural gas infrastructure. This adjustment is recommended to improve the safety aspects of hydrogen transport and to ensure economic operation (Yang et al., 2025). Although a recent study by the German Technical and Scientific Association for Gas and Water (DVGW) indicates that existing pipelines installed in the German transmission network may generally be suitable for transporting hydrogen (Steiner et al., 2023), it is important to note that practical operation may still require some adaptations, including reduced pressure levels. In line with this, the FNB Gas also proposes an optimal operating pressure of approximately 35 bar, corresponding to a reduction of just over 40% compared to the current pressure level of around 60 bar in the natural gas network (FNB Gas, 2024a). Despite these differences in operating pressures, both repurposed and new pipelines will have comparable nominal diameters and follow the existing transport routes.
However, due to the different fluid dynamics of hydrogen and methane, hydrogen will have to be transported at three times the velocity of methane to transport nearly the same amount of energy (Arrigoni and Bravo Diaz, 2022; Thawani et al., 2023). In order to compensate for the pressure loss, a compressor capacity of 291 MW is stated in the joint application for the core network (FNB Gas, 2024b). Nevertheless, as the future framework conditions and parallel developments in other sectors are still unknown, it has not been specified to date whether these compressors will be driven primarily by gas turbines, as in the existing natural gas network, or electrically. Also, the question of which compressor types will be chosen and how many compressing stages they will have is still unresolved (Jia et al., 2023). In theory, current natural gas compressors are not suitable for compression of 100% hydrogen due to deviating physical characteristics of the two gases (Télessy et al., 2024). However, to the best of the authors’ knowledge, no estimates of emission rates of hydrogen-specific compressor units are available. Given the expected high costs of hydrogen and its likely long-term shortage (Araújo and de Medeiros, 2023; Elgowainy et al., 2024), it is assumed in this study that only electric compressor units will be in operation for the future hydrogen network. In addition, as information is only available on the installed compressor capacity but not on the associated energy consumption, according to FNB Gas an average utilisation rate of 20% per year is assumed, which corresponds to a total of 1,752 representative full load hours (FLH) per year and compressor (FNB Gas, 2024a). Furthermore, no information is available on how many GPRMS elements will be installed in the core network. According to FNB Gas (2024a), the number of these elements per km of pipeline will be approximately comparable to the natural gas transmission network of the German TSO Gascade. This assumption is made without distinguishing between different types of components for GPRMS. The network of Gascade, one of the 16 TSOs in Germany, was chosen because it is less interconnected than most parts of the existing natural gas transmission network in Germany, which grew historically and has existed for a long time (FNB Gas, 2024c; Yueksel-Erguen et al., 2020). Thus, the topology of the Gascade network can be considered the most analogous to the expected topology of a future hydrogen transmission network, given that it came into existence relatively recently (Gascade, 2024). Based on these assumptions, it is estimated that a total of 890 GPRMS elements will be needed for the hydrogen core network.
2.2.2.2 Conversion of methane leakage rates to hydrogen leakage rates
In the absence of a currently operational hydrogen transmission network, direct real-world measurements of associated hydrogen emissions are not available (Esquivel-Elizondo et al., 2023). As a result, hydrogen emissions have to be estimated using empirical conversion factors based, for example, on methane emissions from the current natural gas network. Within this study, which examines hydrogen in comparison with the existing natural gas transmission network, it is crucial to evaluate the climate impact specifically in relation to methane (CH4) rather than carbon dioxide (CO2). Due to the differing physical properties of H2 and CH4, the reference unit for the GWP is a key consideration.
As shown in Table 4, methane exhibits approximately 2.6 times the warming potential (GWP100) of hydrogen on a mass basis (1 kg of gas), marking it as a much more potent GHG than hydrogen. However, when considering volume (1 Nm3 of gas), the density of hydrogen which is eight times lower results in a much higher volumetric ratio of about 21:1. Using GWP20 instead results in a slightly lower mass-based ratio of 2.2:1, with a corresponding volumetric ratio of 18:1. Thus, the higher volumetric warming potential of methane is particularly relevant in a comparative analysis of the operational emissions of these two energy carriers. However, for direct comparisons of CH4 and H2, the differentiation between these two metrics is not critical, since the GWP100/GWP20 ratio increases similarly for both gases. Nevertheless, the impact of this differentiation is explored in a sensitivity analysis in Section 3.2. In contrast, it is particularly important to differentiate emissions associated with network components into operational emissions, e.g., from intentional venting or other maintenance activities, and fugitive emissions such as unintentional leakage from network components which occur due to permeation or loss of tightness of some components (e.g., connections, valves, joints, etc.) (Cooper et al., 2022; UNEP, 2024).
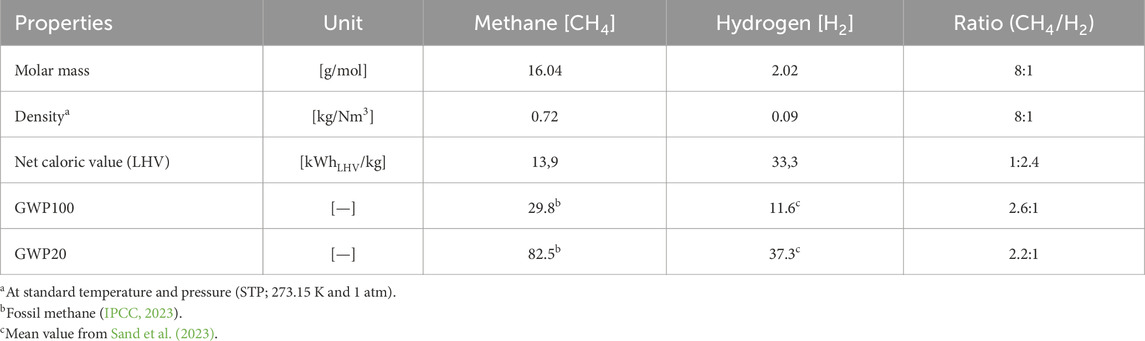
Table 4. Gas properties and climate impact of methane versus hydrogen.
Operational emissions can occur during depressurisation for maintenance or safety reasons, such as when gas is purged from a pigging station before it is opened to remove a pipeline inspection tool (Böttcher, 2023). As a result, some or all of the gas in that section may escape into the atmosphere. However, when determining the climate impact of a released gas, it is not the volume of gas that is relevant but rather the mass of the released gas, as the GWP is a mass-related metric (see Section 2.1). Due to the lower density of hydrogen compared to methane, less mass would be released for the same volume. As the density of a gas in turn depends on the pressure and the two transmission networks are to be operated at different pressures (CH4 at 60 bar; H2 at 35 bar), the lower operating pressure for hydrogen has an additional reducing effect on the mass-related emissions. Ultimately, the density ratio and the different operating pressures mean that for the same volume of gas released, hydrogen is emitted at a mass-based ratio of 0.07 compared to methane.
Fugitive emissions, on the other hand, are more complex to estimate and are calculated using an empirical conversion factor (CF) here. The CF is defined as the ratio of the volume flows of two different gases and therefore allows one volume flow to be converted into another (Anghilante et al., 2023). The methane-related CF for hydrogen (CFH2/CH4) suggests that, while a greater volume of hydrogen may be leaked, the mass leaked is significantly reduced (Swain and Swain, 1992). The methane-related CF for hydrogen is shown in Equation 2, where
In addition, the dominant flow regime for the prevailing flow must be determined. Since a high Reynolds number is to be expected at the given high operating pressures, and large pipe diameters (up to 1,400 mm) are typically present at the transmission network level (FNB Gas, 2024c; Wang et al., 2021), this can be simplified by saying that only turbulent flow prevails, which is expected to dominate in transmission networks (Anghilante et al., 2023; Garrison and Gant, 2021). According to the turbulent viscous model by Darcy-Weisbach and assuming an identical cross-sectional area for both networks, the volume flow of a turbulent flow is defined in Equation 3, where
However, the Darcy-Weisbach model shows that the CFH2/CH4 for turbulent flows stabilises at a pressure rate above 3 bar and is close to the theoretical maximum (CFH2/CH4, max = 2.83). For the transmission networks considered here, where the pressure is significantly higher than 3 bar, a CFH2/CH4 of 2.8 can therefore be used for simplification, even if the pressure levels in both networks are different. In line with this, another study by the DVGW on the experimental characterisation of leakage rates also recommends a CFH2/CH4 of 2.8 for the application area “gas supply pipelines and systems” (Anghilante et al., 2023). Besides turbulent flow, however, other flow regimes may also occur – for example, the studies by Hormaza Mejia et al. (2020) and Thawani et al. (2023) show that hydrogen may escape at the same rate as methane and the CFH2/CH4 is therefore well below the theoretical maximum. However, as they only consider low pressure infrastructure with small dimensions, the results cannot be directly extrapolated to the high-pressure transmission network. In addition, it should be noted that the gas density itself is pressure dependent and the different pressure levels must also be taken into account. Under all-turbulent flow conditions, the volumetric CFH2/CH4 therefore stabilises at about 2.8 at the given operating pressures, resulting in a gravimetric CFH2/CH4 of 0.21. This suggests that although nearly three times the volume of hydrogen is emitted compared to methane, the mass loss is only about one-fifth, resulting in a climate impact of about 8% of that of methane (using GWP100).
Apart from fugitive and operational emissions, the phenomenon of “hydrogen embrittlement” also plays a role in the context of hydrogen transport through pipelines. Embrittlement refers to the fact that hydrogen – due to its small molecular size (one-eighth of methane; see Table 4) – can penetrate materials and accumulate in microcracks more easily than other gases, leading to a deterioration of mechanical properties (Østby et al., 2021; Télessy et al., 2024). This phenomenon reduces fatigue and fracture resistance, increasing the risk of pipeline failure and unintended hydrogen emissions (Briottet et al., 2012; LaFleur et al., 2023). To mitigate these risks and ensure the long-term integrity of hydrogen transmission networks, preventive measures such as material selection, oxide layer protection, and controlled operating pressures are essential (Broerman et al., 2022; Campari et al., 2023). Despite these risks, Steiner et al. (2023) argue that almost all steel pipelines used currently in the German high-pressure transmission network (>16 bar) meet the basic material and structural requirements for hydrogen transport and are therefore, in principle, suitable for repurposing. However, studies confirming the suitability of reuse may lack comprehensive experimental validation or long-term performance data. Therefore, while such assessments provide an important initial indication, further testing and scientific scrutiny is required to ensure the long-term safety and reliability of repurposed infrastructure. However, since our analysis focuses on fugitive and operational emissions rather than structural integrity, and given the assumption of material suitability of today’s pipeline steels in Germany’s transmission network, hydrogen embrittlement is not quantitatively included in our calculations.
By relating the previously calculated hydrogen flow characteristics to current methane emissions, hydrogen-specific emission factors (EFH2) can be calculated in conjunction with the hydrogen activity factors (AFH2) derived from the outlined hydrogen core network. Although distinguishing between repurposed and dedicated hydrogen components could provide more accurate results, our analysis represents only a first approximation due to lack of available data and therefore uses the same factors for both, repurposed and dedicated components. Multiplying AFH2 and EFH2 results in the total annual hydrogen emissions (Table 5). In total, the future hydrogen core network is projected to emit about 173 t of hydrogen per year by 2032 (equivalent to 2,160 t CO2e), with the largest share coming from compressor operations (76 t H2), followed by pipelines (52 t H2) and GPRMS (38 t H2). It should be noted, however, that while further improvements in pipeline technology may further reduce fugitive emissions (Liu, 2024), our analysis assumes that the tightness of hydrogen pipelines will be comparable to that of natural gas pipelines (Steiner et al., 2023). Accordingly, no reductions in emission levels are considered here. For example, newly constructed dedicated hydrogen pipelines or appropriate retrofitting of repurposed pipelines may reduce leakage through pipelines in the future. The calculations made here should therefore be used as a proxy for the time being and should be revised as soon as more accurate data is available.
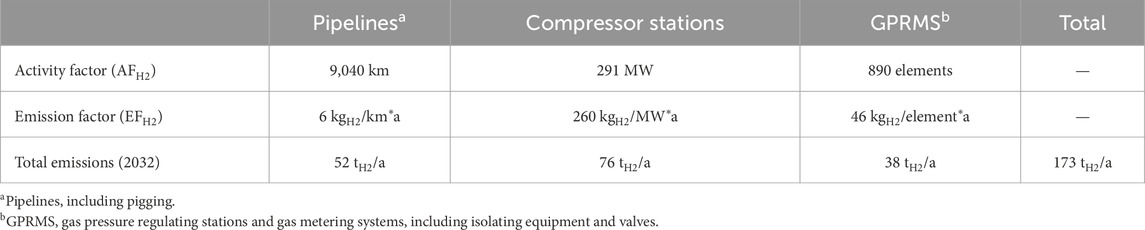
Table 5. Specific hydrogen emissions related to components of the future hydrogen core network in Germany.
Regarding the assumptions and approximations made here to estimate hydrogen emissions, it should be noted that there is not only a high degree of uncertainty about current CH4 emissions, especially on the basis of bottom-up methods using emission factors and activity factors (Riddick et al., 2024; Riddick and Mauzerall, 2023), but also about the fluid flow conditions and other flow mechanisms of gas transport (Hormaza Mejia et al., 2020; Swain and Swain, 1992). Nevertheless, using today’s natural gas system and conventional flow dynamics as a basis seems to be the most plausible way to estimate future hydrogen emissions (Esquivel-Elizondo et al., 2023).
3 Results
According to the approach presented before, total network emissions are calculated in CO2 equivalents (CO2e) both for the existing natural gas transmission network and the approved concept for the future hydrogen core network in Germany. As these networks are not equal in size or capacity, along with total emissions, the results are also presented in specific terms per kWhLHV of transported gas. For the base case, emissions are calculated using the GWP100. Acknowledging the ongoing discussion as to whether the effect of short-lived greenhouse gases should be calculated using the GWP100 or the GWP20 (Ocko and Hamburg, 2022; Duan und Caldeira, 2022; Cohen-Shields et al., 2023), the 20-year horizon along with uncertainties regarding the GWP of hydrogen in general are addressed in a sensitivity analysis.
3.1 Network emissions
3.1.1 Emissions caused by leakage
Given the outlined procedure for calculating leakage in the current natural gas transmission network (Section 2.2.1) and the future hydrogen network (Section 2.2.2), the total climate impact of the network components due to leakage is presented in (A). To take the different sizes of the networks into account, the results are also presented in specific figures per unit of energy (B). In the case study analysed in this article, the estimated future climate impact from fugitive and operational hydrogen leakage will only be 0.7% of the climate impact resulting from methane leakage today. This is due to the lower density and lower GWP values of hydrogen compared to methane, as well as a lower assumed operating pressure in the future hydrogen network. These effects can even compensate for a higher volume flow rate of leaking hydrogen induced by the assumed CFH2/CH4 for fugitive emissions.
In absolute terms, the difference between methane and hydrogen is further increased by lower transport capacity of the future hydrogen network (238 TWhLHV) compared to the existing natural gas network (963 TWhLHV). In this case, the total emissions of the network will be reduced by 99% from 0.274 to 0.002 Mt CO2e/a. Even for specific emissions per kWhLHV transported, which does not take into account the effect of higher transport volumes of natural gas, GHG emissions from hydrogen leakage are reduced by 97% from 0.285 to 0.008 g CO2e/kWhLHV.
A distinction between operational and fugitive emissions provides further information on the distribution of hydrogen emissions within the network structure. In contrast to the even distribution of operational and fugitive emissions in the current natural gas transmission network, the relationship is changed by the different flow dynamics of hydrogen. Fugitive emissions then dominate at 74%, as the flow dynamics of hydrogen lead to significantly higher volumetric losses for a given leakage than for operational emissions. Such effects do not occur for operational emissions, as a fixed volume is simply vented to the atmosphere without being influenced by flow dynamics.
3.1.2 Emissions including energy usage
In the next step, the energy-related emissions of compressor stations are included in addition to the operational and fugitive leakage of methane and hydrogen shown above. It is clear that, in all cases, leakage only makes up a small fraction of the total emissions (Figure 3). In the future hydrogen core network, the share of energy-related emissions is higher compared to the natural gas transmission network. This is why there is a lower decrease in GHG emissions in this case compared to the decrease in GHG emissions solely from leakage.
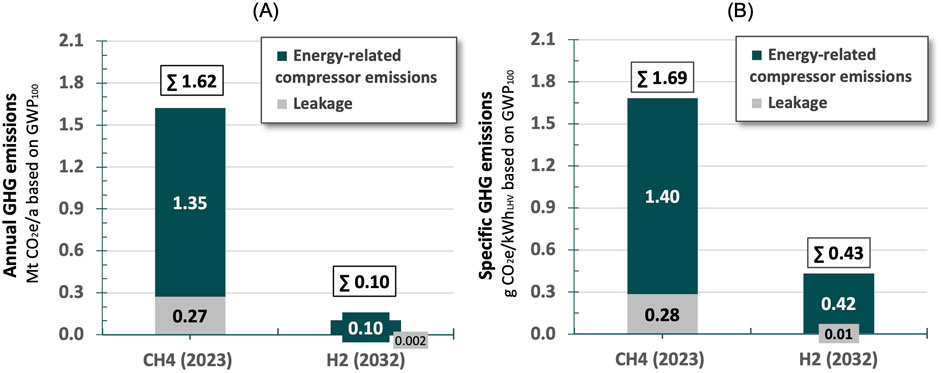
Figure 3. Annual absolute (A) and specific (B) GHG emissions from leakage and energy-related compressor emissions in the current natural gas transmission network and the future hydrogen core network.
Due to lower leakage, lower energy requirements for compressor stations and the smaller network size, the total network emissions in the future hydrogen network decrease by 94% from 1.62 to 0.10 Mt CO2e/a compared to the current natural gas transmission network (A). In specific terms, however, emissions decrease by only 75% from 1.69 to 0.43 g CO2e/kWhLHV (B). It should be noted that energy-related emissions from the future hydrogen network are due to indirect emissions (scope 2) from electricity generation, which have been projected to reach 198 g CO2e/kWhel by 2032 (see Table 3). By 2045, however, this value might reach zero, assuming that Germany’s climate goals are reached and energy-related emissions are therefore completely avoided.
3.2 Sensitivity analysis: GWP time horizon and uncertainty ranges
As there are different notions as to whether the GWP100 or GWP20 is more appropriate to assess the GHG effect of short-lived gases like methane or hydrogen, and only GWP100 has been considered so far in this paper, both metrics are compared in the following. For methane, the GWP increases 2.6 times if the shorter 20-year period is applied, while the GWP of hydrogen only increases 2.2 times (see Table 4).
Another aspect of this sensitivity analysis is the uncertainty regarding the GWP of hydrogen in general. As outlined in Section 2.1, the GWP of hydrogen is indicated with a lower span of 6 and 15.2 and a higher span of 18 and 64.2 for GWP100 and GWP20, respectively. Figure 4 shows the effects of applying GWP100 or GWP20 as along with lower or higher spans for the GWP of hydrogen. If the GWP100 metric is considered, the emissions resulting from hydrogen leakage are 99.6%–98.9% lower (0.001–0.003 Mt CO2e/a) than emissions from methane leakage (0.274 Mt CO2e/a), depending on whether a high or low GWP of hydrogen is assumed. If, on the other hand, the GWP20 metric is used, the emission reductions from the fuel switch reduction are 99.6%–98.6% (0.003–0.006 Mt CO2e/a, compared to 0.759Mt CO2e/a).
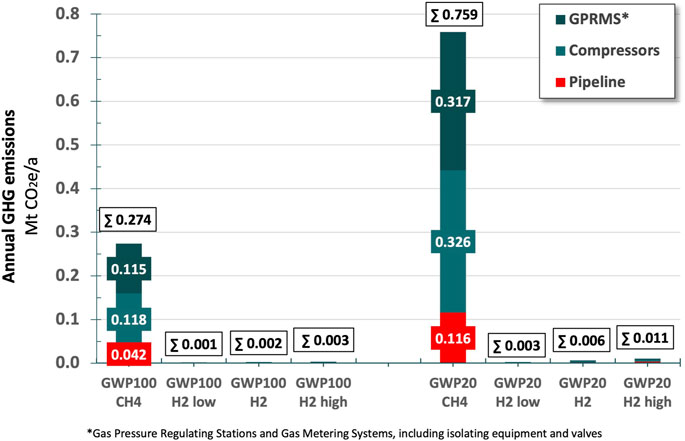
Figure 4. Annual absolute GHG emissions from leakage in the current natural gas transmission network and the future hydrogen core network; comparison of GWP100 and GWP20 along with consideration of the range of literature references for the GWP of hydrogen.
Again, emission reductions are slightly smaller in specific terms (considering GHG emissions per kWhLHV transported), as can be seen in Figure 5. For GWP100, emissions from leakages decrease from 0.285 g CO2e/kWhLHV to 0.004–0.012 g CO2e/kWhLHV (98.6%–95.8% reduction) in a future hydrogen transmission network, while for GWP20 the emissions decrease from 0.788 g CO2e/kWhLHV to 0.011–0.045 g CO2e/kWhLHV (98.6%–94.3% reduction).
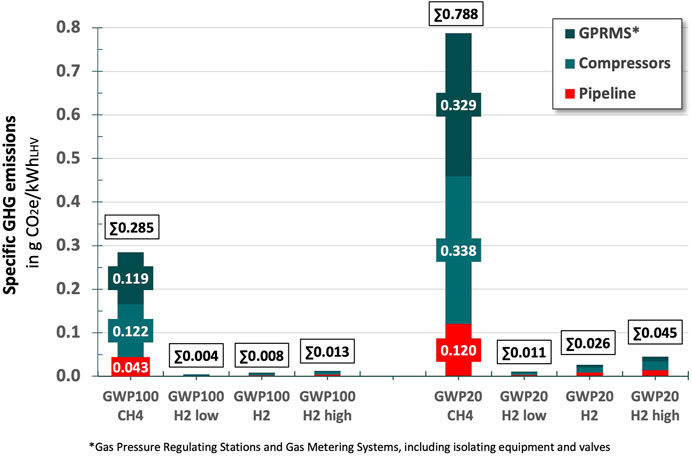
Figure 5. Specific GHG emissions from leakage in the current natural gas transmission network and the future hydrogen core network; comparison of GWP100 and GWP20 as along with consideration of the range of literature references for the GWP of hydrogen.
Finally, if the energy-related emissions of compressor stations are taken into account, emissions from leakage become less important, especially for hydrogen (Figure 6). A comparison of the results for GWP100 with those for GWP20 shows: If GWP20 is used, the share of leakage in the total emissions of methane and hydrogen increases from 16.9% and 1.9% to 36% and 5.8% respectively. In general, including the energy-related emissions further reduces the importance of distinguishing between GWP100 and GWP20 when comparing the GHG emissions of both, the current natural gas transmission network and the future hydrogen transmission network. This is due to the fact that energy usage is assumed to only produce CO2, not additional methane or hydrogen emissions.
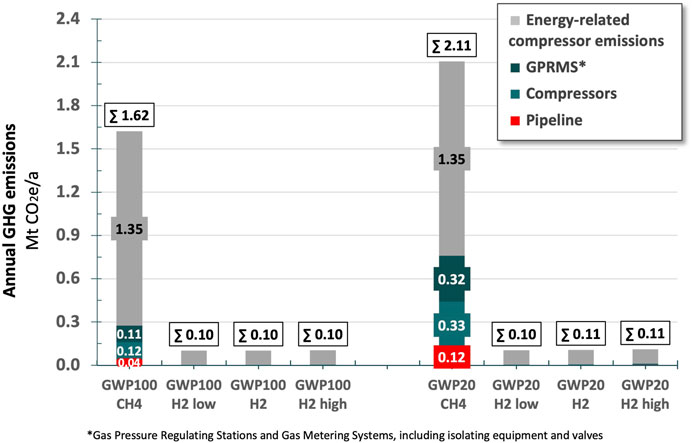
Figure 6. Annual absolute GHG emissions from leakage and energy-related compressor emissions in the current natural gas transmission network and the future hydrogen core network; comparison of GWP100 and GWP20 as along with consideration of the range of literature references for the GWP of hydrogen.
In summary, the results of the sensitivity analysis show that distinguishing between GWP100 and GWP20 is not critical when directly comparing methane and hydrogen emissions, as both gases exhibit a similar ratio of GWP values across both time horizons. This is supported by the fact that methane and hydrogen are short-lived climate forcers, with atmospheric lifetimes of approximately 12 years and 2 years, respectively, which are well below the 20-year time horizon of GWP20. Consequently, the majority of their climate impact is realized – and thus captured – within this period. However, this conclusion applies specifically to comparisons between short-lived substances. As shown by the inclusion of energy-related CO2 emissions in the system boundary (Figures 4, 5), using GWP20 instead of GWP100 can substantially alter the overall climate impact. Since CO2 is a long-lived greenhouse gas with an atmospheric lifetime on the order of centuries, its relative contribution diminishes under the 20-year metric, thereby increasing the proportional effect of short-lived gases. The results of this study therefore indicate that, while GWP100 remains the standard metric for emissions reporting, it is still appropriate for comparing the climate impact associated with leakage of short-lived GHGs. However, when other GHGs such as CO2 emissions (e.g., energy-related) are included in the system boundary, using GWP20 instead can reveal a notable shift toward a higher overall climate impact. Thus, while presenting findings using GWP100 facilitates comparability and consistency with common reporting formats, supplementing them with GWP20-based findings offers valuable insights into the short-term climate effects of short-lived climate forcers and raises awareness of their greater warming potential over shorter timescales.
4 Discussion
4.1 Classification of the results
This study analyses for the first time the net climate impact of switching from the natural gas transmission network to the outlined future hydrogen network in Germany. By providing detailed emissions data at component level within the national transmission network, our results indicate that the GHG emissions of the future hydrogen network are likely to be significantly lower than those of the current natural gas transmission network – both in total and per unit of energy transported. This includes emissions from operational and fugitive leakage as well as energy-related emissions associated with the operation of compressor stations, but not upstream or further downstream emissions. It is, however, particularly important to emphasise that, due to the physical properties of hydrogen and the lower operating pressure, leakage in a future hydrogen network will have a much lower impact on the climate than methane leakage in the current natural gas network. Our findings suggest that leakage-related emissions in the future hydrogen network will only amount to 1%–3% of the emissions from methane leakage in today’s natural gas network, which correspondents to an overall reduction of around 98% (based on GWP100).
Given that the literature on the climate impacts of switching from natural gas to hydrogen transport is very limited, it remains challenging to compare our results with others. While some studies roughly estimate the climate impact of hydrogen leakage within a broader hydrogen economy context (Bertagni et al., 2022; Hauglustaine et al., 2022; Warwick et al., 2023), others go into more detail on the individual stages (Fan et al., 2022; Warwick et al., 2022). However, even studies that include transport often do so in conjunction with other parts of transport such as distribution networks, storage or alternative transport options, without transmission being examined individually. Sun et al. (2024), for example, analysed various applications (e.g., shipping, power generation, steel production, trucks and buses, etc.), but not pipeline transmission. Nevertheless, their results support the finding that substituting fossil references (such as methane) with green hydrogen significantly reduces climate impact of these systems – while acknowledging that hydrogen’s indirect climate impact may slightly reduce, but not negate, these benefits. Similar conclusions were drawn by Ocko and Hamburg (2022), who show that the use of green hydrogen instead of fossil fuels can reduce the climate impact by as much as 100% under certain conditions. However, neither study provided specific estimates for long-distance transmission.
A closer comparison can be made with a recent study by Mar et al. (2024), who showed for Germany that hydrogen emissions even from a “green only” hydrogen value chain could be relevant in 2045. Depending on their low and high emission scenarios and underlying hydrogen demand, total hydrogen emissions would range from 0.71 to 10.8 Mt CO2e/a. However, transportation – including domestic transmission – only accounts for about 0.01–0.18 Mt CO2e/a depending on the assumed rate of leakage and import options. This range for the domestic part of the value chain is significantly higher than our finding of 0.002 Mt CO2e/a resulting from leakage (see Figure 2). The discrepancy arises from their use of generalised percentage-based leakage estimate per km of pipeline rather than a detailed breakdown of specific operating conditions and network components. Given that our study provides a more granular analysis of supra-regional transmission, these methodological differences explain the variance in results. Furthermore, our analysis focuses exclusively on the supra-regional transmission network and does not take into account emissions from hydrogen storage, the distribution network or other options for domestic transport, so it is plausible that the values in our study are lower.
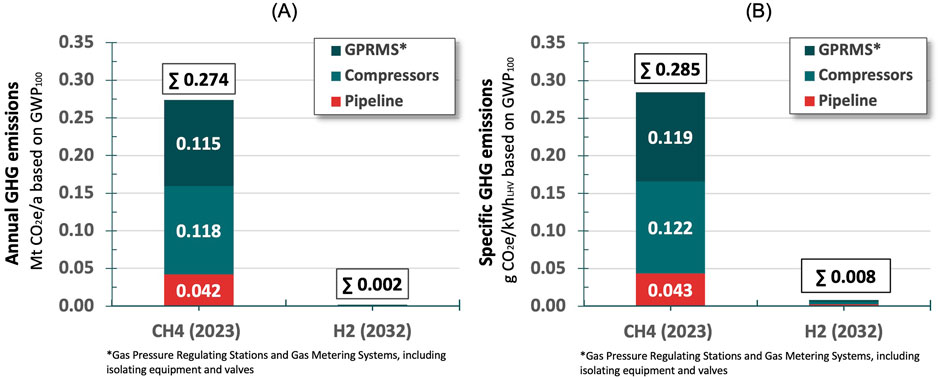
Figure 2. Annual absolute (A) and specific (B) GHG emissions from leakage in the current natural gas transmission network and the future hydrogen core network.
In addition to Mar et al. (2024), only two other studies were identified that specifically address the climate impact of switching from natural gas to hydrogen in the context of gas leakage in transmission networks. FN Consultancy (2022) examined the UK National Transmission System (NTS) under an illustrative scenario, estimating current methane emissions levels at 0.0195 Mt CH4/a (700 TWh of natural gas transported per year) and predicting hydrogen leakage on this basis between 0.003 Mt H2/a (laminar flow) and 0.007 Mt H2/a (turbulent flow), using conventional flow dynamics as in our calculations. This includes leakage from pipework and compressors, as well as other emissions from maintenance or incomplete combustion of gas-fired turbines driving compressors. However, they state that in reality there will be a flow regime somewhere between laminar and turbulent, so they have used an average value for further calculations. For their central hydrogen scenario (476 TWh hydrogen transport in 2050), they further predict emission rates of 0.04% (0.005 Mt H2/a) to 0.48% (0.058 Mt H2/a), equivalent to 0.056 Mt CO2e/a and 0.668 Mt CO2e/a, respectively, using GWP100 values from Sand et al. (2023). By assuming an emission rate for the current NTS about twice as high as in our study (0.0195 vs. 0.001 Mt CH4/a; although the transport volume is lower) and keeping the pressure for both networks the same, while the hydrogen scenario is based on about twice the transport volume for hydrogen, it is not surprising that the climate impact derived here is higher than in our case study. In addition, their higher emission rate appears to be quite conservative as it reflects very high emission rates occurring in the current NTS. However, the assumed average leakage conversion factor between laminar and turbulent flow argues against higher emissions than ours. Taking all this into account, the climate impact estimated by FN Consultancy (2022) – at least in the lower range – is in a similar order of magnitude, albeit slightly higher, which can be explained by the many uncertainties and the lack of reliable quantification. In addition, their findings for the whole energy system highlight that emissions associated with transmission are relatively small compared to other lifecycle stages, such as hydrogen production without avoiding venting and purging (3%–9%), above-ground storage (3%–7%) or liquid road transport (4%–13%). Although NTS emissions do not match our results exactly, their overall results are in line with our study, where transmission emissions are small compared to upstream processes.
Similarly, Arrigoni and Bravo Diaz (2022) present a case study of the Italian gas operator SNAM, estimating methane losses in the current transmission system and extrapolating hydrogen leakage under full network conversion. Based on current methane losses of 0.038% (including transport network, storage and regasification), they found that hydrogen leakage could be 1.25 (laminar flow) to 3 (turbulent flow) times higher, depending on flow conditions. However, besides not stating which flow regime they assumed for the calculations, their study used outdated IPCC AR5 GWP values for methane (IPCC, 2013) and an incorrect derivation of GWP values for hydrogen from the preprint of Ocko and Hamburg (2022), leading to an overestimation of hydrogens climate impact (GWP20: 21; GWP100: 70.5) compared to the final paper. Despite this, they estimate a reduction in greenhouse effect of 81% from 2 to 0.38 Mt CO2/a (GWP20) and 83% from 0.7 to 0.12 Mt CO2e/a (GWP100). Unfortunately, no further details are given on the amount of energy transported or other relevant network activity factors, which makes direct comparison with our results challenging. However, the reductions in global warming impact are in the same order of magnitude as our results, especially considering that the GWP values used are significantly higher and storage as well as regasification is included.
Although the scope of our study is limited to domestic inter-regional transport in Germany, it is important to place these results in the context of the total GHG emissions along the whole gas value chain. This means additionally analysing the upstream emissions by considering the emissions that occur during the extraction, production or import of both hydrogen and natural gas to the German border before the TSOs take over the gas at border crossing points, for example. From these points, the gas is fed into the German transmission system and transported to the region of demand. When conducting this study, an overview of upstream emissions resulting from the production and transportation of hydrogen to German border crossing points was also prepared, including green and blue hydrogen as well as different origins (see Supplementary Table S1). Our findings give a wide range of 12–79 g CO2e/kWhLHV for green hydrogen based on renewable energies and 48–262 g CO2e/kWhLHV for blue hydrogen. These values show the importance of paying attention to the origin and production method, which have a significant effect on the climate benefit of hydrogen usage. Compared to this, the emissions from supra-regional transmission, identified as 0.43 g CO2e/kWhLHV in this study (see Figure 3), have a minor impact, while the upstream processes account for 96%–99% in the case of green hydrogen and 99.1%–99.8% in the case of blue hydrogen, confirming the results of Mar et al. (2024).
Similar conclusions can be drawn for the case of natural gas. In the past, upstream emissions from natural gas imported to Germany were closely linked to the supply of Russian natural gas via pipelines, which came to around 24 g CO2e/kWhLHV (Große et al., 2021). However, if natural gas is imported as LNG from overseas, as is becoming increasingly important for Germany and Europe following the ban on Russian natural gas imports (Dejonghe et al., 2023; Emiliozzi et al., 2023), emissions in the upstream chain can reach up to 98 g CO2e/kWhLHV as shown by Münter and Liebich (2023) in the case of LNG from Algeria. In extreme cases, they can be as high as 201 g CO2e/kWhLHV, as shown for the US in a recent study by Howarth (2024). Taking into account a much higher share of LNG in the European gas market, our own calculations for 2023 (see Supplementary Figure S1; Supplementary Table S2) show a significantly higher footprint for the natural gas supply mix of around 39.9 g CO2e/kWhLHV, which corresponds to an increase of 66% compared to Große et al. (2021). Similar to hydrogen transportation, this illustrates that the emissions from natural gas transmission within Germany, calculated at 1.69 g CO2e/kWhLHV in this study (see Figure 3), are only a small fraction of the emissions from the production and international transportation of natural gas. If one also considers that natural gas produces CO2 emissions in the amount of 197 g CO2e/kWhLHV (assuming stoichiometric combustion of methane) during its end-use phase, whereas hydrogen combustion produces only water with no greenhouse gas effect, the advantages of switching to hydrogen become even greater.
Our findings emphasize that while domestic hydrogen transmission will contribute only a minor fraction of total hydrogen-related emissions in a hydrogen economy, upstream processes must be optimized to maximize hydrogen’s climate benefits. Given Germany’s expected reliance on hydrogen imports (Mar et al., 2024), and although these imports will not count towards Germany’s net-zero target, these emissions still have a significant impact on the global climate. Therefore, measures are not only required to minimise hydrogen emissions from leakage, but even more so to reduce emissions associated with hydrogen production and international transportation. Similar to the development of sustainability criteria that are being discussed regarding the import of hydrogen to Germany (Krieger et al., 2024), the emissions intensity of the imported hydrogen might also be assessed, among other things. This might incentivise importers to give preference to those supplier countries where the lowest emissions occur in the production of hydrogen.
Overall, our study provides a detailed, transmission-specific assessment that complements existing broader hydrogen economy studies. Future work should focus on refining leakage estimates using empirical data from hydrogen pilot projects, integrating regional transport networks, and analysing long-term infrastructure adaptation needs for large-scale hydrogen deployment.
4.2 Uncertainties
The assumptions made in this study are subject to a high degree of uncertainty as it is still not clear what a future hydrogen network will actually look like, nor is it clear what assumptions regarding compressor power, operating pressure and other parameters can be made regarding future hydrogen network topologies. Since the emission rates for hydrogen are largely derived using conversion factors based on the current natural gas structure, which are in turn subject to uncertainties, this further amplifies the uncertainties for hydrogen. However, as these parameters become more robust and reliable with a global hydrogen economy emerging in the next decades, the assumptions should be revised periodically – but for now, statements can only be made on the basis of assumptions. The data used here are, however, largely based on real-world data for natural gas reported within the OGMP2.0 framework and preliminary data for the hydrogen core network provided by the FNB Gas and TSOs. Although, as outlined in Section 2.2.1, this is probably the most reliable basis upon which the assumptions within this study can currently be made, we acknowledge that it should be the subject of a future review. As already stated previously, it should also be noted that the scope of this paper only refers to the transmission network within Germany and does not take into account the distribution network infrastructure or any storage facilities. Including further components of the national or international gas infrastructures could help to provide a more comprehensive understanding of emissions in the natural gas value chain today as well as the future hydrogen value chain.
In the absence of real-world measurements for large-scale hydrogen networks, our assumed emission rates could only be derived using an empirical conversion factor based on methane emissions. However, this conversion factor is subject to many assumptions, some of which can only be estimated today, but are not measurable (Esquivel-Elizondo et al., 2023; Fan et al., 2022). In addition, a separate conversion factor would have to be calculated for different leaking geometries and each network component, but this would go beyond the scope of this study. Furthermore, our simplified assumption of all-turbulent flow, which results in a conversion factor close to the theoretical maximum, can be considered conservative (Cooper et al., 2022; Garrison and Gant, 2021). However, it is likely to be encountered in most of the transmission network due to the high operating pressures (Anghilante et al., 2023).
In addition to the standard metric (GWP100), the GWP20 sensitivity shows the difference of assessing short-lived greenhouse gases such as methane and hydrogen over a 20-year period instead of 100 years. Although the climate impact of the transmission networks is correspondingly higher for the shorter time horizon, this consideration is not crucial for the direct comparisons made here, since the GWP20 is higher than the GWP100 by a similar ratio for both methane and hydrogen (see Table 4). However, when the GWP20 is applied, the proportion of network emissions shifts significantly towards leakage, as only CO2 is produced in the energy-related compressor emissions and its GWP value is identical for both periods. Even taking into account the given range of hydrogen’s GWP (GWP100: 6–18; GWP20: 15.2–64.2), the distinction between GWP100 and GWP20 only plays a minor role in the comparison between hydrogen and natural gas. This is due to the relatively small contribution of hydrogen emissions to the total GHG emissions of the network operation (see Figure 6). However, given the uncertainty of ±2.8 in Sand et al. (2023), it is well in line with other GHGs such as methane (±11) and N2O (±130), which are far more prominent in climate science and policy debates and, not least, have been an integral part of IPCC reporting since its inception (IPCC, 2023; Mar et al., 2024).
4.3 Further research needs
Despite numerous studies, knowledge of the exact climate effects of hydrogen emissions on the atmosphere is still incomplete. Many influencing factors are not yet fully understood and quantified or are neglected (Chen et al., 2024; Paulot et al., 2024). Further research is therefore needed to reliably assess the climate impact of hydrogen. In addition, the actual hydrogen leakage from a future hydrogen infrastructure is not yet known (Cooper et al., 2022; Esquivel-Elizondo et al., 2023; Mar et al., 2024). The emission rates currently considered rely on estimates, which lack confirmation through in situ measurements in almost all cases. However, the ongoing development of hydrogen emission detection, such as application of high-precision sensors (Arrigoni and Bravo Diaz, 2022; Westra et al., 2024), should provide increasingly accurate real-world measurement data to verify and further develop the assumptions made here in the future (Mar et al., 2024). Furthermore, existing hydrogen pipelines could be equipped with enhanced measurement technology to provide accurate and realistic emission data. In addition, system-wide investigations under real operating conditions are needed to derive specific emission values and conversion factors for different network components. Investment in hydrogen emission quantification tools and new measurement initiatives will therefore be crucial in the future (Esquivel-Elizondo et al., 2023; Fan et al., 2022; Mar et al., 2024). For a system-wide view, it is also necessary to examine applicability to the distribution network level and storage infrastructure.
There is also a need for future research to better understand processes in the global hydrogen cycle. Although the basic understanding is solid, natural sinks and sources of hydrogen – especially the sink effect of the soil – still represent a major uncertainty factor and contribute the most to the uncertainty range of GWP values (Arrigoni and Bravo Diaz, 2022; Chen et al., 2024; Paulot et al., 2024; Sand et al., 2023; Warwick et al., 2023). However, as shown in the recent study by Chen et al. (2024), using methane as the reference gas for the GWP metric can be useful to compensate for some factors that apply to both hydrogen and methane and simplify the time dependence of GWP. Using methane as a reference instead of CO2 would therefore have several advantages: (1) It removes the uncertainty due to possible errors in estimating the lifetime of methane. (2) It removes errors in radiative properties and hydrogen GWP with respect to methane, so that a plateau is reached after about 15 years. (3) A direct comparison of hydrogen with fossil methane could be helpful in considering the advantages of using hydrogen instead of methane as a fuel.
5 Conclusion
Hydrogen has the potential to become an important part of a sustainable energy supply. Nevertheless, its impact on climate change should not be overlooked. Our case study of the future German hydrogen core network shows that the planned switch from natural gas to hydrogen will be associated with a significant reduction in climate impact from a national transmission network perspective. Although the indirect warming potential of hydrogen has been scientifically proven, its impact on the system under consideration is limited and does not outweigh the climate benefits of switching to hydrogen as an energy source. This is also true of conservative assumptions, for example, the assumed GWP of hydrogen or the magnitude of hydrogen losses along network components.
To meet climate change targets, however, the full life cycle emissions of hydrogen along the whole value chain should be taken into account. Although the potential of hydrogen as a low-carbon fuel remains promising, policymakers and industry stakeholders should consider the (indirect) warming effects when evaluating hydrogen as a cornerstone of decarbonisation efforts. The continued refinement of GWP estimates and climate models, especially concerning the interactions of hydrogen with atmospheric methane and ozone, will be essential to more accurately assess the role of hydrogen in climate change mitigation. The climate benefits of hydrogen over fossil alternatives, especially for sectors that are considered hard to abate, should by no means be denied, but awareness of the potential climate impact of hydrogen emissions needs to be raised – by the gas industry itself, by industry in general and by policymakers, but also by the public sector.
Although the (indirect) climate impact of hydrogen was already acknowledged and discussed in the IPCC’s Fourth Assessment Report (AR4), hydrogen has not yet been included as GHG in the official list of reportable greenhouse gases due to the indirect nature of its impact (IPCC, 2007; 2023). However, in light of national and European climate protection goals, it is important to avoid all climate-relevant emissions as much as possible. Against this background, it is important that the current state of research on the climate impact of hydrogen is incorporated into political decisions and application-oriented research as soon as possible.
Data availability statement
The data provided by FNB Gas e.V. (FNB Gas, 2024a) for the current natural gas transmission network as well as estimates for the future hydrogen core network, including emissions, energy consumption and operating parameters (see Section 2.2), will be made available by the authors and in coordination with FNB Gas e.V. upon request. Requests to access these datasets should be directed to YWxleGFuZGVyLmp1ZWxpY2hAd3VwcGVyaW5zdC5vcmc=.
Author contributions
AJ: Conceptualization, Data curation, Methodology, Resources, Validation, Visualization, Writing – original draft, Writing – review and editing. MB: Data curation, Methodology, Validation, Visualization, Writing – original draft. OZ: Conceptualization, Funding acquisition, Methodology, Project administration, Resources, Supervision, Writing – review and editing. PV: Conceptualization, Funding acquisition, Supervision, Writing – review and editing.
Funding
The author(s) declare that financial support was received for the research and/or publication of this article. The authors gratefully acknowledge the financial support of the German Association of Transmission System Operators Gas (FNB Gas e.V.) and the German Technical and Scientific Association for Gas and Water (DVGW e.V.) for the execution of the H2KLIM research project, which formed the basis for this article. We would also like to acknowledge the financial support of the Association of the Friends of the Wuppertal Institute to enable the publication and the preparation of this article. Finally, we acknowledge financial support by the Wuppertal Institute for Climate, Environment and Energy within the Open Access Publishing funding programme. Sole responsibility for the content of this paper lies with the authors.
Acknowledgments
We would like to acknowledge the valuable collaboration with the German Association of Transmission System Operators Gas (FNB Gas e.V.) and the German Technical and Scientific Association for Gas and Water (DVGW e.V.), whose network-related data significantly enhanced the accuracy of this research.
Conflict of interest
The authors declare that the research was conducted in the absence of any commercial or financial relationships that could be construed as a potential conflict of interest. The authors declare that the study on which this article is based received funding from the German Association of Transmission System Operators Gas (FNB Gas e.V.) and the German Technical and Scientific Association for Gas and Water (DVGW e.V.). The funders had the following involvement with the study: Discussion of study design and results, collection of data, decision to submit the results for publication.
Generative AI statement
The author(s) declare that no Generative AI was used in the creation of this manuscript.
Publisher’s note
All claims expressed in this article are solely those of the authors and do not necessarily represent those of their affiliated organizations, or those of the publisher, the editors and the reviewers. Any product that may be evaluated in this article, or claim that may be made by its manufacturer, is not guaranteed or endorsed by the publisher.
Supplementary material
The Supplementary Material for this article can be found online at: https://www.frontiersin.org/articles/10.3389/fenrg.2025.1548309/full#supplementary-material
Footnotes
1Here, the term climate neutral refers to direct global warming potential from combustion, not including any upstream emissions.
References
Agora Think Tanks (2024). Climate-neutral Germany. From target-setting to implementation. Available online at: https://www.agora-energiewende.org/publications/climate-neutral-germany-executive-summary. (Accessed December 19, 2024)
Anghilante, R., Bhagwan, R., Dörr, H., Burmeister, F., Joormann, N., Oberschelp, L., et al. (2023). ECLHYPSE. Experimentelle Charakterisierung der Leckraten von Prüflecks mit H2 und/oder CH4-H2-Gasgemischen gegenüber Luft. Abschlussbericht (DVGW-Innovationsprogramm Wasserstoff - G 202138). DVGW ebi, GWI e.V. Available online at: https://www.dvgw-regelwerk.de/plus#technische-regel/dvgw-g-202138/3e5669.
Araújo, O. Q. F., and de Medeiros, J. L. (2023). Hydrogen in the energy transition: some roles, issues, and questions. Clean Technol. Environ. Policy 25 (7), 2071–2073. doi:10.1007/s10098-023-02593-1
Arrigoni, A., and Bravo Diaz, L. (2022). Hydrogen emissions from a hydrogen economy and their potential global warming impact: Summary report of the Clean Hydrogen Joint Undertaking expert workshop on the Environmental Impacts of Hydrogen. (JRC Technical Report). Joint Research Centre JRC. Available online at: https://data.europa.eu/doi/10.2760/065589.
Bertagni, M. B., Pacala, S. W., Paulot, F., and Porporato, A. (2022). Risk of the hydrogen economy for atmospheric methane. Nat. Commun. 13 (1), 7706. doi:10.1038/s41467-022-35419-7
BMWK (2021). Federal climate change Act (Bundes-Klimaschutzgesetz – KSG). Federal Ministry for Economic Affairs and Climate Action BMWK. Available online at: https://www.bmuv.de/fileadmin/Daten_BMU/Download_PDF/Gesetze/ksg_final_en_bf.pdf.
BMWK (2023). National hydrogen strategy update. Federal Ministry for Economic Affairs and Climate Action BMWK. Available online at: https://www.bmwk.de/Redaktion/EN/Publikationen/Energie/national-hydrogen-strategy-update.pdf?__blob=publicationFile&v=2.
BNetzA (2024a). Current status of gas supply. Federal Network Agency BNetzA. Available online at: https://www.bundesnetzagentur.de/EN/Areas/Energy/SecurityOfSupply/GasSupply/start.html.
BNetzA (2024b). Approval for the hydrogen core network. Federal Network Agency BNetzA. Available online at: https://www.bundesnetzagentur.de/EN/Areas/Energy/HydrogenCoreNetwork/start.html.
Böttcher, C. (2023). Update of methane emission factors for natural gas supply (No. 143/2023; TEXTE). German Environment Agency UBA. Available online at: https://www.umweltbundesamt.de/sites/default/files/medien/11850/publikationen/143_2023_texte_update_of_methane_emission_factors_for_natural_gas_supply_0.pdf.
Briottet, L., Batisse, R., de Dinechin, G., Langlois, P., and Thiers, L. (2012). Recommendations on X80 steel for the design of hydrogen gas transmission pipelines. Int. J. Hydrogen Energy 37 (11), 9423–9430. doi:10.1016/j.ijhydene.2012.02.009
Broerman, E., Blais, M. S., Weyandt, N., and Renzi, P. (2022). Chapter 12—safety. In K. Brun, and T. Allison, Machinery and energy systems for the hydrogen economy (521–542). Amsterdam, Netherlands: Elsevier. doi:10.1016/B978-0-323-90394-3.00011-4
Brown, G. O. (2002). “The history of the Darcy-weisbach equation for pipe flow resistance,” in Environmental and water resources history, 34–43. doi:10.1061/40650(2003)4
Bryant, H. N., Stevenson, D. S., Heal, M. R., and Abraham, N. L. (2024). Impacts of hydrogen on tropospheric ozone and methane and their modulation by atmospheric NOx. Front. Energy Res. 12. doi:10.3389/fenrg.2024.1415593
BWMK (2024). Long-term Scenarios 3. Scientific analyses on the decarbonization of Germany. Federal Ministry for Economic Affairs and Climate Action BMWK. Available online at: https://langfristszenarien.de/enertile-explorer-en/.
Campari, A., Ustolin, F., Alvaro, A., and Paltrinieri, N. (2023). A review on hydrogen embrittlement and risk-based inspection of hydrogen technologies. Int. J. Hydrogen Energy 48 (90), 35316–35346. doi:10.1016/j.ijhydene.2023.05.293
Chen, C., Solomon, S., and Stone, K. (2024). On the chemistry of the global warming potential of hydrogen. Front. Energy Res. 12. doi:10.3389/fenrg.2024.1463450
Cohen-Shields, N., Sun, T., Hamburg, S. P., and Ocko, I. B. (2023). Distortion of sectoral roles in climate change threatens climate goals. Front. Clim. 5. doi:10.3389/fclim.2023.1163557
Cooper, J., Dubey, L., Bakkaloglu, S., and Hawkes, A. (2022). Hydrogen emissions from the hydrogen value chain-emissions profile and impact to global warming. Sci. Total Environ. 830, 154624. doi:10.1016/j.scitotenv.2022.154624
Dejonghe, M., Van de Graaf, T., and Belmans, R. (2023). From natural gas to hydrogen: navigating import risks and dependencies in Northwest Europe. Energy Res. Soc. Sci. 106, 103301. doi:10.1016/j.erss.2023.103301
Derwent, R., Simmonds, P., O’Doherty, S., Manning, A., Collins, W., and Stevenson, D. (2006). Global environmental impacts of the hydrogen economy. Int. J. Nucl. Hydrogen Prod. Appl. 1, 57–67. doi:10.1504/IJNHPA.2006.009869
Derwent, R. G. (2018). Hydrogen for heating: atmospheric impacts—a literature review. (No. 21; BEIS Research Paper). Available online at: https://www.gov.uk/government/publications/atmospheric-impacts-of-hydrogen-literature-review.
Derwent, R. G. (2023). Global warming potential (GWP) for hydrogen: sensitivities, uncertainties and meta-analysis. Int. J. Hydrogen Energy 48 (22), 8328–8341. doi:10.1016/j.ijhydene.2022.11.219
Derwent, R. G., Collins, W. J., Johnson, C. E., and Stevenson, D. S. (2001). Transient behaviour of tropospheric ozone precursors in a global 3-D CTM and their indirect greenhouse effects. Clim. Change 49 (4), 463–487. doi:10.1023/A:1010648913655
Derwent, R. G., Stevenson, D. S., Utembe, S. R., Jenkin, M. E., Khan, A. H., and Shallcross, D. E. (2020). Global modelling studies of hydrogen and its isotopomers using STOCHEM-CRI: likely radiative forcing consequences of a future hydrogen economy. Int. J. Hydrogen Energy 45 (15), 9211–9221. doi:10.1016/j.ijhydene.2020.01.125
Duan, L., and Caldeira, K. (2022). “Comment on “climate consequences of hydrogen emissions” by Ocko and Hamburg (2022),”Atmos. Chem. Phys. Discuss. 23 (10) 1–23.
Elgowainy, A., Vyawahare, P., Ng, C., Frank, E. D., Bafana, A., Burnham, A., et al. (2024). Environmental life-cycle analysis of hydrogen technology pathways in the United States. Front. Energy Res. 12. doi:10.3389/fenrg.2024.1473383
Emiliozzi, S., Ferriani, F., and Gazzani, A. G. (2023). The European energy crisis and the consequences for the global natural gas market. Soc. Sci. Res. Netw. (SSRN Scholarly Paper No. 4640202). doi:10.2139/ssrn.4640202
Esquivel-Elizondo, S., Hormaza Mejia, A., Sun, T., Shrestha, E., Hamburg, S. P., and Ocko, I. B. (2023). Wide range in estimates of hydrogen emissions from infrastructure. Front. Energy Res. 11. doi:10.3389/fenrg.2023.1207208
European Comission (2024). Methane emissions—European commission. Available online at: https://energy.ec.europa.eu/topics/carbon-management-and-fossil-fuels/methane-emissions_en.
European Hydrogen Backbone (2024). European hydrogen Backbone: boosting EU resilience and competitiveness. European hydrogen Backbone. Available online at: https://www.ehb.eu/files/downloads/1732103116_EHB-Boosting-EU-Resilience-and-Competitiveness-20-11-VF.pdf.
Fan, Z., Sheerazi, H., Bhardwaj, A., Corbeau, A.-S., Castañeda, A., Merz, A.-K., et al. (2022). Hydrogen leakage: a potential risk for the hydrogen economy. Center on Global Energy Policy. Available online at: https://www.energypolicy.columbia.edu/sites/default/files/file-uploads/HydrogenLeakageRegulations_CGEP_Commentary_070722_0.pdf.
Feck, T., Grooß, J.-U., and Riese, M. (2008). Sensitivity of Arctic ozone loss to stratospheric H2O. Geophys. Res. Lett. 35 (1), 2007GL031334. doi:10.1029/2007GL031334
Field, R. A., and Derwent, R. G. (2021). Global warming consequences of replacing natural gas with hydrogen in the domestic energy sectors of future low-carbon economies in the United Kingdom and the United States of America. Int. J. Hydrogen Energy 46 (58), 30190–30203. doi:10.1016/j.ijhydene.2021.06.120
Fischer, B., Kaiser, M., Lang, B., van Almsick, T., Vetter, S., Winzer, N., et al. (2021). Pilotprojekt zur Erfassung flüchtiger emissionen im gastransportnetz. Essen, Germany: gwf-Gas + Energie, Vulkan–Verlag GmbH.
FNB Gas (2024a). “Data for activity factors, emissions factors and operating parameters for the current natural gas transmission network and the future hydrogen core network, provided for the research project H2KLIM,” in Association of system transmission operators gas (FNB Gas e.V.) Berlin, Germany: Vereinigung der Fernleitungsnetzbetreiber Gas e.V.
FNB Gas (2024b). “Hydrogen core network,” in Association of system transmission operators gas. (FNB Gas e.V.). Available online at: https://fnb-gas.de/en//en/hydrogen-core-network/. (Accessed December 19, 2024)
FNB Gas (2024c). “Transmission system,” in Association of system transmission operators gas. (FNB Gas e.V.). Available online at: https://fnb-gas.de/en//en/security-of-supply/transmission-system/. (Accessed December 19, 2024)
FNB Gas (2025). Methane emissions. Methane emissions. Available online at: https://fnb-gas.de/en//en/energy-future/methane-emissions/. (Accessed December 19, 2024)
FN Consultancy (2022). Fugitive hydrogen emissions in a future hydrogen economy. Frazer-Nash Consultancy. Available online at: https://www.gov.uk/government/publications/fugitive-hydrogen-emissions-in-a-future-hydrogen-economy.
Forster, P. M. de F., and Shine, K. P. (2002). Assessing the climate impact of trends in stratospheric water vapor. Geophys. Res. Lett. 29 (6), 10-1-10–10-1-14. doi:10.1029/2001GL013909
Garrison, A., and Gant, S. (2021). An investigation into the change leakage when switching from natural gas to hydrogen in the UK gas distribution network. International Conference on Hydrogen Safety. Available online at: https://www.researchgate.net/publication/368394296_An_Investigation_into_the_Change_Leakage_when_Switching_from_Natural_Gas_to_Hydrogen_in_the_UK_Gas_Distribution_Network. (Accessed December 19, 2024)
Gascade (2024). Our network for Germany and Europe. Kassel, Germany: Gascade Gastransport GmbH. Available online at: https://www.gascade.de/en/about-us/our-infrastructure.
Große, C., Eyßer, M., Lehmann, S., and Behnke, M. (2021). CFNG1.1 Carbon Footprint of Natural Gas 1.1. Abschlussbericht. DBI Gas-und Umwelttechnik GmbH. Available online at: https://gas.info/fileadmin/Public/PDF-Download/carbon-footprint-von-erdgas-dbi-studie.pdf.
Hauglustaine, D., Paulot, F., Collins, W., Derwent, R., Sand, M., and Boucher, O. (2022). Climate benefit of a future hydrogen economy. Commun. Earth and Environ. 3 (1), 295. doi:10.1038/s43247-022-00626-z
Hormaza Mejia, A., Brouwer, J., and Mac Kinnon, M. (2020). Hydrogen leaks at the same rate as natural gas in typical low-pressure gas infrastructure. Int. J. Hydrogen Energy 45 (15), 8810–8826. doi:10.1016/j.ijhydene.2019.12.159
Howarth, R. W. (2024). The greenhouse gas footprint of liquefied natural gas (LNG) exported from the United States. Energy Sci. Eng. 12 (11), 4843–4859. doi:10.1002/ese3.1934
Icha, P., and Lauf, D. T. (2024). Entwicklung der spezifischen treibhausgas-emissionen des deutschen Strommix in den Jahren 1990 - 2023 (No. 23/2024; CLIMATE CHANGE). Federal Environmental Agency UBA. Available online at: https://www.umweltbundesamt.de/sites/default/files/medien/11850/publikationen/23_2024_cc_strommix_11_2024.pdf. (Accessed December 19, 2024)
IEA (2024). Global hydrogen review 2024. Paris, France: International Energy Agency. Available online at: https://iea.blob.core.windows.net/assets/89c1e382-dc59-46ca-aa47-9f7d41531ab5/GlobalHydrogenReview2024.pdf.
IPCC (2007). Climate change 2007: the physical science basis – working group I contribution to the Fourth assessment report of the intergovernmental panel on climate change. Cambridge: Cambridge University Press.
IPCC (2013). Climate change 2013: the physical science basis –contribution of working group I to the fifth assessment report of the intergovernmental panel on climate change. Available online at: https://www.ipcc.ch/report/ar5/wg1/. (Accessed December 19, 2024)
IPCC (2018). “Global warming of 1.5° C: an IPCC special report on the impacts of global warming of 1.5° C above pre-industrial levels and related global greenhouse gas emission pathways,” in The context of strengthening the global response to the threat of climate change, sustainable development, and efforts to eradicate poverty (Intergovernmental Panel on Climate Change). Available online at: https://www.ipcc.ch/site/assets/uploads/sites/2/2019/06/SR15_Full_Report_High_Res.pdf. (Accessed December 19, 2024)
IPCC (2023). Climate change 2021: the physical science basis – working group I contribution to the sixth assessment report of the intergovernmental panel on climate change. Cambridge: Cambridge University Press. doi:10.1017/9781009157896
IRENA (2024). International co-operation to accelerate green hydrogen deployment. International Renewable Energy Agency. Available online at: https://www.irena.org/Publications/2024/Apr/International-co-operation-to-accelerate-green-hydrogen-deployment. (Accessed December 19, 2024)
Jia, G., Lei, M., Li, M., Xu, W., Li, R., Lu, Y., et al. (2023). Hydrogen embrittlement in hydrogen-blended natural gas transportation systems: a review. Int. J. Hydrogen Energy 48 (82), 32137–32157. doi:10.1016/j.ijhydene.2023.04.266
Krieger, S., Heinemann, C., and Loschke, C. (2024). Sustainability dimensions of hydrogen production in countries of the Global South. Insights into the current debate and approaches to implementation. [Overview Study]. Öko-Institut e.V. Available online at: https://www.oeko.de/publikation/sustainability-dimensions-of-hydrogen-production-in-countries-of-the-global-south/. (Accessed December 19, 2024)
LaFleur, C., Hecht, E., Ehrhart, B., Ronevich, J., and San Marchi, C. (2023). Chapter 16—safety of hydrogen for large-scale energy deployment in a decarbonized economy. In A. Scipioni, A. Manzardo, and J. Ren, Hydrogen economy (Second Edition) (511–535). Cambridge: Academic Press. doi:10.1016/B978-0-323-99514-6.00011-X
Lakshmanan, S., and Bhati, M. (2024). Unravelling the atmospheric and climate implications of hydrogen leakage. Int. J. Hydrogen Energy 53, 807–815. doi:10.1016/j.ijhydene.2023.12.010
Lechtenböhmer, S., and Samadi, S. (2022). Key strategies to achieve deep decarbonisation of the industry sector: insights from a meta-analysis of recent climate neutrality scenarios for Germany. ECEEE 2022 Summer Study, 1431–1442. Available online at: https://epub.wupperinst.org/frontdoor/index/index/docId/8005. (Accessed December 19, 2024)
Liu, D. M. (2024). Extended design philosophy of hydrogen transport pipelines. J. Pipeline Sci. Eng. 5, 100228. doi:10.1016/j.jpse.2024.100228
Mar, K. A., Quitzow, R., Haberkost, F., Horn, M. C., Lentschig, H., Unger, C., et al. (2024). Controlling emissions in Germany’s future hydrogen economy: entry-points for policy action. Potsdam, Germany: RIFS Forschungsinstitut fü Nachhaltigkeit | am GFZ. doi:10.48481/rifs.2024.016
Megill, L., Deck, K., and Grewe, V. (2024). Alternative climate metrics to the global warming potential are more suitable for assessing aviation non-CO2 effects. Commun. Earth and Environ. 5 (1), 249. doi:10.1038/s43247-024-01423-6
Mendelevitch, R., and Heinemann, C. (2024). Einordnung zur Treibhausgaswirkung von Wasserstoff—Bestehende Literatur und Beispielrechnung mit Zahlen des PB 2023. Öko-Institut e.V. Available online at: https://www.oeko.de/publikation/einordnung-zur-treibhausgaswirkung-von-wasserstoff-bestehende-literatur-und-beispielrechnung-mit-zahlen-des-pb-2023/. (Accessed December 19, 2024)
Münter, D., and Liebich, A. (2023). Analyse der Treibhausgasintensitäten von LNG-Importen nach Deutschland – Studie im Auftrag der Wissenschaftsplattform Klimaschutz. ifeu – Institut für Energie- und Umweltforschung. Available online at: https://www.ifeu.de/fileadmin/uploads/Publikationen/Ressourcen/WPKS-Studie-CO2Bilanz_Analyse_der_Treibhausgasintensit%C3%A4ten_LNG.pdf. (Accessed December 19, 2024)
Ocko, I. B., and Hamburg, S. P. (2022). Climate consequences of hydrogen emissions. Atmos. Chem. Phys. 22 (14), 9349–9368. doi:10.5194/acp-22-9349-2022
Østby, E., Hugaas, B.-A., and Horn, A. M. (2021). “Hydrogen’s peculiar effect on material properties: do we need to Be concerned about hydrogen transport in pipelines?,” in ASME 2021 40th international conference on ocean. HØvik, Norway: Offshore and Arctic Engineering. doi:10.1115/OMAE2021-63753
Paulot, F., Paynter, D., Naik, V., Malyshev, S., Menzel, R., and Horowitz, L. W. (2021). Global modeling of hydrogen using GFDL-AM4.1: sensitivity of soil removal and radiative forcing. Int. J. Hydrogen Energy 46 (24), 13446–13460. doi:10.1016/j.ijhydene.2021.01.088
Paulot, F., Pétron, G., Crotwell, A. M., and Bertagni, M. B. (2024). Reanalysis of NOAA H2 observations: implications for the H2 budget. Atmos. Chem. Phys. 24 (7), 4217–4229. doi:10.5194/acp-24-4217-2024
Prather, M. J., Holmes, C. D., and Hsu, J. (2012). Reactive greenhouse gas scenarios: systematic exploration of uncertainties and the role of atmospheric chemistry. Geophys. Res. Lett. 39 (9). doi:10.1029/2012GL051440
Riddick, S. N., and Mauzerall, D. L. (2023). Likely substantial underestimation of reported methane emissions from United Kingdom upstream oil and gas activities. Energy and Environ. Sci. 16 (1), 295–304. doi:10.1039/D2EE03072A
Riddick, S. N., Mbua, M., Santos, A., Hartzell, W., and Zimmerle, D. J. (2024). Potential underestimate in reported bottom-up methane emissions from oil and gas operations in the Delaware basin. Atmosphere 15 (2), 202. doi:10.3390/atmos15020202
Riemer, M., and Wachsmuth, J. (2022). Ist Wasserstoff treibhausgasneutral? Stand des Wissens in Bezug auf diffuse Wasserstoffemissionen und ihre Treibhauswirkung. Federal Environmental Agency UBA. Available online at: https://www.umweltbundesamt.de/dokument/ist-wasserstoff-treibhausgasneutral-stand-des. (Accessed December 19, 2024)
Roueff, E., Abgrall, H., Czachorowski, P., Pachucki, K., Puchalski, M., and Komasa, J. (2019). The full infrared spectrum of molecular hydrogen. Astronomy and Astrophysics 630, A58. doi:10.1051/0004-6361/201936249
Sand, M., Skeie, R. B., Sandstad, M., Krishnan, S., Myhre, G., Bryant, H., et al. (2023). A multi-model assessment of the Global Warming Potential of hydrogen. Commun. Earth and Environ. 4 (1), 203–212. doi:10.1038/s43247-023-00857-8
Schultz, M. G., Diehl, T., Brasseur, G. P., and Zittel, W. (2003). Air pollution and climate-forcing impacts of a global hydrogen economy. Science 302 (5645), 624–627. doi:10.1126/science.1089527
Steiner, M., Marewski, U., and Silcher, H. (2023). DVGW-Projekt SyWeSt H2: “Stichprobenhafte Überprüfung von Stahlwerkstoffen für Gasleitungen und Anlagen zur Bewertung auf Wasserstofftauglichkeit”. (Abschlussbericht No. DVGW-Förderkennzeichen G 202006). DVGW. Available online at: https://www.dvgw.de/medien/dvgw/forschung/berichte/g202006-sywesth2-staehle.pdf. (Accessed December 19, 2024)
Sun, T., Shrestha, E., Hamburg, S. P., Kupers, R., and Ocko, I. B. (2024). Climate impacts of hydrogen and methane emissions can considerably reduce the climate benefits across key hydrogen use cases and time scales. Environ. Sci. Technol. 58, 5299–5309. doi:10.1021/acs.est.3c09030
Swain, M. R., and Swain, M. N. (1992). A comparison of H2, CH4 and C3H8 fuel leakage in residential settings. Int. J. Hydrogen Energy 17 (10), 807–815. doi:10.1016/0360-3199(92)90025-R
Télessy, K., Barner, L., and Holz, F. (2024). Repurposing natural gas pipelines for hydrogen: limits and options from a case study in Germany. Int. J. Hydrogen Energy 80, 821–831. doi:10.1016/j.ijhydene.2024.07.110
Thawani, B., Hazael, R., and Critchley, R. (2023). Assessing the pressure losses during hydrogen transport in the current natural gas infrastructure using numerical modelling. Int. J. Hydrogen Energy 48 (88), 34463–34475. doi:10.1016/j.ijhydene.2023.05.208
Tromp, T. K., Shia, R.-L., Allen, M., Eiler, J. M., and Yung, Y. L. (2003). Potential environmental impact of a hydrogen economy on the stratosphere. Science 300 (5626), 1740–1742. doi:10.1126/science.1085169
UBA (2020). The Ozone Situation in Germany. State of knowledge, research gaps and recommendations (No. 04/2020; Documentations). Federal Environmental Agency UBA. Available online at: https://www.umweltbundesamt.de/sites/default/files/medien/479/publikationen/dokumentation_04-2020_uba-iass_ozon-workshop_eng.pdf. (Accessed December 19, 2024)
UNEP (2024). OGMP 2.0 – the oil and gas methane partnership 2.0. Available online at: https://ogmpartnership.com/. (Accessed December 19, 2024)
UNFCCC (1997). Kyoto protocol to the united nations framework convention on climate change. United Nations Framework Convention on Climate Change UNFCCC. Available online at: https://unfccc.int/documents/2409. (Accessed December 19, 2024)
Vogt, T., Grooß, J.-U., Riese, M., and Vogel, B. (2009). Stratospheric cooling and polar ozone loss due to H2 emissions of a global hydrogen economy. Geophys. Res. Abstr. 11, 8823.
Wang, A., Jens, J., Mavins, D., and Moultak, M. (2021). Analysing future demand, supply, and transport of hydrogen. Available online at: https://www.h2knowledgecentre.com/content/policypaper2256. (Accessed December 19, 2024)
Warwick, N., Archibald, A., Griffiths, P., Keeble, J., O’Connor, F., Pyle, J., et al. (2023). Atmospheric composition and climate impacts of a future hydrogen economy. Atmos. Chem. Phys. 23 (20), 13451–13467. doi:10.5194/acp-23-13451-2023
Warwick, N., Griffiths, P., Keeble, J., Archibald, A., and Pyle, J. (2022). Atmospheric implications of increased Hydrogen use. Goverment of UK: Department for Business, Energy and Industrial Strategy. Available online at: https://assets.publishing.service.gov.uk/media/624eca7fe90e0729f4400b99/atmospheric-implications-of-increased-hydrogen-use.pdf. (Accessed December 19, 2024)
Westra, I. M., Scheeren, H. A., Stroo, F. T., van Heuven, S. M. A. C., Kers, B. A. M., Peters, W., et al. (2024). First detection of industrial hydrogen emissions using high precision mobile measurements in ambient air. Sci. Rep. 14 (1), 24147. doi:10.1038/s41598-024-76373-2
Yang, R., Schell, C. A., Rayasam, D., and Groth, K. M. (2025). Hydrogen impact on transmission pipeline risk: probabilistic analysis of failure causes. Reliab. Eng. Syst. Saf. 257, 110825. doi:10.1016/j.ress.2025.110825
Yueksel-Erguen, I., Zittel, J., Wang, Y., Hennings, F., and Koch, T. (2020). Lessons learned from gas network data preprocessing. Available online at: https://opus4.kobv.de/opus4-zib/frontdoor/index/index/docId/7826. (Accessed December 19, 2024)
Keywords: Hydrogen, methane, global warming potential, fugitive emissions, hydrogen leakage, hydrogen network, hydrogen pipeline transport, Germany
Citation: Jülich A, Blum M, Zelt O and Viebahn P (2025) From natural gas to hydrogen: Climate impacts of current and future gas transmission networks in Germany. Front. Energy Res. 13:1548309. doi: 10.3389/fenrg.2025.1548309
Received: 19 December 2024; Accepted: 17 April 2025;
Published: 19 May 2025.
Edited by:
Sofia Esquivel-Elizondo, Environmental Defense Fund Europe, NetherlandsReviewed by:
Gianluca Pasini, University of Pisa, ItalyNohora A Hormaza Mejia, California State Polytechnic University, Pomona, United States
Copyright © 2025 Jülich, Blum, Zelt and Viebahn. This is an open-access article distributed under the terms of the Creative Commons Attribution License (CC BY). The use, distribution or reproduction in other forums is permitted, provided the original author(s) and the copyright owner(s) are credited and that the original publication in this journal is cited, in accordance with accepted academic practice. No use, distribution or reproduction is permitted which does not comply with these terms.
*Correspondence: Alexander Jülich, YWxleGFuZGVyLmp1ZWxpY2hAd3VwcGVyaW5zdC5vcmc=