 Lin Jiang1
 Caili Xiang
- 1Zhuhai Power Supply Bureau of Guangdong Power Grid Co., Ltd., Zhuhai, Guangdong, China
- 2Automation School, Wuhan University of Technology, Wuhan, China
As a traditional fault recovery strategy, network reconfiguration changes the structure of a distribution network by changing the switching state to achieve a normal power supply for non-fault power loss. Distributed access, such as wind power and photovoltaics, will cause voltage and frequency fluctuations. Traditional tie switches cannot adapt to this change, which may lead to reconstruction failure. A flexible interconnection device can suppress the negative impact of these large-scale sources and loads with strong uncertainty and volatility on the power supply quality and system stability. This paper proposes a fault recovery strategy for a distribution network considering wind and solar consumption. First, through the analysis of the fault recovery process of a distribution network, it is proposed that the fault recovery of a distribution network can be realized by distribution network reconfiguration. Then, by analyzing the characteristics of the flexible interconnection device, it is shown that the flexible interconnection device can adapt well to the distribution network with new energy access. Finally, this paper constructs a multi-objective optimization reconfiguration model of a distribution network considering wind and solar consumption capacity and verifies the effectiveness of the scheme in improving wind and solar consumption capacity and solving economic problems through case analysis.
1 Introduction
With the increasing penetration of distributed energy (DG) in distribution networks (DNs), the planning and operation of DNs are facing great pressure, so it is particularly important to ensure the safe and reliable operation of the distribution network. However, due to the complex structure of a distribution network, a wide variety of access equipment, and vulnerability to external factors, faults in distribution networks are inevitable (He et al., 2024; Tong et al., 2024). DN reconfiguration is a technology to optimize a distribution system by changing the controllable switching state of the distribution network. It is one of the important technical means to realize the fault recovery of the distribution network (Gu et al., 2024). In the practical application process, the traditional contact switch will involve problems such as switching operation, closed-loop current impact, and switching loss, which will bring hidden dangers to the safety and reliability of a power grid operation.
In order to improve the safety and reliability of DN operation, a hybrid energy storage system based on superconducting magnetic energy storage and battery energy storage is constructed by Liu et al. (2024a) to solve the influence of wind power output fluctuation on the stable operation of the microgrid. Liu et al. (2024b) proposed a microgrid energy storage model combining superconducting energy storage and battery energy storage technology to reduce power fluctuations in the distribution network. In recent years, the rapid development of power electronics technology has provided an opportunity to solve the problem of lack of primary equipment regulation and control ability that restricts the further improvement of the operation level of a distribution system. Experts and scholars use flexible interconnection devices (FIDs) for flexible interconnection in distribution networks to facilitate easy access to distributed wind and solar resources, electric vehicle charging piles, and energy storage equipment, expand the form of the DN frame, and enhance the power flow regulation and control ability of a distribution network. FIDs for medium- and low-voltage distribution networks are triggering new research (Cai et al., 2022; Yingyi et al., 2022).
In recent years, with the development of flexible interconnection devices such as soft open point (SOP), the negative problems such as circulating power and an electromagnetic loop network caused by a closed-loop power supply mode have been solved technically (Chen et al., 2023; Zhang et al., 2023; Luo et al., 2023; Yang et al., 2023; Jian et al., 2024), and fault self-healing technology has also been widely studied. Jo et al. (2024) proposed a recoverable dynamic distribution network reconfiguration framework that can continuously reconfigure after a fault and quickly restore the stopped service area. Chen et al. (2024) proposed a distributed traveling wave location and ranging technology for the distribution loop network, which improved the accuracy and reliability of fault location in the power supply loop network. Yutao et al. (2024) used a four-port SOP to form a power supply loop network with a DC network and then proposed a two-stage interconnected DN fault self-healing scheme using an FID’s power flow control capability to assist fast load transfer and network reconfiguration technology. In Yifei et al. (2024), the SOP DC side of the distribution loop network is connected to the energy storage device so that the SOP uses the energy storage device to invert the AC power supply for load power supply when the power supply on both sides of the power supply loop network is faulty, and a network reconfiguration model considering the power supply capacity of the energy storage SOP is proposed. In Zhao et al. (2022), a stochastic optimization model for fault recovery of flexible interconnected distribution networks is established for the cooperative operation scenario of multiple closed-loop power supply systems. The methods proposed in the above literature can improve the fault self-healing ability of the distribution network; however, they still cannot solve the economic problem of power supply in the distribution network.
A distribution network can reduce the node voltage fluctuation and greatly reduce the constraints of network reconfiguration by replacing the traditional contact switch with the flexible interconnection device to realize the fast self-healing of the fault. Network reconfiguration can also optimize the operation state of a distribution network and improve the level of wind and solar consumption. This paper first analyzes the self-healing process of DN faults and concludes that DN reconfiguration is the key method to improve the self-healing level of faults. In addition, replacing the traditional contact switch with an FID for switch closure can improve the voltage fluctuation generated by the traditional switch and further improve the economy of the distribution network. Then, this paper takes into account the wind and solar consumption capacity, combines the control effect of the FID, transforms the optimization goal of the wind and solar consumption capacity into the node voltage optimization goal, and constructs a multi-objective optimization and reconstruction model of the distribution network. Finally, the effectiveness of the DN reconfiguration scheme is verified by an example analysis. The scheme has a certain improvement effect on the wind and light consumption capacity and solves the economic problem of the distribution network to a certain extent.
2 Analysis of a distribution network fault recovery process
The distribution network adopts the power supply mode of open-loop design and closed-loop operation, and its structure is dynamically adjusted with the change of switching state, which can be adapted to the change by DN reconfiguration. In the fault state, the core goal of reconstruction is to ensure the stable power supply of the load by adjusting the breaking of the line switch.
An open-loop operation distribution network first relies on the feeder automation technology when the system fails. The network reconfiguration is carried out through the action timing of the normally closed section switch on the feeder and the normally open contact switch between the feeders. Load transfer is used to realize the automatic recovery of the user’s power supply in the power loss area after the fault. As shown in Figure 1, when the branch L6-7 fails, the load of node 7 will lose power supply. After the fault is isolated by feeder automation, the normally open contact switch on the closed branch L4-7 can transfer the load of node 7 to node 4 to achieve initial restoration.
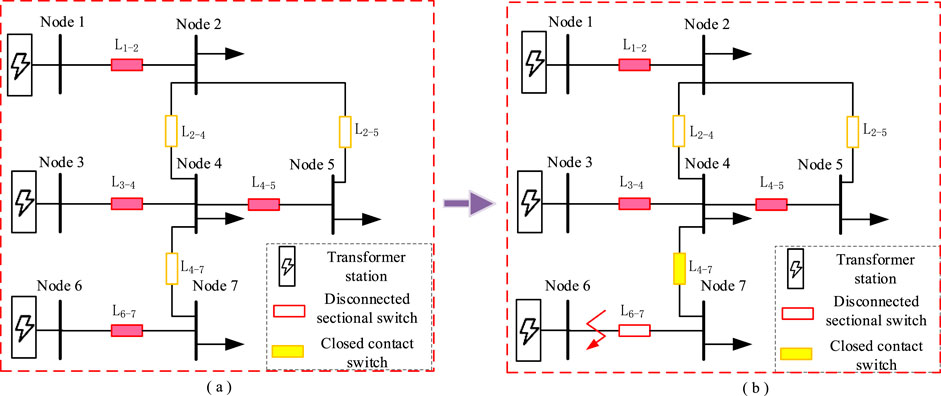
Figure 1. Schematic diagram of fault self-healing process of a distribution network. (a) Distribution network in normal operation. (b) Reconfiguration of distribution network.
In a traditional distribution network, network reconfiguration is mostly used to optimize the network power flow, reduce the network loss, and balance the load. For an active distribution network with DG, the island operation mode of a DG power supply alone can be used to restore the power supply of the fault network. The combination of island and reconstruction can achieve a better fault recovery effect. As shown in Figure 2, when the L6-7 branch fails, the node 7 load will lose power supply. After isolating the fault through feeder automation, it can also choose to access the DG at node 7 and supply power to the node 7 load through DG to realize preliminary power restoration.
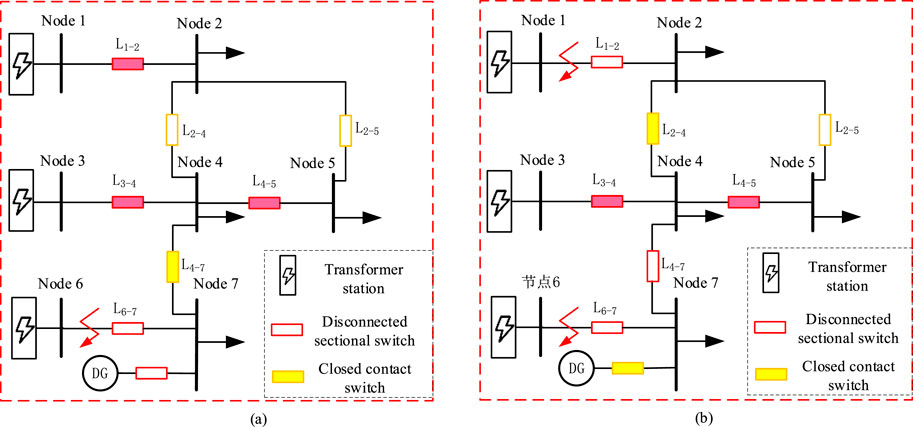
Figure 2. Schematic diagram of a DN fault self-healing scheme. (a) Network reconfiguration. (b) Network reconfiguration and island coordination.
3 Analysis of control characteristics of a flexible interconnection device
Two forms of DG access systems are shown in Figure 3. One is distributed access to each load point in the low-voltage distribution network, and the other is centralized access to the low-voltage side bus. When DG is connected to the low-voltage side bus, its function is the same as the system-side power supply, and it can restore the power supply of the low-voltage side users only when the medium-voltage side fails and loses the system-side power supply. When access is distributed and the low-voltage side fails, the power supply can still be sustained in the non-fault area.
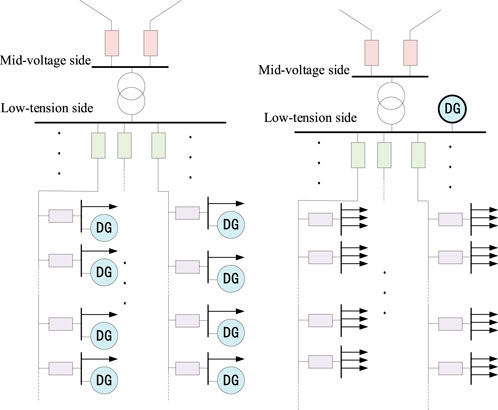
Figure 3. The structure of a DN system with distributed generation.
The network reconfiguration and islanding are selected to realize the self-healing of the DN fault. The active power consumed by the internal load of the system is
In the formula,
Substituting Equation 2 into Equation 1, we can get
Solving Equation 3, we can get:
In the equation,
According to Equations 4, 5, the value changes with the change of DG active and reactive power output, resulting in corresponding frequency fluctuation. Many factors affect the output of DG, including uncertain factors such as light intensity and wind speed, so there is frequency fluctuation in an island ad hoc network. In addition, when DG and load are continuously incorporated into the island, the resulting transient change of active power will affect
A flexible interconnection device is composed of a power module, a capacitor module, a control module, a protection circuit, a filter module, and an energy supply module. The unit topology is shown in Figure 4.
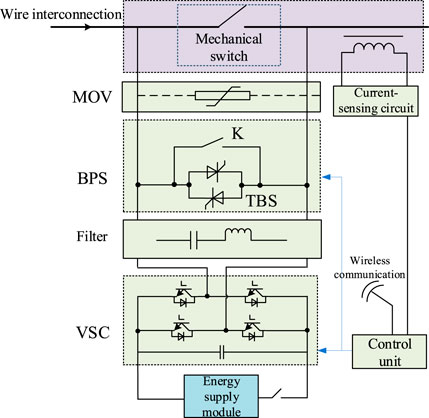
Figure 4. The topology diagram of a flexible interconnection device.
Whether it is applied to a medium-voltage or a low-voltage distribution network, the interconnection device first must be connected to the interconnection line through the switch closing operation. The line current state at the moment of the interconnection of the distribution network can be controlled using the voltage compensation characteristics of the interconnection device.
As shown in Figure 5, the interconnection device unit is distributed in the interconnection line between node A and node B, and its mathematical model can be regarded as an equivalent model of multiple controlled voltage sources. In the figure,
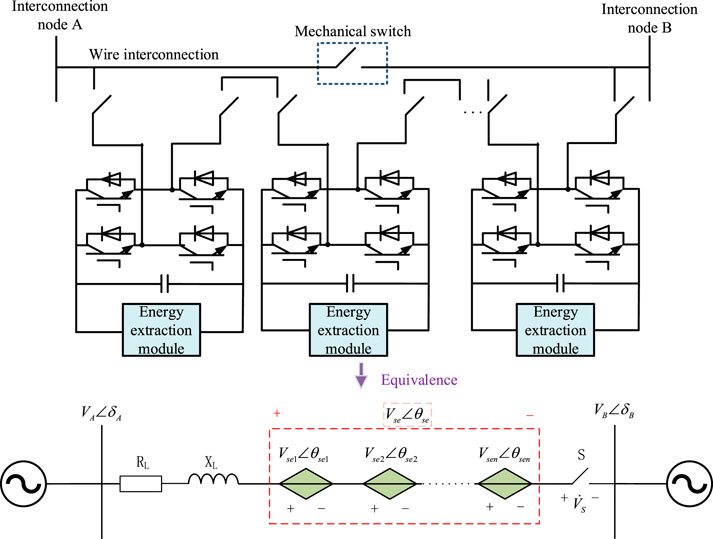
Figure 5. Voltage compensation schematic diagram of the interconnected device.
Before the switch S is closed, the voltage difference between its two ends is
When switch S is closed, the steady-state current flowing through the line is as follows:
From Equation 8, it can be obtained that the voltage difference between nodes can be compensated by controlling the equivalent output voltage of the interconnection device system. Then, the line current at the moment of node interconnection can be controlled, and the voltage compensation level can be verified by measuring the voltage difference on both sides of the switch S. Because the amplitude and phase angle of the compensation voltage must be controlled separately according to the amplitude and phase angle of the voltage difference between the nodes, the output voltage of the interconnection device is not vertical to the line current, and the energy supply module is needed to provide active power support. If a suitable control method is applied to the flexible interconnection device, the node voltage can be stabilized by controlling the output of the device. Its voltage regulation function is mainly realized by the output compensation voltage
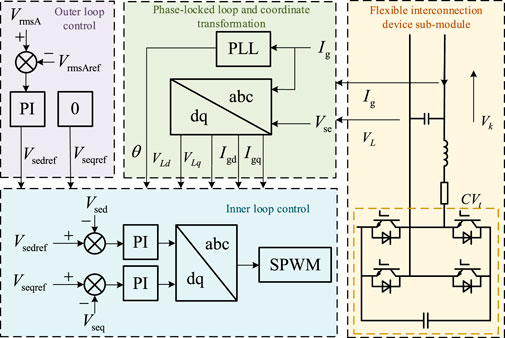
Figure 6. Control strategy block diagram of a flexible interconnection device.
4 Multi-objective optimization reconfiguration method of a distribution network considering wind and solar consumption capacity
The full utilization of DG output can improve the fault self-healing ability of a distribution network. However, due to the randomness of DG output, it is difficult to take the fluctuating DG output in the distribution network as the optimization target. Starting from the constraint conditions of DN reconfiguration, this paper analyzes an objective function that can improve the DG consumption ability and studies the self-healing strategy of DN fault in combination with network reconfiguration and island.
4.1 Constraint condition
In order to ensure the power balance of the whole network, the power flow constraints of the distribution network are shown in Equation 9.
In the formula,
In order to ensure that the voltage of each node of the reconstructed distribution network does not exceed the limit, the node voltage constraint is shown in Equation 10.
In the formula,
In order to ensure that the power on the reconstructed branch does not exceed the allowable limit, the branch capacity constraint is shown in Equation 11.
In the formula,
According to the operation characteristics of the distribution network, the optimized and reconstructed network topology should meet the requirements of neither island nor ring network. The network topology constraints are shown in Equation 12.
In the formula,
It can be seen from the power flow constraints of the distribution network that the wind power and photovoltaic output connected to each node is constrained by the node voltage.
In fact, for medium- and low-voltage distribution networks, the node voltage constraint is the most important factor limiting the distributed photovoltaic consumption capacity. Especially when a large-scale distributed photovoltaic system is connected to the distribution network, the generated power reverse transmission will increase the node voltage. Before the capacity of the upper transformer exceeds the limit, the node voltage of the distribution network often exceeds the limit. Therefore, using the DN reconfiguration to optimize the power flow distribution of the electrical network and improve the voltage distribution of the system nodes can effectively improve the distributed photovoltaic consumption capacity of the distribution network.
The equivalent circuit for a wind–solar power generation system connected to a medium-voltage distribution network is shown in Figure 7.
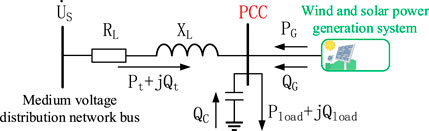
Figure 7. Grid-connected equivalent circuit of a wind–solar power generation system.
Because the capacity of the wind–solar power generation system is much smaller than the capacity of the distribution network, the distribution system can be considered as an infinite capacity power system in the analysis. In the figure,
The total power transmitted from the distribution network bus to the PCC node load through the feeder is shown in Equation 13.
Therefore, when the distribution network bus supplies power to the PCC node, the voltage drop generated by the feeder impedance is shown in Equation 14.
With the PCC node voltage phase as the reference phase, Equation 14 can be converted to Equation 15.
The real part of the above equation is the longitudinal component of the voltage drop, and the imaginary part is the transverse component of the voltage drop. The transverse component of the feeder voltage drop in the medium-voltage distribution network can be ignored, that is
From the power balance of the PCC node, it can be obtained that
Substituting Equation 17 into Equation 16, we can get
The arrangement of reactive power compensation devices in parallel with different PCC nodes is quite different in device capacity, so the reactive power emitted by them is ignored; that is,
Then, the reactive power demand required by the PCC node load is all satisfied by the DN system, and Equation 18 can be further expressed as
Equation 19 shows that due to the existence of line resistance, the transmission of active power from the wind-solar power generation system to the DN system will cause the PCC node voltage to rise; that is, the wind–solar consumption capacity depends to a certain extent on the PCC node voltage quality. If the node voltage with wind–solar resources access after the DN reconfiguration is close to the upper limit of voltage when the output of the wind–solar power generation system increases slightly, the PCC node voltage will exceed the limit; that is, the wind–solar consumption capacity is poor. Therefore, it can be concluded that if the node voltage with access to wind and solar resources after DN reconfiguration is closer to the upper limit of voltage, the wind and solar absorption capacity of a distribution network will be worse; if the node voltage with access to wind and solar resources after DN reconfiguration is closer to the lower limit of voltage, the wind and solar absorption capacity of the distribution network will be stronger.
4.2 Objective function
In order to consider the wind and light consumption capacity of the distribution network and the safe and stable operation of the system, the optimization goal of the DN reconfiguration should be to make the node voltage as close as possible to the rated voltage of the node. The corresponding objective function is shown in Equation 20.
In the formula,
The objective function of minimizing the network loss is shown in Equation 21.
In the formula,
The objective function reflecting load balancing is shown in Equation 22.
In the formula,
The objective function reflecting the least number of switching operations is shown in Equation 23.
In the formula,
4.3 Data processing
In order to perform multi-objective optimization and reconstruction according to the different priorities of the four objective functions in the process of DN reconfiguration, the objective function must be normalized first. The normalized objective function is shown in Equation 24.
In the formula, 1
Based on each sub-objective function, the final objective function is shown in Equation 25.
In the formula,
In this paper, the weight coefficient is further calculated by constructing the judgment matrix. The relative weight of target
The Satty scale can be used to reflect the relative importance between the comparison targets to determine the value of
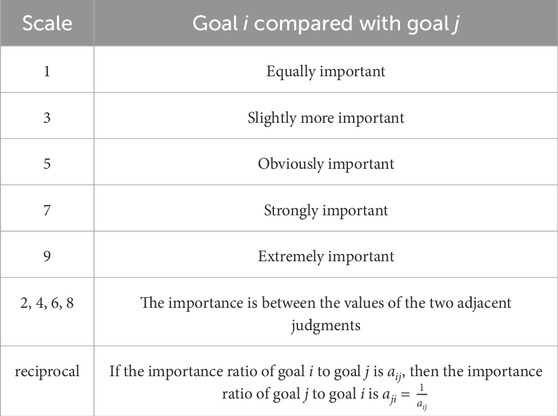
Table 1. Satty scale table of target relative importance judgment.
5 Example analysis
Taking the IEEE 33-node distribution system as an example, this paper builds and uses a genetic algorithm to solve the above multi-objective optimization reconfiguration model of a distribution network using the MATLAB platform.
5.1 Algorithm flow
The steps of a distribution network optimization reconfiguration algorithm based on a genetic algorithm are as follows.
1) The initial population is generated, and the fitness function of the initial population is calculated.
2) Selection, crossover, and mutation. The selection operation adopts the roulette selection method combined with the elite retention strategy. The positions of crossover and mutation operations are determined by random numbers, and new individuals can be generated after crossover and mutation.
3) Checking and re-selecting feasible solutions. After crossover and mutation, many of the new individuals will be infeasible solutions. It is necessary to check the feasibility of the new individuals in turn and eliminate the infeasible solutions in time. According to the number of eliminated infeasible solutions, the secondary selection is carried out from the incidental population to ensure a sufficient population.
4) Calculate the fitness of the individual population and determine whether the maximum evolutionary generation is reached. If yes, the optimization result is output. If no, step 2 is returned.
The genetic algorithm optimization process is shown in Figure 8.
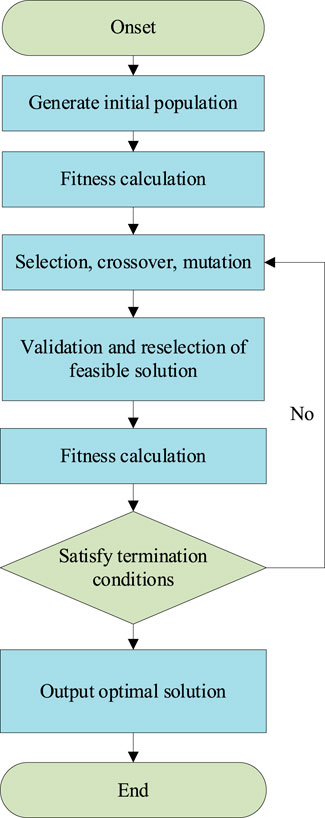
Figure 8. Iterative process of the genetic algorithm.
The initial state of the distribution network is shown in Figure 9. The black number (0–32) in the diagram is the node label, the node 0 is the power node, set to 11 kV, and the rated voltage of the node is 10 kV. The red number (1–37) is the branch label. The blue line indicates that the sectional switch/contact switch on the branch is closed. The orange line indicates that the section switch/contact switch on the branch road on the branch road is turned on. Each node and the power node are connected, and the load power supply is normal. The population number of the genetic algorithm is set to 50, the mutation rate is set to 0.001, and the maximum number of iterations is 100.
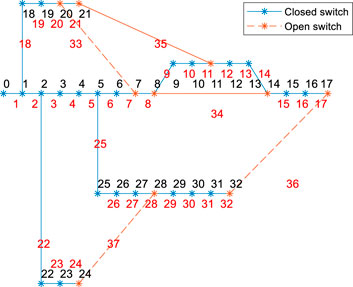
Figure 9. IEEE 33-bus distribution system.
5.2 Analysis of network reconfiguration results without DG access
In order to verify the fault self-healing ability of the distribution network by optimizing the reconfiguration, the line switch of branch 22 is disconnected below, and the distribution network fault is simulated to make the DN reconfiguration result after the node 22, 23, and 24 loads are powered off.
Through the DN reconfiguration, the nodes 22, 23, and 24 are restored to power supply; that is, the fault self-healing is realized through the DN reconfiguration. The simulation results are shown in Figure 10. The network reconfiguration results are shown in Table 2.
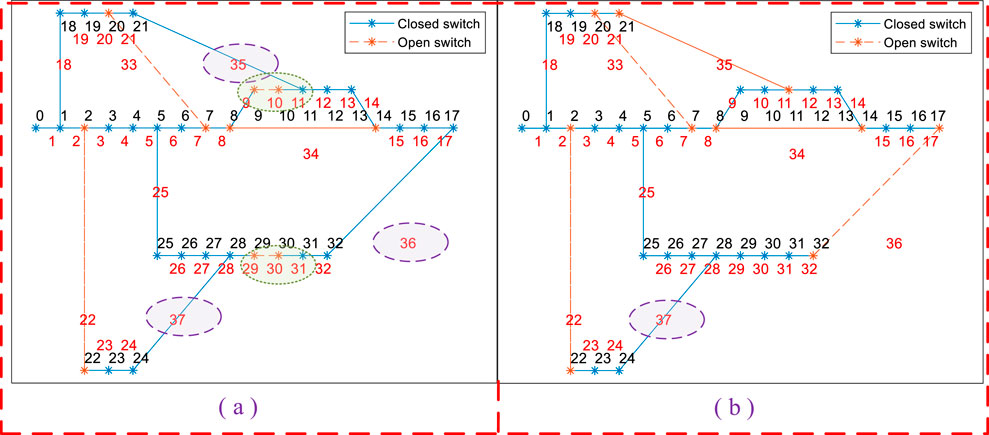
Figure 10. The optimal reconstruction results of branch 22 after a fault. (a) Optimized reconstruction Scheme 1. (b) Optimized reconstruction Scheme 2.
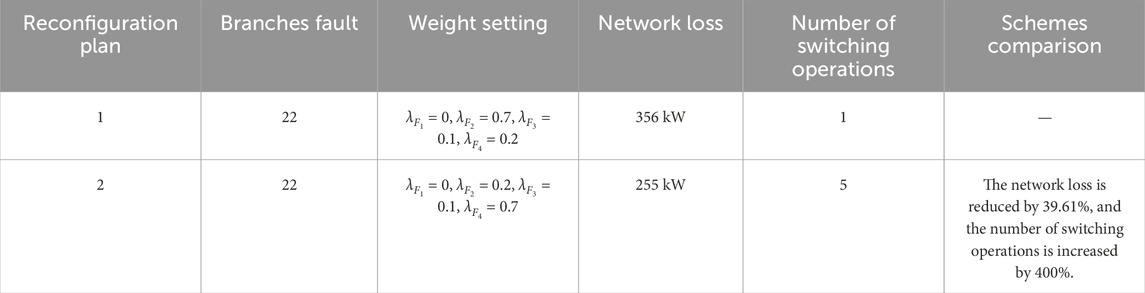
Table 2. Results of network reconfiguration without DG access.
When DG is not connected, this paper presents two optimal reconfiguration schemes. When generating reconstruction Scheme 1, the given sub-objective function weight factors are
5.3 Analysis of network reconfiguration results considering DG access
In order to verify the multi-objective optimization and reconstruction method of the distribution network considering wind and solar consumption capacity proposed in this paper, the voltage quality of nodes can be optimized according to each node’s access to wind and solar power generation resources to improve its consumption capacity. In this section, the nodes 10, 11, 12, 13, and 14 of the distribution network shown in Figure 9 are connected to the wind and solar power generation system with equal capacity. The weight factor of the capacity ratio of nodes 10, 11, 12, 13, and 14 in the objective function is:
In the following, by disconnecting the line switch of branch 25, the DN fault is simulated to make the DN reconfiguration result after nodes 25, 26, 27, 28, 29, 30, 31, and 32 loads are powered off. The simulation results are shown in Figure 11. The network reconfiguration results are shown in Table 3.
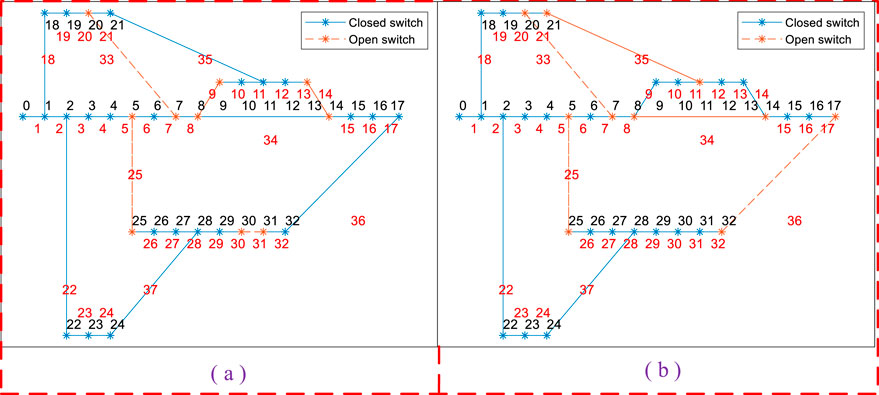
Figure 11. The optimal reconstruction results of a branch 25 fault after the wind–solar power generation system is connected. (a) Optimized reconstruction Scheme 1. (b) Optimized reconstruction Scheme 2.
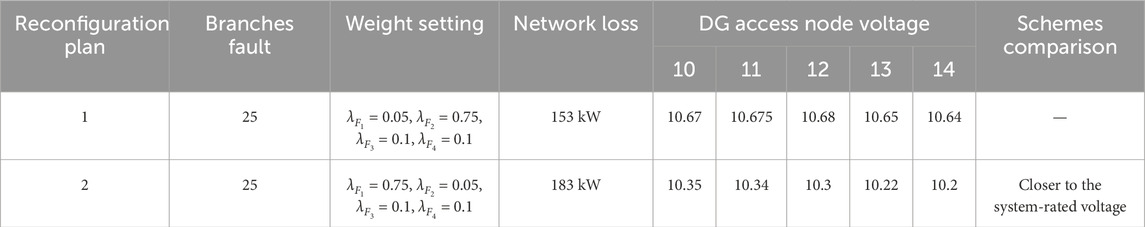
Table 3. Network reconfiguration results considering DG access.
Two sets of DN optimization and reconstruction schemes restore power supply to nodes 25, 26, 27, 28, 29, 30, 31, and 32. In order to observe the voltage quality optimization effect of wind and solar resource access nodes through control variables, in reconstruction Scheme 1, the given sub-objective function weight factors are:
In order to show the optimization effect of node voltage quality, the voltage of each node of the distribution network after the two reconstruction schemes is shown in Figure 12. Compared with reconstruction Scheme 1, the voltage of nodes 10, 11, 12, 13, and 14 with wind and solar power generation resources access has decreased significantly, which is closer to the rated voltage of the system. This also means that before the node voltage exceeds the limit, the wind-solar power generation system has a larger output space; that is, the wind-solar consumption capacity is stronger.
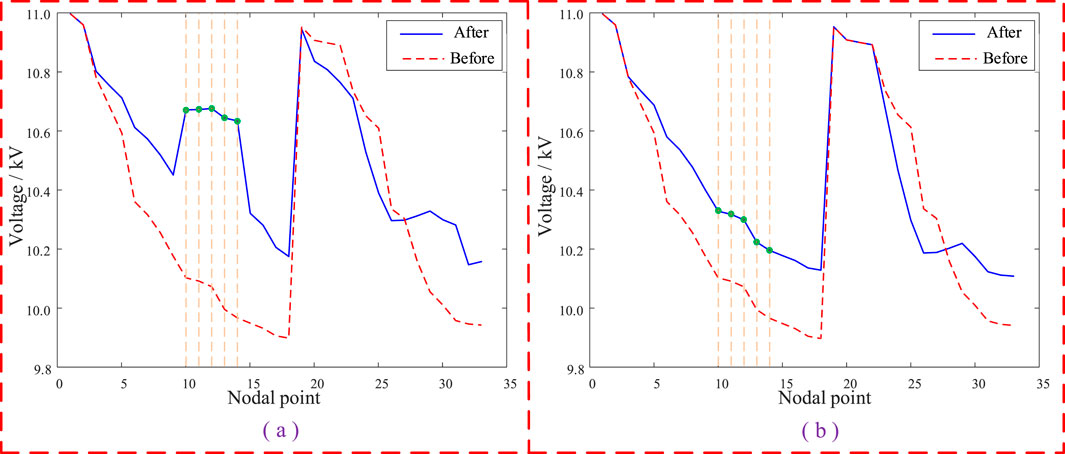
Figure 12. Voltage situation of each node in the distribution network. (a) Optimized reconstruction Scheme 1. (b) Optimized reconstruction Scheme 2.
6 Conclusion
This paper discusses the use of flexible interconnection devices to enhance the adaptability of a distribution network to renewable energy and flexible load under the background of dual carbon targets. With the increase in the proportion of renewable energy access, the distribution network not only must efficiently connect to the traditional power grid but also must flexibly respond to new energy and load access. By introducing flexible interconnection devices and combining advanced fault self-healing technologies, this paper shows that DN reconfiguration can significantly improve its economy and power supply stability. The multi-objective optimization DN reconfiguration model proposed in this paper shows its potential to improve wind and solar absorption capacity. With additional research, it will play a greater role in renewable energy consumption and economic optimization of distribution networks.
Data availability statement
The original contributions presented in the study are included in the article/supplementary material; further inquiries can be directed to the corresponding author.
Author contributions
LJ: conceptualization, writing – original draft, and writing – review and editing. CW: data curation, writing – original draft, and writing – review and editing. CL: formal analysis, writing – original draft, and writing – review and editing. CX: writing – original draft and writing – review and editing.
Funding
The author(s) declare that financial support was received for the research and/or publication of this article. The work of this paper is funded by the science and technology project of China Southern Power Grid. The project number is 030400KC23120031 (GDKJXM20231501).
Acknowledgments
This article is grateful to China Southern Power Grid Power Grid Project for funding.
Conflict of interest
Authors LJ, CW, and CL were employed by Zhuhai Power Supply Bureau of Guangdong Power Grid Co., Ltd.
The remaining authors declare that the research was conducted in the absence of any commercial or financial relationships that could be construed as a potential conflict of interest.
Generative AI statement
The author(s) declare that no Generative AI was used in the creation of this manuscript.
Publisher’s note
All claims expressed in this article are solely those of the authors and do not necessarily represent those of their affiliated organizations, or those of the publisher, the editors and the reviewers. Any product that may be evaluated in this article, or claim that may be made by its manufacturer, is not guaranteed or endorsed by the publisher.
References
Cai, H., Yuan, X., Xiong, W., Zheng, H., Xu, Y., Cai, Y., et al. (2022). Flexible interconnected distribution network with embedded DC system and its dynamic reconfiguration. Energies 15 (15), 5589. doi:10.3390/en15155589
Chen, Li, Dai, Y., Peng, W., and Shiwei, X. (2023). Active and reactive power coordinated optimization of active distribution networks considering dynamic reconfiguration and SOP. IET Renew. Power Gener., 1–12.
Chen, Y., Wang, P., Chen, F., Man, Z., and Mingming, S. (2024). Application of distributed positioning technology in fault location of distribution network. Electr. Technol. Econ. 2, 91–94.
Gu, G., Yang, P., Tang, B., Ding, W., and Lai, X. (2024). Method for improving the balance ability of distribution network based on source-load-storage collaborative optimization. Chin. J. Electr. Eng. 44 (13), 5097–5109.
He, X., Tang, Y., Han, Y., Gao, Y., Chen, Y., Huang, X., et al. (2024). Cognitive system theory of energy internet based on digital twin and meta universe (3): complex system group intelligence regulation theory and its framework. Chin. J. Electr. Eng. 44 (24), 9546–9559.
Jian, J., Zhao, J. L., Ji, H. R., Bai, L. Q., Xu, J., Li, P., et al. (2024). Supply restoration of Data centers in flexible distribution networks with spatial-temporal regulation. Ieee Trans. Smart Grid 15 (1), 340–354. doi:10.1109/tsg.2023.3286844
Jo, S., Oh, J.-Y., Yoon, Y. T., and Jin, Y. G. (2024). Self-healing radial distribution network reconfiguration based on deep reinforcement learning. Results Eng. 22, 102026. doi:10.1016/j.rineng.2024.102026
Liu, Y., Han, X., Xing, Z., Li, P., Liu, H., Jiang, Z., et al. (2024b). Research on control strategy of hybrid superconducting energy storage based on reinforcement learning algorithm. IEEE Trans. Appl. Supercond. 34 (8), 1–4. doi:10.1109/tasc.2024.3420314
Liu, Y., Li, P., Xing, Z., Han, X., Fu, Q., and Jiang, Z. (2024a). Research on microgrid superconductivity-battery energy storage control strategy based on adaptive dynamic programming. IEEE Trans. Appl. Supercond. 34 (8), 1–4. doi:10.1109/tasc.2024.3420296
Luo, Z., Sun, Y., Hang, L., Xiao, Y., Liu, B., Wang, T., et al. (2023). Power management and coordinated control strategy of flexible interconnected AC/DC hybrid microgrid with back-to-back converters. Int. J. Circuit Theory Appl. 51 (11), 5173–5196. doi:10.1002/cta.3694
Tong, J., Qi, Z., Pu, T., Song, R., Jun, Z., Tan, Y., et al. (2024). Edge intelligence of power Internet of things: concept, architecture, technology and application. Chin. J. Electr. Eng. 44 (14), 5473–5496.
Yang, Z. C., Yang, F., Min, H. D., Shen, Y., Tang, X., Hong, Y., et al. (2023). A local control strategy for voltage fluctuation suppression in a flexible interconnected distribution station area based on soft open point. Sustainability 15 (5), 4424. doi:10.3390/su15054424
Yifei, H., Feng, Q., and Hailong, L. (2024). Island restoration method of distribution network based on energy storage flexible interconnection device. Power supply 41 (02), 21–27.
Yingyi, X., Liu, H., Xiong, X., Yu, J., Yao, S., Zhang, H., et al. (2022). Key technology and development mode of flexible interconnection in low voltage distribution station area. Chin. J. Electr. Eng. 42 (11), 3986–4001.
Yutao, X., Qihui, F., Tan, Z., Zhang, C., and Yuan, X. (2024). Power supply restoration strategy of multi-terminal flexible interconnected distribution network considering the coordination of transfer and reconstruction. J. Electr. Technol. 39 (9), 2696–2709.
Zhang, G., Yuan, X., Xiong, W., Feng, Q., and Zhao, Y. (2023). Research on power supply recovery control technology of distribution network embedding with DC links. Int. J. Electr. Power and Energy Syst. 152, 109265. doi:10.1016/j.ijepes.2023.109265
Keywords: distribution network, renewable energy integration, flexible interconnection device, network reconfiguration, fault self-recovery
Citation: Jiang L, Wang C, Li C and Xiang C (2025) Research on fault self-healing strategy of a distribution network considering wind and solar accommodation capacity. Front. Energy Res. 13:1563243. doi: 10.3389/fenrg.2025.1563243
Received: 19 January 2025; Accepted: 19 May 2025;
Published: 18 June 2025.
Edited by:
Lun Yang, Xi’an Jiaotong University, ChinaReviewed by:
Yang Liu, Shenyang University of Technology, ChinaKunjie Liang, Shandong University, China
Copyright © 2025 Jiang, Wang, Li and Xiang. This is an open-access article distributed under the terms of the Creative Commons Attribution License (CC BY). The use, distribution or reproduction in other forums is permitted, provided the original author(s) and the copyright owner(s) are credited and that the original publication in this journal is cited, in accordance with accepted academic practice. No use, distribution or reproduction is permitted which does not comply with these terms.
*Correspondence: Caili Xiang, MjUxMDg4MjAxM0BxcS5jb20=