 Chao Liu
 Gao Wu1
 Yaru Yang
 Qingtai Xiao
- 1Faculty of Metallurgical and Energy Engineering, Kunming University of Science and Technology, Kunming, Yunnan, China
- 2First Hospital for Peoples of Yunnan Province, Kunming, Yunnan, China
- 3School of Mathematics and Statistics, Chongqing Technology and Business University, Chongqing, China
- 4School of Materials and Textile Engineering, Jiaxing University, Jiaxing, China
Introduction: To address the dilemma that the small sample size of hospital energy consumption data makes it difficult to predict short-term electricity consumption, a combination of the Firefly Optimization Algorithm (FOA) and the Support Vector Regression (SVR) algorithm, i.e., FOA-SVR, was proposed in this work.
Methods: By combining standardized sample data with the FOA to optimize the hyperparameters of the SVR model, the proposed approach enhances the model’s ability to capture the variation characteristics of hospital electricity consumption.
Results: The FOA-SVR hybrid strategy achieves an optimal balance between prediction accuracy and computational efficiency when the number of fireflies was 30. The prediction accuracy indicator (Coefficient of Determination, R2) was 0.855, respectively. Under these conditions, the hybrid strategy has the dual advantage of running faster than the existing Sparrow search algorithm, and the traditional seagull optimization algorithm, with run times reduced by 21.192 s and 14.612 s, respectively. When the length of electricity consumption data was greater than or equal to 36, R2 of the FOA-SVR hybrid strategy was higher than 0.849.
Discussion: The FOA-SVR hybrid strategy realizes a kind of efficient prediction of power consumption in medical office buildings with a small sample data volume, which provides theoretical and data support for the reasonable optimization of hospital energy use structure and has practical significance for the intelligence of hospital energy management.
1 Introduction
In modern society, hospitals, as important public service facilities, were concerned about their energy consumption (Mazzeo et al., 2023; Roletto et al., 2024; Patil and Kini, 2024; Ghoreishinejad et al., 2023). Especially in outpatient clinic buildings, power consumption was usually high and unstable due to high patient turnover, irregular equipment working hours and extensive use of energy-consuming equipment such as air conditioners. In addition, the seasonal character of electricity consumption in outpatient buildings was brought about by climatic variations in different seasons (Liu et al., 2022). Effective prediction of power consumption in hospital outpatient buildings not only helps to improve energy efficiency and reduce operating costs, but also helps hospital managers to optimize the power plan and ensure the stability and security of energy supply (Seçkiner and Koç, 2022; Soyler and Izgi, 2022; Cygańska and Kludacz-Alessandri, 2021).
The complexity of time series was an important theme in the available reports (Ponce-Flores et al., 2020). Time series data were affected by a combination of environmental factors and were often characterized by non-linearity (Wang et al., 2023; Satapathy et al., 2024). The complexity of time series features was brought about by nonlinear features (Wu et al., 2024). Econometric, statistical and mathematical methods as traditional forecasting methods have low forecasting accuracy in terms of their inability to better identify non-linear features in electricity consumption data (Khan et al., 2020). Machine learning algorithms could effectively solve complex nonlinear problems and predict better than traditional prediction methods (Weron, 2014; Yu et al., 2015; Márquez-Chamorro et al., 2015). As an important branch in the field of machine learning, the task of time series prediction was explored in depth. Due to the availability of large amounts of historical data and the need for accurate prediction of future data, more and more machine learning strategies were being developed and used for time series prediction tasks (Wang et al., 2022).
For instance, Abbasimehr et al., (2020) used Long Short-Term Memory networks (LSTM) neural network algorithm to identify highly fluctuating features in time series and effectively improve the business competitiveness of enterprises (Abbasimehr et al., 2020). Li et al., (2021) analyzed the differences in building energy consumption in different climate zones and realized short-term energy consumption prediction (Li et al., 2021). Ghimire et al., (2024) extracted features of actual electricity demand data through a machine learning algorithm to realize an accurate prediction of electricity demand for energy industry operations, which provides an auxiliary decision-making tool for the development of the energy industry (Ghimire et al., 2024).
Building energy usage data could be used for building energy consumption time series prediction tasks to optimize energy management (Abrishambaf et al., 2018; Kim and Cho, 2019; Zhuang et al., 2023). Hospital outpatient building power consumption data was collected infrequently, often on a monthly basis. With the rapid socio-economic development, the total energy consumption of various industries was increasing year by year (Khalil et al., 2024; Zhu et al., 2022). Electricity usage data in hospital buildings was highly time-dependent (Gordillo-Orquera et al., 2018). The reference value of early data was extremely low. As a result, valid data on electricity consumption in hospital outpatient buildings mostly belong to small data volume samples. Most of the machine learning based prediction task methods were difficult to extract the data features in small data volume samples, and the credibility of the prediction results was low (Lin et al., 2023). Therefore, there was an urgent need for a short-term time series forecasting algorithm that was stable, has high forecasting accuracy and was suitable for small data volume samples (Chang et al., 2016; Wu et al., 2019).
Neural networks were good at recognizing nonlinear features in time series, but there were risks of stochasticity and overfitting with smaller amounts of data (Cheng et al., 2023; Zhang et al., 2022). Some more stable and structurally simple algorithms were more suitable for the task of predicting electricity consumption in outpatient buildings. Due to the introduction of insensitive spaces
Hu et al. developed a Particle Swarm Optimization-Support Vector Regression (PSO-SVR) model in their study on syrup brix prediction, using Particle Swarm Optimization to optimize the penalty coefficient and kernel parameters of Support Vector Regression, and demonstrated its excellent predictive performance (Hu et al., 2023). Jaafari et al. introduced the Grey Wolf Optimizer-Support Vector Regression (GWO-SVR) model in their study on identifying high-growth areas for poplar cultivation. Compared to the PSO-SVR model and the standalone SVR model, the GWO-SVR model demonstrated superior predictive performance (Jaafari, 2023). Javed et al. introduced the Firefly Optimization Algorithm–Support Vector Regression (FOA-SVR) model in their study on predicting the compressive strength of steel fiber-reinforced concrete. Compared to the PSO-SVR and GWO-SVR models, the FOA-SVR model demonstrated superior predictive performance on a small-sample dataset of 304 instances, suggesting that it may offer certain advantages under limited data conditions (Javed et al., 2024). However, in Javed’s study, only two hyperparameters of the SVR model were optimized. Expanding the number of optimized hyperparameters could potentially enable a more precise search for the global optimum.
In this work, a novel FOA-SVR hybrid strategy was proposed by integrating the Firefly Optimization Algorithm (FOA) with the Support Vector Regression (SVR) model to optimize its three key hyperparameters. This strategy leverages the global search capability of FOA to enhance the predictive performance of SVR. The effectiveness of the proposed hybrid model was validated using real-world electricity consumption data from hospital outpatient buildings under limited data conditions. The study compared the effects of different optimization algorithms on the predictive accuracy of SVR, examined the impact of data length on prediction performance, and further demonstrated the adaptability of SVR by comparing the optimized model against other commonly used algorithms. These results collectively confirm the applicability and effectiveness of the proposed FOA-SVR strategy in small-sample scenarios.
The rest of the paper was organized as follows. In Section 2, describes data sources and preprocessing, SVR algorithm, SVR algorithm optimized by FOA. In Section 3, the effects of firefly population sizes and data lengths on prediction accuracy were compared. Meanwhile, the excellence of the FOA-SVR hybrid strategy was verified by different optimization algorithms and traditional algorithms. In Section 4, the conclusion was given.
2 Materials and methods
2.1 Data acquisition and data pre-processing
In this work, a typical hospital in China was taken as an example. By investigating the energy consumption data of the outpatient building in hospital for a cumulative period of 3 years, the month-by-month electricity consumption of the outpatient building in hospital was obtained. Although the dataset used is relatively limited in size, it reflects the common constraints in data availability within hospital energy systems. The aim of this work is to develop predictive modeling strategies that remain effective under such limited data conditions, which are frequently encountered in real-world medical settings. The major energy-consuming equipment in the outpatient building includes ventilators, fully automated biochemistry analyzers, modular biochemistry and immunoassay systems, centrifuges, and water treatment units. The cumulative 3-year electricity consumption of the outpatient building in hospital was shown in Figure 1.
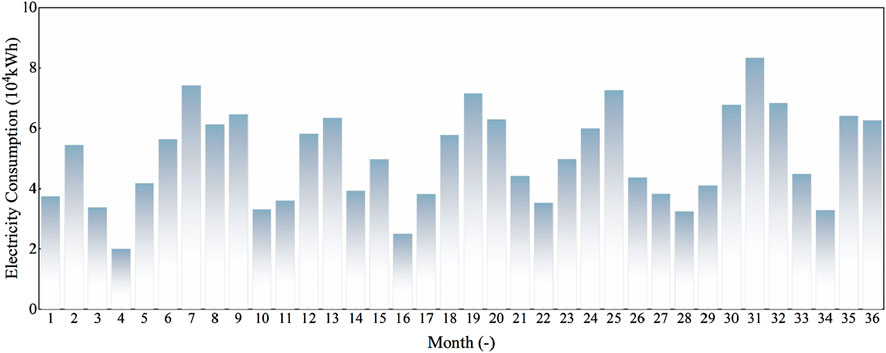
Figure 1. Three years of electricity consumption data for hospital outpatient building.
By analysis of data, the monthly power consumption of the outpatient building of the hospital was more than 1 × 10⁴ kWh. The order of magnitude of electricity consumption was at 104, and the range of data characteristics varies widely. Differences in the magnitude of the gradients of different features lead to inconsistent convergence speeds of the algorithm, or even to local optimal solutions. The normalization of the data makes the values of each feature in the same magnitude, and the optimization process was more stable and converges faster. Through data normalization, it was ensured that all features were within the same numerical range to avoid the serious impact on the hybrid strategy prediction accuracy caused by the large numerical range of some features. In this work, the data normalization algorithm was selected to preprocess the electricity consumption data. The normalized data range was [-1, 1]. Finally, the prediction results were inverse normalized to obtain the predicted electricity consumption of the corresponding order of magnitude. Data normalization and inverse normalization were calculated by Equations 1, 2, respectively.
where
All experiments in this study were carried out on a laptop with an AMD R-7945HX processor and an 8 GB RTX4060 GPU. This hardware setup offers a good balance between computational efficiency and practical feasibility, supporting potential integration into real-world hospital operations.
2.2 Predictive principles of SVR algorithm
SVR was a regression method based on the principle of support vector machine, which was widely used to deal with nonlinear regression and prediction problems. By introducing the kernel function parameter
where
2.3 Predictive principles of the FOA-SVR hybrid strategy
The amount of data on electricity consumption in hospital outpatient buildings was small, and the ability of the prediction hybrid strategy to extract data features directly determines the prediction accuracy. The key hyperparameters that affect the feature extraction capability of the SVR algorithm were the penalty coefficient
FOA was an intelligent optimization algorithm based on the luminous behavior of fireflies in nature. The optimal solution of the FOA was obtained by modeling mutual attraction and random motion search between fireflies. Fireflies were attractive to other individuals and the attraction was proportional to the intensity of their luminescence and inversely proportional to distance. The brightness of a firefly was related to the value of its objective function. A group of fireflies was randomly initialized, with each firefly representing a possible solution, and the dimensions of the initial solutions were the same as the number of hyperparameters to be optimized. The brightness of each firefly was calculated (brightness was inversely proportional to the value of the objective function). During the hyperparameter optimization, the difference in brightness of each firefly from the other fireflies was calculated. If a brighter firefly was present, the current firefly was attracted and moves toward the new firefly. Each individual of FOA represents a set of hyperparameter combinations. The position of the firefly was continuously updated in FOA and the hybrid strategy performance was incrementally improved. Eventually, the hyperparameter combination corresponding to the brightest firefly was selected as the optimal solution. The principle of the FOA-SVR hybrid strategy for predicting electricity consumption in outpatient buildings was shown in Figure 2.
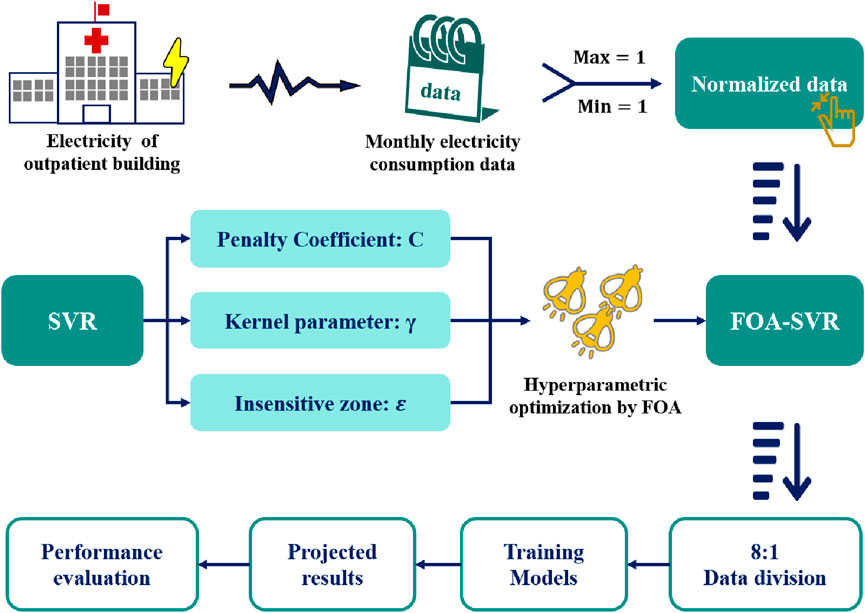
Figure 2. Schematic diagram of FOA-SVR hybrid strategy for electricity consumption prediction.
In the FOA-SVR hybrid strategy, the penalty coefficient
The adaptational degree of the candidate solution
The attractiveness of fireflies
where
If the adaptation of firefly
where
3 Results and discussions
3.1 Electricity consumption projection for outpatient building
The number of individuals involved in the search in each generation in FOA was determined by the number of individual fireflies. The higher the number, the more random the initial position of the fireflies, the search space was enlarged, which could better avoid the local optimum. The computational and time complexity of the FOA-SVR hybrid strategy increases accordingly. The predictive performance indicator s of the FOA-SVR hybrid strategy for the electricity consumption of the outpatient building when the number of fireflies was 0, 5, 15, 20, 25, 30, 35, and 40 were shown in Table 1. It was worth noting that the process of optimization algorithm for finding the globally optimal solution was stochastic in nature. The idea of integrated learning was introduced in the FOA-SVR hybrid strategy. For each firefly population algorithm, each was predicted ten times and the results were averaged to reduce the error of randomness on the performance of the FOA-SVR hybrid strategy. A firefly count of 0 represents an unoptimized SVR algorithm. To comprehensively evaluate model performance, a set of complementary metrics was adopted. Root Mean Square Error (RMSE), Mean Absolute Error (MAE), Mean Squared Error (MSE), and Mean Absolute Percentage Error (MAPE) were used to assess the magnitude of prediction errors from both absolute and relative perspectives. In parallel, the Coefficient of Determination (R2) and Pearson Correlation Coefficient (PCC) were employed to quantify the correlation and trend similarity between the predicted and actual values. Among them, R2 was selected as the primary evaluation metric in this study, as it emphasizes the agreement of temporal variation patterns, which is particularly important in short-term energy forecasting scenarios. Together, these metrics provide a balanced assessment of both the accuracy of numerical predictions and the consistency of variation patterns. The PCC values under the eight conditions were all above 0.9, indicating that the FOA-SVR hybrid strategy has a good ability to characterize the variation of electricity consumption data in hospital outpatient buildings with a small sample data size. The prediction accuracy of the FOA-SVR hybrid strategy was much lower for firefly counts of 0 and 5 than for the other six cases. The number of fireflies was too small and the available optimization range of SVR hyperparameters was insufficient. The hyperparameter optimization result deviates from the global optimal solution by a large margin and negative optimization occurs. In addition, the prediction accuracy gradually increased with the increase in firefly population size. The R2 is highlighted as a representative measure of the alignment between predicted and actual trends, given its interpretability in assessing directional consistency. This emphasis is complementary to the error-based indicators, which are used throughout the study to provide a balanced evaluation of predictive accuracy. Taking R2 as an example, this indicator was 0.764 and 0.804 for firefly counts of 10 and 15, respectively. The R2 of the single SVR algorithm was only 0.687, therefore, the prediction accuracy of the SVR algorithm was significantly improved by the FOA. The R2 was 0.818, 0.835, and 0.855 for firefly counts of 20, 25, 30, and 35, respectively. Within this range, the prediction accuracy of the FOA-SVR hybrid strategy increased synchronously with the number of fireflies. The FOA-SVR hybrid strategy has high accuracy in predicting electricity consumption data for hospital outpatient buildings. The prediction accuracy of the FOA-SVR hybrid strategy increased with the number of fireflies and stabilized at a population size of 30 When the firefly population was 35 and 40, the predictive accuracy indicator R2 of electricity consumption in the outpatient building was around 0.855. At this time, the effect of firefly population increments on FOA-SVR hybrid strategy predictions was weak. The prediction time of the FOA-SVR hybrid strategy increased dramatically as firefly populations increased. Therefore, the FOA-SVR hybrid strategy has the advantage of both prediction accuracy and computation time for predicting the electricity consumption of hospital outpatient buildings with small data volume when the firefly population size was 30.
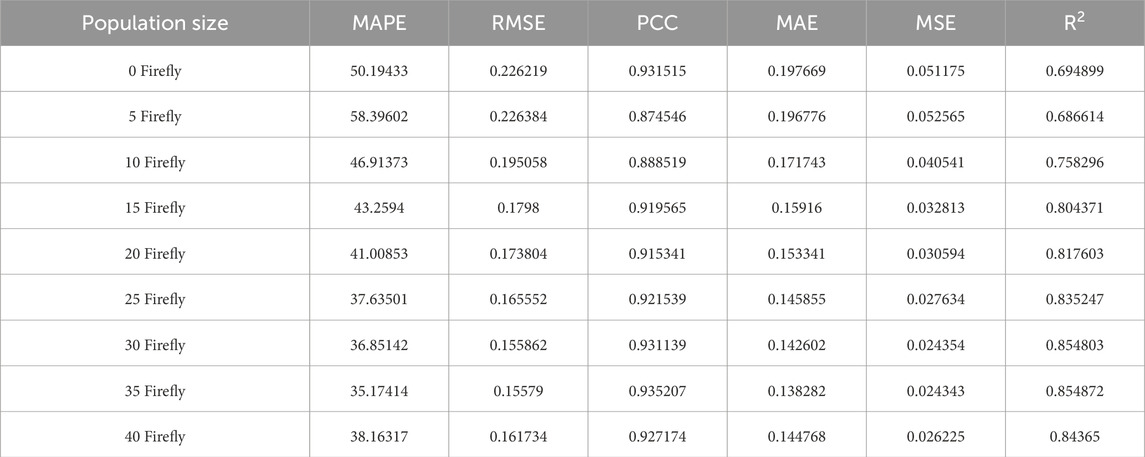
Table 1. Prediction accuracy of the FOA-SVR hybrid strategy under different firefly population sizes.
The results, prediction accuracy indicators, and hyperparameters of the ten predictions of the FOA-SVR hybrid strategy at a firefly population size of 30 were shown in Table 2, Tables 3, 4. In these tables, the FOA was more effective for hyperparameter optimization of SVR algorithm. The prediction accuracy of the optimized hybrid strategy was higher and the prediction results were stable. However, the hyperparameters obtained by the optimization algorithm were not always optimal solutions. In the 9th iteration prediction, the penalty coefficient
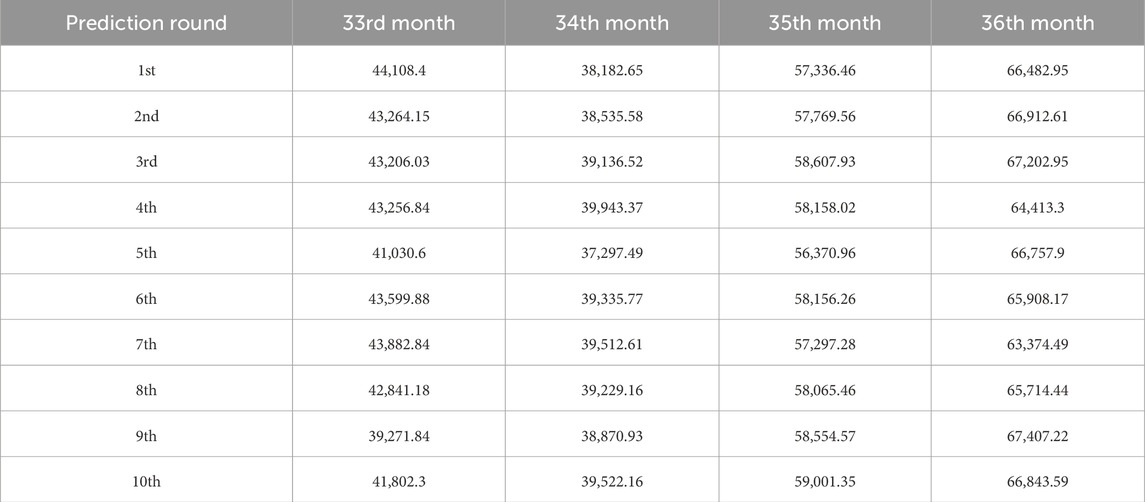
Table 2. Ten prediction results from the FOA-SVR hybrid strategy.
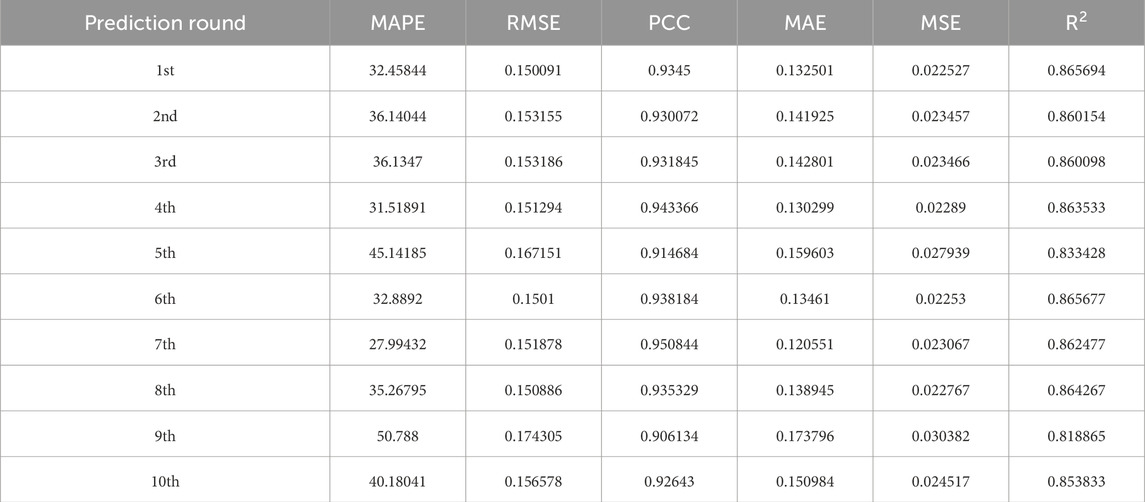
Table 3. Accuracy indicators of the ten predictions of the FOA-SVR hybrid strategy.
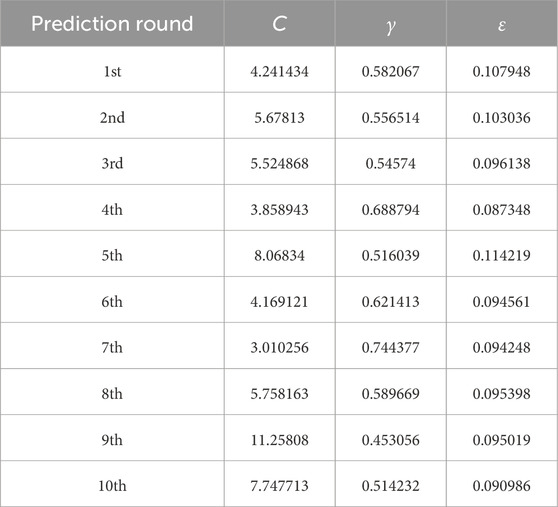
Table 4. Hyperparameters for ten predictions of the FOA-SVR hybrid strategy.
Figure 3 demonstrates the difference between the predicted results of the FOA-SVR hybrid strategy for the electricity consumption of the hospital outpatient building and the predicted results of the single SVR algorithm with respect to the true value when the number of fireflies was 30 and the maximum number of iterations was 20. The FOA-SVR hybrid strategy data trend change fitting performance was good. Based on the SVR algorithm, the prediction results of the FOA-SVR hybrid strategy were closer to the real values, and the prediction accuracy was significantly improved. In addition, it could be seen from the error bars of the prediction results of the FOA-SVR hybrid strategy that the prediction results of the FOA-SVR hybrid strategy were more stable without large fluctuations and were generalizable. It was worth noting that although the prediction accuracy of the FOA-SVR hybrid strategy was higher than the prediction accuracy of the single SVR algorithm, there were still some differences from the true values in the numerical values of the prediction results. The difficulty of extracting data features was increased by a smaller sample size of data. The FOA-SVR hybrid strategy has strong data feature extraction capability, but was still limited by too small a data sample size.
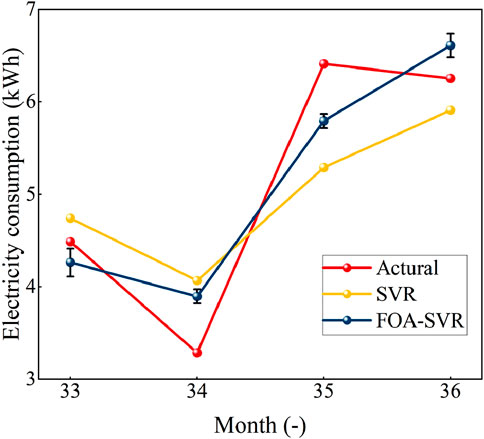
Figure 3. Prediction results comparison of the FOA-SVR hybrid strategy and SVR algorithm.
3.2 Effect of optimization algorithms on the SVR prediction accuracy
When the population size was 30, the prediction accuracy indicators of three different algorithms, Sparrow Search Algorithm (SSA), Seagull Optimization Algorithm (SOA) and FOA, after optimizing the hyper-parameters of the SVR algorithm were shown in Table 5. All three optimization algorithms optimize the penalty coefficient C, the kernel function parameter γ, and the insensitivity band
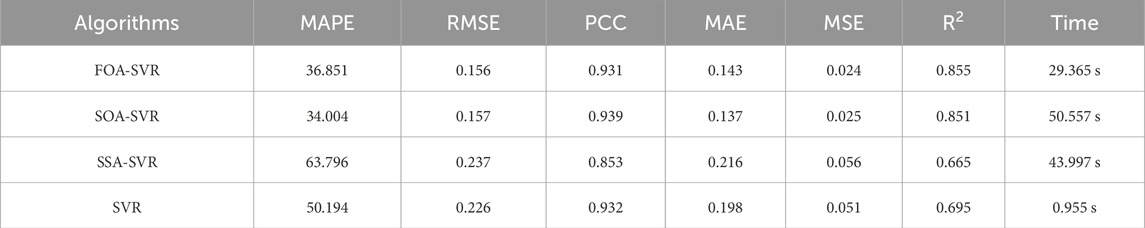
Table 5. Predictive performance of SVR algorithm under different optimization algorithms.
The difficulty of the hybrid strategy in extracting features from the data was determined by the length of the data. The more data features the hybrid strategy extracts, the more accurate the prediction results are. For the electricity consumption of hospital outpatient buildings, their energy consumption data collection was usually calculated on a monthly basis with a small sample size of data. This work collects energy consumption data for 3 years totaling 36 months. The number of samples collected fluctuates up and down within reasonable limits depending on demand. Therefore, validating the generalizability of the FOA-SVR hybrid strategy over different data lengths was a must. Fluctuations in building energy consumption were characterized by seasonality. Seasonality was assumed to be largely characterized over a 3-year data volume. Random perturbations were added to the 36 raw data to generate electricity consumption data for the outpatient building with the same trend but different values. This was repeated twice to obtain electricity consumption data for the outpatient building for a total of 9 years totaling 108 months. Data sets of different data lengths were obtained using 18 months as the basic interval. In particular, 36 raw data were also clipped to explore the effect of smaller data samples on prediction accuracy. Again, the data were clipped at 18-month intervals to obtain the first 18 data of the original data as a control group with a much smaller sample data size. The trend images for data lengths of 18, 36, 54, 72, 90, and 108 were shown in Figure 4.
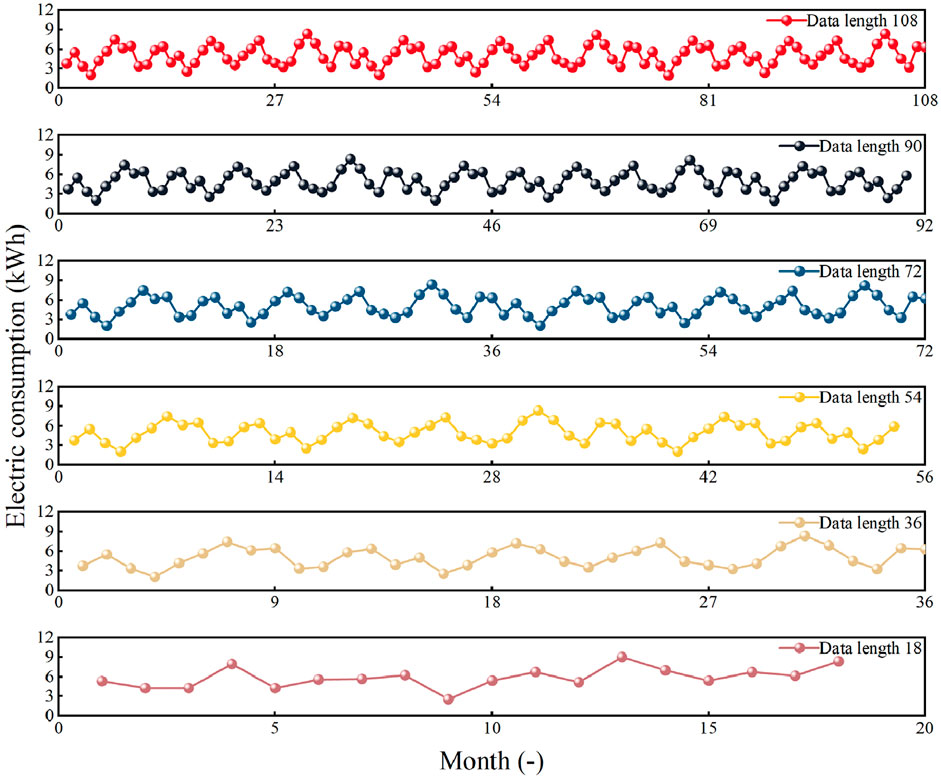
Figure 4. Different lengths of generated data based on electricity consumption characteristics of outpatient buildings.
The difference between the predicted and true values for the six data lengths was shown in Figure 5. To ensure the conditional consistency of the comparison process, the ratio of the training set to the test set remained 8:1. Figures 5a–f shows the difference between the predicted and true values of the four algorithms for data lengths of 18, 36, 54, 72, 90, and 108, respectively. As shown in Figure 5, the prediction accuracy generally improved with longer data sequences. Notably, the model trained on 36-month data did not produce the best results, suggesting that no overfitting occurred at this data length. These consistent trends across different configurations provide supporting evidence for the statistical reliability of the results. However, when the data length was 18, the SVR algorithm fails to extract the data features at all and the prediction accuracy indicator R2 was −3.727. The FOA-SVR, SOA-SVR and SSA-SVR algorithms lost a large number of data features. The prediction accuracy indicators R2 of the three combined algorithms were 0.282, 0.282 and 0.270, respectively. The FOA-SVR and SOA-SVR algorithms have higher prediction accuracy when the data length was 36. The prediction accuracy indicators R2 of both combined algorithms exceeds 0.83. The SSA-SVR and SVR algorithms had similar predictive effects but lower predictive accuracy, with none of the predictive accuracy indicator R2 size exceeding 0.7. All three optimized SVR algorithms accurately identified the data features when the data length was greater than 72. The prediction accuracy indicator R2 of the prediction results of the three combined algorithms exceeded 0.96. It was worth noting that in this work, the FOA-SVR hybrid strategy generalizes better than the other two optimization algorithms, and the prediction accuracy indicator, R2, was stable above 0.99. The prediction accuracy indicator R2 also improves to near 0.9 when the training set data of the single SVR algorithm was greater than 72, which was a higher prediction accuracy, but not as good as the optimized SVR algorithm. Therefore, the FOA-SVR hybrid strategy was more suitable for the prediction of electricity consumption in hospital outpatient buildings with small sample data size compared to other combined algorithms and single SVR algorithm.
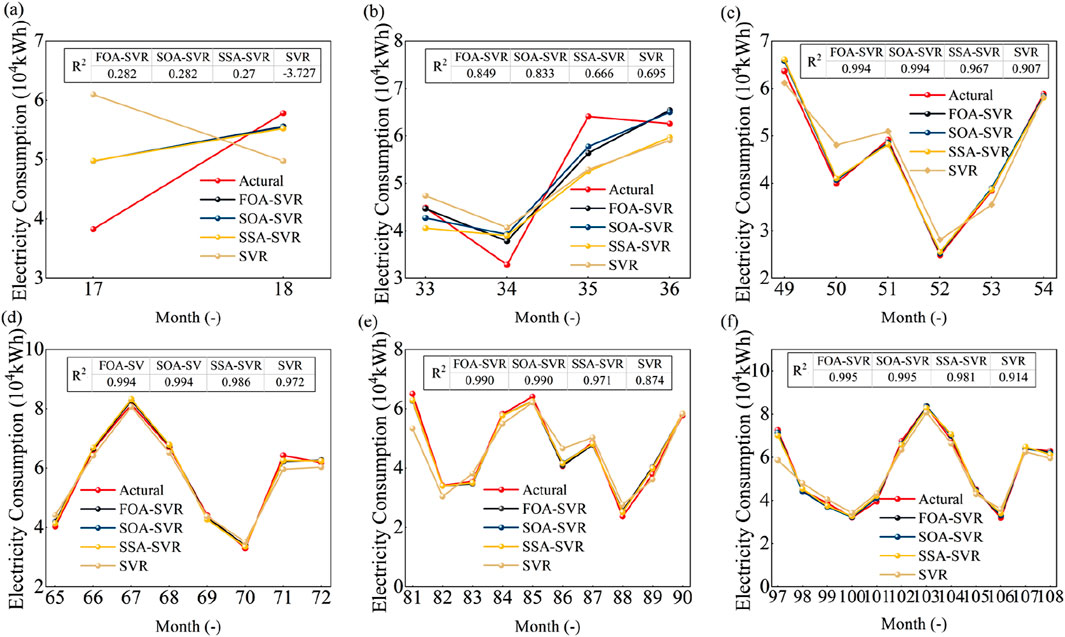
Figure 5. Results of electricity consumption forecasts with different data lengths. (a) 18 months, (b) 36 months, (c) 54 months, (d) 72 months, (e) 90 months, and (f) 108 months.
3.3 Effect of single algorithms on electricity consumption forecasting results
The differences between the predicted results and the true values of the FOA-SVR hybrid strategy and the five single prediction algorithms were shown in Figure 6. The five single algorithms were SVR, K-Nearest Neighbors (KNN), Autoregressive Integrated Moving Average (ARIMA), Decision Tree (DT) and Random Forest (RF). In this figure, the original data samples were small, and the KNN, ARIMA and RF algorithms were difficult to recognize the characteristics of data changes, and the prediction effect was poor. The VR algorithm and the DT algorithm were better predictors and fit the data of the test set better. However, these two algorithms were still inferior to the FOA-SVR hybrid strategy.
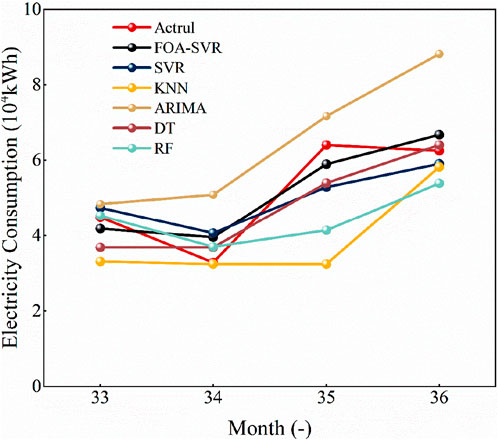
Figure 6. Differences in prediction results between the FOA-SVR hybrid strategy and five single algorithms.
The seven prediction accuracy evaluation indicators for the FOA-SVR hybrid strategy and five single prediction algorithms were shown in Table 6. The coefficient of determination R2 of both SVR algorithm and DT algorithm was around 0.7 with high prediction accuracy. The anomaly of negative coefficient of determination R2 for the KNN algorithm and ARIMA algorithm indicates that both prediction algorithms completely failed to identify the intrinsic correlation of the electricity consumption data of the hospital outpatient building. Under this condition, the KNN algorithm and ARIMA algorithm were not as effective as the simple mean algorithm in prediction. The RF algorithm has a coefficient of determination R2 of 0.096, which was a weak explanation of the variables. The difference between its predicted and actual values of electricity consumption in the hospital outpatient building was explained by the predictive accuracy evaluation indicator R2 for five single algorithms. In particular, PCC serves as an important indicator of the linear correlation between predicted and actual values. The PCC value of the ARIMA algorithm was 0.85 with strong linear correlation, which was opposite to the results of the remaining several indicators for evaluating the prediction accuracy as well as the graphs of the predicted values. The sample data volume of electricity consumption in hospital outpatient buildings was small, but the characteristic relationship between the data was not a single linear relationship. Therefore, a single PCC value does not indicate the superiority of the predictive algorithm. The PCC must be combined with several remaining indicators for evaluating prediction accuracy to make a comprehensive judgment. The SVR algorithm has a prediction accuracy indicator PCC of 0.93, which was greater than 0.89 of the DT algorithms, but the prediction of SVR algorithm is, on the contrary, slightly less effective than the DT algorithm. Overall, the ability demand of the hybrid strategy to extract data features was high in the prediction of electricity consumption in hospital outpatient buildings with a small sample size of data. In particular, prediction algorithms with stochastic nature were difficult to apply to the prediction process with small sample size of data. The SVR algorithm, with its strong data feature extraction capability and high prediction accuracy, was suitable for the process of predicting electricity consumption in hospital outpatient buildings. The prediction accuracy of SVR algorithms could be further improved by optimization algorithms.
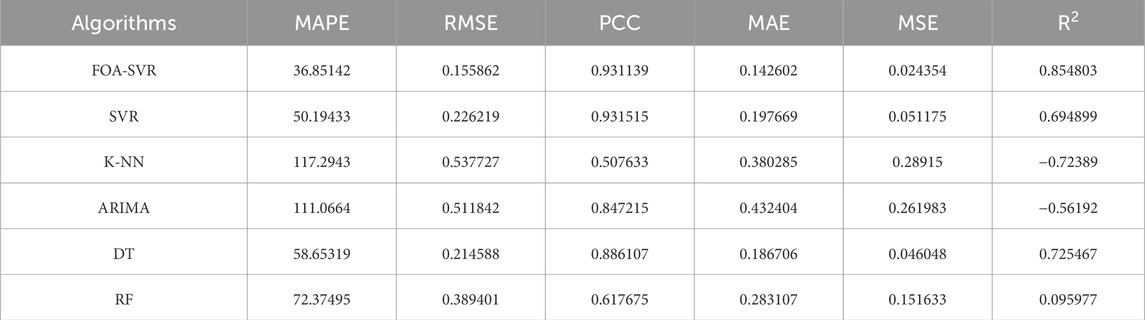
Table 6. Differences in predictive performance between the FOA-SVR hybrid strategy and five single algorithms.
The prediction accuracy indicators of several commonly used neural network algorithms Radial Basis Function (RBF) neural network, Backpropagation (BP) neural network, Elman (ELMAN) neural network and LSTM neural network were shown in Table 7. For neural network algorithms, it was common to have algorithms characterized by high complexity and stochasticity. The higher complexity of neural network algorithms and the presence of randomness could lead to some important data features being ignored when the hybrid strategy learns the data features, which could seriously affect the prediction accuracy. The four algorithms, RBF, BP, ELMAN and LSTM algorithms, have a prediction accuracy evaluation indicator R2 of −3.278, −1.402, −0.055 and −0.387, respectively, which were all less than zero. The results show that the four neural network algorithms have a prediction result error even larger than the error between the mean of the training set and the test set of the original data during the prediction of energy consumption of healthcare buildings with a small sample size of data. Therefore, it was necessary to choose a simple but strong data feature recognition capability such as SVR algorithm in the prediction process of small sample dataset. In contrast, the optimization algorithm does not increase the complexity of the SVR algorithm and optimizes the selection of hyperparameters of the SVR algorithm only based on the data characteristics. Optimization of SVR algorithm using optimization algorithm was a feasible solution for predicting electricity consumption in hospital outpatient buildings.
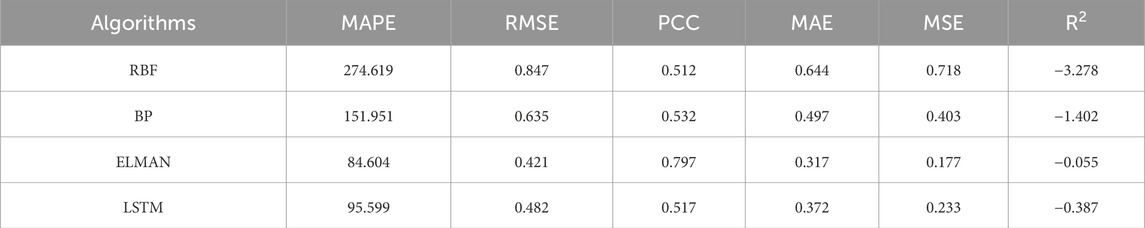
Table 7. Neural network predicts outpatient building electricity usage data.
4 Conclusion
This work explores the effectiveness of an SVR prediction algorithm optimized with hyperparameters by the FOA in terms of predicting electricity consumption of outpatient buildings in hospital. The search space was enlarged by increasing the number of firefly populations to improve the possibility of finding a globally optimal solution. At the same time, the effect of randomness of the optimization algorithm was reduced by ensemble learning to improve the prediction accuracy of the algorithm. The specific conclusions were as follows.
1. The performance of the FOA-SVR hybrid strategy tends to stabilize as the firefly population size increases, with a slight increase in accuracy and a significant decrease in computational performance when the population size exceeds 30. The optimal number of fireflies during the prediction of electricity consumption in outpatient buildings with a small sample size of data was 30. The incremental computational cost does not provide a reasonable return on prediction accuracy after the population size was greater than 30.
2. The FOA-SVR hybrid strategy with a firefly population size of 30 achieves a balance between prediction accuracy and computational efficiency, which was well suited for small-sample data scenarios such as the prediction of electricity consumption in hospital outpatient buildings. The FOA-SVR hybrid strategy consistently outperforms the single SVR algorithm and other optimization-based SVR algorithms (SSA-SVR, SOA-SVR) in terms of prediction accuracy and robustness under different data lengths. Data features were difficult to be extracted by the hybrid strategy when the data volume was lower than 36. The prediction accuracy of the FOA-SVR hybrid strategy rises significantly when the sample capacity was increased appropriately.
3. For the prediction process of electricity consumption in hospital outpatient building with small sample data volume, the complexity and stochasticity of the hybrid strategy increase the difficulty of data feature extraction, and the prediction accuracy decreases significantly. In a single algorithm, the SVR algorithm data feature extraction capability was strong. The FOA-SVR hybrid strategy optimized by the FOA improved the seven accuracy indicators to 36.85142, 0.156, 0.931, 0.143, 0.024, and 0.855, respectively, with the best results. When comparing different single prediction algorithms, it was evident that simple algorithms such as SVR optimized using FOA were more effective than complex neural network algorithms (RBF, BP, ELMAN, LSTM) in a small sample data environment. Neural network algorithms have difficulty in capturing the underlying data features, resulting in poorer predictions.
In conclusion, the FOA-SVR hybrid strategy demonstrates promising performance in predicting electricity consumption in hospital outpatient buildings under limited data conditions, as evidenced by the empirical results presented in this study. The results show that combining SVR with optimization algorithms such as FOA was a feasible approach to improve the accuracy of the hybrid strategy without introducing unnecessary complexity, making it a practical choice for similar prediction tasks in small sample data environments.
Data availability statement
The raw data supporting the conclusions of this article will be made available by the authors, without undue reservation.
Author contributions
CL: Data curation, Investigation, Software, Writing – original draft, Writing – review and editing. GW: Data curation, Methodology, Project administration, Visualization, Writing – review and editing. LZ: Conceptualization, Investigation, Software, Writing – review and editing. QY: Data curation, Formal Analysis, Methodology, Project administration, Validation, Writing – review and editing. YY: Formal Analysis, Methodology, Project administration, Validation, Visualization, Writing – review and editing. QX: Formal Analysis, Funding acquisition, Project administration, Resources, Visualization, Writing – review and editing.
Funding
The author(s) declare that financial support was received for the research and/or publication of this article. The authors acknowledge the financial support from the Yunnan Fundamental Research Projects (No.: 202501AT070124), the Kunming University of Technology Medical Joint Special Project (No.: KUST-KH2022042Y), and the Science and Technology Project of Jiaxing - Special Program for Young Science and Technology Talents (No.: 2023AY40034).
Conflict of interest
The authors declare that the research was conducted in the absence of any commercial or financial relationships that could be construed as a potential conflict of interest.
Generative AI statement
The author(s) declare that no Generative AI was used in the creation of this manuscript.
Any alternative text (alt text) provided alongside figures in this article has been generated by Frontiers with the support of artificial intelligence and reasonable efforts have been made to ensure accuracy, including review by the authors wherever possible. If you identify any issues, please contact us.
Publisher’s note
All claims expressed in this article are solely those of the authors and do not necessarily represent those of their affiliated organizations, or those of the publisher, the editors and the reviewers. Any product that may be evaluated in this article, or claim that may be made by its manufacturer, is not guaranteed or endorsed by the publisher.
References
Abbasimehr, H., Shabani, M., and Yousefi, M. (2020). An optimized model using LSTM network for demand forecasting. Comput. and Industrial Eng. 143, 106435. doi:10.1016/j.cie.2020.106435
Abrishambaf, O., Faria, P., and Vale, Z. (2018). Application of an optimization-based curtailment service provider in real-time simulation. Energy Inf. 1 (1), 3. doi:10.1186/s42162-018-0006-6
Chang, C. J., Lin, J. Y., and Chang, M. J. (2016). Extended modeling procedure based on the projected sample for forecasting short-term electricity consumption. Adv. Eng. Inf. 30 (2), 211–217. doi:10.1016/j.aei.2016.03.003
Che, J., Wang, J., and Wang, G. (2012). An adaptive fuzzy combination model based on self-organizing map and support vector regression for electric load forecasting. Energy 37 (1), 657–664. doi:10.1016/j.energy.2011.10.034
Cheng, C., Liu, X., Zhou, B., and Yuan, Y. (2023). Intelligent fault diagnosis with noisy labels via semisupervised learning on industrial time series. IEEE Trans. Industrial Inf. 19 (6), 7724–7732. doi:10.1109/tii.2022.3229130
Cygańska, M., and Kludacz-Alessandri, M. (2021). Determinants of electrical and thermal energy consumption in hospitals according to climate zones in Poland. Energies 14 (22), 7585. doi:10.3390/en14227585
Ghimire, S., Deo, R. C., Casillas-Pérez, D., Salcedo-Sanz, S., Pourmousavi, S. A., and Acharya, U. R. (2024). Probabilistic-based electricity demand forecasting with hybrid convolutional neural network-extreme learning machine model. Eng. Appl. Artif. Intell. 132, 107918. doi:10.1016/j.engappai.2024.107918
Ghoreishinejad, M., Deymi-Dashtebayaz, M., and Norani, M. (2023). Proposal and multi-objective optimization of a CCHP system based on heat recovery from oxygen generator in hospitals: a case study. J. Clean. Prod. 421, 138549. doi:10.1016/j.jclepro.2023.138549
Gordillo-Orquera, R., Lopez-Ramos, L. M., Muñoz-Romero, S., Iglesias-Casarrubios, P., Arcos-Avilés, D., Marques, A. G., et al. (2018). Analyzing and forecasting electrical load consumption in healthcare buildings. Energies 11 (3), 493. doi:10.3390/en11030493
Hu, Z., Bao, Y., Chiong, R., and Xiong, T. (2015). Mid-term interval load forecasting using multi-output support vector regression with a memetic algorithm for feature selection. Energy 84, 419–431. doi:10.1016/j.energy.2015.03.054
Hu, S., Meng, Y., and Zhang, Y. (2023). Prediction method for sugarcane syrup brix based on improved support vector regression. Electronics 12 (7), 1535. doi:10.3390/electronics12071535
Jaafari, A. (2023). Mapping high poplar growth areas for bioenergy cultivation: a swarm-optimized approach. Renew. Sustain. Energy Rev. 187, 113748. doi:10.1016/j.rser.2023.113748
Javed, M. F., Khan, M., Nehdi, M. L., and Abuhussain, M. (2024). Application of metaheuristic algorithms for compressive strength prediction of steel fiber reinforced concrete exposed to high temperatures. Mater. Today Commun. 39, 108832. doi:10.1016/j.mtcomm.2024.108832
Khalil, A. K. A., Bouaziz, I., Jaber, L., Abushawish, A., Almanassra, I. W., Abdelkareem, M. A., et al. (2024). Fly ash as zero cost material for water treatment applications: a state of the art review. Sep. Purif. Technol. 354, 129104. doi:10.1016/j.seppur.2024.129104
Khan, A., Chiroma, H., Imran, M., Bangash, J. I., Asim, M., Hamza, M. F., et al. (2020). Forecasting electricity consumption based on machine learning to improve performance: a case study for the organization of petroleum exporting countries (OPEC). Comput. and Electr. Eng. 86, 106737. doi:10.1016/j.compeleceng.2020.106737
Kim, T. Y., and Cho, S. B. (2019). Predicting residential energy consumption using CNN-LSTM neural networks. Energy 182, 72–81. doi:10.1016/j.energy.2019.05.230
Li, G., Zhao, X., Fan, C., Fang, X., Li, F., and Wu, Y. (2021). Assessment of long short-term memory and its modifications for enhanced short-term building energy predictions. J. Build. Eng. 43, 103182. doi:10.1016/j.jobe.2021.103182
Lin, L., Shi, J., Ma, C., Zuo, S., Zhang, J., Chen, C., et al. (2023). Non-intrusive residential electricity load decomposition via low-resource model transferring. J. Build. Eng. 73, 106799. doi:10.1016/j.jobe.2023.106799
Liu, F., and Dai, Y. (2023). Product quality prediction method in small sample data environment. Adv. Eng. Inf. 56, 101975. doi:10.1016/j.aei.2023.101975
Liu, A., Ma, Y., Miller, W., Xia, B., Zedan, S., and Bonney, B. (2022). Energy analysis and forecast of a major modern hospital. Buildings 12 (8), 1116. doi:10.3390/buildings12081116
Márquez-Chamorro, A. E., Asencio-Cortés, G., Santiesteban-Toca, C. E., and Aguilar-Ruiz, J. S. (2015). Soft computing methods for the prediction of protein tertiary structures: a survey. Appl. Soft Comput. 35, 398–410. doi:10.1016/j.asoc.2015.06.024
Mazzeo, D., Baglivo, C., Panico, S., Manieri, M., Matera, N., and Congedo, P. M. (2023). Eco-sustainable energy production in healthcare: trends and challenges in renewable energy systems. Energies 16 (21), 7285. doi:10.3390/en16217285
Patil, S., and Kini, P. G. (2024). Calibration of simulation model to analyze hospital building energy performance. Energy Build. 313, 114242. doi:10.1016/j.enbuild.2024.114242
Peng, C., Che, Z., Liao, T. W., and Zhang, Z. (2023). Prediction using multi-objective slime mould algorithm optimized support vector regression model. Appl. Soft Comput. 145, 110580. doi:10.1016/j.asoc.2023.110580
Ponce-Flores, M., Frausto-Solís, J., Santamaría-Bonfil, G., Pérez-Ortega, J., and González-Barbosa, J. (2020). Time series complexities and their relationship to forecasting performance. Entropy 22, 89. doi:10.3390/e22010089
Roletto, A., Zanardo, M., Bonfitto, G. R., Catania, D., Sardanelli, F., and Zanoni, S. (2024). The environmental impact of energy consumption and carbon emissions in radiology departments: a systematic review. Eur. Radiol. Exp. 8 (1), 35. doi:10.1186/s41747-024-00424-6
Satapathy, P., Sahu, J., Mohanty, P. K., Nayak, J. R., and Naik, A. (2024). Short-term electric load forecasting using empirical mode decomposition based optimized extreme learning machine. Evol. Syst. 15, 2169–2191. doi:10.1007/s12530-024-09609-1
Schölkopf, B., Simard, P., Smola, A., and Vapnik, V. (1997). Prior knowledge in support vector kernels. Adv. Neural Inf. Process. Syst., 10. Available online at: https://proceedings.neurips.cc/paper_files/paper/1997/hash/01d8bae291b1e4724443375634ccfa0e-Abstract.html
Seçkiner, S. U., and Koç, A. (2022). Agent-based simulation and simulation optimization approaches to energy planning under different scenarios: a hospital application case. Comput. and Industrial Eng. 169, 108163. doi:10.1016/j.cie.2022.108163
Soyler, I., and Izgi, E. (2022). Electricity demand forecasting of hospital buildings in istanbul. Sustainability 14 (13), 8187. doi:10.3390/su14138187
Taghavifar, H., and Mardani, A. (2014). A comparative trend in forecasting ability of artificial neural networks and regressive support vector machine methodologies for energy dissipation modeling of off-road vehicles. Energy 66, 569–576. doi:10.1016/j.energy.2014.01.022
Taghavifar, H., Mardani, A., and Maslak, H. K. (2015). A comparative study between artificial neural networks and support vector regression for modeling of the dissipated energy through tire-obstacle collision dynamics. Energy 89, 358–364. doi:10.1016/j.energy.2015.05.122
Wang, R., Pei, X., Zhu, J., Zhang, Z., Huang, X., Zhai, J., et al. (2022). Multivariable time series forecasting using model fusion. Inf. Sci. 585, 262–274. doi:10.1016/j.ins.2021.11.025
Wang, J., He, Z., Geng, T., Huang, F., Gong, P., Yi, P., et al. (2023). State causality and adaptive covariance decomposition based time series forecasting. Sensors 23 (2), 809. doi:10.3390/s23020809
Weron, R. (2014). Electricity price forecasting: a review of the state-of-the-art with a look into the future. Int. J. Forecast. 30 (4), 1030–1081. doi:10.1016/j.ijforecast.2014.08.008
Wu, Y., Liu, Y., Ahmed, S. H., Peng, J., and El-Latif, A. (2019). Dominant data set selection algorithms for electricity consumption time-series data analysis based on affine transformation. IEEE Internet Things J. 7 (5), 4347–4360. doi:10.1109/jiot.2019.2946753
Wu, J., Cui, X., Meng, J., Peng, J., and Lin, M. (2023). Data-driven transfer-stacking-based state of health estimation for lithium-ion batteries. IEEE Trans. Industrial Electron. 71 (1), 604–614. doi:10.1109/tie.2023.3247735
Wu, X., Chen, M., Zhu, T., Chen, D., and Xiong, J. (2024). Pre-training enhanced spatio-temporal graph neural network for predicting influent water quality and flow rate of wastewater treatment plant: improvement of forecast accuracy and analysis of related factors. Sci. Total Environ. 951, 175411. doi:10.1016/j.scitotenv.2024.175411
Yu, S., Wang, K., and Wei, Y. M. (2015). A hybrid self-adaptive particle swarm optimization-genetic algorithm-radial basis function model for annual electricity demand prediction. Energy Convers. Manag. 91, 176–185. doi:10.1016/j.enconman.2014.11.059
Zapirain, I., Etxegarai, G., Hernández, J., Boussaada, Z., Aginako, N., and Camblong, H. (2022). Short-term electricity consumption forecasting with NARX, LSTM, and SVR for a single building: small data set approach. Energy Sources, Part A Recovery, Util. Environ. Eff. 44 (3), 6898–6908. doi:10.1080/15567036.2022.2104410
Zhang, D., Lin, J., Peng, Q., Wang, D., Yang, T., Sorooshian, S., et al. (2018). Modeling and simulating of reservoir operation using the artificial neural network, support vector regression, deep learning algorithm. J. Hydrology 565, 720–736. doi:10.1016/j.jhydrol.2018.08.050
Zhang, K., Chen, Q., Chen, J., He, S., Li, F., and Zhou, Z. (2022). A multi-module generative adversarial network augmented with adaptive decoupling strategy for intelligent fault diagnosis of machines with small sample. Knowledge-Based Syst. 239, 107980. doi:10.1016/j.knosys.2021.107980
Zhu, Z., Jiang, T., Ali, M., Meng, Y., Jin, Y., Cui, Y., et al. (2022). Rechargeable batteries for grid scale energy storage. Chem. Rev. 122 (22), 16610–16751. doi:10.1021/acs.chemrev.2c00289
Zhuang, D., Gan, V. J. L., Tekler, Z. D., Chong, A. D., Tian, S., and Shi, X. (2023). Data-driven predictive control for smart HVAC system in IoT-integrated buildings with time-series forecasting and reinforcement learning. Appl. Energy 338, 120936. doi:10.1016/j.apenergy.2023.120936
Nomenclature
Variant
Keywords: firefly optimization algorithm, support vector regression, small sample size, electricity consumption projections, hospital outpatient building
Citation: Liu C, Wu G, Zhang L, Yao Q, Yang Y and Xiao Q (2025) Intelligent forecasting of electricity consumption for hospital outpatient buildings by FOA-SVR hybrid strategy. Front. Energy Res. 13:1566664. doi: 10.3389/fenrg.2025.1566664
Received: 23 February 2025; Accepted: 26 August 2025;
Published: 23 September 2025.
Edited by:
Maria Grazia De Giorgi, University of Salento, ItalyReviewed by:
Ashwini Kumar, Manav Rachna International Institute of Research and Studies (MRIIRS), IndiaVinny Junior Foba Kakeu, University of Douala, Cameroon
Copyright © 2025 Liu, Wu, Zhang, Yao, Yang and Xiao. This is an open-access article distributed under the terms of the Creative Commons Attribution License (CC BY). The use, distribution or reproduction in other forums is permitted, provided the original author(s) and the copyright owner(s) are credited and that the original publication in this journal is cited, in accordance with accepted academic practice. No use, distribution or reproduction is permitted which does not comply with these terms.
*Correspondence: Qinwen Yao, eWFvcWlud2VuMjAyMkBzdHUua3VzdC5lZHUuY24=; Yaru Yang, eXlyMDUxNUB6anh1LmVkdS5jbg==; Qingtai Xiao, cWluZ3RhaS54aWFvQGt1c3QuZWR1LmNu