- 1State Grid Zhejiang Electric Power Research Institute, Hangzhou, Zhejiang, China
- 2School of Automation, Wuhan University of Technology, Wuhan, Hubei, China
The closing-loop and splitting-loop operations of sectionalizing switches and tie switches serve as crucial means for self-healing in distribution network feeder areas. However, the inrush currents generated during closing-loop operations impact the secure and stable operation of distribution networks. To address these challenges, this paper analyzes the effects of steady-state circulating currents and closing-loop inrush currents caused by tie-switch operations on loop-closing branches. Leveraging the dynamic compensation characteristics of AC flexible interconnection devices (FIDs), we elucidate the working principles of FID-based distribution network self-healing and propose an inrush-current-free closing-loop method utilizing FIDs. For distribution networks incorporating wind and solar resources, constraints characterizing line power flow, nodal voltage, branch capacity, and network topology are established, forming a multi-objective optimization model for self-healing that considers renewable energy accommodation capacity. Finally, case studies demonstrate the effectiveness of the proposed self-healing scheme in enhancing renewable energy accommodation capabilities.
1 Introduction
With the large-scale integration of renewable energy sources such as wind, solar, and energy storage into distribution networks, the characteristics of wind-solar resources and electricity demand for different distribution areas exhibit distinct patterns. There exists a significant amount of regional, large-scale, spatiotemporal energy exchange between these distribution areas (Gui et al., 2024; Kabirifar et al., 2021). Through feeder automation and distribution network reconfiguration technologies, the distribution network can achieve interconnection between sub-zones, thereby effectively utilizing inter-zone energy exchange to improve operational efficiency. However, interconnection of distribution networks requires switching actions using sectionalizers and tie switches to form and de-form loops. Currently, conventional loop closing methods are limited by mechanical constraints, exhibit slow response times, and may generate loop closing inrush currents. These inrush currents not only pose a threat to the safe and stable operation of the distribution network but could also lead to protection relay operations, causing loop closing failures (Xiaodong et al., 2022; Cai et al., 2022). FID can be deployed in typical scenarios such as multi-source islanded power supply, rapid fault transfer, and voltage sag mitigation. In low-voltage distribution networks, different transformer areas exhibit distinct characteristics in distributed renewable integration and load demand. Significant complementary energy flows exist across adjacent LV areas at regional spatiotemporal scales. Implementing interconnections between LV areas to leverage these complementary flows enhances operational efficiency, enables grid interoperability with mutual backup capabilities, and achieves peak-shaving energy exchange–where effective assessment methods for inter-area complementarity serve as a crucial prerequisite. In medium-voltage distribution networks, flexible interconnection technology achieves impact-free loop closing, substantially reducing constraints during network reconfiguration. This facilitates rapid self-healing, while flexible network reconfiguration optimizes distribution system operations and improves renewable energy accommodation. Therefore, developing flexible interconnection devices with simpler topologies, more straightforward control strategies, and lower costs–followed by exploring their operational modes across diverse MV/LV distribution network scenarios–holds significant importance.
To maximize the integration capacity of the distribution network for renewable energy sources such as wind power, solar power, and to enhance its ability to supply new types of flexible loads like electric vehicle charging stations, researchers have proposed the concept of a Flexible Interconnected Device (FID) (Fuad et al., 2020; Deakin et al., 2022; Zhang et al., 2020). The FID, based on power electronic technology, provides flexible power regulation and interconnection capabilities to the distribution network through an adjustable voltage source converter. By utilizing flexible interconnection technology, seamless loop closing can be achieved, inter-phase power flows can be balanced, the constraints on self-healing in the network can be reduced, the operational state of the distribution network can be optimized, and the level of wind and solar energy consumption can be improved (Yiyi et al., 2022; Alwash et al., 2023; Zolfaghari et al., 2022; Qian et al., 2024).
Self-healing technology for distribution networks can be mainly divided into two types: closed-loop power supply self-healing technology and open-loop power supply self-healing technology. Open-loop power supply is the primary mode of power delivery in distribution networks, and its self-healing relies on feeder automation and distribution network reconfiguration technologies. During the loop closing operation, the node voltages on both sides of the loop closing point fluctuate constantly due to the influence of node load and the connection of distributed energy sources. This causes a voltage difference at the loop closing point, which results in loop closing inrush currents that severely affect the loop closing success rate and the safety of the distribution network system.
In recent years, with the development of flexible interconnected devices such as the Soft Open Point(SOP), technical solutions have been proposed to address issues such as circulating power and electromagnetic ring networks brought by closed-loop power supply methods (Li et al., 2023; Zhang et al., 2023; Luo et al., 2023; Yang et al., 2024; Jian et al., 2024), and their self-healing technologies have been widely researched. Reference (Chen et al., 2024) proposes a distributed traveling wave-based fault location and distance measurement technology for distribution ring networks, enhancing the accuracy and reliability of fault location in power supply ring networks. Reference (Yutao et al., 2024) uses a four-port SOP to form a power supply ring network containing a DC network, and then proposes a two-stage self-healing solution for interlinked distribution network faults, utilizing the power flow regulation ability of FID to assist in fast load transfer and network reconfiguration. Reference (Yifei et al., 2024) connects energy storage devices to the DC side of SOPs in distribution ring networks, allowing the SOP to supply load power using the energy storage device’s inverter to provide AC power when both power sources on either side of the supply ring network fail. Reference (Yuduo et al., 2022) develops a random optimization model for the fault recovery of a flexible interconnected distribution network in the case of coordinated operation of multiple closed-loop power supply systems. The methods proposed in these papers can improve the self-healing ability of the ring network power supply system. In addition, PV-integrated distribution networks have also been studied in the context of optimal network reconfiguration. For example, reference (Abdalla et al., 2021) proposes a strategy that optimizes the reconfiguration of PV-connected systems to enhance power supply continuity and voltage stability. However, they still fail to address the economic issues of ring network power supply.
Many experts and scholars have also proposed using various control methods within the distribution network to regulate the voltage at the loop closing point and achieve proactive loop closing. Reference (Zhang et al., 2018) controls the operating mode of the distribution system and the action sequence of circuit breaker groups, limiting the duration of the loop closing inrush current. This research solves the issue of seamless loop closing and power transfer when the voltage phase angle difference at the loop closing point is 30°, and concludes that by coordinating the control of the phase angle difference and the loop closing and opening time intervals, the loop closing inrush current can be effectively suppressed. Reference (Zhou et al., 2020) considers the integration of distributed wind and solar resources in distribution network feeders and utilizes their output to regulate the voltage at the loop closing point. It derives the loop closing constraints after the integration of distributed energy sources into the feeder loop closing point and builds a distribution network reconfiguration model based on this. Reference (Zhi et al., 2022) adjusts the distribution network’s operating mode or optimizes power flow distribution to regulate the voltage at the loop closing point proactively. Reference (Abdalla and Mostafa, 2022) proposes the use of Smart Ring Main Units (SRMUs) to provide self-healing capability and develops a methodology for determining the optimal number and locations of SRMUs. This methodology integrates the optimal cost-benefit ratio from the perspective of Distribution Companies (DISCOs) and the optimal network operation cost. From the above analysis, current research on loop closing operations mainly focuses on how to adjust the voltage difference between the nodes on either side of the loop closing point to meet the loop closing criteria. However, there is relatively little research on interconnection devices that can achieve seamless loop closing economically and efficiently without causing inrush currents. In terms of topology, existing flexible interconnection devices can achieve flexible power regulation through back-to-back AC/DC/AC converters with two sets of VSCs for rectification and inversion, but this increases the device cost. Three-port AC interconnection devices incorporate energy storage to support DC voltage. Although configuring large-scale energy storage in long-term interconnected operation of distribution networks can enhance regulation flexibility, it further raises costs.
Aiming at the self-healing problem in low-voltage distribution networks, this paper first analyzes the impacts of steady-state circulating current and inrush current generated by the loop closing method based on tie switches on the loop closing branch. Then, based on the dynamic compensation characteristics of the AC flexible interconnection device, a shock-free loop closing method using the AC flexible interconnection device is proposed. For distribution networks with wind and photovoltaic resources, constraint conditions characterizing line power flow, node voltage, branch capacity, and network topology are constructed, and a multi-objective optimization model for self-healing in distribution networks considering wind and photovoltaic accommodation capacity is established.
2 Analysis of self-healing in distribution networks
In an open-loop operating distribution network, self-healing is first achieved through feeder automation technology when a system fault occurs. This process involves the coordination of action sequences between normally closed sectionalizers on the feeder and normally open tie switches between feeders, enabling load transfer and automatic restoration of power to the affected areas after a fault. A schematic diagram of the self-healing process in a distribution network is shown in Figure 1.
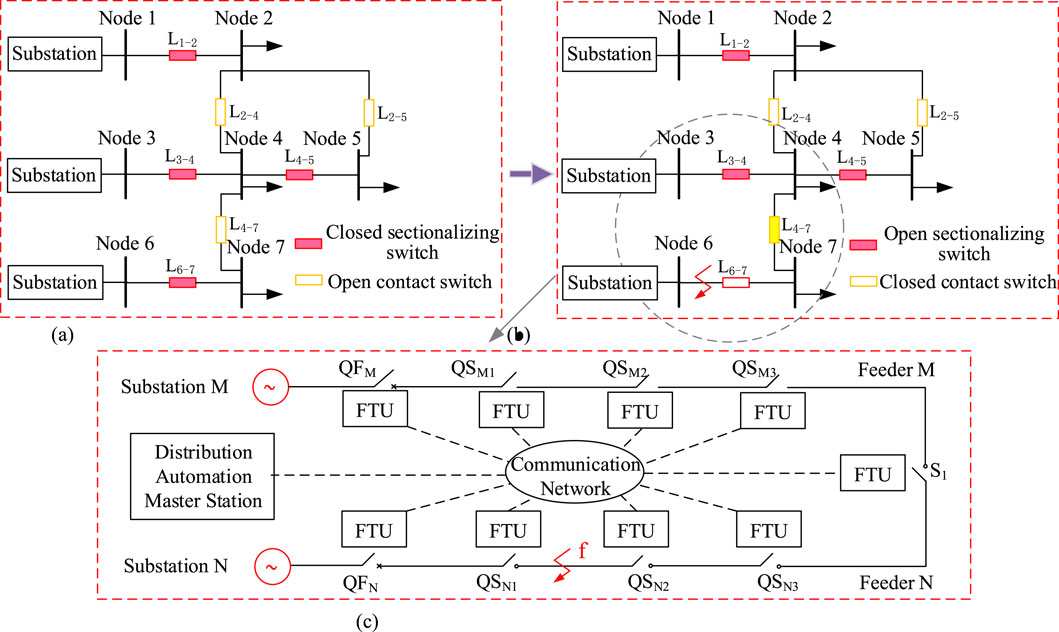
Figure 1. Distribution network self-healing process diagram. (a) Distribution network under normal operation (b) Distribution network after initial power restoration following a fault (c) Schematic diagram of feeder automation.
The preliminary power restoration process after a fault in the distribution network is shown in Figures 1a,b. When a fault occurs on branch L6-7, the load at node 7 will lose power supply. After fault isolation via feeder automation, the normally open tie switch on branch L4-7 can transfer the load of node 7 to node 4, achieving preliminary power restoration. Feeder automation technology is based on the Feeder Terminal Unit (FTU) shown in Figure 1c. In this system, QFM and QFN represent the substation circuit breakers at the exits of feeder M and feeder N, respectively. QSM1, QSM2, and QSM3 are the sectionalizers on feeder M, while QSN1, QSN2, and QSN3 are the sectionalizers on feeder N. S1 is the tie switch between feeder M and feeder N. If a fault occurs at point f, the FTUs installed next to each switch will transmit the switch status and fault parameters to the feeder automation master station via the communication network. The master station performs fault location and then sends control signals to the FTUs corresponding to sectionalizers QSN1 and QSN2. The FTU will open QSN1 and QSN2, isolating the fault, and finally, the tie switch will be closed to achieve preliminary power restoration in the non-faulted area. As a core device for distribution network automation, the FTU (Feeder Terminal Unit) forms a “data collection-transmission-control” closed loop with the upper-layer network architecture, primarily achieving real-time monitoring and control of feeder circuits. Its working principle is mainly articulated through three dimensions: data acquisition, logical processing, and control execution. However, this paper only briefly describes the operational relationship between the FTU and the communication network, which is not the primary focus of our research.
Network reconfiguration requires a series of loop-closing and opening operations. For example, to further transfer the load of node 7, loop closing between nodes 2 and 4, or between nodes 2 and 5, can be performed. Whether the loop closing operation is successful determines whether network reconfiguration and load transfer can be completed smoothly. However, due to the voltage difference at the loop closing point, loop closing operations generate loop-closing inrush currents. If the inrush current is too large, it may trigger the protection relays, severely affecting the loop closing success rate and the safety of the distribution network system. Below, we analyze the steady-state circulating currents and loop-closing inrush currents generated by the loop-closing method based on tie switches in the distribution network.
The schematic diagram of the loop-closing process in the distribution network is shown in Figure 2a. In the diagram,
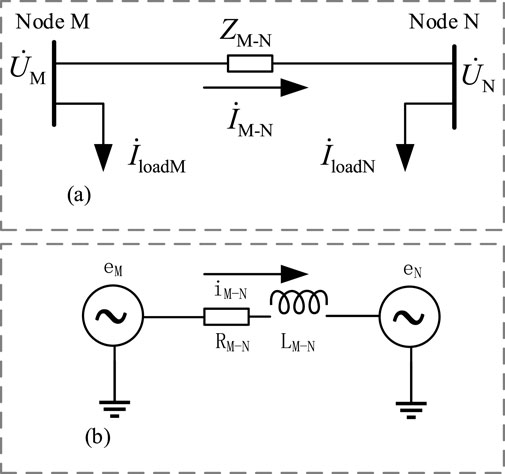
Figure 2. The steady-state and transient process diagram of distribution network loop closure. (a) Schematic of the steady-state process of distribution network loop closure (b) Schematic of the transient process of distribution network loop closure.
Assuming that the load currents before and after loop closing remain unchanged, after the loop is closed, due to the presence of steady-state circulating currents, the load line current at node M will be
The transient process of loop closing in the distribution network is shown in Figure 2b. Due to the presence of line inductance, the loop-closing current not only has a periodic component but also contains sub-periodic components generated by the zero-state response of the line inductance. The total loop-closing current expression is:
where
In Equation 1, the first term represents the steady-state circulating current, and the second term represents the transient inrush current. Therefore, the loop-closing inrush current is given by:
From Equation 2, it can be seen that the loop-closing inrush current is a function of the initial phase angle
From the above analysis, it can be concluded that the presence of the loop-closing voltage vector difference generates steady-state circulating currents and transient inrush currents during loop closing, which severely affects the safe operation of the distribution network.
According to Kirchhoff’s law, the loop-closing current in the loop branch, which includes transient inrush components, will cause the line currents of other branches that are not involved in the loop closing to also contain non-periodic components. Under the influence of these components, non-periodic components will also be superimposed on the node voltages after loop closing. This will lead to voltage fluctuations at each node and even cause voltage violations. Therefore, to eliminate the negative impact of the loop-closing process, it is essential to limit or eliminate the voltage difference on both sides of the loop-closing switch as much as possible.
3 Self-healing working principle of distribution networks with AC flexible interconnection devices
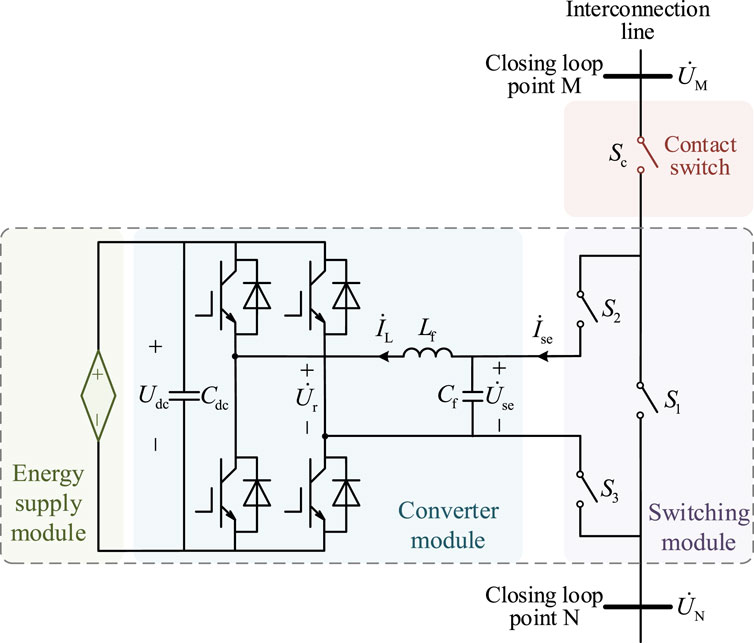
The single-phase topology of the FID main circuit is shown in Figure 3. This topology consists of three parts: the switch module, converter module, and power supply module. In this paper, a flexible interconnection scheme is proposed, where the FID is connected in series with the tie switch Sc. Through the coordinated operation of the FID and tie switch, flexible loop closing in low-voltage distribution network areas and self-healing of the distribution network are achieved.
In Figure 3,
The switch module consists of a bypass switch S1 and two loop-closing switches S2 and S3. By closing the loop-closing switches S2 and S3, the FID can be connected in series between areas M and N to compensate for the loop-closing voltage difference, thereby reducing the voltage across the tie switch Sc and achieving flexible loop closing. Once the loop-closing is completed, if there are no other control requirements for the interconnection line, the bypass switch S1 is used to bypass the FID and remove it from operation. This helps reduce distribution network line losses and extend the lifespan of the FID.
The converter module consists of three single-phase full-bridge voltage-source converters and a filter circuit. Its main function is to output a flexible and adjustable output voltage
The power supply module is connected to the DC side of the converter module through the DC capacitor Cdc. Its main function is to provide active power support to the device before the FID loop-closing. Therefore, energy sources such as supercapacitors, uninterruptible power supplies (UPS), and photovoltaic-storage hybrid systems can be used as the energy supply for the FID. Since the focus of this paper is on the AC characteristics of the interaction between the FID and the distribution areas, in the subsequent analysis, the power supply module will be equivalently modeled as a DC voltage source.
If a fault occurs at node M, causing the load to lose power, the initial restoration of power can be achieved by directly closing the mechanical tie switch through feeder automation. If the restoration occurs during the loop-closing stage of the distribution network reconfiguration, the entire impact-free loop-closing process can be divided into the following three stages.
First Stage: Keep the mechanical tie switch open and rely on the voltage compensation characteristics of the interconnection device to control the loop-closing voltage vector difference
To achieve no circulating current and no inrush current at the moment of loop-closing, the loop-closing voltage vector difference
At this point, by closing the access switches S2 and S3, the interconnection device is connected to the interconnection feeder, and the distribution network achieves impact-free loop-closing. Of course, in a practical distribution network system, during the process where the interconnection device outputs an equivalent voltage source, the load at nodes M and N, as well as their voltages, change over time. Thus, there will still be a voltage difference at the moment of loop-closing. However, considering that the voltage fluctuations at 10 kV distribution network nodes are typically not significant, it can still be regarded as an impact-free loop-closing.
After the access switches are closed, the interconnection line current is Equation 6:
At this point, it can be observed that the current in the interconnection line is zero, and load transfer cannot proceed. Therefore, the impact-free loop-closing process enters the second stage.
Second Stage: Keep the mechanical tie switch open and control the interconnection device’s equivalent output voltage to steadily decay to zero. As a result, the interconnection line current
Assuming that the voltages at nodes A and B remain constant during the load transfer in the second stage, the interconnection device’s equivalent output voltage decays linearly over time, which can be expressed as Equation 7:
In Equation 7,
When the interconnection device’s equivalent output voltage is zero, its equivalent output impedance is theoretically also zero. However, in reality, the components of the interconnection device, such as IGBTs, DC capacitors, and filters, are not ideal. They will generate active power losses, which can affect the lifespan of the interconnection device. Therefore, the impact-free loop-closing process enters the third stage, during which the interconnection device is taken out of operation.
Third Stage: Directly close the mechanical tie switch, because at this point, the voltage across the tie switch is equal to the output voltage of the parallel voltage source converter, which is approximately zero, so no inrush current is generated. Then, disconnect the access switches S2 and S3, and lock out the interconnection device. With this, the impact-free loop-closing process is complete.
The active power balance relationship is
where
The rated capacity ratio of distribution transformers is defined as Equation 10
To reduce the capacity requirements of distribution transformers and alleviate grid expansion pressures, the primary objective of power mutual support is to achieve rational allocation of transformer capacity. Assuming interconnected feeders have the same power factor
Substituting Equation 11 into Equation 9 yields the required active power exchange Equation 12 that the interconnection device should transfer to achieve the aforementioned objective:
In extreme cases, the mutual power transferred by the interconnected devices reaches its maximum value, which occurs when one distribution transformer is under no-load while the other is fully loaded, with a power factor of 1 for the feeder area, and the full load equals the transformer’s capacity, Equation 13 is:
The transferred mutual power reaches its maximum value Equation 14:
Therefore, when designing the capacity of the interconnection device, the reference value for active power regulation should be set according to the above equation. This allows for full utilization of the interconnected feeders' transformer capacity and achieves optimal allocation of transformer resources.
4 The self-healing model based on AC flexible interconnection devices
Due to the randomness of wind and solar power generation, it is difficult to directly use the fluctuating output of wind and solar resources in the distribution network as an optimization objective. Therefore, this section starts from the constraints of the distribution network reconfiguration, analyzes the objective functions that can improve the wind and solar power consumption capability, and studies the reconfiguration method for distribution networks with wind and solar resources.
In the process of distribution network optimization reconfiguration, the following constraints need to be satisfied:
(1) Power balance constraint: To ensure the power balance of the entire network, there are distribution network power flow constraints Equations 15, 16:
where
(2) Node voltage constraints: To ensure that the node voltages of the reconfigured distribution network do not exceed their limits, the following node voltage constraints Equation 17 must be satisfied:
In the equation,
(3) Branch capacity constraints: To ensure that the power on the reconfigured branches does not exceed the allowable limits, the following branch capacity constraints Equation 18 must be satisfied:
where
(4) Network topology constraints: Based on the operational characteristics of the distribution network, the optimized reconfiguration of the network topology must meet the requirements of neither islanding nor the formation of a ring network.
In Equation 19,
From the distribution network flow constraints, it can be seen that the output of wind and photovoltaic power connected to each node is subject to voltage constraints. For medium and low-voltage distribution networks, the node voltage constraint is the most important factor limiting the absorption capacity of distributed photovoltaic (PV) systems. Especially when large-scale distributed PV systems are integrated into the distribution network, the power generation from these systems can cause reverse power flow, which raises the node voltage. Before the upper-level transformer reaches its capacity limit, the node voltage of the distribution network is often already exceeding the limit. Therefore, by optimizing the electrical network’s flow distribution through network reconfiguration and improving the system’s node voltage distribution, the absorption capacity of distributed PV systems in the distribution network can be effectively enhanced. Below is a detailed analysis of the relationship between node voltage and the output of wind and photovoltaic power.
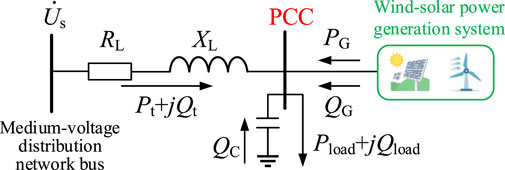
For the wind and solar power generation systems connected to the medium-voltage distribution network, the equivalent circuit is shown in the Figure 4.
Due to the capacity of wind and photovoltaic (PV) power generation systems being much smaller than that of the distribution network, it can be assumed that the distribution system is an infinitely large capacity power system in this analysis. In the figure, The voltage of the medium-voltage distribution network bus, denoted as
The total power transmitted from the distribution bus to the PCC node load through the feeder is Equation 22:
From this, the voltage drop caused by the feeder impedance when supplying power from the distribution bus to the PCC node can be expressed as Equation 23:
Taking the phase of the PCC node voltage as the reference phase, the above equation can be expressed as Equation 24:
The real part of the above equation represents the longitudinal component of the voltage drop, while the imaginary part represents the transverse component of the voltage drop. The transverse component of the voltage drop in the medium-voltage distribution network feeder can be neglected,
The power balance at the PCC node gives
Substituting Equation 26 and Equation 27 into Equation 25, we obtain
The arrangement of reactive power compensation devices connected in parallel at different PCC nodes varies significantly in terms of their capacity, so the reactive power they generate is neglected, i.e.,
From Equation 29, it can be seen that due to the presence of line resistance, the active power delivered by the wind and photovoltaic generation systems to the distribution network will cause an increase in the PCC node voltage. That is, the wind and photovoltaic consumption capacity is to some extent dependent on the voltage quality at the PCC node: If, after network reconfiguration, the node voltage at a point where wind and photovoltaic resources are connected approaches the upper voltage limit, a slight increase in the output of the wind and photovoltaic systems will cause the PCC node voltage to exceed the limit, resulting in poor wind and photovoltaic consumption capacity. Therefore, it can be concluded that the closer the node voltage at the PCC point is to the upper voltage limit after the distribution network reconfiguration, the poorer the wind and photovoltaic consumption capacity of the distribution network will be; conversely, the closer the node voltage is to the lower voltage limit, the stronger the wind and photovoltaic consumption capacity of the distribution network will be.
However, in order to balance the wind and photovoltaic consumption capacity with the system’s safe and stable operation, the optimization objective for distribution network reconfiguration should be to make the node voltage as close as possible to the rated voltage. The corresponding objective function can be set as Equation 30:
where
In addition, there is the objective function Equation 31 reflecting the minimization of network losses:
where
The objective function reflecting load balancing is Equation 32:
where
The objective function reflecting the minimum number of switch operations is Equation 33:
where
To perform multi-objective optimization reconfiguration in the distribution network, considering the different priorities of the four objective functions, it is necessary to first normalize the objective functions. The normalized objective function is expressed as Equation 34:
where
The final objective function, considering all sub-objective functions, is expressed as Equation 35:
where
5 Simulation verification
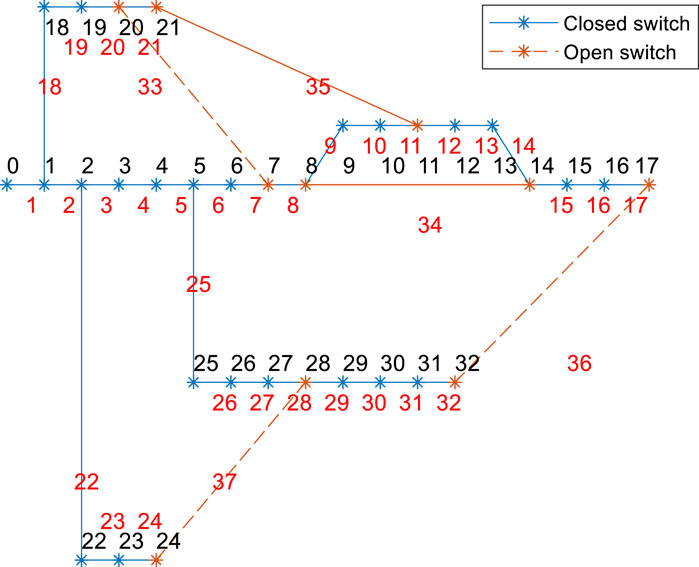
Using the IEEE 33-bus distribution system shown in Figure 5 as an example, this paper builds the model on the MATLAB platform and employs a genetic algorithm to solve the aforementioned multi-objective optimization reconfiguration model for the distribution network. Many existing studies have applied genetic algorithms to solve distribution network reconfiguration models, and appropriate modifications and adjustments have been made to meet the radiality and connectivity requirements of the distribution network reconfiguration (Yizhou et al., 2020; Xinghai et al., 2023). This paper will not go into further details on these modifications.
In the figure, the black numbers (0–32) represent node identifiers, with node 0 being the power source node set to 11kV, and the rated voltage of other nodes being 10 kV. The red numbers (1–37) represent branch identifiers; the blue lines indicate that the sectionalizing switches/contact switches on the branches are closed, while the orange lines indicate that these switches are open.
Figure 5 shows the initial state of the distribution network, where each node is connected to the power source node, and the power supply to the loads is normal. To verify the fault recovery capability of the distribution network through optimized reconfiguration, the switch on branch 22 is opened to simulate a network fault, causing the loads at nodes 22, 23, and 24 to lose power.
The results of the network reconfiguration are shown in Figure 6, where nodes 22, 23, and 24 are restored to power, demonstrating fault recovery through the distribution network reconfiguration.
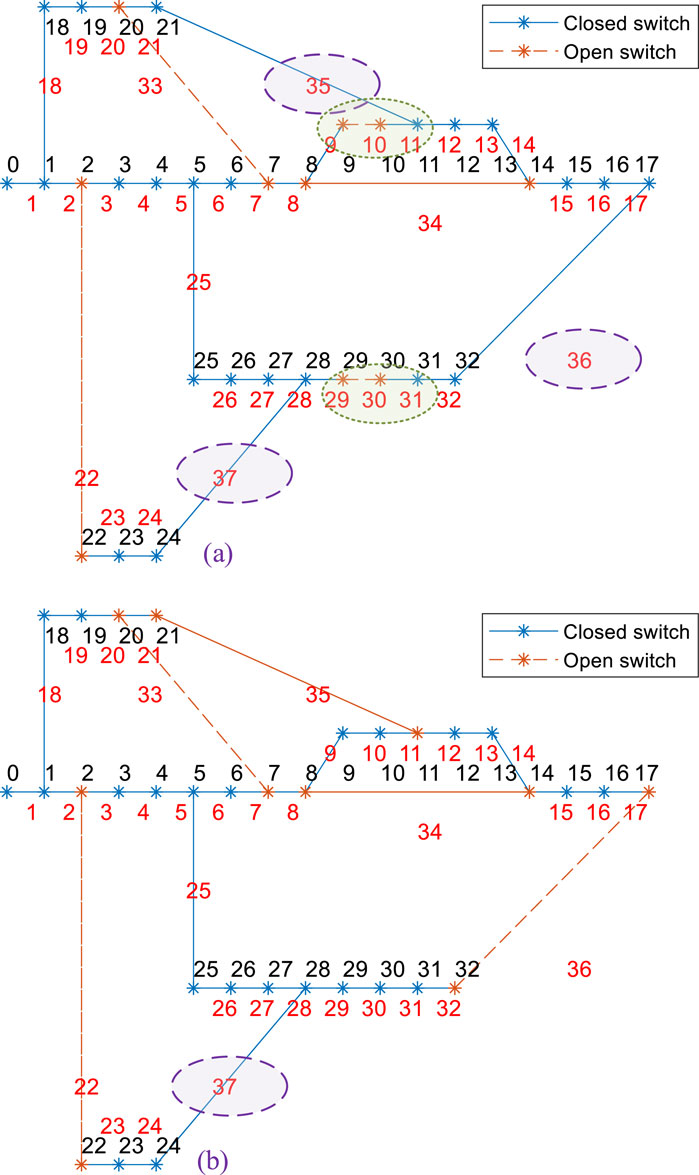
Figure 6. Optimization reconfiguration results after branch 22 fault. (a) Optimized reconstruction scheme 1. (b) Optimized reconstruction scheme 1.
However, it should be noted that Figure 6 presents two optimized reconfiguration schemes, which differ significantly. This is because in the generation of reconfiguration scheme 1, the given sub-objective function weight factors are:
In reconfiguration scheme 1, the highest priority is given to minimizing the number of switch operations, resulting in a network loss of 356 kW and only one switch operation. In reconfiguration scheme 2, the priority is given to minimizing network losses, leading to a network loss of 255 kW and five switch operations. It can be observed that compared to scheme 1, the network loss in scheme 2 is reduced by 39.61%, while the number of switch operations increases by 400%.
To verify the multi-objective optimization reconfiguration method for distribution networks considering wind and solar energy absorption capacity proposed in this paper, the node voltage quality can be optimized based on the wind and solar power resources connected to each node in the distribution network, thereby enhancing the absorption capacity of wind and solar resources. In this section, wind and solar power systems of equal capacity are connected to nodes 10, 11, 12, 13, and 14 of the distribution network shown in Figure 5. The weight factors for the wind and solar power system capacity share in the objective function F1F_1F1 for nodes 10, 11, 12, 13, and 14 are set as:
Below, the distribution network fault is simulated by disconnecting the line switch of branch 25, causing the load at nodes 25, 26, 27, 28, 29, 30, 31, and 32 to be cut off.
The results of the network reconfiguration are shown in Figure 7, where both reconfiguration schemes successfully restore the load supply at nodes 25, 26, 27, 28, 29, 30, 31, and 32. To observe the optimization effect on the voltage quality of the nodes connected with wind and solar resources through control variables, in reconfiguration scheme 1, the weight factors for the sub-objective functions are set as:
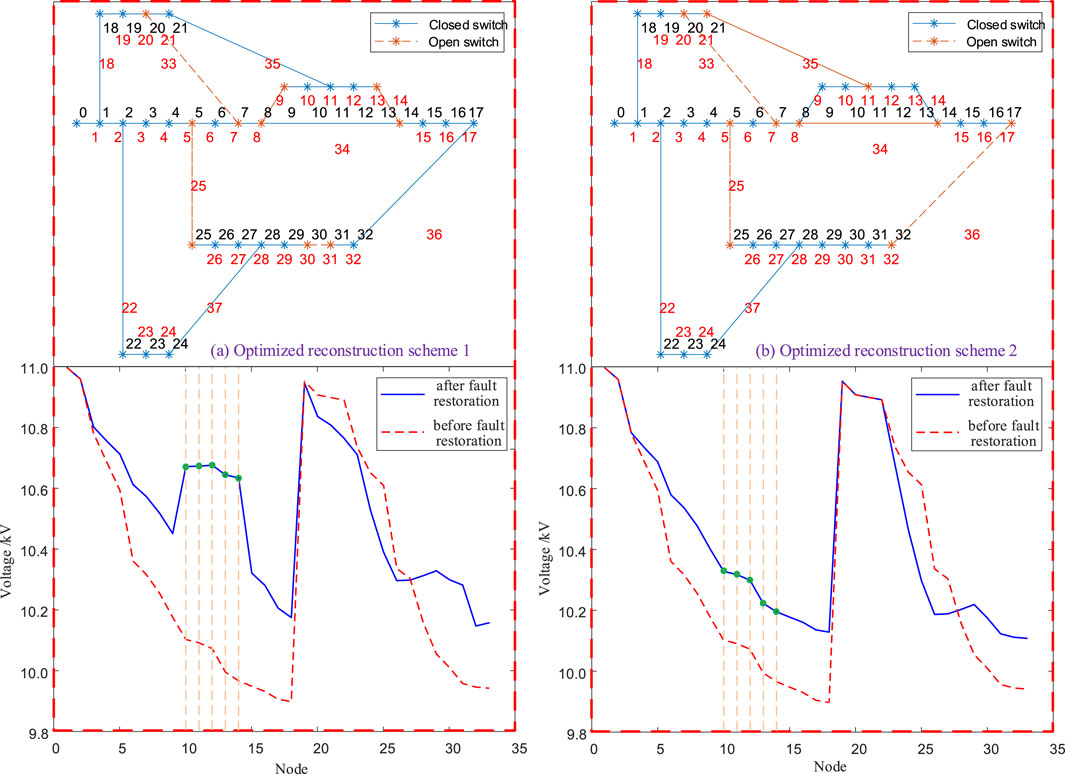
Figure 7. Wind-Solar Power Generation System Integration: Fault Optimization and Reconfiguration Results for Branch 25. (a) Optimized reconstruction scheme 1. (b) Optimized reconstruction scheme 1.
To demonstrate the optimization effect on node voltage quality, Figure 7 presents the voltage conditions of each node in the distribution network after each reconfiguration scheme. It can be observed that in reconfiguration scheme 2, compared to scheme 1, the voltages of nodes 10, 11, 12, 13, and 14, where wind and solar generation resources are connected, have significantly decreased and are now closer to the system’s rated voltage. This indicates that before the node voltages reach the upper limit, the wind and solar generation systems have more output capacity, meaning the wind and solar consumption capability is stronger.
6 Conclusion
This paper first analyzes the impact of steady-state circulating currents and closing-loop inrush currents generated by tie-switch-based loop-closing methods on loop-closing branches in distribution network self-healing scenarios. Leveraging the dynamic compensation characteristics of AC FIDs, an inrush-current-free loop-closing method using FIDs is proposed, and the working principles of FID-based distribution network self-healing are elucidated. For distribution networks with wind and solar resources, constraints characterizing line power flow, nodal voltage, branch capacity, and network topology are established, forming a multi-objective optimization model for self-healing that considers renewable energy accommodation capacity. Case studies demonstrate the scheme’s effectiveness in enhancing renewable energy accommodation, yielding the following conclusions.
(1) The network reconfiguration scheme with minimal power losses reduces network losses by 39.61% compared to the scheme with minimal switching operations, while increasing switching operations by 400%, validating the effectiveness of optimized reconfiguration for self-healing;
(2) Nodes with wind/solar generation exhibit significant voltage reductions closer to the rated voltage. Prior to voltage limit violations, renewable generation systems achieve greater power output margins—indicating enhanced accommodation capacity—verifying the efficacy of the proposed multi-objective optimization method.
In the next phase of research, further exploration is still required regarding the application scenarios and control strategies of FID in distribution networks based on its voltage compensation characteristics and power flow regulation capabilities. Potential research directions include three-phase imbalance compensation, nodal voltage support, and harmonic suppression in distribution networks.
Data availability statement
The original contributions presented in the study are included in the article/supplementary material, further inquiries can be directed to the corresponding author.
Author contributions
XN: Conceptualization, Methodology, Writing – review and editing. YL: Data curation, Writing – review and editing. CD: Data curation, Writing – review and editing. YS: Formal Analysis, Writing – original draft, Writing – review and editing. ZW: Formal Analysis, Writing – original draft, Writing – review and editing.
Funding
The author(s) declare that financial support was received for the research and/or publication of this article. This research was funded by the Technology Project of State Grid Zhejiang Electric Power Research Institute technology projects grant number [5211DS24000N].
Acknowledgments
This article is grateful to State Grid Zhejiang Electric Power Co. Ltd. Project for funding.
Conflict of interest
Authors XN, YL, and CD were employed by State Grid Zhejiang Electric Power Research Institute.
The remaining authors declare that the research was conducted in the absence of any commercial or financial relationships that could be construed as a potential conflict of interest.
Generative AI statement
The author(s) declare that no Generative AI was used in the creation of this manuscript.
Publisher’s note
All claims expressed in this article are solely those of the authors and do not necessarily represent those of their affiliated organizations, or those of the publisher, the editors and the reviewers. Any product that may be evaluated in this article, or claim that may be made by its manufacturer, is not guaranteed or endorsed by the publisher.
References
Abdalla, O. H., Abdel-Salam, G., and Mostafa, A. A. A. (2021). “Optimal reconfiguration strategy for distribution networks with PV connected systems[C],” in Cired 2021 - the 26th international conference and exhibition on electricity distribution. Geneva, Switzerland, 1869–1873.
Abdalla, O. H., and Mostafa, A. (2022). Optimal number and locations of Smart RMUs for self-healing distribution networks. Int. Trans. Electr. Energy Syst. 2022, 1–14. doi:10.1155/2022/4819129
Alwash, S., Ibrahim, S., and Abed, A. (2023). Distribution system reconfiguration with Soft open point for power loss reduction in distribution systems based on hybrid water cycle algorithm. Energies 16 (1), 199. doi:10.3390/en16010199
Cai, H., Yuan, X., Xiong, W., Zheng, H., Xu, Y., Cai, Y., et al. (2022). Flexible interconnected distribution network with embedded DC system and its dynamic reconfiguration. Energies 15 (15), 5589. doi:10.3390/en15155589
Chen, Y., Wang, P., Chen, F., Zhang, M., and Shi, M. (2024). The application of distributed positioning technology in distribution network fault location. Electr. Equip. Econ. (02), 91–94. doi:10.3969/j.issn.1673-8845.2024.02.027
Deakin, M., Sarantakos, I., Greenwood, D., Bialek, J., Taylor, P. C., Ming, W., et al. (2022). Hybrid open points: an efficient tool for increasing network capacity in distribution systems. IEEE Trans. Power Deliv. 37 (2), 1340–1343. doi:10.1109/tpwrd.2021.3136772
Fuad, K., Hafezi, H., Kauhaniemi, K., and Laaksonen, H. (2020). Soft open point in distribution networks. IEEE Access 8, 210550–210565. doi:10.1109/access.2020.3039552
Gui, Y., Nainar, K., Bendtsen, J., Diewald, N., Iov, F., Yang, Y., et al. (2024). Voltage support with PV inverters in low-voltage distribution networks: an overview. IEEE J. Emerg. Sel. Top. Power Electron. 12 (2), 1503–1522. doi:10.1109/jestpe.2023.3280926,
Jian, J., Zhao, J., Ji, H., Bai, L., Xu, J., Li, P., et al. (2024). Supply restoration of data centers in flexible distribution networks with spatial-temporal regulation. IEEE Trans. Smart Grid 15 (1), 340–354. doi:10.1109/tsg.2023.3286844
Kabirifar, M., Fotuhi-Firuzabad, M., Moeini-Aghtaie, M., Pourghaderi, N., and Dehghanian, P. (2021). A bi-level framework for expansion planning in active power distribution networks. IEEE Trans. Power Syst. 37 (4), 2639–2654. doi:10.1109/tpwrs.2021.3130339
Li, C., Dai, Y., Wang, P., and Xia, S. (2023). Active and reactive power coordinated optimization of active distribution networks considering dynamic reconfiguration and SOP. IET Renew. Power Gener. 19, 1–12. doi:10.1049/rpg2.12814
Luo, Z., Sun, Y., Hang, Li, Xiao, Y., Liu, B., Wang, T., et al. (2023). Power management and coordinated control strategy of flexible interconnected AC/DC hybrid microgrid with back-to-back converters. Int. J. Circuit Theory Appl. 51 (11), 5173–5196. doi:10.1002/cta.3694
Qian, R., Yuan, X., Zou, X., Xiong, W., Zhang, D., Xu, Y., et al. (2024). SOP low voltage ride through control strategy based on characteristic impedance of feeder line. Guangdong Electr. Power 37 (06), 70–78. doi:10.3969/j.issn.1007-290X.2024.06.008
Tang, A., Lulu, M. A., Peng, Q., Jingen, S., Qian, C., Minyuan, G., et al. (2022a). Research on the harmonic currents rates for the exchanged energy of unified distributed power flow controller. IET Generation, Transm. & Distribution 17 (3), 530–538. doi:10.1049/gtd2.12741
Tang, A., Song, X., Shang, Y., Guo, G., Yu, M., and Zhan, X. (2024). Harmonic mitigation method and control strategy of offshore wind power system based on distributed power flow controller. Automation Electr. Power Syst. 48 (02), 20–28. doi:10.7500/AEPS20230113008
Tang, A., Yang, Y., Yang, H., Song, J., Qiu, P., Chen, Q., et al. (2023). Research on topology and control method of uninterrupted ice melting device based on non-contact coupling power flow controller. Proc. CSEE 43 (22), 8666–8674. doi:10.13334/j.0258-8013.pcsee.220221
Tang, A., Zhou, W., Song, J., Peng, Q., Qian, C., Xiaohui, Z., et al. (2022b). Optimal output power coordinated control strategy of distributed power flow controller. Int. J. Electr. Power Energy Syst. 140, 108075. doi:10.1016/j.ijepes.2022.108075
Xiaodong, L., Saaklayen, M., Igder, M, Shawon, S. M. R. H., Faried, S. O., and Janbakhsh, M. (2022). Planning and service restoration through microgrid formation and Soft open points for distribution network modernization: a review. IEEE Trans. Industry Appl. 58 (02), 1843–1857. doi:10.1109/tia.2022.3146103
Xinghai, W., Xin, L., Shikun, W., Yueru, W., and Yongchao, M. (2023). Research on multi-objective optimization and reconfiguration method of distribution network considering distributed generation access. Shandong Electr. Power 50 (11), 60–67. doi:10.20097/j.cnki.issn1007-9904.2023.11.008
Yang, Z., Min, H., Yang, F., Lei, Y., He, X., Sun, H., et al. (2024). A novel control strategy for Soft open point to address terminal voltage violations and load rate imbalance in low-voltage power distribution station areas. Sensors 24 (6), 1976. doi:10.3390/s24061976
Yifei, H., Feng, Q., Hailong, L., Shuang, L., and Qi, Z. (2024). Island fault recovery method of distribution network based on flexible interconnection device with energy storage. Distribution & Util. 41 (02), 21–27. doi:10.19421/j.cnki.1006-6357.2024.02.003
Yiyi, X., Haitao, L., Xiong, X., Yu, J., Yao, S., Hai, Z., et al. (2022). Key technologies and development modes of flexible interconnection of low-voltage distribution station area. Proc. CSEE 42 (11), 3986–4001. doi:10.13334/j.0258-8013.pcsee.210578
Yizhou, J., Liping, Z., Peng, W., Qifan, N., and Yiting, S. (2020). Application of improved GA in distribution network reconfiguration with DG. Transducer Microsyst. Technol. 39 (10), 153–156. doi:10.13873/J.1000-9787(2020)10-0153-04
Yutao, X., Qihui, F., Zhukui, T., Chao, Z., and Xufeng, Y. (2024). Optimal power restoration strategy for multi-terminal flexible interconnected distribution networks based on flexible interconnection device and network reconfiguration. Trans. China Electrotech. Soc. 39 (9), 1–13. doi:10.19595/j.cnki.1000-6753.tces.231927
Zhang, G., Yuan, X., Xiong, W., Feng, Q., and Zhao, Y. (2023). Research on power supply recovery control technology of distribution network embedding with DC links. Int. J. Electr. Power & Energy Syst. 152, 109265. doi:10.1016/j.ijepes.2023.109265
Zhang, J., Xiang, W., Luo, G., Zhu, B., Xie, D., and Jiao, T. (2018). Solution and its key issue analysis for load transfer without power interruption of distribution lines with 30°Phase angle difference. Automation Electr. Power Syst. 42 (01), 74–81. doi:10.7500/AEPS20170425001
Zhang, Y., Ziwen, L., and Fengqiang, D. (2020). Review on research status and development of flexible interconnected distribution networks. Guangdong Electr. Power 33 (12), 3–13. doi:10.3969/j.issn.1007-290X.2020.012.001
Zhao, Y., Xiong, W., Yuan, X., and Zou, X. (2022). A fault recovery strategy of flexible interconnected distribution network with SOP flexible closed-loop operation. Int. J. Electr. Power & Energy Syst. 142 (Part B), 108360. doi:10.1016/j.ijepes.2022.108360
Zhi, X. U., Tang, J., Jiang, Y., Qin, R., Ma, H., Yang, Y., et al. (2022). Analysis of fault characteristics of distribution network with PST loop closing device under small current grounding system. Energies 15 (7), 2307. doi:10.3390/en15072307
Zhou, N., Gu, F., Lei, C., Yao, Y., and Wang, Q. (2020). A Power Transfer optimization model of active distribution networks in consideration of loop closing current constraints. Trans. China Electrotech. Soc. 35 (15), 3281–3291. doi:10.19595/j.cnki.1000-6753.tces.190909
Keywords: AC flexible interconnection device, self-healing, non-impact ring closure, multiobjective optimization, wind and solar energy consumption
Citation: Ni X, Lu Y, Ding C, Shang Y and Wang Z (2025) Self-healing strategy for distribution networks with AC flexible interconnection devices. Front. Energy Res. 13:1572606. doi: 10.3389/fenrg.2025.1572606
Received: 07 February 2025; Accepted: 24 July 2025;
Published: 22 August 2025.
Edited by:
Sudhakar Babu Thanikanti, Chaitanya Bharathi Institute of Technology, IndiaReviewed by:
Jianzhong Xu, North China Electric Power University, ChinaOmar Abdalla, Helwan University, Egypt
Copyright © 2025 Ni, Lu, Ding, Shang and Wang. This is an open-access article distributed under the terms of the Creative Commons Attribution License (CC BY). The use, distribution or reproduction in other forums is permitted, provided the original author(s) and the copyright owner(s) are credited and that the original publication in this journal is cited, in accordance with accepted academic practice. No use, distribution or reproduction is permitted which does not comply with these terms.
*Correspondence: Zihan Wang, MTUwNTE2MzU3N0BxcS5jb20=
 Xiaojun Ni1
 Yufei Shang
 Zihan Wang