 Jifan Zhang1
 Xiaoliang Li
- 1State Grid Jiangsu Electric Power Company Limited Suqian Power Supply Branch, Suqian, Jiangsu, China
- 2State Grid Shanghai Energy Internet Research Institute Company Limited, Shanghai, China
The deepening of rural revitalization has diversified the development of rural economic industries and led to the rapid growth of energy demand. However, the infrastructure of the rural distribution network is relatively weak, and voltage fluctuations are becoming increasingly severe, posing huge challenges to the operational safety and stability of the distribution network. This study presents an active-reactive coordinated voltage regulation strategy for a rural distribution network with large-scale aquaculture activity by considering approaches that include distributed energy generation, energy storage, static var generators, and demand response (DR) of the aquaculture load. The proposed approach involves construction of a DR model for aquaculture equipment based on energy demand and operational characteristics. Accordingly, a voltage regulation optimization model is established with the goal of minimizing voltage fluctuations at the nodes of the distribution network by solving the weighted mean of vectors algorithm. Finally, a case study is used to verify the effectiveness of the proposed voltage regulation strategy, which is of great significance for promoting the development of rural distribution networks and economic industries.
1 Introduction
Significant progress has been made in rural economic development under the active guidance of the rural revitalization strategy in China (Zhang et al., 2023a, 2023b). However, the rural distribution network, as an important link connecting the power grid with thousands of households, has failed to keep up with the rapid developments in infrastructure construction, becoming a key factor restricting the improvement of power quality and enhancement of power supply reliability (Yang et al., 2024; Lei et al., 2024). With the rapid development of rural economic industries, there has been an unprecedented growth trend in energy demand. In particular, given the acceleration of agricultural modernization, extensive use of high-energy-consuming equipment such as large agricultural machinery and agricultural product processing facilities has led to a sharp increase in rural energy consumption, imposing higher requirements on the carrying capacity and stability of the distribution network (Štumbrger et al., 2021; Jia et al., 2021). Among these challenges, voltage deviation remains the most critical and widespread issue in rural distribution networks.
In recent years, research on voltage issues in the rural distribution network has produced rich results (Lei et al., 2024b; Pan et al., 2018). Bhatt (2022) proposed an optimal operation strategy for a photovoltaic-integrated rural distribution network to solve the problem of voltage variation under constraints caused by the node voltage, conductor thermal load, and transformer tap. Silveira et al. (2024) focused on minimizing voltage unbalance by integrating impedance elements in specific areas of the rural distribution network and proposed a novel interline compensation method based on the network parameters as well as determination of the optimal compensation through precise calculations. Marchesan et al. (2022) focused on three-phase two-wire rural distribution systems and proposed a method to alleviate voltage unbalance by determining the appropriate spacing of overhead conductors, thereby eliminating the need for additional reactive power compensation devices and reducing the installation time and cost. Zhang et al. (2023c) designed a profit strategy utilizing blockchain technology to determine an optimal energy pricing model; this model accounts for the network topology, load fluctuations, and reputation values of the consumers within agricultural parks. The proposed method effectively mitigates the photovoltaic consumption problem while adhering to appropriate voltage limits, thereby enhancing the overall benefits of photovoltaic generation and the consumers in the rural distribution network.
In addition to the solutions reported in the abovementioned studies concerning voltage issues in distribution networks, the introduction of demand response (DR) technology to voltage regulation has been shown to produce excellent results (Ahmed et al., 2024; Dong et al., 2025; Zhang et al., 2025). By guiding users to reduce their demand of flexible loads during peak energy consumption periods, the supply pressure on the distribution network can be alleviated to improve issues such as voltage drop and fluctuations (Xu et al., 2022). For example, Tao et al. (2023) constructed a voltage coordination optimization model by considering DR and stepped carbon trading to address the issue of voltage exceeding due to high-proportion distributed energy integration into the distribution network; the model was then solved via convex optimization using second-order cone programming. Gu and Huang (2023) designed a reinforcement learning framework based on an improved partially observable Markov decision process that combines confidence intervals for precise voltage-state perception and asynchronous learning with a shared data buffer; simulations based on real operational data demonstrated that this method could achieve significant voltage optimization and fast convergence. Rahman et al. (2022) proposed a dynamic fair incentive mechanism to coordinate a large number of DR participants for managing node voltages in a medium-voltage distribution network; this method was shown to reduce network power losses and reactive power from distributed generation, thereby effectively managing the voltages in the medium-voltage distribution network.
Although some studies have demonstrated that DR plays a significant role in the voltage regulation of a distribution network, the applications of DR for voltage regulation in rural distribution networks remain limited. The main reason for this is that the load demands in rural distribution networks are widely distributed such that the individual DR ability is weak, leading to high implementation difficulty and less-effective results for DR to participate in voltage regulation. However, given the large-scale development of rural economic industries, concentrated industrial loads characterized by high load demand and strong elasticity can further leverage the role of DR in voltage regulation of the rural distribution network. As a key area of modern agricultural progress, large-scale aquaculture has significantly increased rural incomes and promoted optimization of the rural industrial structure (Zhao, 2024; Jiang et al., 2024; Shahbaz et al., 2023). Large-scale aquaculture is affected by various factors, such as water temperature, water quality, and oxygen content (Wu et al., 2022). There are frequent needs for automatic feeding machines, oxygen-increasing machines, and water quality control equipment to increase aquaculture production. Aquaculture greenhouses need to be built to accommodate aquatic organisms with high water-temperature requirements. With the expansion of the scale of aquaculture, such equipment will generate huge energy demands, which will also affect the flow of the distribution network considerably and lead to voltage problems (Hashemi et al., 2024). Therefore, research on voltage regulation in a rural distribution network with large-scale aquaculture connections is of great significance for improving the operational safety and stability of the network. However, there are no relevant research reports on the impacts of large-scale aquaculture on the distribution network voltage and its solutions. Accordingly, we propose an active-reactive coordinated voltage regulation strategy to address the voltage fluctuations caused by large-scale aquaculture loads. To reduce the influence of aquaculture on the distribution network, aquaculture DR is used in voltage regulation by considering that the load demand of the aquaculture equipment has a certain degree of elasticity. Table 1 shows the comparison results of the approach proposed in this study with recent works. The main contributions of this study are as follows:
(1) An active-reactive coordinated voltage regulation framework is proposed for a rural distribution network by synergistically integrating aquaculture DR, distributed energy generation (DEG), energy storage, and static var generators (SVGs). In particular, the framework addresses voltage fluctuations caused by large-scale aquaculture loads via scheduling the energy demands of these loads, thereby achieving the effect of “the person tying the bell should untie it.”
(2) A DR model is constructed for aquaculture equipment for participation in voltage regulation by classifying the equipment into shiftable and interruptible loads. To ensure minimal impacts on aquatic organisms, the model for shiftable loads allows adjustment of the operational timings (e.g., shifting the feeding or water exchange periods to off-peak hours) while maintaining the key operational parameters (e.g., feeding frequency, water exchange volume), and the model for interruptible loads permits short-term load curtailment (e.g., temporary shutdown of the oxygen-increasing machine when the oxygen content in the water is sufficient) under strict constraints of water temperature and oxygen content.
(3) An optimization objective function is designed with the goal of minimizing the voltage fluctuations at the nodes of the distribution network. To determine the optimal regulation strategy, the weighted mean of vectors (INFO) algorithm is introduced using a mean-based vector update rule combined with a convergence acceleration mechanism. The algorithm adjusts the search direction dynamically through weighted mean vectors and accelerates convergence by incorporating the difference between the current optimal solution and random solutions to significantly improve the solution efficiency.
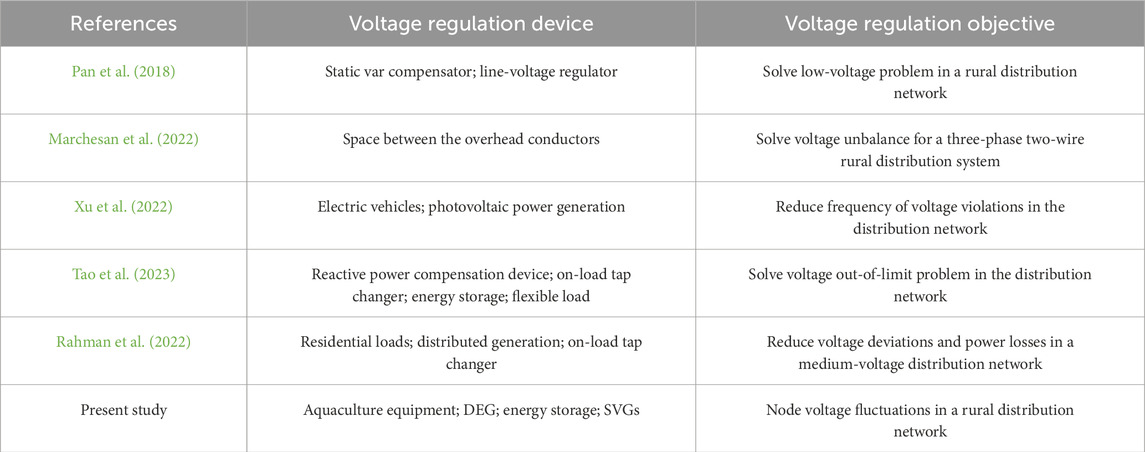
Table 1. Comparison results of the proposed approach with recent works.
The remainder of this paper is organized as follows. The voltage regulation framework is proposed in Section 2. The energy consumption and DR models of the aquaculture equipment are described in Section 3. The voltage regulation strategy of the rural distribution network is formulated in Section 4. A case study is presented in Section 5. Lastly, the conclusions of this work are presented in Section 6.
2 Voltage regulation framework for a rural distribution network
In the proposed scenario, we mainly focus on voltage regulation in a rural distribution network when a large-scale aquaculture system is connected to the network. Accordingly, an active–reactive coordinated voltage regulation framework is proposed, as shown in Figure 1. To ensure adequate voltage regulation performance, the framework integrates DEG, energy storage, SVGs, and DR of large-scale aquaculture. In particular, for DR of large-scale aquaculture, we consider the operational characteristics of the aquaculture equipment and establish energy consumption models to quantify their active and reactive power demands by accounting for factors such as feeding frequency, water quality parameters, and thermal balance in the greenhouses. Subsequently, the DR models are formulated by categorizing these loads into shiftable and interruptible loads. The corresponding constraints for each type of load are set to ensure that the load DR adjustments minimally impact aquatic growth while enabling participation in voltage regulation.
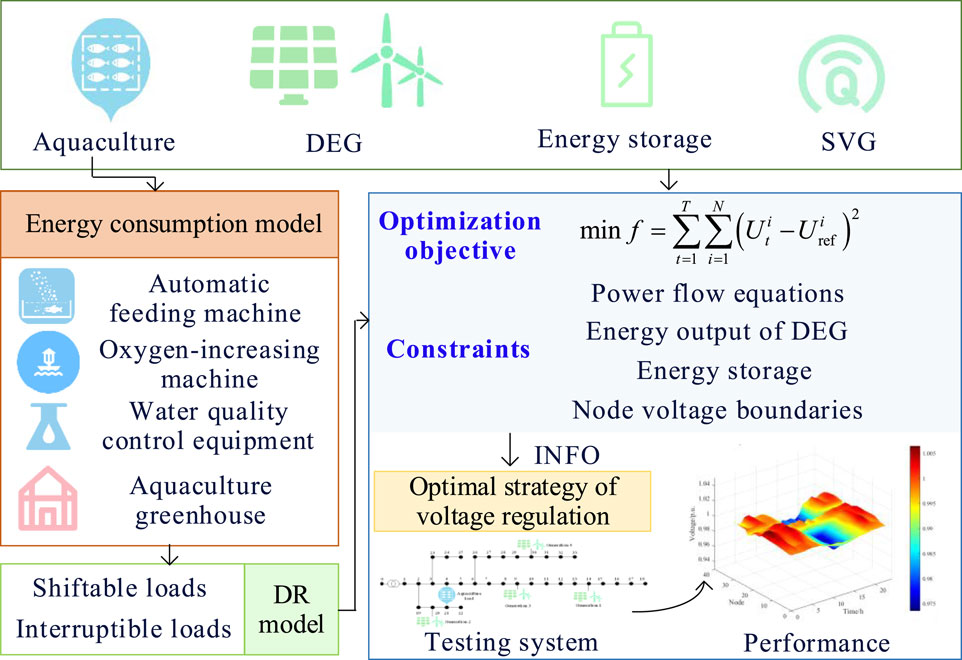
Figure 1. Active–reactive coordinated voltage regulation framework for a rural distribution network.
In terms of the voltage regulation strategy, the optimization model is developed with the objective of minimizing node voltage fluctuations by integrating contributions from DEG, SVGs, and aquaculture DR, among others. To guarantee the feasibility of the optimal strategy, the constraints are considered from the physical operational level of the actual system, including the power flow equations, DEG output, and node voltage boundaries. Based on the optimization model, the optimal strategy for voltage regulation is searched using the INFO algorithm that ensures fast convergence to the global optimal solution.
3 Energy consumption and DR models of the aquaculture equipment
3.1 Energy consumption models of the aquaculture equipment
Based on the living habits of aquatic organisms and operating characteristics of aquaculture equipment, the energy consumption models of the following equipment are constructed.
3.1.1 Automatic feeding machine
For a large-scale aquaculture pond, an automatic feeding machine is an essential mechanical equipment that ensures biological timing and quantitative feed delivery in aquaculture. The energy consumption of the automatic feeding machine depends on the feeding frequency and feeding area, among others. The active and reactive power demands of the automatic feeding machine can be expressed as Equation 1.
where
3.1.2 Oxygen-increasing machine
The oxygen-increasing machine is mainly used to enhance the oxygen content in the water, and its energy consumption is affected by various factors, such as the density of culture organisms, aquaculture season, and weather changes. The active and reactive power demands of the oxygen-increasing machine can be expressed as Equation 2.
where
3.1.3 Water quality control equipment
Water quality control equipment are useful for improving the water quality while avoiding large-scale death of the culture organisms owing to water pollution. The energy consumed by such equipment is mainly affected by the water area and water exchange volume. The active and reactive power demands of the water quality control equipment can be expressed as Equation 3.
where
3.1.4 Aquaculture greenhouse
Aquatic organisms that are sensitive to water temperature often require an aquaculture greenhouse that maintains the water within an optimal thermal range. The heating system in this greenhouse has high energy consumption, primarily to compensate for the heat lost from the water. The sources and losses of heat in the water mainly include convective heat exchange between the indoor air and water, heat conduction between the water and soil, thermal radiation from the sun to the water, and heat provided by the heating system. Figure 2 illustrates the heat exchange processes within the greenhouse.

Figure 2. Heat exchange processes in the greenhouse.
Based on the heat exchange process shown in Figure 2, the thermal balance constraint of the water in the greenhouse can be expressed as Equation 4.
where
where
where
3.2 DR models of the aquaculture equipment
To enhance the voltage regulation of the distribution network, aquaculture equipment can participate in regulation given their flexible energy consumption demand characteristics. Generally, DR resources can be classified into shiftable and interruptible loads based on the operational characteristics of the loads (Zhou et al., 2024; Liu et al., 2022). Considering that the automatic feeding machine and water quality control equipment do not operate continuously, shifting their operations over relatively lengthy time periods does not significantly impact aquaculture organisms; thus, these equipment can be categorized as shiftable loads. In contrast, although shifting the operations of the oxygen-increasing machine and greenhouse heating system may have substantial effects on the dissolved oxygen content and water temperature, intermittent energy supply would have relatively minor short-term impacts on the water temperature and oxygen content; hence, these equipment can be classified as interruptible loads. To enable the participation of aquaculture equipment in DR while reducing the impacts on aquaculture organisms, the operations of the shiftable and interruptible equipment must adhere to the following constraints.
3.2.1 Shiftable loads
Automatic feeding machines require the feeding frequency to remain unaffected during load shifting to maintain the feed supply for aquaculture organisms. For water quality control equipment, the total water exchange volume should be maintained constant, requiring only adjustment of the timing of water exchange. Therefore, the energy consumption demands of automatic feeding machines and water quality control equipment participating in DR must satisfy Equation 7.
where
3.2.2 Interruptible loads
With regard to the interruptible loads participating in DR, the oxygen-increasing machines must operate intermittently to ensure that the oxygen content in the water remains within the range required by aquatic organisms. Furthermore, the heating systems in aquaculture greenhouses require that the water temperatures be maintained within ranges suitable for the survival of aquatic organisms. For the oxygen-increasing machine, the constraints for participation in DR can be expressed as Equation 8.
where
For the heating system in the greenhouse, the constraints for participation in DR can be expressed as Equation 9.
where
4 Voltage regulation of the rural distribution network
4.1 Optimization model for voltage regulation
Large-scale aquaculture equipment connected to a rural distribution network can further exacerbate the low-voltage problem of the network. Therefore, we propose an active–reactive coordinated voltage regulation strategy for such rural distribution networks with large-scale aquaculture activities by arranging the joint participation of DEG, energy storage, SVGs, and DR of the aquaculture equipment. To minimize the node voltage fluctuations while ensuring stable operation and power quality of the distribution network, the optimal model is as Equation 10:
where
4.2 Constraint model for voltage regulation
4.2.1 Constraints of the power flow equations
Constraints of the power flow equations can be expressed as Equation 11.
where
4.2.2 Constraints of load demand
Constraints of load demand can be expressed as Equation 12.
where
4.2.3 Constraints of DEG
Constraints of DEG can be expressed as in Equation 13.
where
4.2.4 Constraint of the SVG
Constraint of the SVG can be expressed as in Equation 14.
where
4.2.5 Constraints of energy storage
Constraints of energy storage can be expressed as in Equations 15, 16.
where
4.2.6 Constraint of the node voltage
Constraint of the node voltage can be expressed as in Equation 17.
where
4.3 Optimization algorithm for voltage regulation
To efficiently solve the optimization objective given by Eq. (10), we propose an active–reactive coordinated voltage regulation strategy for a rural distribution network based on the vector-weighted average optimization or INFO algorithm. The INFO algorithm employs a mean-based rule to update the vector positions and incorporates a convergence acceleration mechanism to enhance the global search capabilities (Zhang and Xiao, 2024; Feda et al., 2024). The INFO algorithm continuously updates the positions of the vectors through three phases, namely, the rule updating, vector merging, and local search phases, to determine the optimal solution. The detailed implementation steps for the optimization problem are presented in Figure 3.
(1)In the rule updating phase, the mean-based rule and convergence acceleration sections are used to calculate the position of the new vector. That is Equation 18.
where
where
(2)In the vector merging phase, the two vectors calculated in the previous step are combined with the conditional vector to generate a new vector. After the rule updating phase, the vectors
where μ is a small positive number used to adjust the stride of the merged vector; rand1 and rand2 are two random numbers used to determine the merging of the vectors.
(3)In the local search phase, the search is conducted using the position vector of the current optimal solution to find a better solution. The specific method of local search involves addition of a small random number or weight factor to the position vector of the current optimal solution and multiplying the sum by a search direction vector as Equation 23.
where
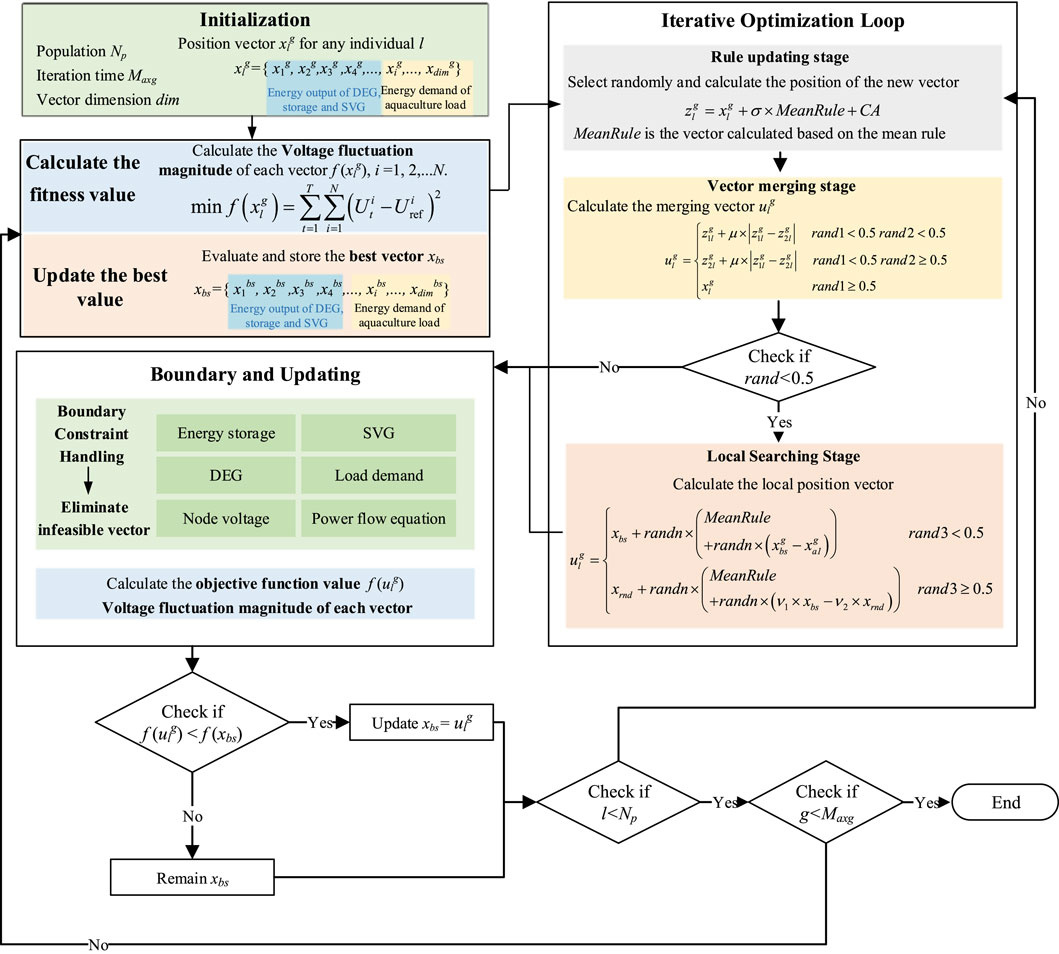
Figure 3. Detailed implementation steps for the formulated optimization problem.
5 Case study
Herein, we present a case study to show the performance of the proposed voltage regulation strategy for the rural distribution network.
5.1 Simulation parameters
The IEEE 33-node system was considered the rural distribution network in this case study, as shown in Figure 4. The rated voltage of the distribution network was 12.66 kV, total load was 3715 kW + j2300 kvar, and the allowable range of node voltages was ±5% of the rated voltage. Distributed photovoltaic power generation systems were applied at nodes 9, 14, 20, and 30, with the rated capacity of each DEG being set as 250 kW. Furthermore, a large-scale aquaculture system was connected to the rural distribution network at node 4. The parameters of the INFO algorithm were set as follows: population Np = 50, iteration time Maxg = 1,000, dimension dim = 240, parameter
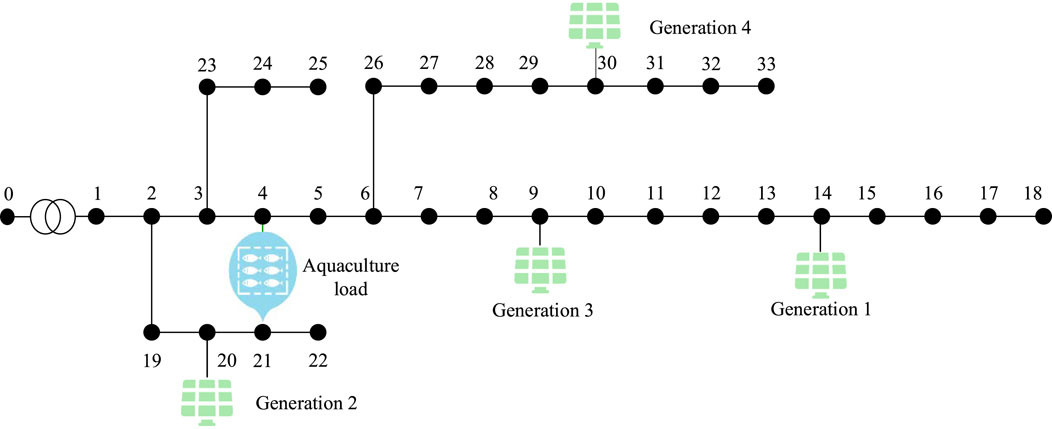
Figure 4. Rural distribution network based on the IEEE 33-node system.
The large-scale aquaculture system includes four main types of aquaculture equipment: automatic feeding machine, water quality control equipment, oxygen-increasing machine, and greenhouse heating system. Table 2 shows the energy consumption of the aquaculture equipment. The automatic feeding machines need to operate four times a day; the water quality control equipment should be turned on for no less than 8 h per day; the oxygen-increasing machines can be temporarily turned off when the oxygen content is sufficient; the greenhouse heating systems are operated such that shutdown is prohibited from 22:00 to 04:00 hours when the ambient temperature is low and the shutdown interval during other time periods shall not exceed 4 h continuously.
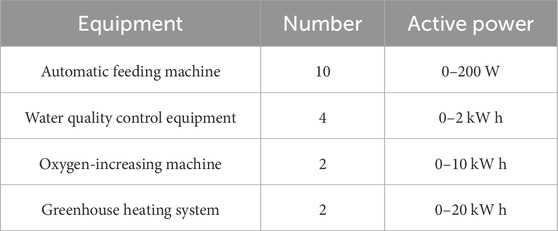
Table 2. Parameters of different equipment in the distribution network.
5.2 Optimal results from voltage regulation
Figures 5, 6 show the comparison results of the node voltages in the rural distribution network before and after optimization. It is observed that some of the node voltages are below the safe range prior to optimization, whereas the voltage magnitudes generally increase and remain within reasonable limits after optimization. Concretely, Figure 5 illustrates that the voltages remain consistently low owing to high load demand and insufficient reactive power compensation capacity. After 17:00, the output of the DEG system decreases gradually during the nighttime hours. Aquaculture equipment and other user loads cause significant voltage drops in the distribution network. These voltage drops are more pronounced at end nodes with longer feeder lines (i.e., 17, 18, and 33) and are far below the normal voltage fluctuation range of 0.95 p.u. However, the overall voltage magnitudes in the distribution network (Figure 6) increase after optimization of the aquaculture equipment, SVGs, etc. These results indicate that the volatility reduced relatively, waveform changes became smoother, and end-node voltages improved significantly. During low-voltage periods after 20:00, operation of the energy storage systems and SVGs can effectively mitigate voltage drops to maintain all the node voltages within the reasonable range of 0.95–1.05 p.u.
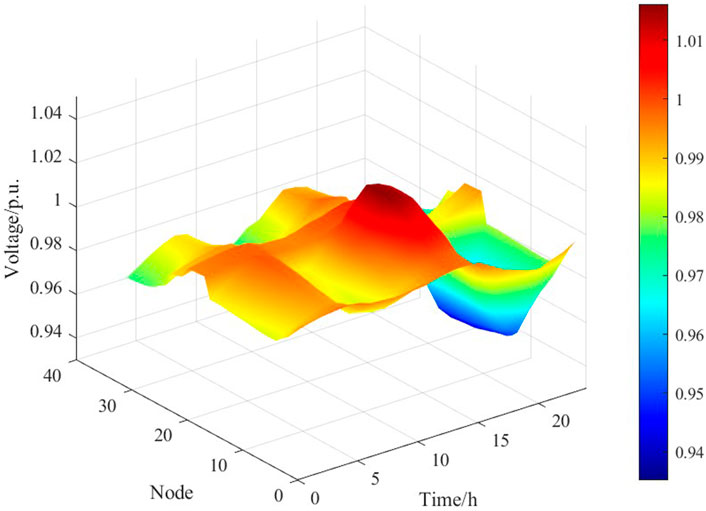
Figure 5. Voltage amplitude of each node before optimization.
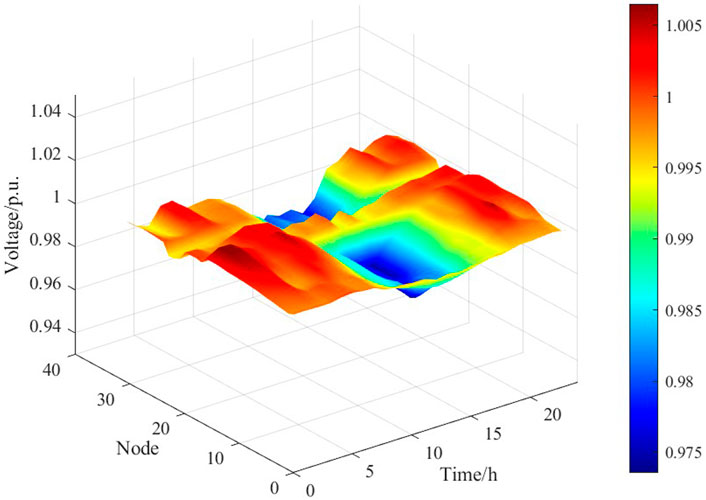
Figure 6. Voltage amplitude of each node after optimization.
The minimum voltage observed in the rural distribution network for a day is shown in Figure 7. Before regulation, the power supply pressure on the network intensifies during peak load periods with high demand, causing the minimum voltage of the system to drop to 0.93 p.u., which is below the safe range. After regulation, the minimum voltage increased to above 0.95 p.u., with the SVG providing reactive power compensation. Meanwhile, demand shifting of the water quality control equipment and automatic feeders combined with partial load reductions of the oxygen-increasing machine and greenhouse heating system was noted to alleviate the power supply pressure on the distribution network.
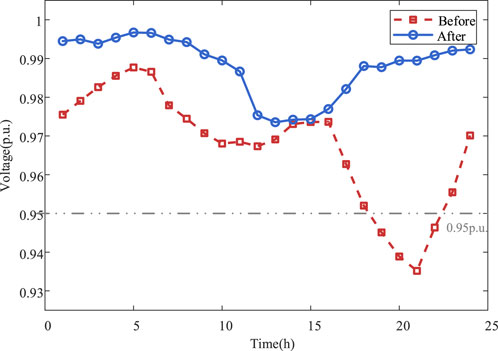
Figure 7. Minimum voltage of the rural distribution network observed over one day.
Figure 8 illustrates the energy demands of the automatic feeding machine and water quality control equipment. Before DR, the concentrated energy demands of the automatic feeding machine and water quality control equipment overlap with other user loads, resulting in peak loads. By adjusting the energy consumption of these equipment while meeting the operational requirements, the loads are shifted to low-load periods, thereby reducing the energy supply pressure during peak consumption periods and effectively mitigating low-voltage issues at the nodes.
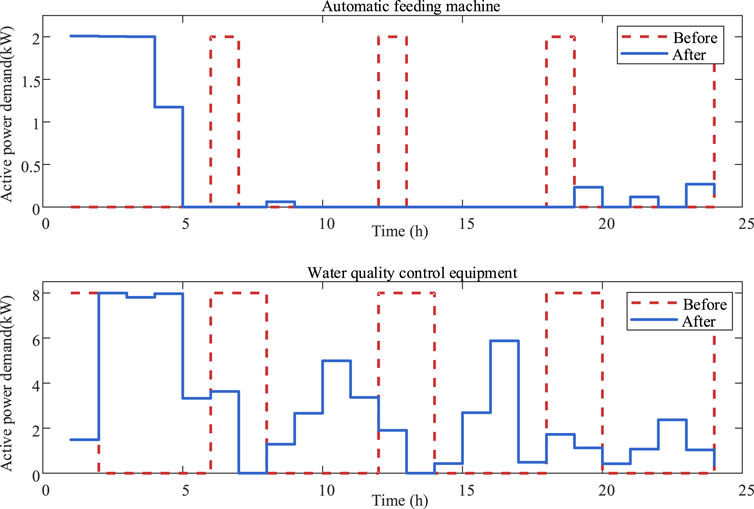
Figure 8. Energy demands of the automatic feeding machine and water quality control equipment.
Figure 9 compares the energy demands of the oxygen-increasing machine and greenhouse heating system before and after DR implementation. Before DR, the oxygen-increasing machines operate intermittently during periods of sufficient oxygen content in the water, reducing the load demand across time slots. However, during low-oxygen intervals (11:00–14:00), the machines operate at full power to maintain aquatic health. The greenhouse heating system participates in DR by intermittently shutting down or reducing its load demand during high daytime temperatures, thereby lowering the overall energy demand. Therefore, adjusting the operational states of the oxygen-increasing machine and greenhouse heating system can enhance the effectiveness of voltage regulation at the nodes of the distribution network.
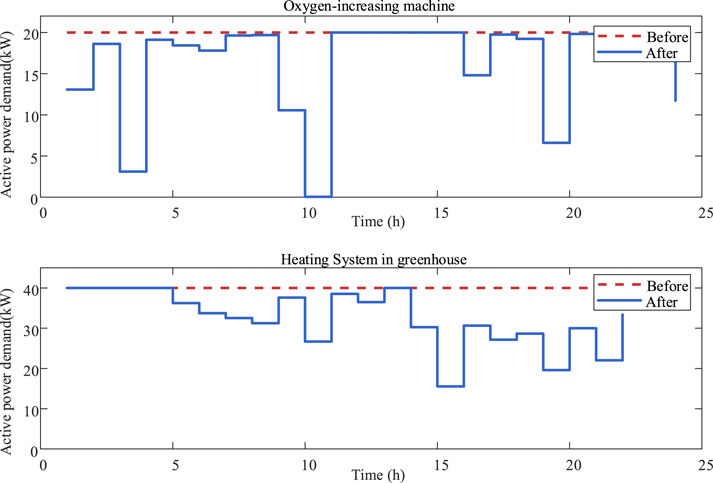
Figure 9. Energy demands of the oxygen-increasing machine and greenhouse heating equipment.
5.3 Analysis of the voltage regulation performance
To further verify the effectiveness of the proposed approach, we analyzed the voltage regulation effects under different scenarios, such as different penetration rates of the DEG system and different DR participation rates of the aquaculture load. Figure 10 shows the variation trends of the minimum voltage during daytime in the rural distribution network under different photovoltaic penetration rates (13.46%, 26.92%, 53.84%, and 67.29%). Here, the photovoltaic penetration rate was calculated using the ratio of the rated capacity of the photovoltaics to the total load. The results show that the minimum voltages of the system remained above 0.98 p.u. for different penetration rates and that there were no instances of voltages exceeding the limit. This indicates that the distribution network has strong DEG acceptance with the proposed voltage regulation strategy.
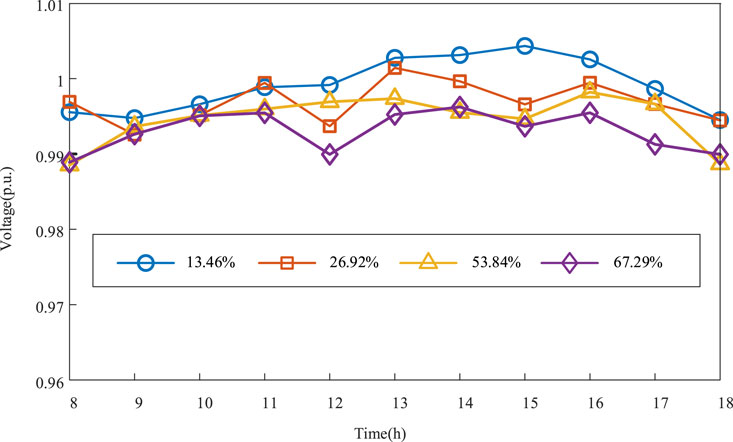
Figure 10. Minimum voltages of the rural distribution network under different penetration rates of DEG during daytime.
Figure 11 shows the voltage curves of node 4 over 1 day for scenarios with and without DR when the energy demand of the large-scale aquaculture system increases by a factor of two. It is observed that in the scenario without DR, although the proposed approach allows node voltage fluctuations within a reasonable range, the amplitude is relatively large during high load periods (from 17:00 to 22:00 in the evening) owing to the high energy demand of the large-scale aquaculture system and poor energy output of the DEG system. In the scenario with DR, the voltage fluctuations at node 4 tend to flatten significantly, showing better voltage regulation during high load periods. Compared to the scenario without DR, the voltage fluctuation rate at node 4 decreased by 41.89% with DR. This demonstrates that the DR mechanism can actively adjust energy demand on the load side, effectively reducing the peak fluctuations of the node voltage and improving voltage stability.
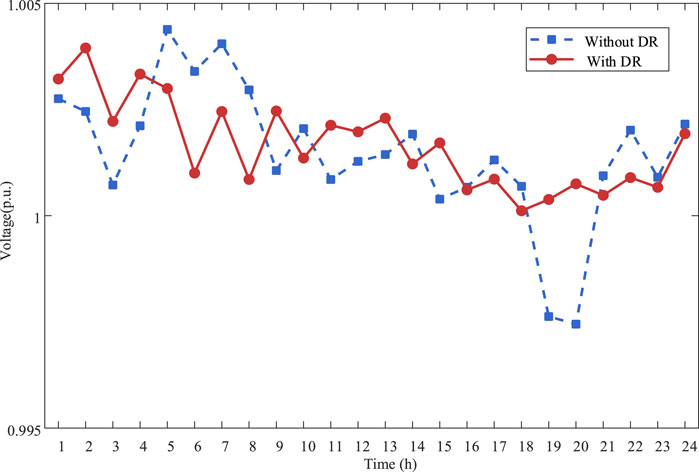
Figure 11. Voltages at node 4 over a day for scenarios with and without DR.
Figure 12 shows the minimum voltages of the distribution network for different DR participation rates of the aquaculture load (0%, 50%, and 100%). The results indicate that higher DR participation produces a higher minimum voltage value and lower fluctuations. Under the scenarios with 0% and 50% DR participation, the lowest voltages of the distribution network occur during periods with high energy demands of the large-scale aquaculture system and poor energy output of the DEG system. When 100% DR participation is considered, the energy demand of the aquaculture system reduces during the peak demand periods, increasing the minimum voltage of the distribution network. Therefore, DR participation of a large-scale aquaculture system has significant improvements on the voltage stability of the system.
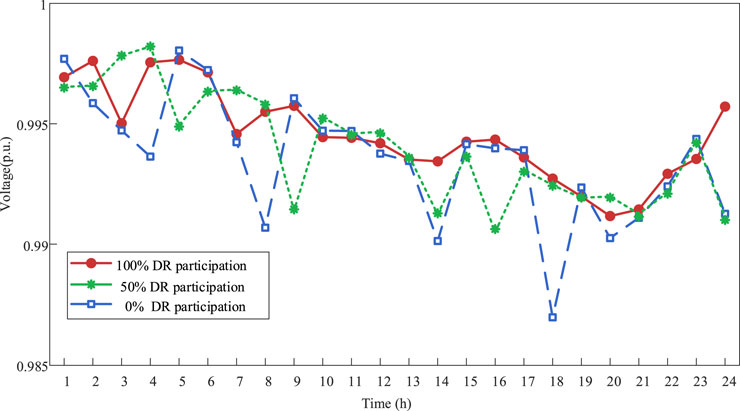
Figure 12. Minimum voltages of the distribution network under different DR participation rates.
5.4 Optimization performance of the INFO algorithm
To verify the effectiveness of the INFO algorithm, exponential triangulation optimization (ETO) and particle swarm optimization (PSO) algorithms were introduced for comparative analyses. Figure 13 shows the convergence speeds of the three algorithms during optimization. It can be observed that INFO has the fastest convergence followed by ETO, while PSO has the slowest convergence. Given the expertise of the INFO approach in local search within a small range, its rapid convergence makes it more suitable for quickly finding the optimal solutions in complex optimization problems. Table 3 presents the optimal solutions of the three algorithms. The results demonstrate that the INFO algorithm reaches an optimal value of 0.00809 p.u. with the minimum number of iterations; further, it quickly converges to the global optimal solution and maintains stability during the initial search phase. However, the ETO algorithm shows a stable downward trend during the iterations and has strong global search ability. The PSO algorithm has the slowest convergence, low initial search efficiency, and tendency to converge to a local optimal solution.
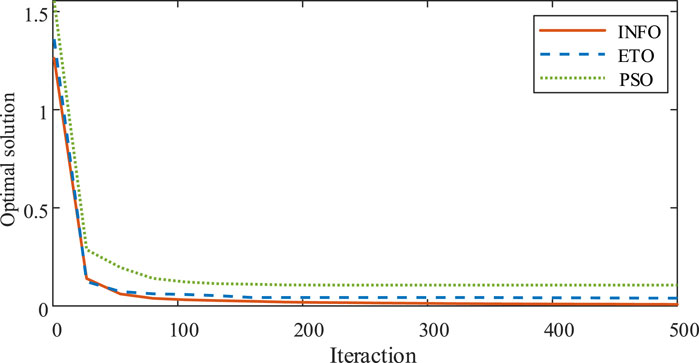
Figure 13. Convergence speeds of various algorithms.
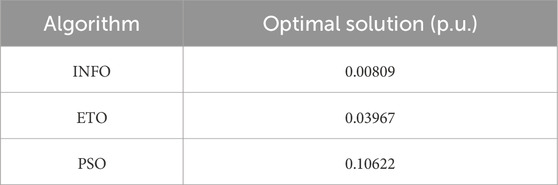
Table 3. Optimal solutions obtained using various algorithms.
Figure 14 shows the minimum and maximum average voltages of the rural distribution network after voltage regulation using the above three algorithms. It is seen that there are significant differences in the voltage control capabilities of the different optimization algorithms. The voltage curve of the PSO algorithm has the largest fluctuation range. During the peak load period from 10:00 to 17:00 hours, the voltage fluctuation amplitude intensifies; the maximum voltage of the PSO algorithm fluctuates around 1.045 p.u. Compared with the PSO algorithm, the minimum and maximum voltage curves of the ETO algorithm fluctuate to a slightly lower extent. However, compared with the INFO algorithm, the voltage control capabilities are relatively weak. The INFO algorithm shows significant advantages in smoothing voltage fluctuations; hence, it presents the smoothest trends for both the maximum and minimum average voltages, effectively solving the low-voltage problem at the end of the distribution network. This indicates that the INFO algorithm improves the overall voltage stability of the distribution network.
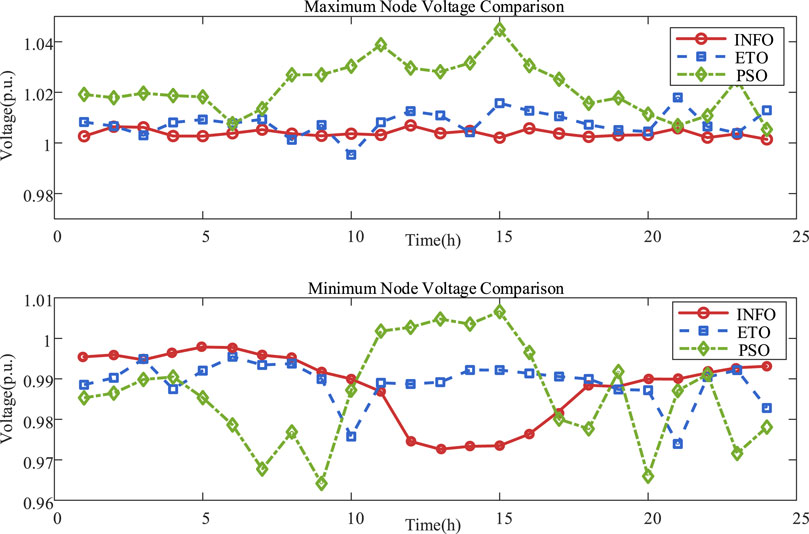
Figure 14. Average minimum (bottom) and maximum (top) voltages of the rural distribution network after voltage regulation.
To quantitatively analyze voltage control after regulation using the various algorithms, the mean and variance of voltage deviation as well as maximum and minimum voltage values are introduced for intuitive comparisons and interpretation, as shown in Table 4. From the table, it is observed that the INFO algorithm is optimal in terms of controlling voltage deviation, variance, and maximum and minimum voltage values. The relatively small voltage deviation and variance values indicate a low degree of voltage fluctuation. Moreover, both the maximum and minimum voltage values are within the stable operating range of the distribution network, suggesting that this algorithm effectively addresses the issue of voltage overlimit. Thus, the INFO algorithm effectively smooths voltage fluctuations to ensure better voltage stability during operation of the distribution network.
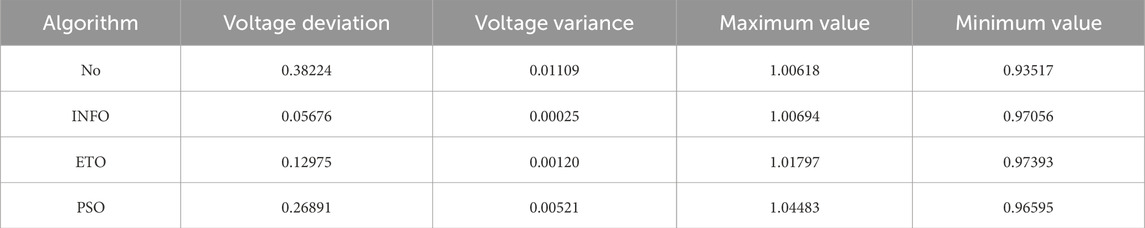
Table 4. Comparison of voltage characteristics under various algorithms.
6 Conclusion
This work presents an active-reactive coordinated voltage regulation strategy for a rural distribution network that supports large-scale aquaculture operations. By integrating various options for voltage regulation through DEG, energy storage, SVGs, and DR participation of the aquaculture equipment, the proposed approach aims to mitigate node voltage fluctuations while ensuring stable and reliable power supply. The optimized model was then designed to minimize node voltage fluctuations to ensure stable operation while maintaining power quality. Based on numerical simulations through a case study, the proposed approach is demonstrated to effectively improve voltage regulation of the rural distribution network by shifting or reducing the energy demands of the aquaculture equipment.
Data availability statement
The original contributions presented in this study are included in the article/Supplementary Material, and any further inquiries may be directed to the corresponding author.
Author contributions
JiZ: writing – original draft. WM: writing – original draft. TX: writing – review and editing. JuZ: writing – review and editing and writing – original draft. XL: writing – review and editing. DW: writing – review and editing.
Funding
The author(s) declare that financial support was received for the research and/or publication of this article. This work was financially supported by the Science and Technology Project of State Grid Jiangsu Electric Power Company Limited (contract no. J2024069).
Conflict of interest
Authors JiZ, WM, and TX were employed by the State Grid Jiangsu Electric Power Company Limited Suqian Power Supply Branch.
Authors JuZ, XL, and DW were employed by the State Grid Shanghai Energy Internet Research Institute Company Limited.
The remaining authors declare that the research was conducted in the absence of any commercial or financial relationships that could be construed as a potential conflict of interest.
The authors declare that this study received funding from State Grid Jiangsu Electric Power Company Limited. The funder had the following involvement in the study: study design, data collection and analysis, and the writing of this article.
Generative AI statement
The authors declare that no Generative AI was used in the creation of this manuscript.
Publisher’s note
All claims expressed in this article are solely those of the authors and do not necessarily represent those of their affiliated organizations, or those of the publisher, the editors and the reviewers. Any product that may be evaluated in this article, or claim that may be made by its manufacturer, is not guaranteed or endorsed by the publisher.
Supplementary material
The Supplementary Material for this article can be found online at: https://www.frontiersin.org/articles/10.3389/fenrg.2025.1597625/full#supplementary-material
References
Ahmadianfar, I., Heidari, A., and Noshadian, S. (2023). INFO: an efficient optimization algorithm based on weighted mean of vectors. Expert Systems with Applications 2022; 195: 116516. Appl. Energy 351, 121743. doi:10.1016/j.eswa.2022.116516
Ahmed, F., Arshad, A., Rehman, A., Alqahtani, M. H., and Mahmoud, K. (2024). Effective incentive based demand response with voltage support capability via reinforcement learning based multi-agent framework. Energy Rep. 12, 568–578. doi:10.1016/j.egyr.2024.06.036
Bhatt, P. (2022). Harmonics mitigated multi-objective energy optimization in PV integrated rural distribution network using modified TLBO algorithm. Renew. Energy Focus 40, 13–22. doi:10.1016/j.ref.2021.11.001
Dong, Y., Wang, J., Yang, Y., Guo, P., Xiao, C., Yu, C., et al. (2025). Two stage voltage coordination optimization of substation−feeder area considering demand response. Sustain. Energy Technol. Assessments 75, 104232. doi:10.1016/j.seta.2025.104232
Feda, A., Adegboye, O., Agyekum, E., Shuaibu Hassan, A., and Kamel, S. (2024). Carbon emission prediction through the harmonization of extreme learning machine and info algorithm. IEEE Access 12, 60310–60328. doi:10.1109/access.2024.3390408
Gatta, F., Geri, A., Maccioni, M., Palazzoli, A., and Sancioni, P. (2024). Low voltage electric distribution network planning with demand control. Electr. Power Syst. Res. 226, 109950. doi:10.1016/j.epsr.2023.109950
Gu, Y., and Huang, X. (2023). Demand response-based autonomous voltage control for transmission and active distribution networks using modified partially observed Markov decision process model. IET Generation Transm. Distribution 17 (23), 5155–5170. doi:10.1049/gtd2.13027
Hashemi, S., Darzi-Naftchali, A., Karandish, F., Ritzema, H., and Solaimani, K. (2024). Enhancing agricultural sustainability with water and crop management strategies in modern irrigation and drainage networks. Agric. Water Manage. 305, 109110. doi:10.1016/j.agwat.2024.109110
Jia, Y., Wen, P., Yan, Y., and Huo, L. (2021). Joint operation and transaction mode of rural multi microgrid and distribution network. IEEE Access 9, 14409–14421. doi:10.1109/access.2021.3050793
Jiang, D., Gao, H., He, S., Huang, Y., and Liu, J. (2024). A negative-carbon planning method for agricultural rural industrial park integrated energy system considering biomass energy and modern agricultural facilities. J. Clean. Prod. 479, 143837. doi:10.1016/j.jclepro.2024.143837
Lei, Z., Pei, Q., Lian, J., Song, J., and Zhang, Z. (2024). Research on optimal scheduling strategy of source-grid-load-storage in rural low-voltage distribution network. Archives Electr. Eng. 73 (3), 643–661. doi:10.24425/aee.2024.150888
Lei, Z., Xu, Q., and Hao, G. (2024b). Voltage coordination control strategy for low voltage distribution networks in western rural areas under photovoltaic storage access. Eng. Lett. 32 (7), 1412–1423.
Liu, X., Tang, D., and He, Q. (2022). A state-based potential game-theoretic approach for massive residential consumers participating in demand response. IEEE Syst. J. 17 (1), 1193–1203. doi:10.1109/jsyst.2022.3189727
Lv, Y., Dou, X., Zhang, C., Bu, Q., Lv, P., and Xu, X. (2024). Voltage regulation of low-voltage distribution network based on tube model predictive control with the robust positively invariant. Int. J. Electr. Power Energy Syst. 158, 109978. doi:10.1016/j.ijepes.2024.109978
Marchesan, G., de Lima Oliveira, A., Cardoso, G., Berlezi Ramos, D., Kraulich, L., Mazzorani, L., et al. (2022). Three-phase-two-wire rural distribution network: influence of design characteristics on voltage unbalance. IEEE Trans. Power Deliv. 38 (1), 620–630. doi:10.1109/tpwrd.2022.3196602
Ndawula, M., Djokic, S., Kisuule, M., Gu, C., and Hernando-Gil, I. (2024). A novel formulation of low voltage distribution network equivalents for reliability analysis. Sustain. Energy Grids Netw. 39, 101437. doi:10.1016/j.segan.2024.101437
Pan, J., Xiao, J., and Lin, Y. (2018). Low-voltage comprehensive management of rural distribution networks based on MSVC and line voltage regulator. J. Power Technol. 98 (3), 296–304.
Rahman, M., Arefi, A., Shafiullah, G., Hettiwatte, S., Azizivahed, A., Muyeen, S. M., et al. (2022). An incentivized and optimized dynamic mechanism for demand response for managing voltage in distribution networks. IEEE Access 10, 96359–96377. doi:10.1109/access.2022.3204618
Shahbaz, A., Ayaz, M., Bin Khalid, U., and Liaqat, L. (2023). Sustainable synthesis of silica nanoparticles from agricultural waste and its utilization in modern technology: a review. Energy Sources, Part A Recovery Util. Environ. Eff. 45 (1), 1464–1484. doi:10.1080/15567036.2023.2180552
Silveira, L., Martins, M., Kräulich, L., dos Santos, L., Cardoso, G., Oliveira, A., et al. (2024). A new approach for mitigating voltage unbalance in a three-phase two-wire rural distribution network. Electr. Power Syst. Res. 237, 111042. doi:10.1016/j.epsr.2024.111042
Štumbrger, G., Rošer, M., and Pintarič, M. (2021). Permanent closed-loop operation as a measure for improving power supply reliability in a rural medium voltage distribution network. Renew. Energy Power Qual. J. 19, 523–527. doi:10.24084/repqj19.335
Tao, C., Zhuo, Q., and Guo, X. (2023). Research on voltage coordinated control of active distribution network considering demand response. J. Appl. Sci. Eng. 26 (8), 1083–1094. doi:10.6180/jase.202308_26(8).0004
Wu, Y., Duan, Y., Wei, Y., and Liu, J. (2022). Application of intelligent and unmanned equipment in aquaculture: a review. Comput. Electron. Agric. 199, 107201. doi:10.1016/j.compag.2022.107201
Xu, L., Xie, Q., Zheng, L., Hua, Y., Shao, L., and Cui, J. (2022). Stackelberg-game-based demand response for voltage regulation in distribution network with high penetration of electric vehicles. Energies 15 (10), 3654. doi:10.3390/en15103654
Yang, C., Li, M., and Zhou, D. (2024). Energy assessment in rural regions of China with various scenarios: historical-to-futuristic. Energy 302, 131894. doi:10.1016/j.energy.2024.131894
Zhang, C., Wang, Z., and Xu, Y. (2023b). Application, planning, and techno-economic analysis of the multi-renewable energy complementary system in rural economic development zones: an empirical study in China. Environ. Sci. Pollut. Res. 30 (11), 31676–31695. doi:10.1007/s11356-022-24443-1
Zhang, J., Wu, H., Akbari, E., Bagherzadeh, L., and Pirouzi, S. (2025). Eco-power management system with operation and voltage security objectives of distribution system operator considering networked virtual power plants with electric vehicles parking lot and price-based demand response. Comput. Electr. Eng. 121, 109895. doi:10.1016/j.compeleceng.2024.109895
Zhang, Q., Qu, Y., and Zhan, L. (2023a). Great transition and new pattern: agriculture and rural area green development and its coordinated relationship with economic growth in China. J. Environ. Manage. 344, 118563. doi:10.1016/j.jenvman.2023.118563
Zhang, T., Yang, J., Jin, K., and Jing, T. (2023c). Local power consumption method of distributed photovoltaic generation in rural distribution network based on blockchain. IET Generation Transm. Distribution 17 (6), 1409–1418. doi:10.1049/gtd2.12748
Zhang, X., and Xiao, H. (2024). Enhancing speech emotion recognition with the improved weighted average support vector method. Biomed. Sig. Process. Control 93, 106140. doi:10.1016/j.bspc.2024.106140
Zhao, Y. (2024). Thinking about the strategy and practice path of modern agricultural industry development in the context of big data. Appl. Math. Nonlinear Sci. 9 (1), 18. doi:10.2478/amns.2023.1.00360
Zhou, X., Liu, X., Liu, H., Ji, Z., and Li, F. (2024). Optimal dispatching strategy for residential demand response considering load participation. Glob. Energy Interconnect. 7 (1), 38–47. doi:10.1016/j.gloei.2024.01.004
Glossary
DR Demand response
SVG Static var generator
t Any time period during a day
DEG Distributed energy generation
INFO Weighted mean of vectors
i Any node in the rural distribution network
Keywords: rural distribution network, aquaculture, voltage regulation, demand response, INFO algorithm
Citation: Zhang J, Mao W, Xia T, Zhuang J, Li X and Wang D (2025) Active–reactive coordinated voltage regulation for rural distribution network considering demand response of large-scale aquaculture. Front. Energy Res. 13:1597625. doi: 10.3389/fenrg.2025.1597625
Received: 21 March 2025; Accepted: 28 April 2025;
Published: 02 June 2025.
Edited by:
Yuechuan Tao, City University of Hong Kong, Hong Kong SAR, ChinaReviewed by:
Shuying Lai, The University of Sydney, AustraliaJiafeng Lin, The University of Sydney, Australia
Copyright © 2025 Zhang, Mao, Xia, Zhuang, Li and Wang. This is an open-access article distributed under the terms of the Creative Commons Attribution License (CC BY). The use, distribution or reproduction in other forums is permitted, provided the original author(s) and the copyright owner(s) are credited and that the original publication in this journal is cited, in accordance with accepted academic practice. No use, distribution or reproduction is permitted which does not comply with these terms.
*Correspondence: Xiaoliang Li, TGl4aWFvbGlhbmdfMjAyNEAxNjMuY29t