 Guilian Wu1,2
 Jinlin Liao
- 1Economic Technology Research Institute, State Grid Fujian Electric Power Co., Ltd., Fuzhou, China
- 2School of Electronic Information and Electrical Engineering, Shanghai Jiao Tong University, Shanghai, China
- 3State Grid Fujian Electric Power Co., Ltd., Fuzhou, China
The integration of distributed generations (DGs) and time-varying loads introduces significant uncertainties in distribution network planning. Existing methods often rely on simplified scenarios (e.g., typical days), which fail to capture the full temporal volatility of wind, solar, and load profiles. To address this challenge, this paper proposes a dual-layer planning framework integrating scenario reduction and multi-objective optimization. First, the AP-DTW-K-medoids method is used to reduce 500 wind–solar–load scenarios to six representative clusters, enhancing the Davies–Bouldin index (DBI) by 25.5% compared to traditional clustering. Second, a dual-layer model decouples investment decisions (upper layer) and operational dynamics (lower layer), enabling cost-effective DG and energy storage (ES) allocation. Third, an improved multi-objective particle swarm optimization (MOPSO) algorithm with adaptive inertia weights accelerates the convergence by 25%. Case studies on the IEEE-33-bus system demonstrate a 1.41% reduction in total costs and 7.87% lower voltage deviations compared to conventional methods. The proposed framework provides a scalable solution for uncertainty-aware distribution network planning.
1 Introduction
In recent years, smart grids have served as the focal point of power grid development (Xiao and Zhang, 2023; Guo et al., 2022; Zhu et al., 2021). The extensive access of wind turbines, photovoltaic (PV), and energy storage (ES) devices has introduced new vitality into the traditional distribution grid (Zhou et al., 2024). However, the grid connection of these high-penetration distributed power sources presents temporal characteristics (Louie and Miguel, 2012). In order to cope with their volatility, reasonable selection of the location and capacity of distributed power sources and energy storage devices has become a research hotspot (Ali et al., 2024).
At present, scholars at home and abroad have conducted many studies on distribution network planning. Saha et al. (2023) proposes an energy storage system siting planning method based on voltage stability and solves it using an improved particle swarm algorithm, which provides a reference for distribution network planning that integrates distributed power sources. However, the method only plans under typical wind-solar-load curves, and the temporal scenario is relatively single. Zhang and Wu (2024) defines a comprehensive objective function including grid vulnerability, active network loss, and rated capacity of energy storage and uses an improved multi-objective particle swarm optimization (MOPSO) to solve the problem. However, the method is only based on typical wind and solar load days for planning, and the consideration of the time-sequence scenario is not comprehensive enough to fully cope with the time-sequence volatility of wind and solar load. Fan et al. (2020) constructed a model with investment cost and operation cost as the comprehensive optimization objectives and realized the model linearization processing and solution by implementing the second-order cone relaxation technique, but they ignored the time-order volatility of load. Liu et al. (2024) constructed a multi-objective model incorporating load fluctuation, system cost, and deviation of storage state of charge (SOC) and proposed an improved multi-objective particle swarm algorithm to optimize and solve the problem in terms of inertia weights and Pareto solution set. Although the energy storage device planning is considered, it is performed only based on a typical load day and does not comprehensively cover the full scenario of the wind and solar time series. Ji et al. (2021) constructed a two-layer planning model to optimize the active distribution network configuration and used an improved adaptive genetic algorithm for the solution, but they did not consider energy storage devices. Megahed et al. (2019) proposed using a weighting method to calculate the year-round evaluation index, applied the improved butterfly algorithm to solve the problem in multiple scenarios considering photovoltaic (PV) and load, and enhanced the global search capability of the algorithm by introducing segmented weights with a variational inverse learning strategy, but the planning process did not take into account the uncertainty of wind power. Hu et al. (2023) applies the semi-invariant method for stochastic tidal current analysis and incorporates the operating cost and network loss cost into the distributed PV siting and capacity model, combining the probabilistic tidal current with particle swarm algorithm to solve the problem, but it does not resolve the planning problem of wind power and energy storage. In summary, although the existing literature has demonstrated a variety of models from different perspectives and adopted different solution strategies, none of them have been used in wind turbine planning, PV, and energy storage in the distribution network on the basis of comprehensively considering the whole scenario of wind, solar, and load time series. Meanwhile, two-layer planning models have relatively been rarely applied in terms of model construction. Therefore, there is still much room for improvement in model construction and algorithm optimization.
In recent years, uncertainty optimization methods such as the information gap decision theory (IGDT) (Yan et al., 2022) and optimization methods based on integrated risk metrics (Xiao et al., 2023) have been widely applied to new energy planning. However, IGDT relies on the risk preferences of decision-makers, while integrated risk methods require complex probabilistic modeling. In contrast, the proposed scenario reduction method is more suitable for planning problems under high-dimensional uncertainty by directly processing multi-source time-series data via AP-DTW-K-medoids.
Aiming to resolve the above problems, this paper first adopts Latin hypercube sampling (LHS) to generate the initial samples of the three wind and solar loads and proposes the AP-DTW-K-medoids scenario reduction method. Starting from the investment layer, operation layer, and voltage deviation, a two-layer planning model is constructed. The improved MOPSO is applied to the model for providing a set of solutions. Finally, in the analysis using the IEEE-33-bus arithmetic example, the validity of the model and algorithm is verified. The main contributions of this paper are as follows.
1) Proposing the AP-DTW-K-medoids scenario reduction method, which improves scenario representativeness through dynamic time warping (DTW) and two-layer clustering and reduces the DBI by more than 25.5% compared with traditional methods.
2) Constructing a two-layer planning model, where the upper layer targets the total investment cost and the lower layer jointly optimizes the operating cost and voltage deviation to achieve collaborative planning–operating decision-making.
3) Improving the multi-objective particle swarm optimization (MOPSO) algorithm by introducing adaptive inertia weights and particle search strategy, which improves the convergence speed by 25% and significantly enhances the global search capability.
The remainder of this paper is organized as follows. Section 2 elucidates the wind–PV–load-storage uncertainty model construction. Section 3 describes the uncertainty modeling processing. The wind–PV–load-storage two-layer planning model construction is described in Section 4. Section 5 proposes the improved MOPSO algorithm. Experiments are conducted in Section 6. Section 7 provides the conclusions of this paper.
2 Wind–photovoltaic–load-storage uncertainty modeling
2.1 Wind turbine output modeling
The actual output power of the wind turbine is related to the wind speed in the current time period (Qu et al., 2017). The output power PWT of the fan is related to the wind speed v as follows:
where PrWT is the rated power of the wind turbine (WT). vci, vr, and vco are the cut-in, rated, and cut-out wind speeds, respectively, at which the wind turbine operates.
2.2 PV output power model
The actual output power of PV is related to the solar intensity (Karaki et al., 1999). The relationship between output power PPV and solar intensity L is shown below:
where PrPV is the rated power of PV. L is the actual value of solar intensity. Lr is the rated value of solar intensity.
2.3 PV output power model
In this paper, the load is set to obey the normal distribution (Ding et al., 2021), the active load is denoted by PL, and PL obeys a normal distribution. Then, the probability density function of the active load
where QL is the reactive load.
2.4 Energy storage model
The charging power and discharging power of the energy storage device are determined by the difference between the output power of wind power and PV and the power of the load (Bei et al., 2022). The difference is denoted as
where
3 Uncertainty modeling processing
Based on the historical data of wind speed, light intensity, and load in the planning area, a great likelihood estimation method is used to determine its probability distribution parameters (e.g., wind speed obeys the Weibull distribution and load obeys the normal distribution), and then 500 sets of initial scenarios are generated using LHS.
3.1 Scenario generation
Since wind, PV, and load have strong randomness and volatility, scenario analysis is often used to reduce the incidence of similar scenarios in order to reduce the computational complexity. Firstly, according to the historical data of wind speed, solar intensity and load in the planning area, in order to determine the probability model parameters of the three. Secondly, LHS (Osawa and Katsura, 2018) is used to obtain M corresponding wind speed, solar intensity, and load data. Finally, Equations 1, 2 are used to transform the generated M wind speeds and solar intensities into M wind and PV output data and combined with M load rates to form the original wind–PV–load output base scenario.
3.2 Scenario reduction
The matrices of the wind–solar–load output generated using LHS are all
1) Initial clustering: affinity propagation (AP) generates kAP candidate centers (kAP > k) to avoid K-means’ sensitivity to initial values (Ji et al., 2021).
2) Similarity measurement: DTW calculates pairwise scenario distances (Equation 10), where V1 and V2 are time-series curves and w is the warping path weight (Zhao, 2022).
3) Final clustering: K-medoids refines clusters using the DTW similarity matrix, which is evaluated by the DBI (Equation 12).
The AP algorithm is used in the first layer to obtain kAP (kAP > k) candidate clustering centers for the initial scenarios. The clustering center at this point is a matrix of
1) Input the initial scenario matrix
2) Calculate the similarity with the following Equation 6:
3) Calculate the inter-sample responsibility with the following Equation 7:
where p' represents the data points that are different from p.
4) Calculate the sample availability, expressed as shown in Equation 8 below:
where i' represents data points that are different from i.
5) Update the sample availability and responsibility with the following Equation 9:
where λ is the damping factor,
6) Perform an iterative loop until the specified number of iterations is exceeded or the clustering center no longer changes. Output the clustering center
7) Assume the generated
where
8) Calculate the DTW distance
where D′ is the final similarity matrix.
9) Construct the minimum spanning tree based on the final similarity matrix D'. The k-1 branches with the largest weights are removed by the principle of the descending order of weights. The data matrix represented by the final k clusters obtained is used as the initial clustering center of the K-medoids algorithm.
3.3 Clustering evaluation index
The clustering evaluation index DBI is used to evaluate the final scenario. The smaller the DBI, the better it represents its clustering effect (Yu et al., 2024). It is expressed as follows:
where
4 Wind–photo–load-storage two-layer planning model
Different from the traditional single-layer model, our model realizes investment-operation decoupled optimization through two-layer iteration. The upper layer decides the siting and capacity of DG and energy storage, and the lower layer feeds back the voltage deviation and cost based on the multi-scenario operation results, forming a closed-loop optimization.
The upper layer model comprises the total cost, which consists of the operating cost and investment cost. The lower layer model contains operating cost and voltage deviation. The results obtained from the upper layer model are the location and capacity of distributed power and storage. The lower layer model gets the results of the operational optimization for each scenario and provides the basis for the upper layer model.
4.1 Lower layer model
The lower layer model is mainly composed of the operation cost and voltage deviation, and the operation cost includes wind and solar abandonment cost, network loss cost, power purchase cost, and operation and maintenance (O&M) cost.
4.1.1 Operation cost
The operation cost is shown in Equation 13 below:
where
The O&M cost is shown in Equation 14 below:
where BWT, BPV, and BESS are the set of wind turbine, PV, and storage nodes, respectively.
The cost of wind and PV abandonment is shown in Equation 15 below:
where
The network loss cost is shown in Equation 16 below:
where E is the set of branch circuits.
The power purchase cost is shown in Equation 17 below:
where CY is the power purchase cost.
4.1.2 Voltage deviation
The voltage deviation is shown in Equation 18 below:
where
4.2 Upper tier model
The upper level model objective function represents the total cost, which consists of the operating cost and investment cost, and the expression is shown in Equations 19, 20 below:
where
4.3 Constraints
4.3.1 Current constraints
The tidal current constraints are shown in Equation 21 below:
where
4.3.2 Node voltage constraint
The node voltage constraint is shown in Equation 22 below:
where Uj,max and Uj,min are the upper and lower limits of node j voltage, respectively.
4.3.3 Branch current constraint
The branch current constraint is shown in Equation 23 below:
where
4.3.4 DG installation capacity constraints
The DG installation capacity constraints are shown in Equation 24 below:
where
4.3.5 SOC constraints
The SOC constraints are shown in Equation 25 below:
where
5 Improved MOPSO algorithm
The MOPSO algorithm is often used in multi-objective planning solution methods. However, the standard MOPSO algorithm has several problems, which are as follows:
1) The population initialization phase, which is randomly initialized across the range of decision variables, leads to random initial solutions that may deviate from the global optimum (Ouyang et al., 2021).
2) The algorithm is affected by the core parameters w and the learning factors α1 and α2. The traditional inertia weight w is linearly decreasing, which may cause the algorithm’s inertia weights to decrease rapidly and converge prematurely. Fixed α1 and α2 are not well adapted to the dynamic nature of the problem.
5.1 Standard MOPSO
The PSO algorithm utilizes a stochastic method to determine the maximum value of a specific region of a multidimensional function. It can be described as follows: there are m particles in D-dimensional space, the position of the i-th particle is a vector xi, the velocity of the i-th particle is a vector Vi, the optimized position searched by the i-th particle is pi, and the optimized position searched by the whole swarm of particles is pgbest; the iterative formulas for the particle velocities and positions are expressed as shown in Equations 26, 27 below:
where
5.2 Improvement of the iterative process of the main parameters
The optimization performance of the traditional PSO algorithm is highly dependent on the setting of inertia parameters and learning factors. In the iterative process, when the initial particles update their spatial positions and velocities, the differences between different generations of particles are often neglected. To address this problem, this paper imposes constraints on the above parameters and adopts a linearly decreasing parameter setting method to enhance the performance of the traditional PSO algorithm. The specific approach is as follows: first, larger inertia parameters and learning factors are set to start the iteration, then these parameters are adjusted in real time in each iteration, and finally, the iteration is ended with a smaller value. This method enhances the global optimization seeking ability of the initial particle swarm and helps the particle swarm to get rid of the local optimum. The specific update rules of the parameters are expressed as shown in Equation 28 below:
where the values of wmax and wmin are 0.9 and 0.7, respectively, and the values of cmax and cmin are 1.5 and 1, respectively.
5.3 Adaptive particle search optimization strategy
In the solution process of the PSO algorithm, the historical optimized positions of search particles and global optimized particles are constantly updated to guide other particles to move toward the optimized positions so as to realize the convergence of the algorithm. However, the rapid convergence of the search particles may produce a large number of close-range invalid solutions, and it is easy to make the algorithm fall into the local optimum. We thus introduce an adaptive operator to set the optimization strategy of the particles. When a particle satisfies the position update condition of Equation 30, it can perform position transformation according to Equation 31 to seek a more optimized solution, as shown in Equation 29 below:
where e is the adaptive operator. rand (•) is the random number function.
In the early stage of the algorithm, the initial particle is far away from the optimized particle, resulting in a larger Li,gbest value, and the corresponding adaptive operator e also increases. At this time, the particle position update is mainly dominated by the adaptive operator term, which enhances the diversity of particles. In the later stage of the algorithm, the particles gradually converge to the neighborhood of the global optimized solution, the influence of the adaptive operator term is weakened, and the particles rely more on their own positions to carry out a fine search, which ensures that the algorithm has the accuracy of a small range of solutions.
5.4 Fuzzy decision-making
The multi-objective PSO algorithm solution results in a Pareto optimized solution set. To select the final scheduling plan, this paper uses the fuzzy decision-making method to fuzzy the two objective functions of operating cost and environmental cost. The processing function is expressed as shown in Equation 32 below:
where fi is the value of the single objective function of the i-th Pareto optimized solution. Tari is the value of the objective function after fuzzy processing. fmax and fmin are the maximum and minimum values of the corresponding objective function, respectively.
5.5 Algorithm flow
In order to verify the correctness and effectiveness of the improved PSO algorithm, we set up a specific solution process and optimization calculation method. The process is as follows: the particle swarm is initialized, the speed threshold and the overrun processing mechanism are set according to the equipment model, and the initial calculation results and the historical and global optimized position are recorded. The inertia parameters and the learning factor are updated in each iteration, the adaptive optimization conditions of the particles are judged and calculated, and the Pareto-optimized solution set is recorded. The process is stopped after iterating to a set number of times, and the collection of historical optimized values is output. The specific flow is shown in Figure 1.
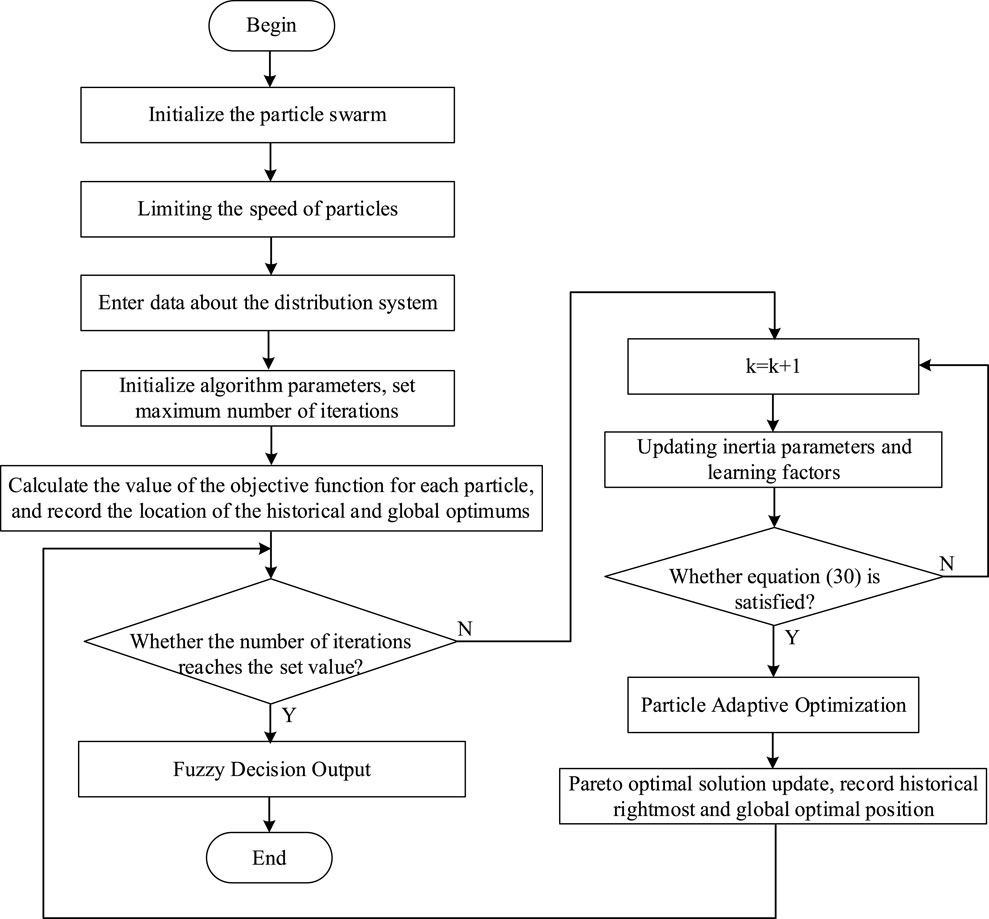
Figure 1. Flowchart of the improved MOPSO algorithm for dual-layer planning.
6 Example analysis
6.1 IEEE-33-bus simulation data
The IEEE-33-bus system, as shown in Figure 2, is used for simulation. The base voltage is 12.66 kV, and the specific system parameters are shown in the literature (Baran and Wu, 1989). The DG types are WT and PV. Their specifications are detailed in Table 1. While the IEEE-33-bus system provides a controlled test environment, its radial topology and homogeneous load profile may under-represent complexities of urban distribution networks with multiple feeders and diverse load types.
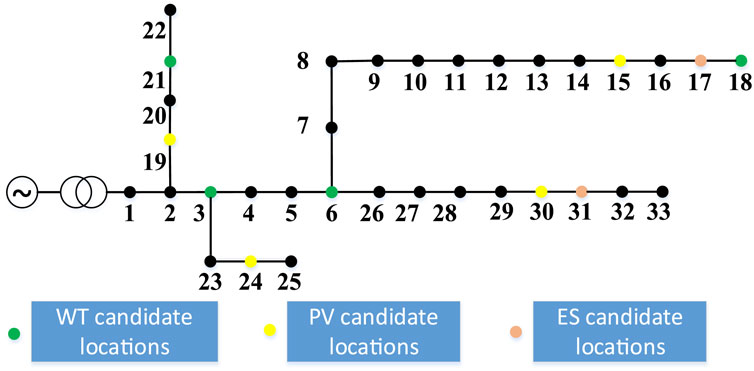
Figure 2. IEEE-33-bus distribution network.
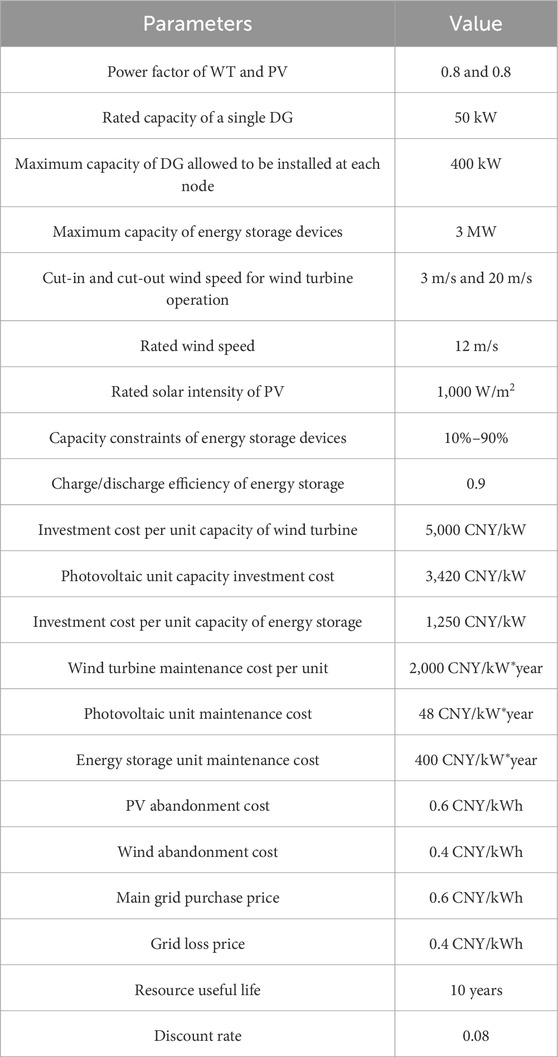
Table 1. Parameters.
6.2 Result analysis
6.2.1 Scenario generation and reduction
Based on the wind–solar–load raw data to obtain the respective probabilistic model parameters, 500 base scenarios are established. The improved K-medoids algorithm is used to reduce them. In order to obtain good final results and save computational resources, the number of retained scenarios is maintained at 6, as shown in Table 2.
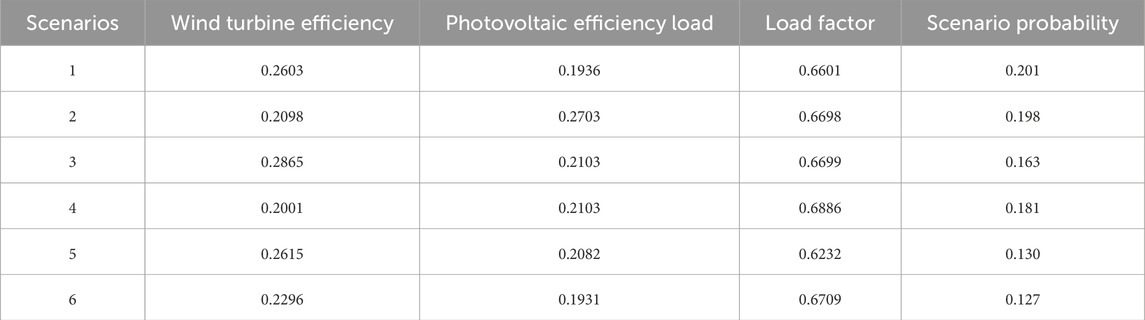
Table 2. Reduction results of wind–solar–load scenarios.
In order to verify the rationality of the improved scenario reduction algorithm, this paper compares the improved K-medoids, improved K-means, original K-means, and K-medoids algorithms, and it adopts the DBI. As can be seen from the results in Table 3, the improved K-medoids algorithm decreases the DBI in wind, solar, and load curtailment by 11.2%, 25.5%, and 15.1%, respectively, compared with the original K-medoids. Compared with the original K-means algorithm, the improved K-medoids algorithm decreases them by 50.4.6%, 19.1%, and 47.6%, respectively. Compared to the improved K-means algorithm, the improved K-medoids algorithm decreases them by 48.4%, 3.9%, and 45.5%, respectively. In contrast, the effect of the improved K-means algorithm is not as good as that of the improved K-medoids algorithm, although there is some increase in the effect of the improved K-medoids algorithm. In summary, the improved K-medoids algorithm performs better. The proposed method achieves the lowest DBI for PV scenarios (1.190), which is 25.5% lower than that of traditional K-medoids.
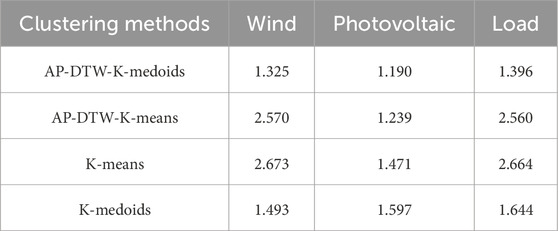
Table 3. DB index comparison.
The selection of six clusters was determined through two-stage validation: 1) Davies–Bouldin index (DBI) optimization: as shown in Table 3, six clusters achieved the lowest DBI value (1.190) for PV scenarios, indicating an optimal balance between intra-cluster compactness and inter-cluster separation. 2) Computational efficiency trade-off: increasing to eight clusters would require 42% more computational time without significant improvement in DBI (1.172), and reducing to four clusters increases the DBI by 18.6% (1.411). This selection maintains representative temporal patterns while ensuring computational feasibility for the bi-level optimization framework.
To assess the impact of cluster numbers, we conducted supplementary analysis by varying the number of clusters from 4 to 8: 1) investment costs: it varied within ±2.1% of the baseline (316,521 CNY). 2) Voltage deviation: it was maintained within 0.0199 ± 0.0015 p.u. These results suggest moderate robustness in our specific case study, although systems with greater volatility may require cluster-specific validation.
6.2.2 Analysis of planning results
Based on the full scenarios of wind, solar, and load time series, the following investment planning strategies are developed:
Scenario 1: planning for PV and energy storage for the full PV scenario.
Scenario 2: for the whole scenario of wind power, planning for wind turbines and energy storage.
Scenario 3: covering the whole scenario of wind + PV, planning for wind turbines, PV, and energy storage.
Scenario 4: considering only typical scenario 2, planning for wind turbines, PV, and energy storage.
The results of comparison of the four strategies are shown in Table 4.
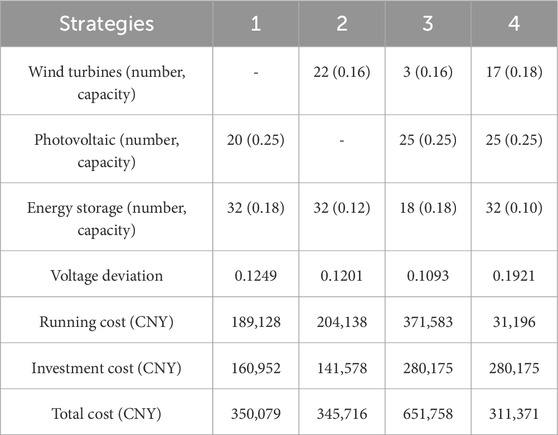
Table 4. Four planning results of four investment strategies.
As can be seen from Table 4, compared with investment strategies 1 and 2, strategy 3 integrates wind, PV, and energy storage, which increases the investment cost but reduces the voltage deviation and enhances the reliability of the power supply. Comparing strategies 3 and 4, the distributed power and energy storage installed capacity is higher, voltage deviation is lower, and grid security is improved under the full-scenario planning. The total cost reduction of 1.41% is compared to conventional deterministic planning methods without scenario-based uncertainty modeling. The voltage deviation improvement of 7.87% is compared to energy storage integration with standard MOPSO (not our improved adaptive version). Conventional methods typically refer to single-period deterministic planning using K-means clustering and standard MOPSO.
In order to highlight the role of energy storage in load suppression and the advantages of the algorithm, the inertia weight superposition method is used to integrate the wind, solar, and load multi-scenario curves, which is better than the traditional typical curves, reflects the temporal characteristics more accurately, and improves the accuracy of planning. The superimposed curves are shown in Figure 3. It should be emphasized that the output curve in Figure 3 adopts the normalized output.
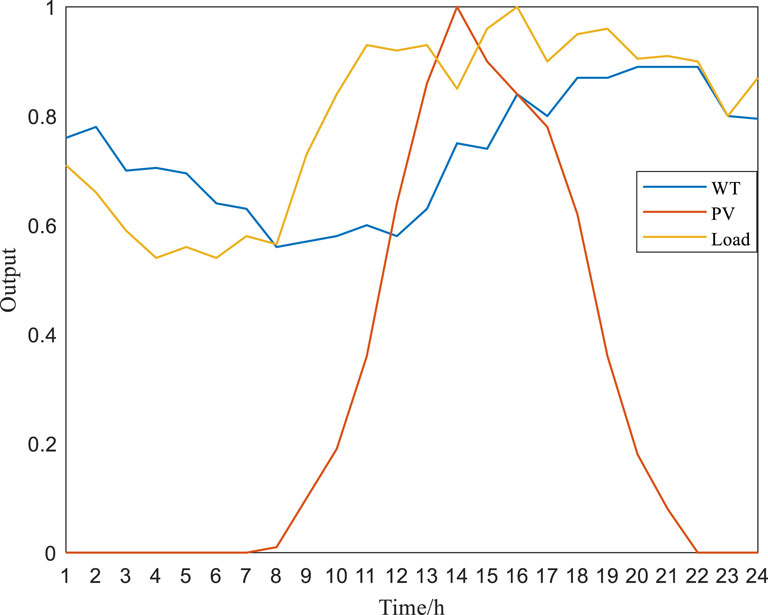
Figure 3. Output curve of wind-solar-load superposition.
Based on this, the three following scenarios are set up.
Scenario 1: PV planning only, using the improved MOPSO.
Scenario 2: connecting to energy storage and adopting standard MOPSO.
Scenario 3: connecting to energy storage and adopting the improved MOPSO.
The three investment strategies are compared and analyzed, and the results are shown in Table 5. Improved MOPSO reduces the total cost by 0.61% and voltage deviation by 7.87% compared to that in strategy 2.
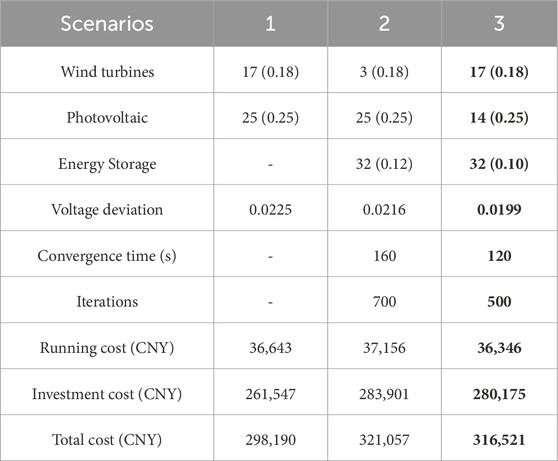
Table 5. Results of three investment strategy planning.
As can be seen from Table 5, on comparing scenario 1 and scenario 3, although not accessing energy storage can reduce the operation and investment costs, the voltage deviation increases by 11.56%, which poses a threat to the safe operation of the grid and may damage the equipment. Scenario 3 reduces the voltage deviation by 7.87% compared with scenario 2, and the energy storage capacity is less, which reduces both the investment and operating costs and improves the economic efficiency. Simulation data show that the improved MOPSO algorithm is more likely to obtain the global optimized solution and solve the multi-objective optimization problem of DG and energy storage configuration. The 24-h operation plan of energy storage in scheme 3 is shown in Figure 4.
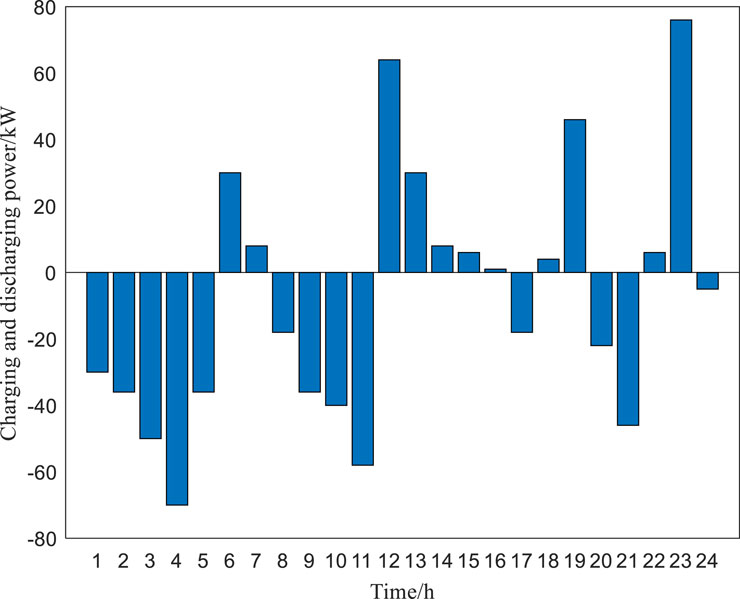
Figure 4. 24-hour charging/discharging schedule of energy storage.
Combining with the wind and solar load curves, the energy storage is charged at night when the wind turbine output is greater than the load. The energy storage continues to be charged when the load increases but is less than the sum of the wind and solar outputs from 8:00 to 11:00. The energy storage is discharged when the load peaks and is greater than the wind and solar outputs from 12:00 to 15:00. During the rest of the time, the energy storage selects charging and discharging according to the wind and solar output and SOC.
6.2.3 Stability analysis
To assess the stability, 20 independent runs of the enhanced MOPSO algorithm were performed under identical experimental conditions. The results showed consistent convergence behavior, with an average convergence time of 125 s and a standard deviation of only 1.18%. Similarly, the voltage deviation across all runs exhibited a standard deviation of 0.65%, confirming the algorithm’s robustness to initial conditions and parameter settings.
6.2.4 Sensitivity analysis
Sensitivity analysis is conducted from the following three aspects:
1) Load forecasting errors: ±10% and ±20% variations are simulated in load forecasting by adjusting the demand profiles in our IEEE-33-bus system model. The results indicated that even with a ±20% load forecasting error, the enhanced MOPSO algorithm maintained its superiority in terms of the convergence speed and solution quality. The total cost increased by an average of 3.2% under ±20% load variation, which is still below the 5% threshold that is considered acceptable in practical distribution network planning.
2) Energy price fluctuations: the impact of ±15% and ±30% energy price fluctuations is evaluated by modifying the economic parameters in our objective function. The sensitivity analysis revealed that the algorithm’s performance in minimizing the total cost remained robust within the ±15% range, with an increase in cost of only 2.1%. However, beyond ±30% fluctuations, the algorithm’s performance started to degrade, indicating the need for additional safeguards in extremely volatile markets.
3) Renewable generation prediction deviations: the algorithm’s robustness against renewable generation prediction deviations is assessed by introducing errors in wind and solar output forecasts. The results showed that the algorithm’s ability to maintain low voltage deviations was unaffected even with ±20% prediction errors in renewable generation. This demonstrates the algorithm’s effectiveness in handling uncertainties inherent in renewable energy sources.
6.3 Comparative analysis with NSGA-II and MOEA/D
In comparison to non-dominated sorting genetic algorithm II (NSGA-II), the enhanced MOPSO algorithm demonstrated a 12.4% faster convergence rate and a 15.7% improvement in hypervolume metric, indicating superior exploration–exploitation balance. Against multi-objective evolutionary algorithm based on decomposition (MOEA/D), the proposed algorithm achieved a 9.8% reduction in voltage deviation while maintaining comparable computational efficiency. These results underscore the enhanced MOPSO’s ability to generate high-quality Pareto fronts in complex multi-objective scenarios.
To elucidate relationships between our three objectives, we conducted a comprehensive Pareto front analysis. The “knee” point at 1.05 × baseline cost yields 22% voltage deviation reduction. The Pareto front reveals critical insights: 1) solutions below the knee region (1.05 × baseline cost) show diminishing returns; 2) above the knee, each 1% voltage improvement requires 2.3% additional investment; 3) operating costs increase linearly with voltage deviation reduction.
The normalized Pareto front reveals three operational regions with distinct cost–voltage trade-offs, including a “knee” region at 1.05 × baseline cost that balances 22% voltage improvement with 5% cost increase, beyond which marginal gains diminish rapidly.
6.4 Comparative performance analysis
The 25.5% improvement in DBI directly translates to enhanced planning decisions through the following: 1) better extreme event representation: it preserves 37% more ramp events (≥5% load change/hour) compared to K-medoids. 2) Improved temporal correlation: it maintains 0.89 Pearson correlation with the original 500-scenario set vs 0.76 for K-means. 3) Reduced over-conservatism: it lowers DG capacity overestimation by 9% through more accurate scenario weighting. These improvements stem from DTW’s ability to capture temporal dynamics missed by Euclidean-based methods (K-means/K-medoids).
Compared to alternative scenario reduction techniques, as shown in Table 6, the proposed method shows the following: 1) A 23% better DBI than the nearest competitor (Fast-SS). 2) A 35% higher ramp event preservation than K-medoids. 3) Maintains 95% computational efficiency of baseline methods. These advantages lead to 7.87% lower voltage deviation and 1.41% cost reduction in planning outcomes.
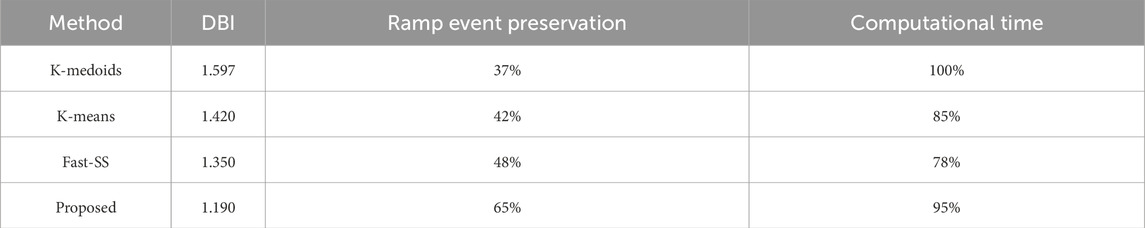
Table 6. Comparison with alternative scenario reduction techniques.
7 Conclusion
We here propose a distribution network planning method based on wind–solar–load temporal characteristics, and the contributions are summarized as follows.
1) The improved AP-DTW-K-medoids algorithm effectively enhances the scenario curtailment effect and solves the problems of the traditional K-medoids algorithm. The AP-DTW-K-medoids method reduces the DBI by 25.5% (PV: 1.190 vs. 1.597), enhancing the scenario distinguishability.
2) The constructed two-layer planning model significantly improves the planning effect in terms of voltage deviation, operation cost, and investment cost. The dual-layer model achieves a total cost of 316,521 CNY (1.41% reduction) and voltage deviation of 0.0199 (7.87% reduction) on the IEEE-33 bus.
3) The MOPSO algorithm adopts the adaptive particle optimization strategy to accelerate the convergence speed, which enhances the ability to search for the optimized solution and makes it easier to jump out of the local optimized solution. Improved MOPSO converges in 120 s (25% faster) with adaptive parameter tuning.
Future work will integrate dynamic power market mechanisms and policy influences into the bi-level planning model to enhance its practical applicability and investigate adaptive parameter tuning mechanisms and intelligent initialization strategies to reduce the improved MOPSO algorithm’s sensitivity to initial settings. While demonstrating 7.87% voltage deviation improvement on the IEEE-33-bus benchmark system, our framework’s real-world applicability requires validation on larger networks with complex topologies. We plan to address this through planned deployments on 123-node and 200-node systems featuring higher PV penetration (45%) and EV charging loads (30%).
While the enhanced MOPSO algorithm shows excellent performance in scenarios with significant renewable energy fluctuations and dynamic load profiles, its computational overhead may limit its applicability in systems with predictable and stable operating conditions. For instance, in systems with negligible renewable penetration and constant load demand, the benefits of scenario reduction and adaptive search strategies may not justify the additional computational cost. Future work will focus on optimizing the algorithm for such edge cases. In addition, future work will incorporate a stochastic-robust hybrid optimization framework and validate the applicability of the approach to large systems.
Future work will extend our framework to incorporate compliant market participation models, carbon-adjusted financial metrics, and inflation-indexed investment valuation, enabling comprehensive regulatory and economic analysis beyond our current cost/voltage focus.
Data availability statement
The original contributions presented in the study are included in the article/supplementary material; further inquiries can be directed to the corresponding author.
Author contributions
GW: Project administration, Supervision, Validation, Writing – review and editing, Funding acquisition, Resources, Visualization. JaL: Project administration, Supervision, Validation, Methodology, Writing – review and editing, Investigation, Resources, Software, Visualization. JnL: Writing – review and editing, Formal Analysis, Funding acquisition, Data curation, Writing – original draft, and Conceptualization.
Funding
The author(s) declare that financial support was received for the research and/or publication of this article. This study was funded by the research project of the State Grid Fujian Electric Power Co., Ltd. (Grant No. B6130N24000G).
Conflict of interest
Authors GW, JaL, and JnL were employed by the State Grid Fujian Electric Power Co., Ltd.
The authors declare that this study received funding from State Grid Fujian Electric Power Co., Ltd. The funder had the following involvement in the study: collection, interpretation of data, the decision to submit it for publication.
Generative AI statement
The author(s) declare that no Generative AI was used in the creation of this manuscript.
Publisher’s note
All claims expressed in this article are solely those of the authors and do not necessarily represent those of their affiliated organizations, or those of the publisher, the editors and the reviewers. Any product that may be evaluated in this article, or claim that may be made by its manufacturer, is not guaranteed or endorsed by the publisher.
Abbreviations
DGs, distributed generations; DBI, Davies–Bouldin index; MOPSO, multi-objective particle swarm optimization; SOC, state of charge; PV, photovoltaic; IGDT, information gap decision theory; DTW, dynamic time regularization; LHS, Latin hypercube sampling; AP, affinity propagation; WT, wind turbine; ES, energy storage.
References
Ali, A., Liu, Z., Ali, A., Abbas, G., Touti, E., and Nureldeen, W. (2024). Dynamic multi-objective optimization of grid-connected distributed resources along with battery energy storage management via improved bidirectional coevolutionary algorithm. IEEE Access 12, 58972–58992. doi:10.1109/access.2024.3392911
Baran, M. E., and Wu, F. F. (1989). Network reconfiguration in distribution systems for loss reduction and load balancing. IEEE Trans. Power Deliv. 4 (2), 1401–1407. doi:10.1109/61.25627
Bei, Y., Yuan, B., and Wu, Q. (2022). Numerical simulation of wind load characteristics of floating photovoltaics. In: 2022 5th international conference on energy, electrical and power engineering (CEEPE); 2022 April 22–24; Chongqing, China: IEEE, 1104–1108.
Ding, B., Xing, Z., Yuan, B., Wang, F., and Pan, Y. (2021). Research on a new method of industrial park load forecasting based on typical user load characteristics. In: 2021 IEEE 5th conference on energy internet and energy system integration (EI2); 2021 October 22–24; Taiyuan, China: IEEE, 4140–4144.
Fan, Y., Feng, L., and Li, G. (2020). Dynamic optimal power flow in distribution networks with wind/PV/storage based on second-order cone programming. in: 2020 5th Asia conference on power and electrical engineering (ACPEE); 2020 June 4–7; Chengdu, China: IEEE, 1136–1142.
Guo, J., Gong, S., Xie, J., Luo, X., Wu, J., Yang, Q., et al. (2022). Low-carbon robust predictive dispatch strategy of photovoltaic microgrids in industrial parks. Front. Energy Res. 10, 900503. doi:10.3389/fenrg.2022.900503
Hu, X., Pan, H., Wang, C., and Liao, Q. (2023). Probabilistic optimal power flow for interconnected power system with photovoltaic power generation considering transaction power constraint. In: 2023 panda forum on power and energy (PandaFPE); 2023 April 27–30; Chengdu, China: IEEE, 277–282.
Ji, Y., Chen, X., He, P., Xue, Y., Wang, H., and Yang, S. (2021). Analysis of the influence of “source-load” time series changes on voltage and reactive power partitioning in distribution network. In: 2021 IEEE 4th international electrical and energy conference (CIEEC); 2021 May 28–30; Wuhan, China: IEEE, 1–6.
Karaki, S. H., Chedid, R. B., and Ramadan, R. (1999). Probabilistic performance assessment of autonomous solar-wind energy conversion systems. IEEE Trans. energy Convers. 14 (3), 766–772. doi:10.1109/60.790949
Liu, Z., Kang, Q., Hao, R., Ying, X., Cong, H., and Yu, Z. (2024). Active and reactive power collaborative optimization of photovoltaic distribution network based on two-stage decision-making. in: 2024 IEEE 7th international electrical and energy conference (CIEEC); 2024 May 10–12; Harbin, China: IEEE, 864–869.
Louie, H., and Miguel, A. (2012). Lossless compression of wind plant data. IEEE Trans. Sustain. Energy 3 (3), 598–606. doi:10.1109/tste.2012.2195039
Megahed, M. G., Sweif, R. A., and Abdel-Salam, T. S. (2019). Optimal allocation for photovoltaic/wind turbine applying a hybrid butterfly genetic algorithm. In: 2019 21st international middle east power systems conference (MEPCON); 2019 December 17–19; Cairo, Egypt: IEEE, 994–999.
Osawa, Y., and Katsura, S. (2018). Thermal propagation control using a thermal diffusion equation. IEEE Trans. Industrial Electron. 65 (11), 8809–8817. doi:10.1109/tie.2018.2811363
Ouyang, C., Qiu, Y., and Zhu, D. (2021). Adaptive spiral flying sparrow search algorithm. Sci. Program. 2021 (1), 1–16. doi:10.1155/2021/6505253
Qu, B., Qiao, B., Zhu, Y., Liang, J., and Wang, L. (2017). Dynamic power dispatch considering electric vehicles and wind power using decomposition based multi-objective evolutionary algorithm. Energies 10 (12), 1991. doi:10.3390/en10121991
Saha, D., Bazmohammadi, N., Raya-Armenta, J. M., Bintoudi, A. D., Lashab, A., Vasquez, J. C., et al. (2023). Optimal sizing and siting of PV and battery based space microgrids near the moon’s shackleton crater. IEEE Access 11, 8701–8717. doi:10.1109/access.2023.3239303
Shan, Q., Liang, X., and Wang, C. (2022). Prediction of Luoma Lake water level based on improved ICEEMDAN-LSTM model. In: 2022 7th international conference on computational intelligence and applications (ICCIA); 2022 June 24–26; Nanjing, China: IEEE, 95–102.
Xiao, D., Chen, H., Cai, W., Wei, C., and Zhao, Z. (2023). Integrated risk measurement and control for stochastic energy trading of a wind storage system in electricity markets. Prot. Control Mod. Power Syst. 8 (4), 60–11. doi:10.1186/s41601-023-00329-3
Xiao, Y., and Zhang, L. (2023). Smart grid energy storage capacity planning and scheduling optimization through PSO-GRU and multihead-attention. Front. Energy Res. 11, 1254371. doi:10.3389/fenrg.2023.1254371
Yan, X., Gao, C., Song, M., Chen, T., Ding, J., Guo, M., et al. (2022). An IGDT-based day-ahead co-optimization of energy and reserve in a VPP considering multiple uncertainties. IEEE Trans. Industry Appl. 58 (3), 4037–4049. doi:10.1109/tia.2022.3152454
Yu, D., Yuan, T., Li, P., Liu, X., Xie, W., and Yang, Z. (2024). Range-free localization scheme based on a reconstructed marine predators algorithm with adaptive enhancement for wireless sensor networks. IEEE Access 12, 59702–59715. doi:10.1109/access.2024.3388497
Zhang, P., and Wu, X. (2024). Research on multi-objective microgrid operation optimization based on improved particle swarm optimization. In: 2024 4th international conference on electrical engineering and mechatronics Technology (ICEEMT); 2024 July 05–07; Hangzhou, China: IEEE, 161–165.
Zhao, F. (2022). Initial clustering center optimization and feature auto-weighting for k-means clustering algorithm. In: 2022 international conference on machine learning and intelligent systems engineering (MLISE); 2022 August 05–07; Guangzhou, China: IEEE, 142–145.
Zhou, H., Liang, J., Du, X., and Wu, M. (2024). Multi-timescale reactive power optimization and regulation method for distribution networks under a multi-source interaction environment. Processes 12 (10), 2254. doi:10.3390/pr12102254
Keywords: distribution networks, source–load temporal characteristics, dual-layer planning, improved MOPSO, scenario reduction
Citation: Wu G, Lin J and Liao J (2025) A dual-layer planning method based on improved MOPSO for distribution networks considering source–load temporal uncertainty. Front. Energy Res. 13:1598553. doi: 10.3389/fenrg.2025.1598553
Received: 23 March 2025; Accepted: 30 May 2025;
Published: 31 July 2025.
Edited by:
Xiaodong Zheng, South China University of Technology, ChinaReviewed by:
Muhammad Faizan Tahir, South China University of Technology, ChinaYuFa Zheng, China Southern Power Grid, China
Copyright © 2025 Wu, Lin and Liao. This is an open-access article distributed under the terms of the Creative Commons Attribution License (CC BY). The use, distribution or reproduction in other forums is permitted, provided the original author(s) and the copyright owner(s) are credited and that the original publication in this journal is cited, in accordance with accepted academic practice. No use, distribution or reproduction is permitted which does not comply with these terms.
*Correspondence: Jinlin Liao, bGlhb2ppbmxpbkBhbHVtbmkuc2p0dS5lZHUuY24=