 Huan Zhou1*
 Jie Wei2
- 1College of Electrical Engineering, Shanghai University of Electric Power, Shanghai, China
- 2State Grid Zhejiang Electric Power Co., Ltd., Zhoushan Power Supply Company, Zhoushan, China
Against the backdrop of high investment costs in distributed energy storage systems, this paper proposes a bi-level energy management model based on shared multi-type energy storage to enhance system economics and resource utilization efficiency. First, an electricity–heat–hydrogen coupled shared storage architecture is developed, incorporating hydrogen-blended gas turbines, gas boilers, and hydrogen loads to achieve deep coupling between the power grid and natural gas network. Then, a bi-level game model is formulated with the upper-level objective of minimizing the storage operator’s cost and the lower-level objective of minimizing the cost of the integrated energy microgrid (IEM) aggregator. A cooperative game mechanism is introduced within the microgrids to support peer-to-peer energy trading. Nash bargaining theory is applied to determine benefit allocation and dynamic pricing strategies among microgrids. The model is solved using a genetic algorithm (GA) and the alternating direction method of multipliers (ADMM). Simulation results validate the proposed strategy’s effectiveness and feasibility in reducing system costs, improving overall benefits, and achieving fair benefit allocation.
1 Introduction
As the global energy transition accelerates, energy systems are rapidly evolving toward greater efficiency, cleaner energy sources, and lower carbon emissions. The energy technology revolution is driving the deep integration of various emerging technologies within the energy sector to accommodate the large-scale development of distributed energy while meeting the comprehensive supply demands of multiple energy carriers, including cooling, heating, electricity, and gas. Against this backdrop, the penetration of renewable energy, represented by wind and solar power, continues to increase in distribution networks. This trend has become a key research focus in the energy sector. Integrated energy systems (IES) play a crucial role in promoting the large-scale development of renewable energy, achieving multi-energy complementarity and coordinated optimization, and improving energy utilization efficiency (Xu et al., 2024). To address the dual uncertainty of renewable energy generation and load demand, the energy storage system (ESS) serves as a critical technological solution (Sepulveda et al., 2021). ESS has significant application value in power system reserve capacity support, transmission and distribution network optimization, and voltage-frequency regulation.
As an important development direction of chemical energy storage, hydrogen storage exhibits broad application prospects due to its significant advantages, including high energy density, low operation and maintenance costs, long-term storage capability, and environmental friendliness. Among them, power-to-hydrogen (P2H) technology has emerged as a highly promising energy storage solution because of its ability to operate independently and its freedom from time constraints. With continuous advancements in P2H technology, large-scale and cost-effective storage of surplus renewable energy through hydrogen production is becoming increasingly feasible. Research indicates that hydrogen production costs are primarily influenced by a combination of factors, including initial investment, operation and maintenance expenses, raw material prices, electricity costs, and other variable expenditures (Li et al., 2019). Notably, electricity costs account for more than 70% of the total hydrogen production cost (Timilsina, 2021). Utilizing low-cost renewable electricity can significantly reduce the share of electricity costs in hydrogen production and enhance economic feasibility. More importantly, using renewable electricity enables a zero-carbon emission process in power-to-hydrogen conversion (Pan et al., 2020). Existing studies confirm that producing hydrogen from municipal waste is not only cost-effective but also technically feasible (Hammond et al., 2020). According to the latest research by the International Renewable Energy Agency, renewable energy generation has a clear electricity price advantage over traditional coal-fired power generation. Therefore, utilizing renewable electricity from sources such as photovoltaic and wind power can effectively mitigate the issue of high electricity costs in hydrogen production.
The energy storage systems in the current power grid and integrated energy microgrid (IEM) primarily adopt a single-user service model. While this approach meets the customized needs of individual users, it lacks economic efficiency in large-scale energy storage applications. To address this limitation, the shared energy storage (SES) model has emerged, innovatively integrating energy storage technology with the concept of a shared economy (Kalathil et al., 2017), through optimized operational strategies, SES can provide flexible auxiliary services for renewable energy power plants and the grid, facilitating large-scale renewable energy integration while significantly enhancing the economic benefits of energy storage facilities. Under this model, prosumers can effectively reduce energy costs through resource sharing while improving power supply reliability. Compared with traditional distributed energy storage, user-side centralized energy storage integrates dispersed energy storage resources, enabling unified scheduling, centralized management, and coordinated maintenance, which significantly reduces operational costs. Existing research has made significant progress in the field of shared energy storage: Ma et al. (2022) constructs a bilateral optimization model between users and operators based on the cloud energy storage business model, providing an important reference for the decision-making optimization of shared energy storage operators (SESO). This study achieves efficient allocation and maximization of energy storage value through a systematic operational framework. Chen et al. (2022) proposes a shared energy storage station business model, demonstrating that users can significantly reduce operational costs through a sharing mechanism. Dai et al. (2021) develops a multi-microgrid collaborative management strategy that enhances both reliability and economic benefits through system interconnection. However, at the practical level, since SESO and IEM belong to different stakeholders, their complex game relationship poses challenges for coordinated system operation. Therefore, establishing a reasonable SESO-IEM collaborative operation mechanism can not only improve the local consumption capacity of distributed renewable energy but also stimulate microgrids’ intrinsic motivation to participate in energy sharing.
Current research focuses on the collaborative optimization of microgrid clusters with shared energy storage, primarily improving system operational efficiency through economic dispatch. Existing studies indicate that a collaborative operation mechanism based on shared energy storage can effectively reduce operating costs, achieving a win-win situation for both SESO and IEM. In terms of modeling approaches, shared energy storage models mainly adopt either non-cooperative game theory or cooperative game theory frameworks (He et al., 2021), providing a theoretical foundation for system optimization. Tushar et al. (2019) significantly enhances prosumer participation and strengthens the bargaining power of power grid user groups through an innovative incentive model. Alwesabi et al. (2022) proposes a collaborative optimization model for multiple microgrids, effectively solving the benefit distribution problem in interconnected systems using the Shapley value method. Zeng et al. (2023) optimizes the energy interaction mechanism between prosumers and consumers based on the social utility function and Nash bargaining model. Zhang et al. (2021) combines game theory with an auction pricing strategy to achieve optimal prosumer transactions based on day-ahead and real-time electricity price signals, significantly improving energy trading efficiency while enhancing social benefits. These studies provide an important theoretical foundation for the optimal operation of shared energy storage systems.
In summary, existing research has the following shortcomings: Current studies on shared energy storage mainly focus on single-form electrical energy storage, with relatively insufficient exploration of hydrogen-integrated multi-energy collaborative sharing. In terms of modeling approaches, most existing studies adopt a leader-follower game framework to construct collaborative optimization models for shared energy storage and multiple microgrids. However, this modeling approach, which prioritizes individual profit maximization, has significant limitations. Firstly, game participants tend to focus excessively on their own benefits, making it difficult to achieve overall system optimization. Secondly, this unidirectional decision-making mechanism severely restricts the bidirectional interaction efficiency between multi-microgrid systems and shared energy storage. On the other hand, multi-integrated energy microgrid systems typically use fixed electricity pricing mechanisms for energy transactions with the grid or shared energy storage, which significantly discourages system members from actively participating in demand response and energy interactions. Additionally, in the field of shared hydrogen storage research, existing studies mainly focus on optimizing storage capacity allocation or oversimplify the collaborative operation mechanism between hydrogen storage systems and multi-integrated energy microgrids. This prevents the full realization of the advantages of hydrogen-integrated multi-energy collaborative sharing. As a result, the synergistic value of hydrogen energy within integrated energy systems remains underexplored.
To address the shortcomings of existing research, this paper innovatively proposes a hybrid game-based collaborative optimization framework for shared multi-energy storage in multiple integrated energy microgrids (IEMs). By establishing a dynamic pricing mechanism, it simultaneously optimizes energy transaction prices, IEM operation strategies, and energy consumption behaviors, achieving a dual reduction in operating costs for both the Shared Energy Storage Operator (SESO) and IEMs. The main contributions and innovations of this paper are as follows:
1. A hybrid game-based optimization framework for shared multi-energy storage is constructed, innovatively characterizing the multi-level game relationships among SESO, the IEM aggregator, and individual IEMs. This framework enables the coordinated optimization of energy storage resource allocation efficiency and system stability.
2. A multi-energy collaborative pricing mechanism is designed to dynamically optimize the prices of electricity, heat, and hydrogen, significantly reducing the operating costs of SESO and IEMs. This mechanism integrates time-of-use energy price signals, effectively guiding the IEM aggregator in optimizing energy transaction strategies and improving overall energy utilization efficiency.
3. A bi-level optimization solution strategy is proposed: the lower-level problem is decomposed into two subproblems—coalition cost optimization and inter-microgrid transaction settlement. A cooperative game-based revenue allocation model is established, and a novel GA-ADMM hybrid algorithm is employed for solving the problem. This approach ensures convergence while enhancing computational efficiency.
2 Integrated energy multi-microgrid system with centralized shared multi-energy storage
2.1 Structure of the shared multi-energy storage system in integrated energy multi-microgrid
The shared framework constructed in this paper takes the shared multi-energy storage station and the IEM aggregate as the core participants, achieving coordinated sharing of electricity, heat, and hydrogen energy. With the rapid development of P2H technology, hydrogen is gaining increasing application due to its significant emission reduction characteristics. The hydrogen energy system demonstrates unique advantages in enhancing the flexibility of energy systems: on one hand, it enables large-scale and economical storage of excess renewable energy through P2H technology; on the other hand, it provides a crucial low-carbon energy carrier for integrated energy systems. This dual value makes hydrogen an increasingly important player in the energy transition.
The multi-agent collaborative operation framework constructed is shown in Figure 1. The main participants include the upper-level power grid, heating network, natural gas network, SESO, and the IEM aggregate. Within the IEM aggregate, multiple energy forms, including electricity, heat, gas, and hydrogen, are integrated. Through the coordinated operation of various energy conversion and storage devices, along with energy interactions with the external power grid, heating network, and natural gas network, the internal load demand of the system is fully met (Chen et al., 2024). In terms of the operational mechanism, the IEM aggregate establishes a bidirectional electricity trading mechanism with SESO: when IEM generates excess renewable energy, it can sell electricity to SESO. SESO, through a dynamic pricing mechanism, distributes electricity to other demand parties. This model effectively promotes local consumption of renewable energy and reduces dependence on the distribution network. The IEM aggregate is equipped with a comprehensive energy conversion device system, mainly including wind and solar renewable energy generation units, hydrogen-blended gas turbines (HGT), hydrogen-blended gas boilers (HGB), methane reactors (MR), and carbon capture and storage (CCS) devices (Li et al., 2023; Luo et al., 2024; Gao et al., 2024). Each IEM member optimizes its energy trading strategy and equipment operation plan based on its own energy supply and demand characteristics to achieve a balanced supply of electricity, heat, and hydrogen. The natural gas required by HGT and HGB is directly procured from natural gas suppliers by the IEM.
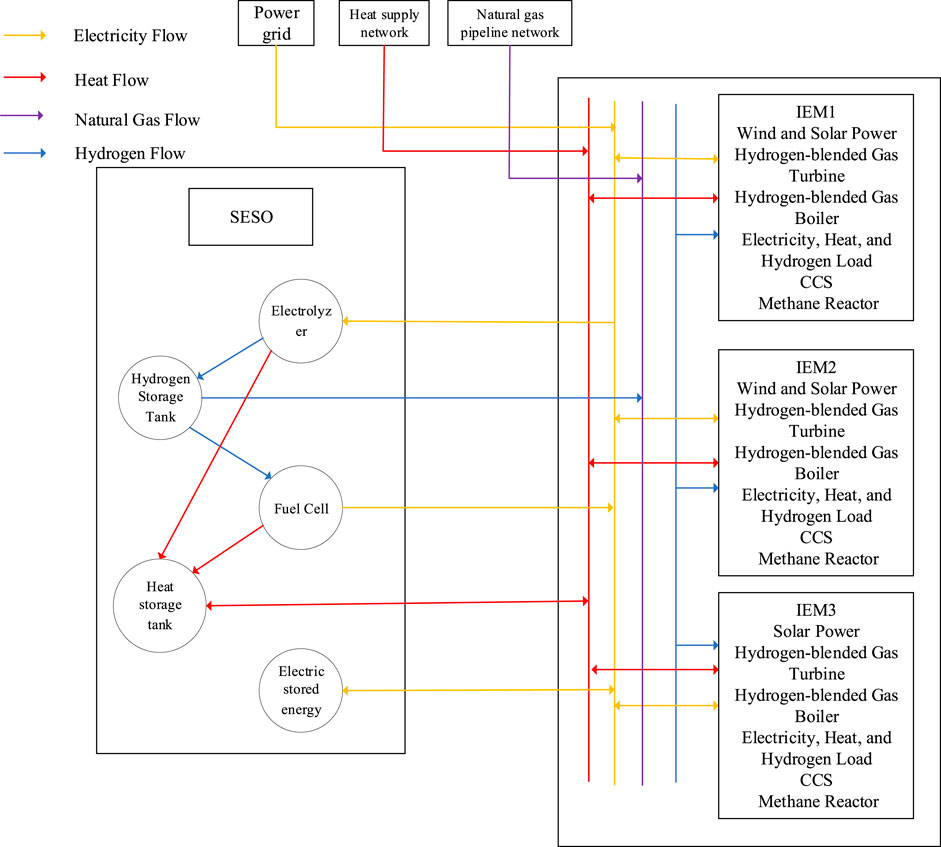
Figure 1. Schematic diagram of the multi-microgrid shared multi-energy storage power station system.
The specific energy conversion models in energy storage and integrated energy systems can be found in Supplementary Appendix A.
The energy trading framework constructed in this paper is shown in Figure 2. SESO, as the system coordinator, is responsible for setting the electricity, heat, and hydrogen trading prices for the IEM aggregation. In terms of operational mechanisms, IEM members prioritize achieving energy balance through internal transactions: members with excess energy first sell the surplus to internal demand sides, and the remaining portion is sold to SESO at a price; members with insufficient energy prioritize purchasing from within the aggregation, and the gap is then filled by purchasing from SESO, and if still insufficient, they purchase from the external grid, heat network, or natural gas pipeline. SESO generates operational revenue through electricity, heat trading, and hydrogen sales, while IEM reduces carbon emission costs by deploying CCS, MR, and other equipment. This framework innovatively achieves triple optimization: 1) enhancing system flexibility through hydrogen utilization; 2) reducing environmental costs with carbon capture technology; 3) improving overall economy based on a sharing mechanism, ultimately forming a win-win energy trading model for multiple parties.
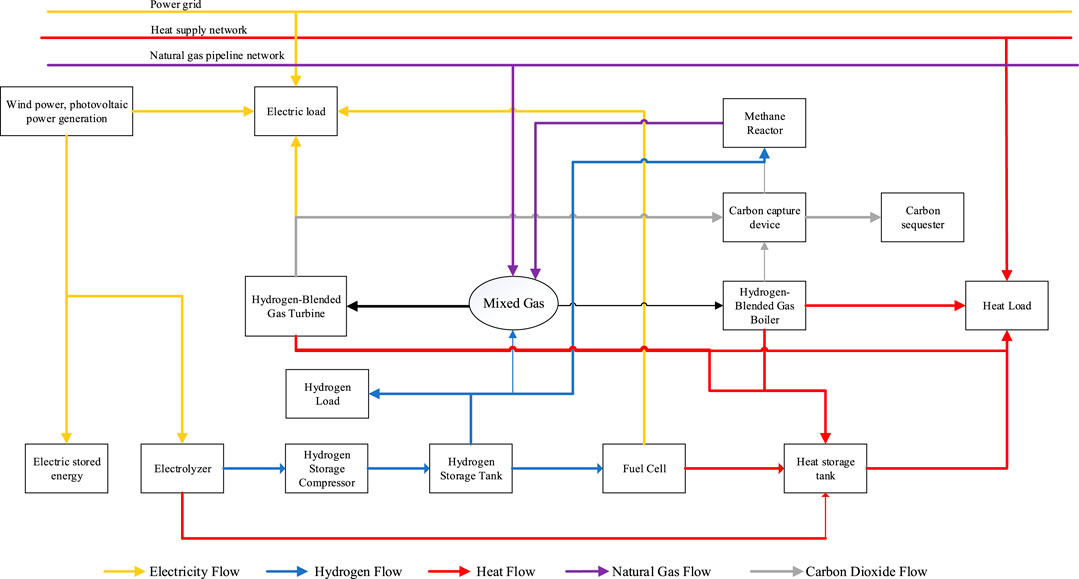
Figure 2. Schematic diagram of the electricity, heat, and hydrogen combined supply microgrid structure participating in the shared multi-energy storage power station service.
2.2 Hybrid game optimization framework
As shown in Figure 3, the SESO-IEM aggregation collaborative optimization model proposed in this paper adopts a two-tier game framework, achieving two-level collaborative optimization through a dynamic feedback mechanism. While ensuring the autonomy of decision-making for each entity, it uses price signals to promote overall system optimization, providing an effective decision-support tool for multi-energy sharing.
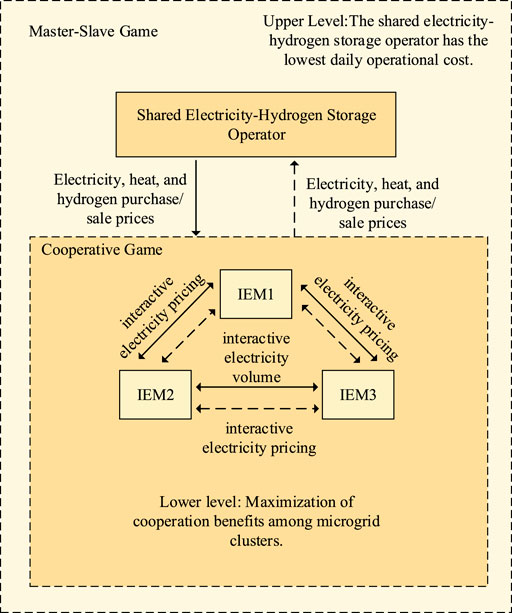
Figure 3. Hybrid game-theoretic optimization framework.
The two-way interactive hierarchical solution architecture adopted by the optimization model is as follows: In the upper-level dominant layer, a leader-follower game model is constructed, where SESO aims to minimize operational costs. SESO dynamically adjusts its pricing strategy based on the electricity, heat, and hydrogen purchase-sale quantities and strategies feedback from the IEM aggregation, and transmits the optimized electricity price, heat price, and hydrogen sale price parameters to the collaborative layer of the IEM aggregation. In the collaborative layer, a cooperative game model is established, where each sub-microgrid optimizes its internal energy trading plan with the goal of minimizing system collaborative costs, based on the price parameters issued from the dominant layer. This ensures the maximization of cooperative benefits while safeguarding individual interests. The updated energy demand information is then fed back to the dominant layer to complete the closed-loop optimization. This two-way coupled hierarchical architecture achieves both system-wide and localized collaborative optimization through a dynamic pricing mechanism. In the lower-level collaborative layer game, based on Nash bargaining theory, the problem is decomposed into two subproblems: maximizing aggregation benefits and distributing revenues. By analyzing actual electricity trading data, fair distribution of cooperative gains is achieved, and electricity trading prices between IEMs are determined.
The hybrid game mechanism achieves multi-agent collaborative decision-making through hierarchical optimization. The upper-level leader-follower game ensures the balance of interests between the ESO and the IEM aggregation, while the lower-level cooperative game, based on Nash bargaining theory, ensures fair revenue distribution among IEM members. This dual-layer structure not only considers the decision-making autonomy of entities at different levels but also achieves collaborative optimization of the entire system, providing an effective decision-making framework for multi-energy storage sharing.
3 Hybrid game bi-level optimization model
3.1 Upper-level objective function
SESO, as the leader in the leader-follower game, aims to minimize its own daily operational costs. In response to the energy purchase-sale plans requested by the follower IEM aggregation, SESO formulates the corresponding time-of-use energy prices. The upper objective function is shown in Equation 1:
here,
1) Daily investment and maintenance costs of SESO are shown in Equation 2 (Cui et al., 2021):
here,
2) Revenue from electricity transactions between SESO and the IEM coalition on a typical day:
In the equation,
3) Revenue from heat energy transactions between SESO and the IEM coalition on a typical day is shown in Equation 4:
here,
4) Revenue from hydrogen sales by SESO to the IEM coalition on a typical day is shown in Equation 5:
here,
5) Service fees collected by SESO from the IEM coalition on a typical day are shown in Equation 6:
here,
3.2 Upper-level constraints
1) Shared multi-energy storage capacity constraints
Electric energy storage capacity constraints are shown in Equation 7 (Tengfei et al., 2020):
where
Thermal storage equipment constraints are shown in Equation 8:
here,
Hydrogen storage tank balance constraints: In the modeling process, this paper considers the pressure variation characteristics of high-pressure hydrogen storage tanks during hydrogen charging and discharging. Meanwhile, based on simplified model assumptions, the effect of temperature variation is neglected, leading to the balance described in Equation 9:
where
2) Price Constraints
The purchasing price and selling price set by SESO should satisfy Equation 10:
here,
3) Power Balance Constraints (Pan et al., 2020). The power balance constraints are shown in Equation 11.
3.3 lower-level model objective function
In the proposed game framework, the IEM aggregation, as the follower, responds to the energy pricing strategies set by SESO (Wang et al., 2024a), including electricity purchase-sale prices, heat purchase-sale prices, and hydrogen sale prices. By optimizing the trading combination of electricity, heat, and hydrogen while coordinating internal unit output and energy interactions among members, the IEM aggregation ultimately feeds back the optimized results to SESO, forming a closed-loop decision-making process. Each IEM member aims to maximize overall benefits, and its optimization model integrates multiple economic factors, including energy trading revenue, demand response compensation, energy storage operation and maintenance costs, natural gas procurement expenses, equipment operation and maintenance costs, renewable energy curtailment penalties, and carbon trading costs. This approach enables comprehensive economic evaluation and optimization.
The daily operating cost of the multi-integrated energy microgrid system with heat, electricity, and hydrogen cogeneration based on SESO services is minimized:
here,
1) The trading revenue with SESO includes the purchase and sale of electricity, heat, and hydrogen costs is shown in Equation 13:
2) The demand response cost of IEMi, for incentive-based electricity and heat demand response, is primarily influenced by the transferable and reducible load (Doan et al., 2021) as shown in Equation 14:
where
3) The natural gas purchase cost is shown in Equation 15 (Wang et al., 2022):
here,
4) Wind and solar curtailment penalty cost: This penalty mechanism is used to quantify the economic losses caused by the ineffective use of renewable energy, thus incentivizing system optimization scheduling to improve the utilization of wind and solar energy. The penalty function is shown in Equation 16:
here,
5) Ladder-style carbon trading and carbon sequestration costs as shown in Equation 17 (Wang et al., 2024b):
The allocation of carbon quotas is mainly carried out free of charge. Given that HGT and HGB are the primary sources of carbon emissions, the actual carbon emission quota of IEMi can be expressed as shown in Equations 18–20:
where
Considering the CO2 capture capacity of CCS, the actual carbon emissions of IEMi are shown in Equation 21:
where
in Equation 22, ettrad is the actual carbon emissions rights participating in the carbon trading market. In Equation 23
In Equation 24,
6) The equipment operation and maintenance costs include HGT, HGB, MR, and CCS:
In Equation 25,
7) Transaction costs with the power grid and heat network:
In Equation 26,
8) Service fee for IEM using the shared energy storage system is shown in Equation 27.
3.4 Lower-level model constraints
The operational optimization of the IEM aggregation system must satisfy multiple constraints, including maintaining the supply-demand balance of electricity, heat, hydrogen, and natural gas, equality constraints for electricity trading among IEMs, as well as inequality constraints such as load demand response, equipment operating limits, external network energy purchase power, and SESO interaction power. These constraints collectively define the feasible region for system operation, ensuring real-time balance across energy networks while maintaining the stable operation of equipment within safe limits, thus providing essential boundary conditions for optimization decisions.
1) Electric power balance constraint is shown in Equation 28:
where
2) Thermal power balance constraint is shown in Equation 29:
here,
3) Hydrogen Energy Balance Constraint is shown in Equation 30:
here,
4) Natural gas balance constraint is shown in Equation 31:
where
5) Electricity trading constraints between IEMs: P2P electricity trading must remain within the transaction volume limits, while also ensuring that the trading volume between IEM members is equal:
in Equation 32
6) IEM equipment output constraints:
in Equation 33
7) Demand response constraints (Tushar et al., 2019):
in Equation 34
8) Constraints on IEM’s power purchase from the electricity grid, heat network, and natural gas network:
in Equation 35
9) Constraints on the power purchase and sale between IEM and SESO.
in Equation 36
3.5 Integrated energy microgrid aggregation nash bargaining model
The IEM aggregation faces dual optimization objectives when responding to SESO’s upper-level decisions: on one hand, it needs to minimize the overall operating costs of the aggregation, and on the other hand, it must coordinate the benefit distribution among its members. To address this complex decision-making environment, this paper designs a benefit distribution scheme that balances fairness and efficiency based on Nash bargaining theory (Jing et al., 2022). This scheme establishes a win-win interest coordination mechanism, which ensures the basic benefits of each member while effectively enhancing the overall operational efficiency of the aggregation:
here,
1) Problem 1: IEM alliance cost minimization, i.e., Equation 12.
In the absence of considering internal transaction costs within the IEM aggregation, the minimum operating costs of each IEM are difficult to determine directly. This is because the energy transaction volumes between members within the aggregation offset each other at the system level, making it impossible to directly calculate the internal transaction prices. Therefore, after solving the leader-follower game equilibrium, the electricity trading prices within the alliance need to be further determined through subproblem 2. This optimization step ensures that, under the premise of overall cost optimization, the energy transaction values between IEM members can be reasonably quantified.
2) Energy transaction payments between IEMs:
in Equation 38
in Equation 39,
4 Solution method for the hybrid game bi-level optimization model
This paper constructs a two-stage collaborative optimization framework, modeled and solved using a leader-follower and cooperative hybrid game approach. In this framework, SESO acts as the leader in the leader-follower game, while the IEM aggregation participates in the cooperative game. The scheduling model solution involves a mixed-integer linear programming problem, where the leader-follower game is solved using GA, and the cooperative game is solved using ADMM. These two methods work together to solve the entire bi-level optimization model (Qiao et al., 2023). This hybrid solution approach ensures both computational efficiency and the rationality of the optimization results. The solution process is shown in Figure 4, and the detailed transformation process can be found in Supplementary Appendix B.
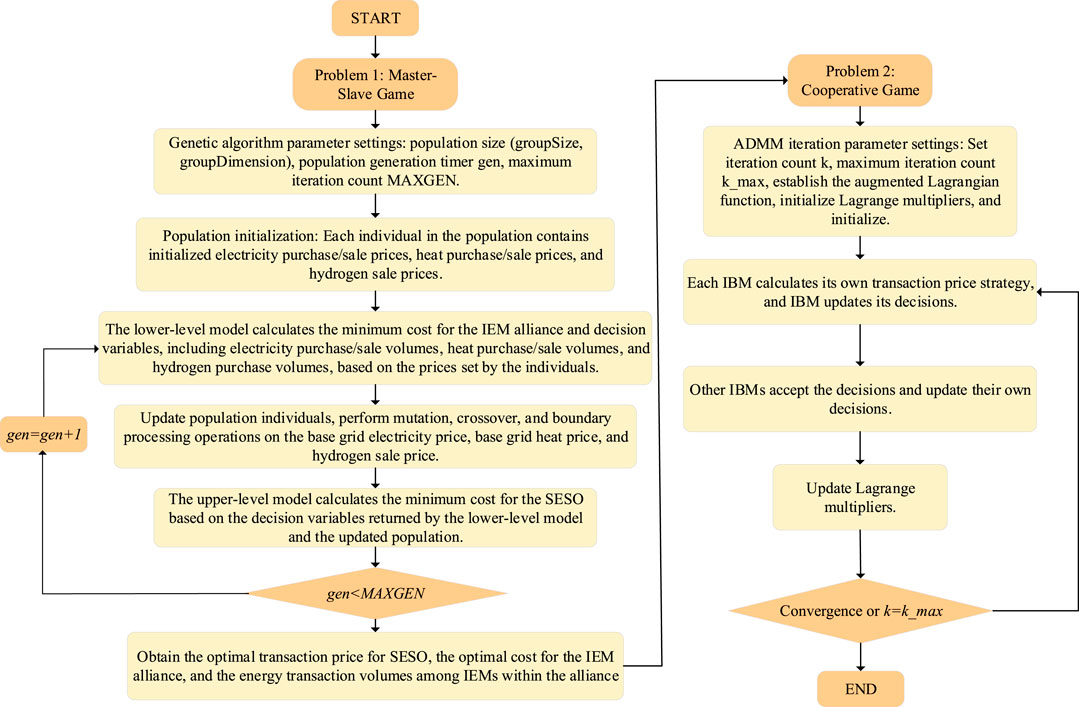
Figure 4. Solution process of the hybrid game bi-level model based on GA and ADMM.
5 Case study
To verify the effectiveness of the proposed hydrogen storage-integrated multi-microgrid scheduling method considering hybrid games, simulations were conducted on the MATLAB 2023a platform using the GUROBI solver. The model was solved by combining GA and ADMM algorithms. IEM1 and IEM2 include both wind turbine (WT) and photovoltaic (PV) units, while IEM3 only contains PV units. Each IEM is equipped with identical HGT, HGB, MR, and CCS. The electricity price follows a time-of-use pricing mechanism, and the natural gas price is set at 2.93 CNY/m3. It is assumed that transferable loads account for 20% of the total load, with upper limits of 900 kW for transferable electricity loads and 1,400 kW for transferable thermal loads. Hydrogen energy is uniformly converted into kW for calculation. The initial electricity, heat, and hydrogen loads of each IEM aggregation, as well as wind and solar output, grid electricity prices, energy conversion coefficients, and equipment parameters, are detailed in Supplementary Appendix C.
5.1 Algorithm convergence analysis
Figure 5 presents the iterative convergence results of SESO and IEM aggregation costs in Subproblem 1. By analyzing the curves in the figure, it can be observed that the proposed algorithm successfully converges after 16 iterations. The SESO cost decreases rapidly in the initial stage and then stabilizes, indicating that the algorithm can quickly approach the optimal solution. Figure 6 shows the iterative convergence results of the residual curve for transaction prices in Subproblem 2. The algorithm successfully converges to a residual value below 0.001 after 32 iterations. The curve in the figure exhibits a stable downward trend, further demonstrating the convergence and stability of the algorithm. In summary, the proposed optimization algorithm exhibits excellent convergence characteristics and computational efficiency in solving both subproblems.
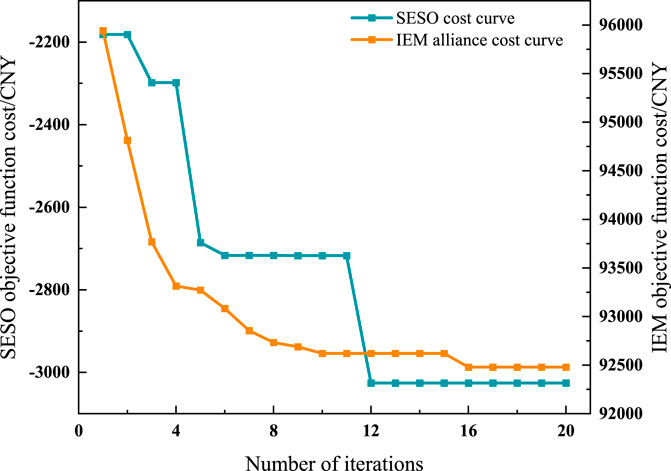
Figure 5. The iteration convergence results of SESO cost and IEM alliance cost.
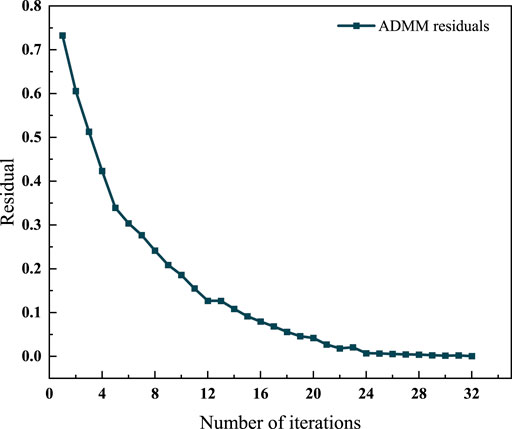
Figure 6. ADMM iteration convergence results.
5.2 The optimization results of different schemes
To validate the effectiveness of the proposed model, five different schemes are designed to compare and analyze the operating costs of the SESO and the IEM alliance: Scheme 1: The IEM alliance and the SESO participate in a leader–follower game; members within the IEM alliance engage in cooperative games. All devices in the thermal and hydrogen energy systems are included. Scheme 2: The IEM alliance and the SESO participate in a leader–follower game; members within the IEM alliance engage in cooperative games. The thermal and hydrogen energy systems are excluded. Scheme 3: The IEM alliance and the SESO do not participate in a leader–follower game; members within the IEM alliance engage in cooperative games. All devices in the thermal and hydrogen energy systems are included. Scheme 4: The IEM alliance and the SESO participate in a leader–follower game; members within the IEM alliance do not engage in cooperative games. All devices in the thermal and hydrogen energy systems are included. Scheme 5: The IEM alliance and the SESO do not participate in a leader–follower game; members within the IEM alliance do not engage in cooperative games. All devices in the thermal and hydrogen energy systems are included.
When the IEM alliance and the SESO do not participate in the leader–follower game, the SESO’s electricity selling price follows the grid’s time-of-use pricing, with the electricity purchase price set at 0.35 CNY/kWh, the thermal energy purchase price set at 0.3 CNY/kWh, and the hydrogen selling price at 1.2 CNY/kWh. Comparing Schemes 1 and 2 verifies the effectiveness of including the hydrogen energy system in the model, while comparing Schemes 1, 3, 4, and 5 validates the effectiveness of the hybrid game model. The system optimization results under different schemes are shown in Table 1.
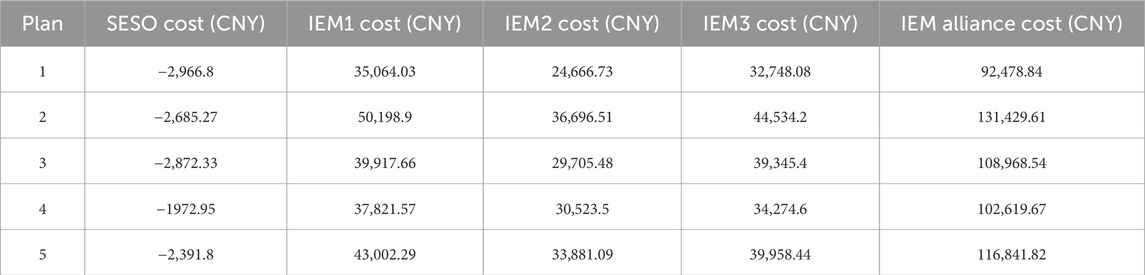
Table 1. Cost and benefit analysis before and after cooperation.
A comparison between Schemes 1 and 2 in Table 1 reveals that the integration of thermal and hydrogen energy reduces the total operating cost of the IEM alliance by 29.6%, while the SESO’s revenue increases by 10.5%. Additionally, the operating costs of individual IEM members are more evenly reduced. This demonstrates that the integration of electricity, thermal, and hydrogen energy—through cross-period energy storage and multi-energy supply—effectively mitigates the intermittency of wind and solar power. It confirms the significant advantages of electric-thermal-hydrogen synergy in enhancing system economic performance and renewable energy utilization. Compared with the conventional single-energy storage system in Scheme 2, the multi-energy storage approach shows clear potential for cost optimization.
A comparison among Schemes 1, 3, and 5 indicates that the hybrid game reduces the total IEM operating cost by 20.8% compared to Scheme 5 and by 15.1% compared to Scheme 3. The leader–follower game layer facilitates coordinated optimization between SESO and IEM through dynamic pricing, while the cooperative game ensures fair transactions among microgrids. The synergy of both mechanisms avoids the short-sighted decisions typical of a single game model.
Furthermore, comparing Schemes 1, 4, and 5 shows that the cooperative game, implemented via Nash bargaining, optimizes internal electricity trading. It prevents local conflicts of interest as seen in Scheme 4, and significantly improves the overall efficiency of the IEM alliance.
5.3 Power balance analysis
Taking IEM2, which includes wind and solar power generation, as an example, Figure 7 illustrates the optimized operation of electricity, heat, and hydrogen power within the integrated energy microgrid. By analyzing the power distribution of different energy forms, the dynamic balance between renewable energy generation and electricity, heat, and hydrogen loads can be clearly observed. During periods of high wind and solar power output, the system prioritizes the use of renewable energy to meet electricity and heat demands. Excess energy is either stored through electricity sales to SESO or converted into hydrogen via electrolysis for storage. Conversely, during periods of low renewable generation, the system compensates for power shortages by purchasing stored electricity and hydrogen from SESO or utilizing HGT and HGB. This optimization strategy not only improves the utilization rate of renewable energy but also enhances energy efficiency and ensures stable system operation. From Figure a, it can be observed that between 07:00 and 17:00, the increase in photovoltaic generation leads to a higher overall renewable energy output. As a result, the output of HGT is partially reduced, and IEM2 engages in significant electricity sales to SESO and other IEMs, facilitating the storage and utilization of surplus energy. However, during 03:00–05:00 and 18:00–22:00, the system primarily relies on HGT generation and external electricity purchases to maintain balance.
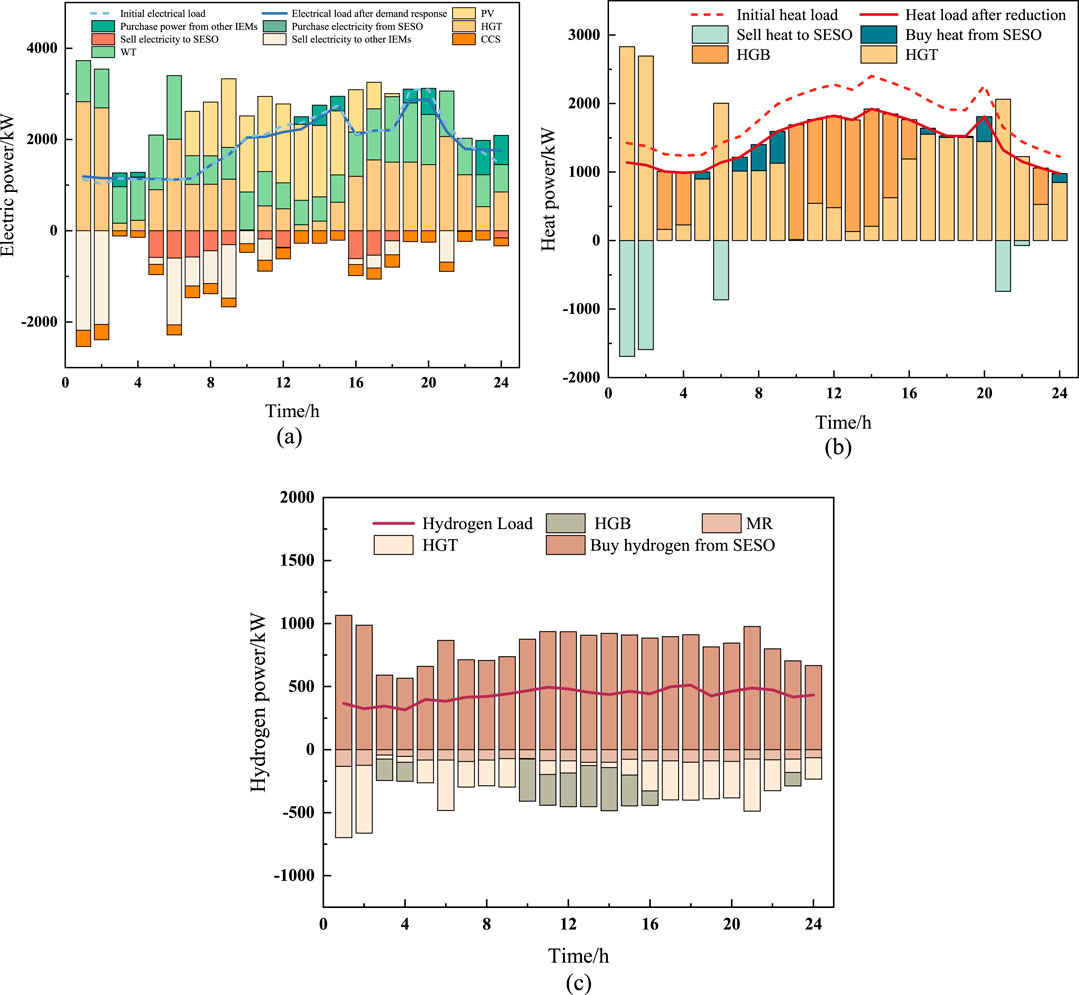
Figure 7. IEM2 Electricity, Heat, and Hydrogen Power Balance. (a) Electric power balance. (b) Heat power balance. (c) Hydrogen power balance.
Figure b illustrates that the heat power balance of IEM2 mainly relies on HGT and HGB as the primary sources of heat energy. Due to the significant increase in photovoltaic output during the daytime, the output of HGT decreases, and thus HGB serves as a supplementary heat source to fill the heat energy gap. From 10:00 to 16:00, the operation of HGB significantly increases to ensure heat supply balance. On the other hand, the reduced heat load curve shows that through demand response and load adjustment, part of the heat load is reduced, thereby alleviating the scheduling pressure of heat energy. This peak-shaving and valley-filling strategy significantly improves heat energy balance and enhances system flexibility and economic efficiency. From Figure c, it can be seen that after SESO converts the excess electricity from the IEM alliance into hydrogen storage, IEM2 purchases hydrogen from SESO to meet the system’s hydrogen energy demand. Calculations show that the utilization of hydrogen by HGT and HGB effectively reduces the system’s carbon cost, and the system achieves a stable matching of hydrogen energy supply and demand.
5.4 Energy trading analysis
When SESO and the IEM aggregate participate in the leader-follower game, the IEM aggregate needs to determine its electricity and heat energy purchase/sale plans as well as its hydrogen purchase plan based on the time-of-use electricity and heat prices and the hydrogen sale price set by SESO. When the IEM aggregate members participate in the cooperative game, they need to determine the electricity trading price. The electricity purchase and sale prices set by SESO are shown in Figures 8–10.
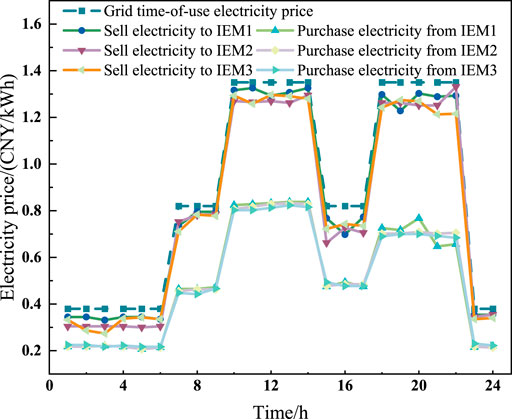
Figure 8. The electricity purchase and sale prices set by the SESO.
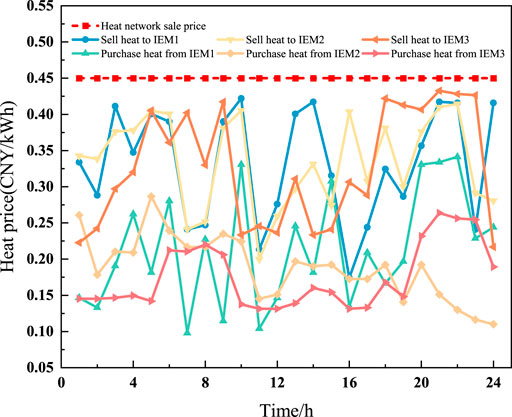
Figure 9. The heat purchase and sale prices set by the SESO.
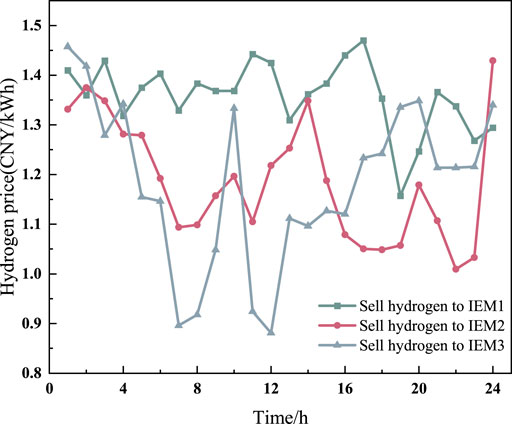
Figure 10. The hydrogen purchase price set by the SESO.
From Figures 8–10, it can be observed that SESO generally purchases electricity during low-price periods, such as from 00:00 to 06:00 and 23:00 to 24:00, and performs electricity-hydrogen energy storage to reduce operational costs. The low electricity price reflects the market condition of oversupply and low demand when wind and solar power generation are high. SESO encourages the IEM alliance to purchase electricity from the energy storage side by lowering the electricity price, balancing the grid load. From 15:00 to 21:00, during peak load hours, due to increased load demand, the renewable energy output within the IEM alliance cannot fully meet the load demand. The IEM alliance may need to purchase a large amount of electricity from SESO’s energy storage side and the distribution network to meet internal needs. The high electricity price reflects a market condition of tight electricity supply and increased demand. Therefore, during this period, SESO adjusts the supply-demand balance by raising the electricity price while encouraging the IEM alliance to reduce electricity consumption or release energy storage.
The heat energy of each member in the IEM aggregate is mainly produced by HGT and HGB, as well as purchased from SESO and the heat network. The fluctuations in heat energy purchase and sale prices are relatively consistent, with SESO primarily serving as a heat energy regulator. When heat demand is low, IEM members reduce heat production, lower the operating load of HGT and HGB, and store excess heat energy in SESO’s thermal storage tank for use during high-demand periods.
As shown further in Figure 10, the hydrogen purchase prices set by the SESO exhibit relatively high volatility, with significant differences among IEM members across different time periods. This is mainly because hydrogen production relies on the electrolysis process, whose cost is directly influenced by electricity prices and system load, while also being affected by the storage capacity and the dynamic hydrogen demand of each IEM. Low hydrogen purchase prices are mainly concentrated during nighttime and midday periods with high photovoltaic output, reflecting the SESO’s strategy to incentivize hydrogen purchases and storage when renewable energy is abundant. Conversely, during periods of high demand or tight power supply, hydrogen prices rise significantly, encouraging IEMs to reduce hydrogen usage or release stored hydrogen. This enhances the system’s flexibility and enables the spatial and temporal optimization of hydrogen energy resources.
While SESO sets the time-of-use electricity, heat, and hydrogen prices and the IEM aggregate formulates energy purchase and sale plans, the internal members of the IEM aggregate determine their electricity interaction plans. The electricity trading results among IEM members are shown in Figure 11. Since IEM1 and IEM2 contain wind and photovoltaic (PV) units, while IEM3 only has PV units, electricity trading follows a dynamic pattern based on generation and demand fluctuations. During the low-load periods from 00:00–06:00 and 23:00–24:00, IEM1 and IEM2’s wind turbines generate high electricity output due to strong nighttime winds, while IEM3’s PV units do not generate power at night. At the same time, IEM2’s load is relatively low, making it unable to fully consume its generated electricity, whereas IEM1 has a higher load demand. As a result, IEM1 and IEM3 need to purchase electricity from IEM2 to meet their base load. Between 10:00–15:00, IEM1 experiences an excess of solar and wind generation and thus sells electricity to IEM2 and IEM3. From 15:00–21:00, which corresponds to peak load periods, the renewable energy output of IEM members is insufficient to fully meet demand. Consequently, the IEM aggregate purchases a large amount of electricity from SESO and the distribution network to ensure the system’s load requirements are met.
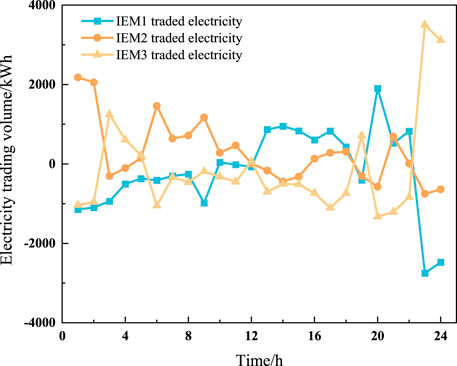
Figure 11. Electricity interaction results between IEMs.
Figure 12 illustrates the electricity trading prices among IEMs after cooperative bargaining. The pricing strategy effectively reflects the system’s supply-demand characteristics and the spatiotemporal distribution of energy. During the 00:00–06:00 and 23:00–24:00 periods, due to surplus wind power in IEM2 and no photovoltaic output in IEM3, a low-price trading interval of approximately 0.25 CNY/kWh emerges, promoting nighttime wind power utilization. In contrast, during peak load periods, prices rise significantly—accurately reflecting the true cost of power supply—while still maintaining a cooperative advantage by staying below the retail grid price. This enables both cost savings and benefit sharing within the alliance. The time-of-use pricing mechanism, based on supply-demand response and supported by Nash bargaining, ensures trading stability and facilitates coordinated optimization of power resources among microgrids with different energy structures.
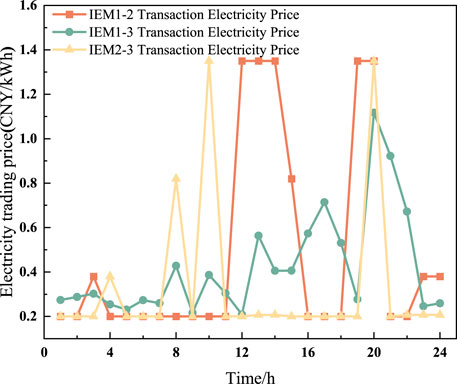
Figure 12. Electricity trading prices between IEMs after cooperative game.
5.5 Energy allocation and profit distribution analysis
The key to the stable operation of the IEM alliance is whether the profit distribution generated by the cooperation in electricity and heat trading among the IEM alliance members is fair. As shown in Figure 8, IEM2 takes on a significant amount of energy and plays a leading role in the transactions. Without considering its leading role, the alliance would not be able to operate. The profit distribution method based on symmetric bargaining does not take into account the contributions of each IEM member to the alliance. As shown in Table 2, the asymmetric bargaining method based on comprehensive bargaining power proposed in this paper can determine the contributions (i.e., bargaining power) of each IEM member. IEM2 has undertaken a large amount of energy in the energy transactions, thus receiving the highest bargaining power. It can be seen that the asymmetric bargaining profit distribution method improves the profits of each IEM member and effectively enhances the stability of the alliance’s cooperation.
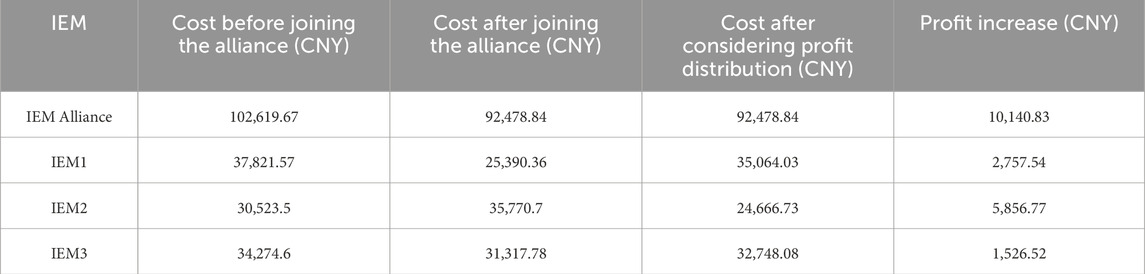
Table 2. Cost and benefit analysis before and after cooperation.
6 Conclusion
The hybrid game model constructed between the SESO and the IEM aggregator coordinates SESO pricing and IEM response mechanisms through a leader–follower game, and incorporates cooperative game theory and Nash bargaining to optimize energy scheduling and benefit allocation under electricity–heat–hydrogen multi-energy coordination. The results show that: 1) The integration of hydrogen storage significantly enhances multi-energy coordination and renewable energy utilization, lowers the cost of hydrogen use, and demonstrates strong potential for supporting the development of the hydrogen energy industry; 2) The P2P collaborative trading mechanism among microgrids effectively reduces operating costs, increases system flexibility, and improves renewable energy utilization efficiency; 3) The time-of-use pricing mechanism based on hybrid game theory enables dynamic optimization of electricity, heat, and hydrogen across multiple time periods, fully leveraging the regulation potential of energy storage and greatly improving economic performance. The proposed model enhances the benefits of all participants while achieving a win–win outcome and ensuring both fairness in internal IEM benefit distribution and overall system efficiency.
This study focuses on flexible hydrogen supply scheduling and does not consider hydrogen transport routes or cost differences. Future work may introduce a full life-cycle cost model for hydrogen to further explore its economic viability and optimization potential in integrated energy systems.
Data availability statement
The raw data supporting the conclusions of this article will be made available by the authors, without undue reservation.
Author contributions
HZ: Conceptualization, Data curation, Formal Analysis, Investigation, Methodology, Project administration, Resources, Software, Validation, Visualization, Writing – original draft, Writing – review and editing. JW: Formal Analysis, Funding acquisition, Investigation, Resources, Supervision, Validation, Writing – review and editing.
Funding
The author(s) declare that no financial support was received for the research and/or publication of this article.
Conflict of interest
Author JW was employed by State Grid Zhejiang Electric Power Co., Ltd. and Zhoushan Power Supply Company.
The remaining author declares that the research was conducted in the absence of any commercial or financial relationships that could be construed as a potential conflict of interest.
Generative AI statement
The authors declare that no Generative AI was used in the creation of this manuscript.
Publisher’s note
All claims expressed in this article are solely those of the authors and do not necessarily represent those of their affiliated organizations, or those of the publisher, the editors and the reviewers. Any product that may be evaluated in this article, or claim that may be made by its manufacturer, is not guaranteed or endorsed by the publisher.
Supplementary material
The Supplementary Material for this article can be found online at: https://www.frontiersin.org/articles/10.3389/fenrg.2025.1602891/full#supplementary-material
References
Alwesabi, Y., Flanagan, M., Kires, K., Tucci, M., Weiner, S., and Wang, Y. (2022). “Smart energy storage sharing in residential buildings,” in 2022 2nd International Conference on Emerging Smart Technologies and Applications (eSmarTA), Ibb, Yemen, 25-26 October 2022 (IEEE), 1–6.
Chen, C., Li, Y., Qiu, W., Liu, C., Zhang, Q., Li, Z., et al. (2022). Cooperative-game-based day-ahead scheduling of local integrated energy systems with shared energy storage. IEEE Trans. Sustain. Energy 13 (4), 1994–2011. doi:10.1109/tste.2022.3176613
Chen, Y., He, S., Wang, W., Yuan, Z., Cheng, J., Cheng, Z., et al. (2024). Optimization strategy for shared energy storage operators-multiple microgrids with hybrid game-theoretic energy trading. Processes 12 (1), 218. doi:10.3390/pr12010218
Cui, S., Wang, Y. W., Liu, X. K., Wang, Z., and Xiao, J. W. (2021). Economic storage sharing framework: asymmetric bargaining-based energy cooperation. IEEE Trans. Industrial Inf. 17 (11), 7489–7500. doi:10.1109/tii.2021.3053296
Dai, R., Esmaeilbeigi, R., and Charkhgard, H. (2021). The utilization of shared energy storage in energy systems: a comprehensive review. IEEE Trans. Smart Grid 12 (4), 3163–3174. doi:10.1109/tsg.2021.3061619
Doan, H. T., Cho, J., and Kim, D. (2021). Peer-to-peer energy trading in smart grid through blockchain: a double auction-based game theoretic approach. IEEE Access 9, 49206–49218. doi:10.1109/access.2021.3068730
Gao, X., Wang, S., Sun, Y., Zhai, J., Chen, N., and Zhang, X. P. (2024). Low-carbon energy scheduling for integrated energy systems considering offshore wind power hydrogen production and dynamic hydrogen doping strategy. Appl. Energy 376, 124194. doi:10.1016/j.apenergy.2024.124194
Hammond, G. P., Owen, R. E., and Rathbone, R. R. (2020). Indicative energy technology assessment of hydrogen processing from biogenic municipal waste. Appl. Energy 274, 115329. doi:10.1016/j.apenergy.2020.115329
He, X., Xiao, J. W., Cui, S. C., Liu, X. K., and Wang, Y. W. (2021). A new cooperation framework with a fair clearing scheme for energy storage sharing. IEEE Trans. Industrial Inf. 18 (9), 5893–5904. doi:10.1109/tii.2021.3137823
Jing, Y., Zhiqiang, D., Jiemai, G., Siyuan, C., Bing, Z., and Yajie, W. (2022). Coordinated control strategy of electricity-heat-gas integrated energy system considering renewable energy uncertainty and multi-agent mixed game. Front. Energy Res. 10, 943213. doi:10.3389/fenrg.2022.943213
Kalathil, D., Wu, C., Poolla, K., and Varaiya, P. (2017). The sharing economy for the electricity storage. IEEE Trans. Smart Grid 10 (1), 556–567. doi:10.1109/tsg.2017.2748519
Li, J., Lin, J., Zhang, H., Song, Y., Chen, G., Ding, L., et al. (2019). Optimal investment of electrolyzers and seasonal storages in hydrogen supply chains incorporated with renewable electric networks. IEEE Trans. Sustain. Energy 11 (3), 1773–1784. doi:10.1109/tste.2019.2940604
Li, X., Chen, L., Hao, Y., Wang, Z., Changxing, Y., and Mei, S. (2023). Sharing hydrogen storage capacity planning for multi-microgrid investors with limited rationality: a differential evolution game approach. J. Clean. Prod. 417, 138100. doi:10.1016/j.jclepro.2023.138100
Luo, L., Chen, T., Hua, M., Wang, C., Liu, L., Wang, Y., et al. (2024). “Optimal scheduling of virtual power plants considering P2G-CCS coupling and stepped carbon price,” in 2024 6th International Conference on Electrical Engineering and Control Technologies (CEECT), Shenzhen, China, 20-22 December 2024 (IEEE), 486–491.
Ma, Y., Hu, Z., and Song, Y. (2022). Hour-ahead optimization strategy for shared energy storage of renewable energy power stations to provide frequency regulation service. IEEE Trans. Sustain. Energy 13 (4), 2331–2342. doi:10.1109/tste.2022.3194718
Pan, G., Gu, W., Lu, Y., Qiu, H., Lu, S., and Yao, S. (2020). Accurate modeling of a profit-driven power to hydrogen and methane plant toward strategic bidding within multi-type markets. IEEE Trans. Smart Grid 12 (1), 338–349. doi:10.1109/tsg.2020.3019043
Qiao, H., Wu, L., Wen, S., and Zhang, J. (2023). Energy trading model for multi-microgrid energy storage alliance based on Nash negotiation. Front. Energy Res. 11, 1306317. doi:10.3389/fenrg.2023.1306317
Sepulveda, N. A., Jenkins, J. D., Edington, A., Mallapragada, D. S., and Lester, R. K. (2021). The design space for long-duration energy storage in decarbonized power systems. Nat. Energy 6 (5), 506–516. doi:10.1038/s41560-021-00796-8
Tengfei, M. A., Wei, P. E. I., Hao, X. I. A. O., Dexin, L. I., Xiangyu, L. Y. U., and Kai, H. O. U. (2020). Cooperative operation method for wind-solar-hydrogen multi-agent energy system based on Nash bargaining theory. Proc. CSEE 41 (1), 25–39. doi:10.13334/j.0258-8013.pcsee.200956
Timilsina, G. R. (2021). Are renewable energy technologies cost competitive for electricity generation? Renew. Energy 180, 658–672. doi:10.1016/j.renene.2021.08.088
Tushar, W., Saha, T. K., Yuen, C., Morstyn, T., McCulloch, M. D., Poor, H. V., et al. (2019). A motivational game-theoretic approach for peer-to-peer energy trading in the smart grid. Appl. energy 243, 10–20. doi:10.1016/j.apenergy.2019.03.111
Wang, B., Fu, Z., Wang, J., and Liu, H. (2024a). “Optimized dispatch of comprehensive energy in park considering CCS-P2G coupling and multi-dimensional flexibility resources,” in 2024 IEEE 2nd International Conference on Power Science and Technology (ICPST), Dali, China, 09-11 May 2024 (IEEE), 1758–1764.
Wang, L., Lin, J., Dong, H., Zeng, M., and Wang, Y. (2022). Optimal dispatch of integrated energy system considering ladder-type carbon trading. J. Syst. Simul. 34 (7), 1393–1404.
Wang, L. L., Xian, R. C., Jiao, P. H., Chen, J. J., Chen, Y., and Liu, H. G. (2024b). Multi-timescale optimization of integrated energy system with diversified utilization of hydrogen energy under the coupling of green certificate and carbon trading. Renew. Energy 228, 120597. doi:10.1016/j.renene.2024.120597
Xu, W., Lin, F., Jia, R., Tang, C., Zheng, Z., and Li, M. (2024). Game-based pricing for joint carbon and electricity trading in microgrids. IEEE Internet Things J. 11, 27732–27743. doi:10.1109/jiot.2024.3400392
Zeng, X., Feng, Y., Zhou, Y., and Li, H. (2023). Research on optimization and scheduling of multi-integrated energy system based on step-by-step carbon trading and hybrid games. Int. Trans. Electr. Energy Syst. 2023 (1), 1–19. doi:10.1155/2023/2063273
Keywords: shared hydrogen storage, integrated energy microgrid, shared trading, hybrid game theory, hydrogen energy pricing strategy
Citation: Zhou H and Wei J (2025) Research on pricing strategy of shared electro-thermal-hydrogen energy storage in integrated energy multi-microgrid based on hybrid game. Front. Energy Res. 13:1602891. doi: 10.3389/fenrg.2025.1602891
Received: 30 March 2025; Accepted: 09 May 2025;
Published: 30 May 2025.
Edited by:
Dimberu G. Atinafu, Yonsei University, Republic of KoreaReviewed by:
Xiao Chen, Beijing Normal University, ChinaSoumen Mandal, Hanyang University, Republic of Korea
Copyright © 2025 Zhou and Wei. This is an open-access article distributed under the terms of the Creative Commons Attribution License (CC BY). The use, distribution or reproduction in other forums is permitted, provided the original author(s) and the copyright owner(s) are credited and that the original publication in this journal is cited, in accordance with accepted academic practice. No use, distribution or reproduction is permitted which does not comply with these terms.
*Correspondence: Huan Zhou, emhvdWh1YW5fc3VlcEAxNjMuY29t