 Jianchao Lu
 Jianyong Zheng1*
 Fei Mei
- 1School of Electrical Engineering, Southeast University, Nanjing, China
- 2College of Energy and Electrical Engineering, Hohai University, Nanjing, China
Ports serve as critical nodes within transportation networks and logistics chains, where the planning of ship berthing is intricately linked to energy utilization. Addressing challenges such as the allocation of port berths and insufficient integration of clean energy, we propose an optimal dispatch strategy for port virtual power plants, which incorporates orderly berth allocation and a green certificate-tiered carbon trading mechanism. The proposed model first examines the berth capacity issue by reallocating berths through a quantitative analysis of overall benefits. This approach enhances the flexibility of the energy network while ensuring adequate energy supply for ships. To facilitate the green transformation of ports, a green certificate-tiered carbon trading mechanism is embedded within the virtual power plant framework, leveraging economic incentives to guide the optimization of the port’s energy structure. This strategy effectively promotes the consumption and utilization of renewable energy at ports. Finally, we constructed four simulation scenarios to compare results, which validate the effectiveness of the proposed strategy. The integration of orderly berth allocation and the green certificate-tiered carbon trading mechanism significantly improves the port’s operational economic efficiency and environmental protection outcomes, offering a novel approach for berth planning and energy management in port operations.
1 Introduction
As a central hub for international trade and a high-energy-consumption node, ports are facing the challenge of increasing energy demand and carbon neutrality (Zhang et al., 2022). The energy demand of port is diverse and unpredictable, while the reliance on traditional fuel and coal-based power supply, along with exhaust gas pollution, increasingly fails to align with the environmental and operational requirements of smart and green port development (Smartport, 2025), (Parise et al., 2016). To improve the energy transition in ports, it is essential to adopt rational economic incentive strategies (Molavi et al., 2020) and establish a novel energy system to address operational challenges arising from the diversity and uncertainty of port energy loads by integrating controllable resources such as distributed photovoltaics, wind power, and energy storage systems.
Efficient coordination of resource allocation and load management in port energy systems relies on the integration of adjustable loads and distributed energy resources, a process in which virtual power plant (VPP) plays a crucial role. As an advanced energy management approach, VPP has demonstrated broad application potential across multiple domains, including transportation systems, industrial parks, and residential communities, significantly enhancing the efficiency and effectiveness of distributed resource integration. The application of VPP in ports will enable precise scheduling and optimized utilization of energy resources, thereby further advancing the sustainable development of port energy systems. Reference (Babazadeh et al., 2025) proposed a virtual storage plant (VSP) framework based on VPP to address scheduling strategies for dispatchable resources. The framework categorizes the electricity market into three trading platforms and optimizes the charging and discharging of electric vehicles to enhance supply-side adaptability, significantly reducing daily operational costs. Furthermore, research has been conducted on VPPs of different scales. Reference (Nadimi et al., 2025) proposed adjusting the minimum power requirement (MPR) threshold for small-scale virtual power plants (S-VPPs) to address MPR interference. This approach helps balance the variability and uncertainty of renewable energy, enhances S-VPP participation in market strategies, and improves overall electricity market efficiency. Reference (Chong et al., 2025) introduced a frequency control optimization method based on proportional adjustment to address the integration challenges of renewable energy in large-scale virtual power plants (L-VPPs). This method improved the ability to eliminate steady-state errors while enhancing the flexibility and capacity of L-VPPs to provide auxiliary services to the power grid. Reference (Pandey et al., 2025) utilized the marine predators optimization algorithm (MPOA) to tackle the scheduling challenges of flexible resources in multi-regional interconnected systems. By efficiently integrating dispatchable resources such as solar power, wind energy, fuel cells, and combined heat and power (CHP) units, this approach enhanced scheduling efficiency and significantly boosted the net profit of virtual power plant operations. Reference (Zheng et al., 2025) proposed a quantitative model to address the challenges of balancing diverse flexible resources by accounting for resource characteristic differences and establishing matching priority criteria. This approach effectively resolved issues related to the heterogeneity of resource response behaviors and their coupling during peak shaving. As a result, the strategy greatly improved the return on investment and the peak-shaving capacity of VPP. In optimizing virtual power plants, reference (Zhang et al., 2025) utilized price-based demand response and stochastic optimization based on the unscented transform, achieving parallel management of active and reactive power while reducing the model-solving time. This greatly increased the operational flexibility of virtual power plants. In reference (Li Y. et al., 2025), a collaborative energy management framework based on deep reinforcement learning (DRL), which comprehensively enhanced operational performance of VPP. Lastly, reference (Saad Suliman and Farzaneh, 2025) incorporated conventional generating units into VPP and introduced hydroelectric scheduling alongside pumped-storage dispatch mechanisms. It confirmed a strong correlation between electricity market prices and the prioritization of energy production technologies, offering valuable insights for potential reforms in virtual power plants and electricity markets.
Existing research has explored the resource characteristics and decision-making mechanisms of VPP extensively. However, most studies focus on conventional VPP in inland regions, with limited analysis specific to port-based VPP. Ports, as critical energy hubs, differ significantly from inland VPP in terms of resource characteristics, load demands, and operational models. Therefore, specialized research on port virtual power plants is of great significance for advancing the intelligent transformation of port energy systems and achieving carbon neutrality targets.
Ports, serving as critical hubs within logistics networks, often face operational challenges due to limitations in transportation capacity and scale. The frequent fluctuations in port load, driven by the operation of equipment such as cranes, pose significant risks to system frequency stability. To address these issues, it is essential to develop scientifically planned berth allocation strategies for ships, integrate VPP technology to enhance frequency stability, and establish clear energy interaction mechanisms between ports and vessels. These measures are crucial for improving the overall performance and efficiency of port virtual power plants (Martin-Iradi et al., 2024).
Research on port frequency stability has made significant progress in recent studies. Reference (Liu et al., 2025) proposed a droop control scheme based on preset power adjustments, which effectively reduced droop power associated with frequency deviations and enhanced system frequency stability. Reference (Shao et al., 2024) introduced constraints such as the rate of frequency variation and the maximum allowable frequency deviation, successfully improving the frequency security of virtual power plants under large-scale renewable energy integration and providing increased support to the power grid. Reference (Tozak et al., 2024) integrated schedulable virtual oscillator control with droop-based control methods to analyze the stability of grid-connected converters and their ability to track power reference signals. The findings demonstrated the effectiveness of the proposed control strategy in maintaining grid stability and ensuring accurate tracking of power references. Reference (Nair and Shereef, 2022) focused on the role of electric vehicles in virtual power plant dispatch, analyzing their impact on voltage stability in power systems. By optimizing battery costs and aggregating battery capacity, the study improved voltage and frequency stability during dispatch processes. Reference (Xu et al., 2024) presented an enhanced WSCC-9 system integrated with a coordinated frequency control strategy for virtual power plants. This approach minimized system frequency deviations and fluctuations, reduced the time required for frequency regulation, and significantly improved the overall performance of frequency control. Research on port berth allocation has yielded valuable insights. For instance, reference (Mao et al., 2022) treated berth allocation as a time-space-constrained two-dimensional bin-packing problem and simultaneously addressed port crane scheduling and ship berth optimization through a joint solution approach. This provided port operators with a comprehensive framework for operational optimization. Reference (Li H. et al., 2025) addressed the challenges of cargo unloading and transfer for large vessels by analyzing the physical characteristics of various ship types and developing a hybrid integer linear programming model for berth optimization. Combining genetic algorithms with simulated annealing, this method significantly reduced ship dwell time at the port. Reference (Yue et al., 2025) proposed an integrated approach combining shore power systems with ship berthing strategies. By employing an improved NSGA-III algorithm, the study optimized shore power utilization planning, leading to improved energy efficiency and significant reductions in port emissions. This research provides valuable insights into energy planning for promoting sustainable maritime operations. Reference (Nazri et al., 2024) leveraged the pyomo optimization library along with the coin-or branch and cut solver on google colab to determine optimal berth allocation. This method effectively minimized ship turnaround and departure delays, resulting in a substantial improvement in port operational efficiency. Reference (Ji et al., 2024) applied a modified adaptive large neighborhood search (MALNS) algorithm to optimize berth allocation across multiple ports. The algorithm focused on minimizing costs associated with ship navigation, waiting times, delays, and port handling operations. Reference (Xiang et al., 2025) explored the complexity of discrete berth allocation combined with crane scheduling, framing it as a scheduling optimization problem. Employing a two-stage algorithm, the study integrated both time-invariant and time-variant considerations, demonstrating the effectiveness of the algorithm in solving port allocation challenges. Reference (Yan et al., 2015) introduced a berth flow network modeling approach to optimize the dynamic utilization of port berths. By proposing an innovative flexible berth space utilization plan based on blockage scheduling, this methodology maximized the efficiency of port terminal space usage while improving operational planning at ports. Reference (Lyu et al., 2025) investigated the distribution of shared resources within ports, formulating a collaborative allocation problem and utilizing a mixed-integer linear programming (MILP) model. Through this approach, it broadened the solution space to address resource conflicts and operational disorganization. Reference (Bouzekri et al., 2023) tackled the dynamic and mixed scenarios of tactical quay crane assignment and operational berth allocation by emphasizing improved model accuracy while accounting for the operational patterns of different vessel types. This approach enhanced solving speed and effectively resolved berth planning challenges, optimizing port operations. Reference (Thanos et al., 2021) applied a heuristic algorithm based on local search to tackle ship operational planning challenges. This approach enabled ports to adhere to stricter vessel schedules while improving the efficiency of in-port operations.
Although the aforementioned studies have conducted in-depth analyses of ship planning and logistical characteristics within ports, they primarily focus on maritime operations within port boundaries. Economic analyses in these studies often emphasize the interests of port-related shipping and logistics operations, largely neglecting the integration of ship activities with multi-energy coupled systems. Furthermore, these studies fail to connect ship behavior with the port’s actual energy systems for responsive optimization and lack research on energy dispatch strategies.
Carbon trading mechanism can incentivize port virtual power plants to adopt more environmentally friendly energy practices, drive the development and application of low-carbon technologies, and accelerate the transition of port energy systems toward a greener and more sustainable structure. Researchers have conducted extensive studies on the trading mechanisms of carbon markets to improve the economic efficiency and environmental sustainability of power generation and supply systems. Reference (Gong et al., 2025) proposed an integrated electricity-carbon-green certificate (ECG) trading market model, which, under cooperative game theory and a bilevel optimization strategy, increased the proportion of renewable energy utilization within VPP by approximately 9.4%. This significantly enhanced the economic and ecological benefits of energy systems. Reference (Ji et al., 2025) explored the dynamic allocation of carbon quotas using Stackelberg game theory to analyze equilibrium outcomes across four carbon reduction models. The study demonstrated that dynamic carbon allowance trading regulations positively influence emission reduction efforts, encouraging more effective environmental strategies. Reference (Ma G. et al., 2025) analyzed the trade-offs between two emission reduction approaches—reduce output (RO) and change in process (CIP)—for corporate users involved in carbon trading markets. The study developed a carbon trading model incorporating RO and CIP methodologies, providing strategic guidelines to help market participants achieve effective and efficient emissions reductions. Reference (Ma H. et al., 2025) presented a bilevel optimization method enabled by a carbon-coupled network charging mechanism to address the complexities in distribution network decision-making caused by interactions between prosumers and system operators. This approach ensured model convergence and successfully tackled the challenges posed by prosumers in the operational decision-making processes within distribution systems. Moreover, several studies have investigated the integration of carbon trading mechanisms into Integrated Energy Systems (IES), emphasizing their role in enhancing system efficiency and promoting environmental sustainability. For instance, reference (Chen et al., 2025) considered response mechanisms for different energy types and combined demand response with a carbon trading model, utilizing a bilevel low-carbon economic optimization model to effectively reduce both operational costs and carbon emissions within energy systems. Similarly, reference (Wang B. et al., 2025) examined the carbon responsibility allocation (CRA) among carbon market participants, establishing a constraint model linking carbon emission levels and supplier profitability. This study refined the economic benefit model for user participation in carbon trading and provided strategic guidance for effective carbon reduction planning under various CRA principles.
However, while these studies have analyzed the functionality and mechanisms of carbon trading in depth, they lack research that specifically integrates carbon markets with port-related markets. Carbon reduction is a critical pathway for developing green ports, making it essential to explore the intrinsic connection between port virtual power plants and carbon trading markets to support green port development.
This paper proposes an optimized dispatch framework for port virtual power plants that combines orderly berth allocation strategies with a tiered green certificate-based carbon trading mechanism, addressing the shortcomings of previous studies. The main contributions of this research are as follows:
1. We developed a comprehensive VPP model that integrates four energy networks: electricity, cooling, heating, and gas. This model provides an in-depth and systematic perspective for studying the interaction mechanisms among diverse energy sources in port-based VPPs, facilitating accurate analysis of energy dynamic balancing and the optimization of dispatch strategies.
2. We considered the types and sizes of ships to allocate berths systematically. This strategy aims to balance the load demand during ship docking rationally, thereby maximizing the synergistic potential of various energy resources within the VPP. Ultimately, this approach significantly enhances the overall operational efficiency and economic benefits of the port.
3. We integrated the carbon trading market and the green certificate trading market into the comprehensive performance evaluation framework of port. This framework achieves the seamless integration of economic profitability and environmental protection goals, providing a solution that is both economically viable and environmentally adaptive to support the sustainable development of the port.
The rest of this paper is organized as follows: Section 2 introduces the mechanisms for orderly berth allocation and temperature control within the port virtual power plant, along with mathematical models for energy equipment. Section 3 outlines the objective functions and constraints of the proposed optimization model. Section 4 presents simulation results and analysis. Finally, Section 5 concludes the study.
2 Port virtual power plant
As illustrated in Figure 1, the energy load network of ports encompasses multiple energy forms, complex transmission and conversion processes, and a highly integrated energy management system, which highlights the cross-disciplinary characteristics of the port virtual power plant model. Consequently, it is essential to conduct an in-depth analysis of the unique response characteristics of shore power systems and achieve the organic integration of port resources. This approach facilitates the efficient conversion and complementarity of different energy forms, thereby significantly enhancing resource allocation efficiency and energy utilization efficiency within the port.
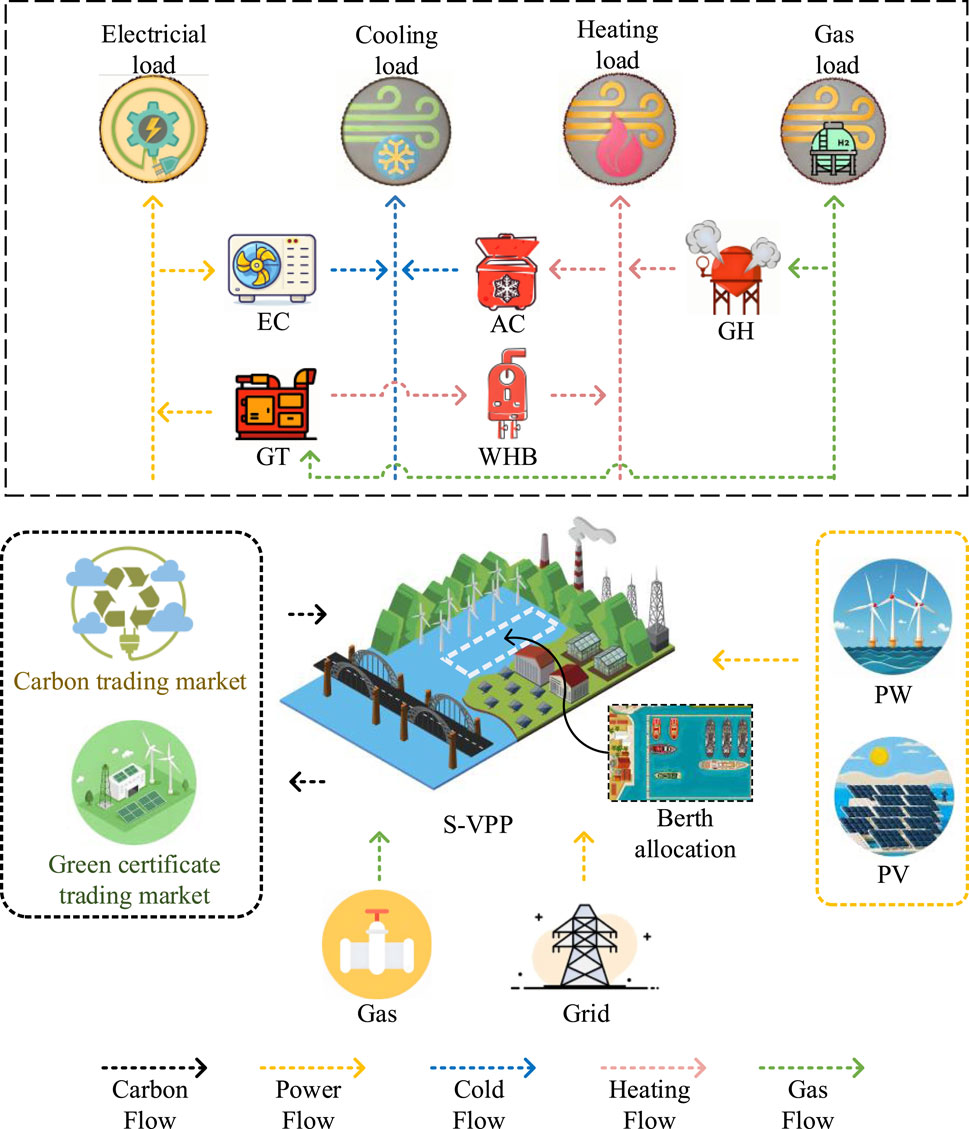
Figure 1. Port virtual power plant basic framework.
2.1 System model
Ports face the dual challenge of managing ship operational demands and the energy requirements of temperature control systems. Effectively coordinating these two types of loads is a crucial aspect that influences the development and optimization of port energy strategies.
2.1.1 Orderly berth allocation model
In this paper, we consider two types of vessels, which are passenger ships and cargo ships. Due to the continuous demands of life-support systems, we assume that passenger ships primarily interact with VPP in three dimensions: electrical, thermal, and gaseous. Cargo ships, on the other hand, require an extended cooling load interaction due to the operation of specialized equipment such as cargo preservation devices.
The interaction between vessel loads and port virtual power plant is primarily improved through optimized berth scheduling for ships. During vessel operations, return plans are submitted in advance to port operators, who integrate all berthing plans, account for overall port operational conditions and energy supply costs, and ultimately determine the final berth allocation strategy.
We need to guarantee consistency between the actual berthing duration and the scheduled berthing duration to ensure that the port’s berth scheduling aligns with planned expectations. The specific constraints are as follows:
where Si,t represents a binary variable indicating the berthing status of ship i at time t. If ship i is docked at a berth during time t, Si,t = 1, otherwise, Si,t = 0. Ai denotes the planned berthing duration for ship i, while T represents the total scheduling time horizon of the model.
As the continuity of berthing behavior of ships, once a ship is docked at the port, the departure can only be executed after the planned berthing duration has been completed. The specific constraints are as follows:
The berth capacity of the port is fixed, so the number of ships that can be accommodated at the same time is also limited, which is as follows:
where R represents the number of port berths.
2.1.2 Temperature control model
The temperature control zones within a port primarily include residential areas and refrigerated containers. The design of temperature control systems in residential areas requires a comprehensive analysis of building attributes and the variations in outdoor temperature over time. While maintaining user comfort, the system strategically adjusts the thermal load curve according to actual user needs. The residential area temperature model is as follows (Wang Y. et al., 2025):
where Tout,t and Tin,t represent the outdoor and indoor temperatures at time t, RH denotes the equivalent thermal resistance of the building materials in the residential area, Sair represents the specific heat capacity of air, Hload,t specifies the thermal power used for temperature regulation in the port’s residential area at time t.
The predicted mean vote (PMV) is applied to temperature control in living areas. The specific formula is as follows:
where λPMV,t represents the tool indicator of PMV, Tper represents the average skin temperature of the human body under near-comfort conditions, Mper denotes the heat generated by human metabolism, and Rclo reflects the equivalent thermal resistance of clothing.
For the cold chain system in cargo areas, stricter upper and lower temperature limits are required due to the sensitivity of stored goods to environmental conditions.
The cold chain system in cargo areas imposes stricter upper and lower limits on ambient temperature. Therefore, a second-order equivalent thermal parameter (SETP) model is employed to simulate temperature inertia. The specific model is as follows (ScienceDirect, 2025):
where Sin represents the specific heat capacity of the air inside the refrigerated warehouse, and Swall denotes the specific heat capacity of the wall materials of the warehouse. Tsto,t and Twall,t are the internal air temperature and wall temperature of the refrigerated warehouse at time t. Fsto,t refers to the cooling power supplied to the warehouse at time t. Rs,in and Rs,out indicate the equivalent thermal resistance of the inner and outer surfaces of the warehouse walls.
2.2 Energy supply model
2.2.1 Offshore wind and photovoltaic models
The Weibull distribution is employed to model wind speed in wind power zones (Li et al., 2019). The probability distribution and output power constraints are as follows:
where W and h denote the calculation coefficients for the Weibull distribution, s and d represent the shape parameter and scale parameter of the Weibull distribution, respectively. Pw* corresponds to the rated power of the wind turbine, v * and v1 denote the rated cut-in wind speed and the actual cut-in wind speed of the wind turbine. Additionally, Ppre w,t and Pw,t indicate the predicted wind power generation and the actual wind power absorbed by the grid at time t.
Solar irradiance is modeled as following a Beta distribution (Wu et al., 2023), and its probability density function is subject to output power constraints:
where Г(·) represents the gamma function, while g1 and g2 are the shape parameters of the PV system. Ppre v,t and Pv,t denote the predicted photovoltaic generation and the actual photovoltaic power absorbed by the grid at time t, respectively. PV* represents the rated power of the photovoltaic system.
2.2.2 Gas unit
The gas-fired units installed at the port primarily consist of gas turbines (GT), waste heat boilers (WHB), and boilers (BL).
GT generate electricity by combusting natural gas. The specific model is detailed as follows:
where PGT,t and G GT,t represent the actual electrical output power and the input natural gas power of GT at time t, respectively. ρGT denotes the gas-to-electricity conversion efficiency of GT, while Pmax GT and Psta GT represent the upper limit of electrical output power and the minimum stable load of GT, respectively.
Based on the thermal energy flow within the system, the model of WHB can be established as follows:
where H* WHB, and HWHB,t denote the input and output thermal power of WHB at time t, respectively. ρWHB represents the thermal efficiency of GT, while μWHB is the heat loss coefficient. Hmax WHB,t and Hsta WHB,t correspond to the upper limit and minimum stable output thermal power of WHB.
BL converting gas to heat to provides thermal energy for port virtual power plant. The model is as follows:
where HBL,t and G BL,t represent the heating power and input natural gas power of BL at time t, respectively. ρBL denotes the gas-to-heat efficiency of BL, while Hmax BL indicates the upper limit of BL’s output thermal power.
2.2.3 Temperature control model
The port temperature control unit mainly includes electric chiller (EC) and absorption chiller (AC). EC satisfies cooling demands through the conversion of electricity to cooling energy. The model is as follows:
where PEC,t represents the electrical energy consumption of EC at time t, FEC,t indicates the actual cooling capacity of EC at time t, ρEC denotes EC’s efficiency in converting electricity into cooling power, Fmax ECis the upper limit of cooling power output by EC.
AC produces cooling energy by absorbing heat. The model is as follows:
where HAC,t refers to the thermal energy consumption of AC at time t, FAC,t signifies the actual cooling capacity of the AC at time t, ρAC represents AC’s efficiency in converting heat into cooling power, Fmax ACis the upper limit of cooling power output by AC.
2.3 Carbon trading model
Under the dual-carbon strategy framework, the synergistic optimization mechanism between port virtual power plants and ship loads offers an innovative pathway for the integrated implementation of green certificate (GC) trading and tiered carbon trading. As shown in Figure 2, green certificate trading incentivizes the port’s virtual power plant to prioritize renewable energy consumption, while the tiered carbon pricing mechanism constrains the use of high-carbon energy sources in ports. When the carbon quota price exceeds a threshold, the coordination system automatically triggers the priority shore power supply agreement, dynamically adjusting the energy dispatch strategies at the port. This bidirectional coupling mechanism optimizes the marginal benefits of green certificate environmental rights and carbon quota economic costs, while also demonstrating the multiplier effect of integrating market mechanisms with technological approaches to achieve energy transition goals.
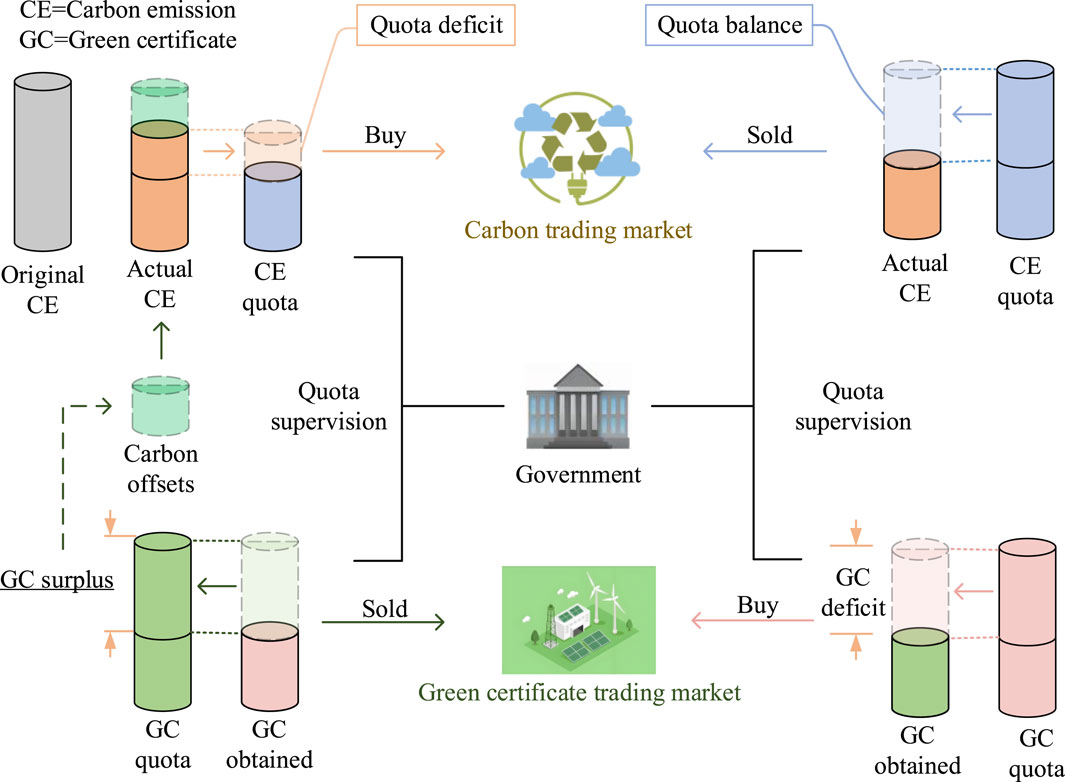
Figure 2. Green certificate - tiered carbon trading framework.
2.3.1 Green certificate trading model
Renewable energy generation projects that meet the eligibility criteria are issued green certificates by government regulatory agencies, and GC quotas are calculated for electricity-consuming equipment. Any surplus or shortfall in green certificates can be traded autonomously in the market through various mechanisms, including bilateral negotiations, public listings, and centralized auctions. The green certificate trading model can be established as follows:
where CGCT represents the total cost of green certificate transactions, ρGCT denotes the price of green certificate transactions, while Zpre and Znew refer to the port’s existing green certificate quota and the number of green certificates derived from newly added renewable energy at the port, respectively. Additionally, πpre indicates the conversion coefficient for electricity into green certificate quotas. Pload,t and Pves,t represent the base electricity load of the port and the electricity load from ships at berth at time t, respectively. πw and πv denote the conversion coefficients for wind and photovoltaic power generation into green certificates. Finally, ρGCT,0 is the baseline price for green certificate transactions, while λ represents the price ratio of green certificates.
2.3.2 Green certificate - Ladder carbon trading model
The primary sources of carbon emissions in the port are GT and BL. Historical emission data are adjusted based on past records to establish a baseline, which is then used to calculate the total carbon quota Ds, as defined by the following formula:
where De, DGT and DBL represent the carbon quotas corresponding to grid electricity purchases, GT, and BL, respectively. πe, πGT and πBL denote the carbon emission quotas associated with electricity consumption per unit, natural gas consumption per unit by GT, and natural gas consumption per unit by BL, respectively.
If the quantity of GC received by the port exceeds its GC quota, but the port’s actual carbon emissions surpass its carbon emission quota, the GC surplus can be applied to offset part of the carbon emissions. Therefore, the port’s carbon quota E can be determined by calculating the actual carbon emissions based on the port’s electrical and thermal power consumption, subtracting the carbon emissions offset by green certificates EGCT, as described by the following formula:
where Ee and Esum represent the total carbon emissions associated with grid electricity purchases, GT, and BL, respectively. η1, η2, and η3 are the carbon emission coefficients for coal-fired equipment, while η4, η5, and η6 represent the carbon emission coefficients for natural gas-based equipment. Ewv denotes the carbon emissions from PW and PV units, λw and λv are the conversion coefficients for carbon emissions per unit output of PW and PV, respectively. ρE represents the conversion coefficient for offsetting carbon emissions through green certificates, and Zbuy indicates the number of green certificates purchased by the port.
Ports and industrial zones can freely trade carbon emission quotas in the carbon trading market, with the government responsible for market oversight. If port’s total carbon emissions exceed a certain threshold, it must pay higher prices to purchase additional carbon emission rights. Accordingly, the total cost of green certificate-tiered carbon trading CCET is calculated as follows:
where α and β represent the tiered carbon trading compensation coefficient and the baseline carbon trading price, respectively, while d denotes the carbon emissions per unit interval under tiered carbon trading.
3 Problem formulation of the seaport virtual power plant
This study comprehensively accounts for the carbon emissions, net revenue, and renewable energy consumption of the port virtual power plant, and based on this, develops an optimal dispatch model that integrates berth optimization strategies. In the proposed model, the energy supply model serves as the central framework of VPP, integrating other sub-models through energy connections. The berth allocation model ensures orderly planning of shiploads to maintain smooth port logistics operations. The temperature control model incorporates constraints to regulate the scheduling of cooling and heating energy, while the carbon trading model promotes clean operation of VPP.
The overall model aims to minimize operational costs, encompassing the integrated cost of electricity, cooling, heating, and natural gas networks within the VPP. Additionally, the model includes constraint adjustments to ensure stable operation during real-time dispatch processes. The following sections provide a detailed explanation of the objective function and the associated constraints.
3.1 Objective function
The load aggregation and responsive optimization of the port virtual power plant are primarily aimed at reducing the operational costs on the energy supply side of the port.
The total cost of port virtual power plant is expressed as follows:
where Cnet represents the cost of grid energy interaction, CG denotes the cost of natural gas procurement, Cop refers to the maintenance cost of renewable energy systems, and Cd signifies the cost associated with the curtailment of renewable energy, Cshift represents the cost of vessel dispatching. γb,t and γs,t represent the electricity purchase price and selling price from the grid at time t, while Pb,t, and Ps,t denote the electricity purchase quantity and selling quantity from the grid at time t, respectively. δb,t represents the unit price of natural gas at time t, and Gb,t indicates the quantity of natural gas purchased from the gas network at time t. γw,op and γv,op refer to the maintenance cost coefficients for PW and PV, respectively. γw,d and γv,d represent the cost coefficients associated with curtailed power from PW and PV, respectively. ρi represents the scheduling cost coefficient for ship i, Δti denotes the difference in departure time before and after the optimization for ship i, and I indicates the total number of vessels.
3.2 Conditional constraints
This section focuses on further planning related to energy flow balance constraints and unit ramping constraints, while other relevant constraints have been defined earlier in the text.
3.2.1 Supply and demand balance constraints
This model primarily accounts for the supply-demand balance across electricity, heating, cooling, and gas networks.
where Hves,t represents the thermal load required by ships at berth within the port at time t. Fload,t refers to the baseline cooling load of the port at time t, while Fves,t denotes the cooling load required by ships at berth within the port at time t. Gves,t indicates the gaseous load needed to replenish the hydrogen storage tanks of cargo vessels at berth at time t.
3.2.2 Unit climbing constraint
Unit ramping constraints were established to ensure smooth transitions in the operation of GT, EC and AC, thereby preventing equipment damage and avoiding disruptions to the power system caused by sudden changes in power output.
where PGT,r and PGT,l represent the ramp-up and ramp-down power limits for the GT, respectively. FEC,r and FEC,l denote the ramp-up and ramp-down power limits for the EC, respectively. Similarly, FAC,r and FAC,l correspond to the ramp-up and ramp-down power limits for the AC, respectively.
3.3 Model solving
The structure of the port virtual power plant is highly complex, involving diverse and interactive constraints. To enhance the efficiency and accuracy of the model’s solution, an improved particle swarm optimization (IPSO) algorithm is employed. This improvement introduces a dynamic inertia weight factor, which varies as a function of the iteration count. During the early stages, the algorithm is designed to prioritize global search capabilities to accelerate exploration, while in later stages, it emphasizes local search precision to ensure higher convergence accuracy. The specific formula for the inertia weight adjustment is as follows:
where k represents the number of iterations, ω represents the inertia weight, which issued to adjust the search range of the solution space, ωsta represents the initial inertia weight, ωend represents the inertia weight corresponding to the maximum number of iterations, Mmax ite represents the maximum number of iterations.
4 Case analysis
In this section, we employ simulations of four scenarios to comprehensively compare the proposed scheduling optimization strategy. Section 4.1 provides a detailed overview of the simulation data and parameter settings for the port virtual power plant. Section 4.2 describes the four scenarios in detail. Section 4.3 validates the effectiveness of orderly berth allocation in optimizing the energy scheduling of the port’s virtual power plant. Lastly, Section 4.4 evaluates and compares the scheduling outcomes of the scenarios from the perspectives of environmental sustainability and economic efficiency.
4.1 Illustrative examples
In this study, data from a port in eastern China is used to validate the proposed model. We developed a comprehensive port virtual power plant system by integrating the port’s load demands with the berthing requirements of ships. The simulations are conducted over a 24-h period with 1-h intervals. The base data include forecasts for the port’s electricity load, cooling load, heating load, gas demand, and PV, PW outputs. The parameters of the port’s basic energy equipment are presented in Table 1, while Table 2 outlines the baseline coefficients of the port virtual power plant. The parameters of the port’s temperature control system are detailed in Table 3.
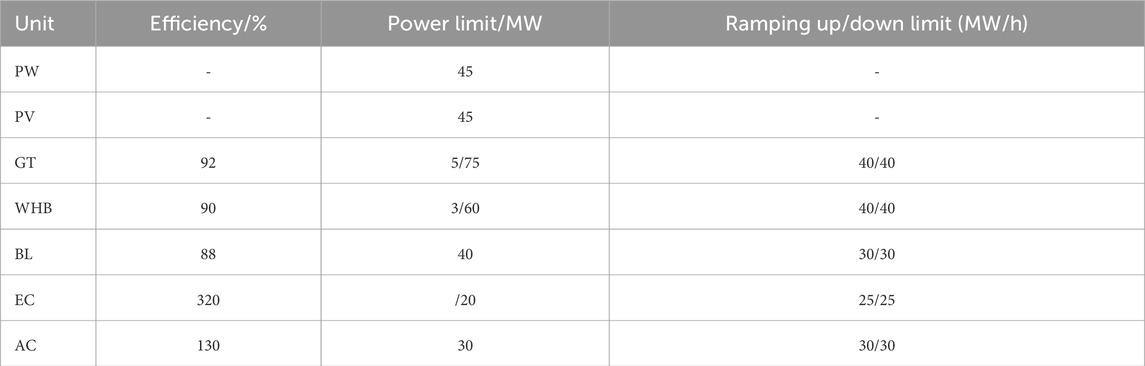
Table 1. Port energy equipment related parameters.
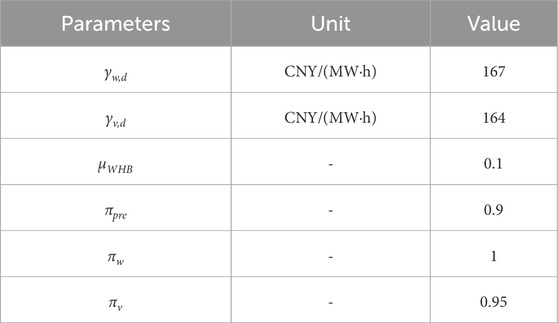
Table 2. Port virtual power plant related parameters.
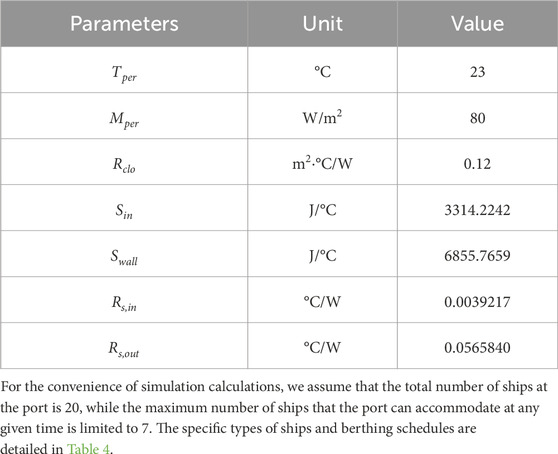
Table 3. Parameters of the temperature control system.
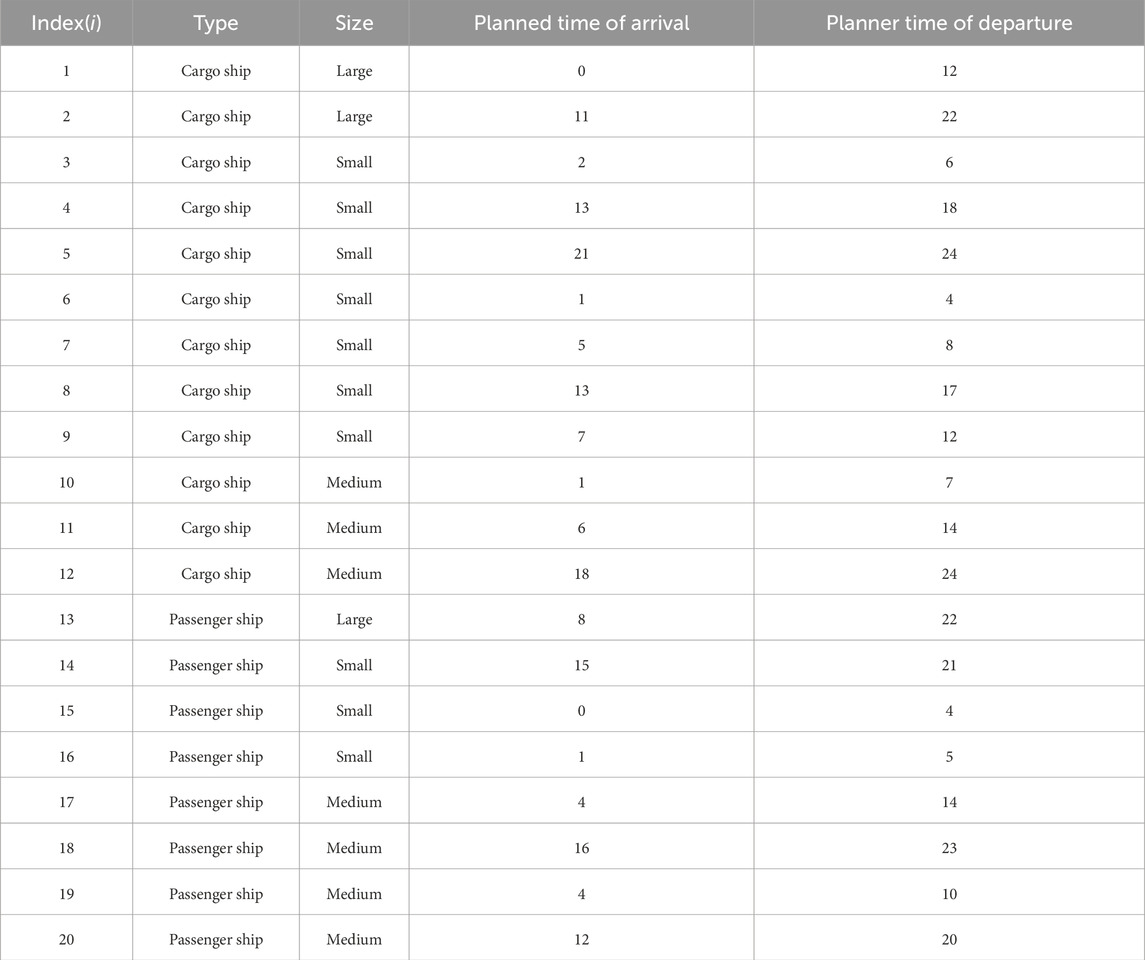
Table 4. Planned berthing distribution of ships.
The ships operating within the port include passenger ships and cargo ships, categorized into three sizes: large, medium, and small. The energy consumption requirements for each type while docked are compared in Table 5. Passenger ships require electricity, heat, and gas replenishment during berthing, and cargo ships consume additional cooling energy to directly supply cold storage facilities during berthing.
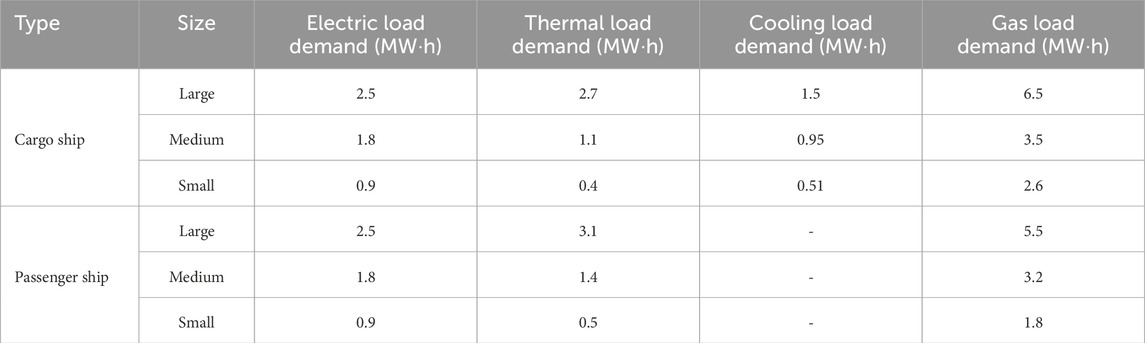
Table 5. Average energy consumption demand of ships.
This study examines the influence of orderly berth allocation and a green certificate-tiered carbon trading mechanism on the scheduling optimization of a port virtual power plant. Four scenarios are employed to evaluate the model’s economic and environmental performance.
Scenarios1: A port virtual power plant considering traditional berth allocation and tiered carbon trading mechanism.
Scenarios2: A port virtual power plant that considers orderly berth allocation but does not include the carbon trading mechanism.
Scenarios3: A port virtual power plant that incorporates both orderly berth allocation and the tiered carbon trading mechanism.
Scenarios4: A port virtual power plant that incorporates both orderly berth allocation and the green certificate-tiered carbon trading mechanism.
4.2 Efficiency analysis of berths orderly allocation
4.2.1 Port resource aggregation optimization analysis
In this section, we provide a detailed perspective to examine the impact of orderly berth allocation on the energy interaction within the port virtual power plant. Using response data from a typical day as the baseline, we conduct an in-depth analysis of the difference between S1 and S4. The berth allocation and ship-to-port energy exchange details are illustrated in Figure 3.
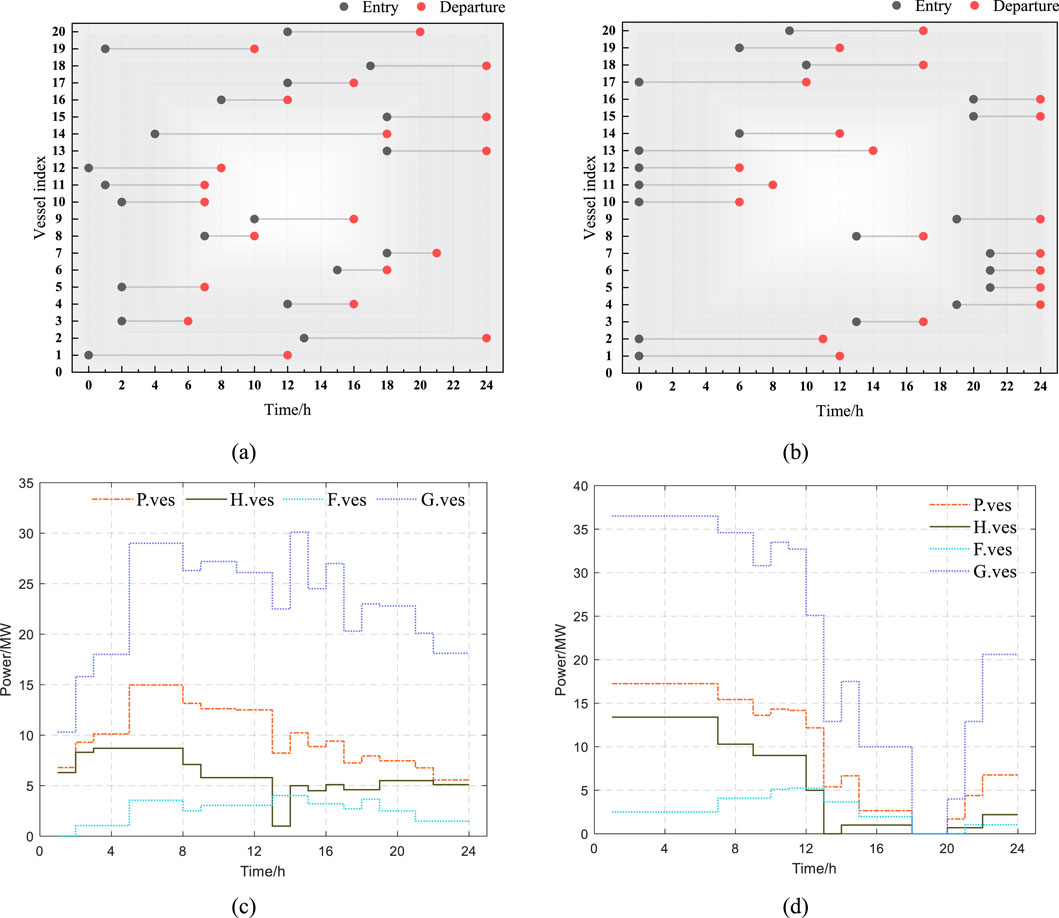
Figure 3. Comparison of ship berth scheduling results and port ship load in S1 and S4. (a) Berth allocation in S1. (b) Berth allocation in S4. (c) Ship load demand in S1. (d) Ship load demand in S4.
From Figures 3a,c, it can be observed that traditional berth allocation can slightly adjust the time-scale distribution of port loads. Essentially, ships are docked at the port at all times, with various types of load levels remaining relatively balanced.
As shown in Figures 3b,d, following the optimization of berth allocation, port operators adopted a cost-oriented approach to systematically allocate berths. The berthing schedules for ships were primarily concentrated during periods of low electricity and gas prices, such as 1:00–11:00 and 22:00–24:00. During these times, the port virtual power plant simultaneously consumed fuel, electricity, and hydrogen to provide services including power, heating, and cooling for the docked ships. Conversely, during high electricity and gas price periods, such as 13:00–20:00, berth utilization significantly decreased, with some time intervals showing complete berth vacancy. This allows port operators to perform efficient maintenance work on the docks during these periods.
4.2.2 Port resource aggregation optimization analysis
This section presents a detailed analysis of the energy network under scenario S4, focusing on the interactions between various load types. Additionally, it examines the effects of the orderly berth allocation mechanism on the operation of the port’s virtual power plant. The specific response characteristics are illustrated in Figure 4.
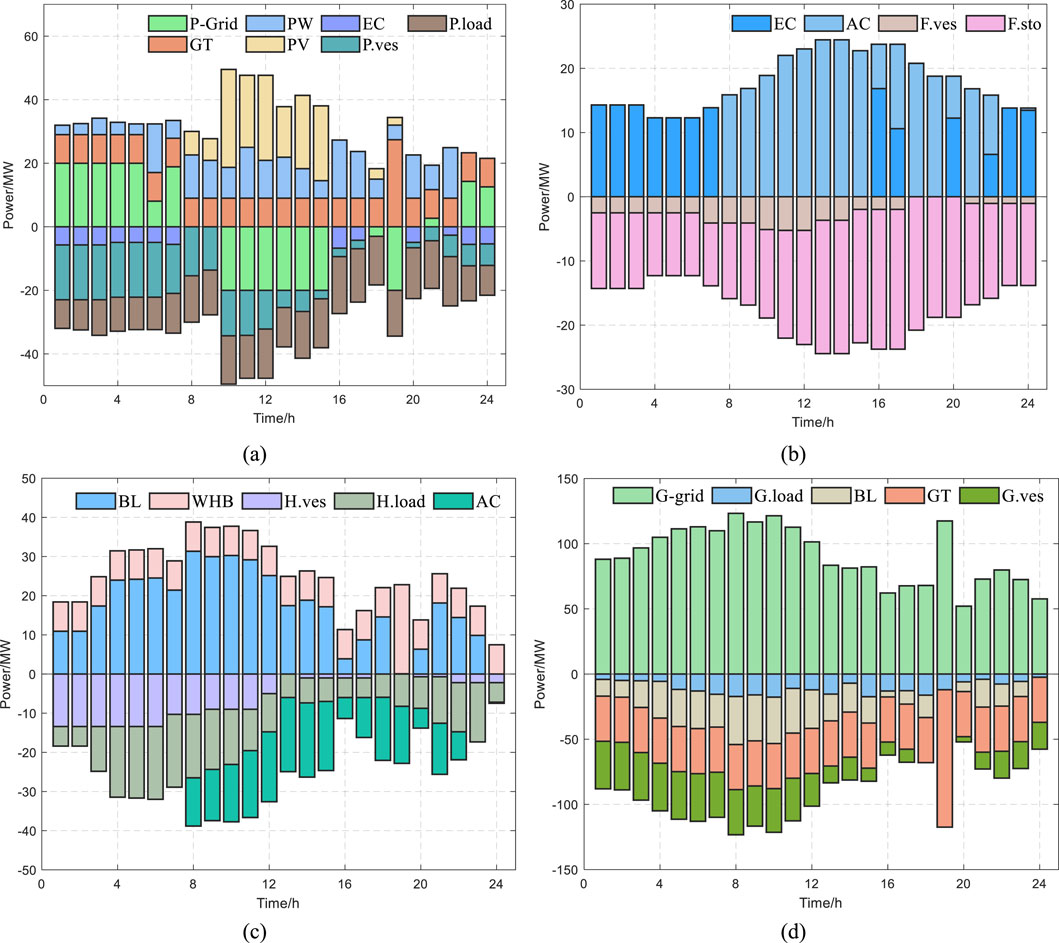
Figure 4. Energy load balancing in S4. (a) Electrical load balance. (b) Cold load balance. (c) Thermal load balance. (d) Gas load balance.
From Figure 4a, it can be observed that during 00:00–07:00, electricity prices are low due to the early morning hours, and PV input in the port area is minimal. During this period, VPP tends to purchase electricity directly from the grid, supplemented by power generation from GT and PW. Additionally, a significant number of ships dock at the port to obtain electrical energy. Between 08:00–18:00, the output from PV and PW gradually increases, leading to a notable phenomenon of electricity selling between 10:00–15:00. This process effectively transforms renewable energy into economic benefits. During 19:00–24:00, as evening peak electricity prices rise and PV output decreases, GT output slightly increases, accompanied by a small amount of electricity purchase activity.
From Figure 4b, it can be observed that during the low electricity price periods (00:00–07:00 and 22:00–24:00), the output of EC is relatively high and follows a consistent pattern. In contrast, AC primarily operates during 09:00–20:00, effectively avoiding cost increases associated with high electricity price periods. The orderly allocation of berths also helps reduce costs and improve efficiency in meeting ships’ cooling energy demands.
As shown in Figure 4c, since GT contributes significantly to supplying electricity loads, the WHB provides substantial output to balance the thermal loads. Meanwhile, BL plays a dominant role in supplying the port’s heat load. Due to a cost-oriented approach to berth scheduling, ships’ gas load is primarily concentrated during 00:00–12:00. Furthermore, due to electricity price fluctuations, the output of the AC increases significantly between 08:00–22:00.
Figure 4d aligns with the above analysis. During the peak electricity price period at 19:00, the output of the GT rises sharply, while the gas network supply remains relatively stable during other periods. This indicates that the gas network plays a crucial role in the optimized scheduling of the port’s virtual power plant.
4.3 Comprehensive benefit analysis of port virtual power plant
This section provides a detailed analysis of the distributed energy utilization rates and the economic performance of each scenario.
4.3.1 Distributed energy consumption analysis
The scheduling of the port virtual power plant is influenced by carbon quotas and the green certificate trading market, which prioritizes the use of clean energy sources to replace outputs from GT and electricity purchases from the grid. Figure 5 illustrates the capacity of offshore PV and PW as well as the renewable energy utilization levels across different scenarios.
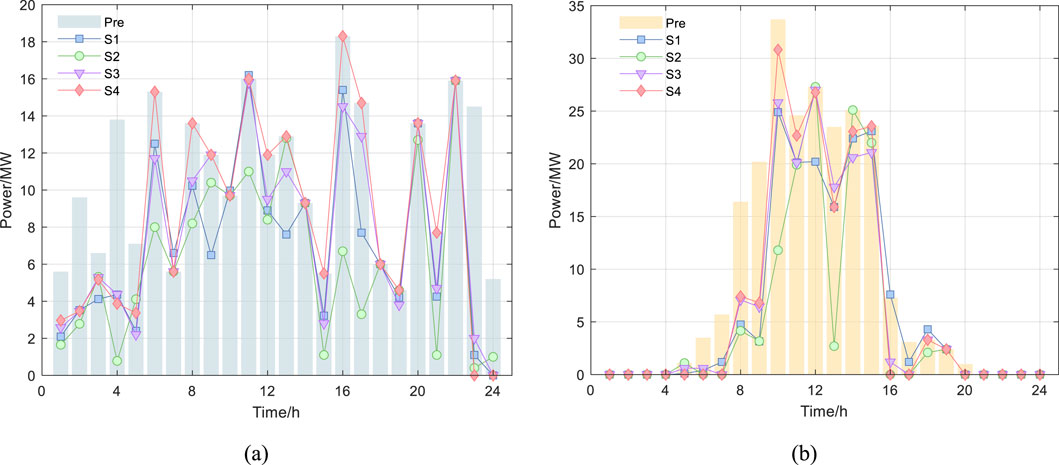
Figure 5. Comparison of PW and PV consumption in each scenario. (a) PW consumption comparison. (b) PV consumption comparison.
Figure 5a shows that the utilization of PW varies significantly across scenarios, primarily due to the minimum operating constraints of GT and the load demands of the heating and cooling networks, which frequently alter the composition of the electricity supply. During off-peak electricity hours (23:00–07:00), the market electricity purchase price is relatively low, resulting in balanced energy supply. Between 08:00–20:00, wind power output increases to varying degrees across all scenarios. Figure 5b indicates that PV generation is concentrated mainly between 09:00–16:00, and the utilization levels of PV power across scenarios are highly similar to those observed for wind power.
Figure 6 illustrates the renewable energy utilization rates across different scenarios. S4 demonstrates superior performance in renewable energy consumption due to its simultaneous consideration of green certificate carbon trading and orderly berth allocation. In contrast, S2, which does not account for the carbon trading mechanism during scheduling optimization, shows the lowest renewable energy utilization rate, reflecting its limited focus on energy structure. Overall, the performance of new energy consumption rate ε in each scenario is: S4 > S3 > S1 > S2.
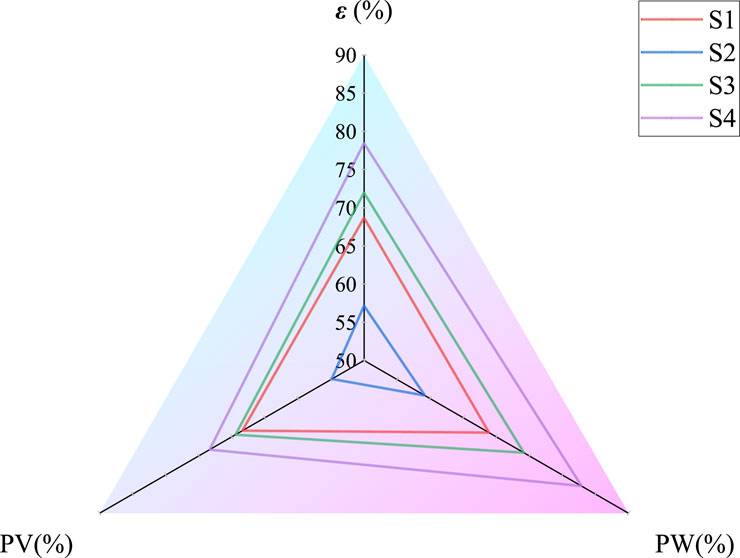
Figure 6. Distributed energy consumption level summary.
4.3.2 Comprehensive benefit analysis
To further compare and analyze the impact of the carbon trading mechanism on the economic and environmental performance of the port energy system, the scheduling costs for each scenario are presented in Table 6.
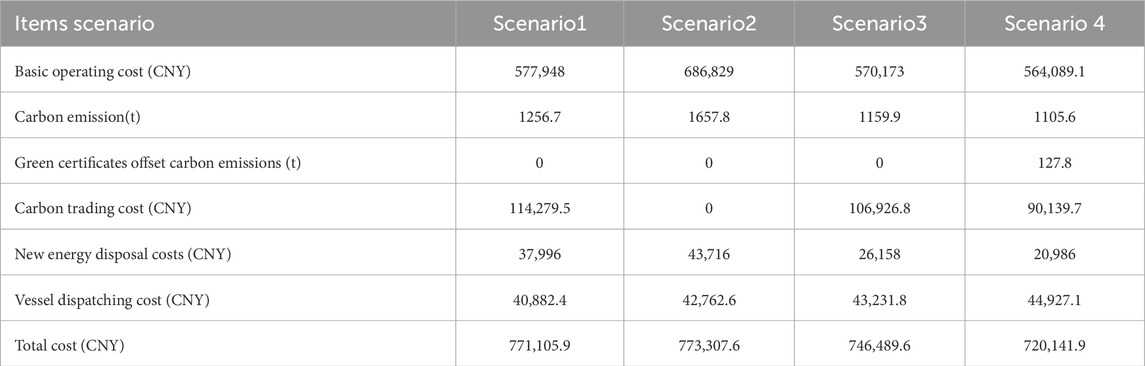
Table 6. Scheduling cost analysis.
From Table 6, it can be observed that although S2 does not account for carbon trading costs, its relatively simplistic energy structure results in significantly higher baseline operational costs compared to other scenarios. Moreover, S2 incurs the highest penalty costs for renewable energy curtailment, leading to the highest total costs overall. S1 integrates traditional berth allocation with a tiered carbon trading mechanism, resulting in total costs comparable to those of S2. S3 introduces orderly berth allocation, which makes more efficient use of renewable energy. Despite a 5.7% increase in ship scheduling costs compared to S1, the total cost is reduced by 3.1%. S4 combines orderly berth allocation with a green certificate-based tiered carbon trading mechanism, achieving a 21.1% reduction in carbon trading costs compared to S1. Even with higher ship scheduling costs, the total cost is still 3.53% lower than S3, demonstrating excellent economic efficiency and environmental sustainability.
5 Conclusion
In this paper, we address the challenges of berth allocation, energy dispatch, and carbon emission planning at ports by proposing an optimized dispatch framework for port virtual power plants, which integrates orderly berth allocation strategies with a green certificate-tiered carbon trading mechanism.
This model systematically integrates the berthing behaviors of passenger and cargo ships into the energy dispatch framework of VPP by adopting a coordinated berth allocation strategy. The proposed framework optimizes the multi-dimensional energy supply of ports, including electricity, heating, cooling, and natural gas. During their mooring periods, ships can directly utilize energy provided by the port, thereby fully leveraging the dispatch potential of port energy resources. This approach significantly enhances the overall efficiency and utilization of the port’s energy system.
A green certificate-based tiered carbon trading mechanism is introduced, where cleanliness metrics are incorporated as key factors in the optimization decisions of port virtual power plant. The mechanism encourages increased adoption and dispatch of clean energy within the system, thereby enhancing both the economic and social benefits of port virtual power plants. Additionally, it serves as a strong foundation for advancing the green transition and ensuring the sustainable development of port energy management.
The optimization strategy for the port virtual power plant presented in this study demonstrates notable advantages in balancing economic efficiency with clean energy utilization. Moving forward, this research will explore the potential applications of integrating energy complementarity mechanisms and logistics characteristics into port virtual power plants. This includes investigating innovative vessel-to-vessel (V2V) energy interaction models and conducting detailed analyses of the collaborative optimization and alignment between ships, port infrastructure (crane), and heavy-duty freight vehicles. These efforts aim to enhance the complementary strengths of the energy system, optimize logistics operations, and drive intelligent and sustainable development of port virtual power plants.
Data availability statement
The original contributions presented in the study are included in the article/supplementary material, further inquiries can be directed to the corresponding author.
Author contributions
JL: Writing – review and editing, Conceptualization, Investigation, Methodology, Software, Writing – original draft. JZ: Conceptualization, Data curation, Formal Analysis, Investigation, Resources, Supervision, Writing – original draft. FM: Resources, Software, Supervision, Writing – review and editing. YD: Conceptualization, Formal Analysis, Methodology, Supervision, Writing – review and editing. YX: Formal Analysis, Methodology, Supervision, Writing – review and editing. AG: Methodology, Software, Supervision, Validation, Visualization, Writing – review and editing.
Funding
The author(s) declare that financial support was received for the research and/or publication of this article. The work is supported by State Grid JiangSu Electric Power Co., LTD. Science and Technology project (J2024198). The funder was not involved in the study design, collection, analysis, interpretation of data, the writing of this article, or the decision to submit it for publication.
Conflict of interest
The authors declare that the research was conducted in the absence of any commercial or financial relationships that could be construed as a potential conflict of interest.
Generative AI statement
The author(s) declare that no Generative AI was used in the creation of this manuscript.
Publisher’s note
All claims expressed in this article are solely those of the authors and do not necessarily represent those of their affiliated organizations, or those of the publisher, the editors and the reviewers. Any product that may be evaluated in this article, or claim that may be made by its manufacturer, is not guaranteed or endorsed by the publisher.
References
Babazadeh, V., Shayeghi, H., Jalili-Irani, A., and Aghajani, G. (2025). Optimal demand response in virtual power plant using local/global service providers in interaction with energy storage systems. J. Clean. Prod. 496, 145058. doi:10.1016/j.jclepro.2025.145058
Bouzekri, H., Alpan, G., and Giard, V. (2023). Integrated laycan and berth allocation problem with ship stability and conveyor routing constraints in bulk ports. Comput. and Industrial Eng. 181, 109341. doi:10.1016/j.cie.2023.109341
Chen, H., Wu, H., Li, H., Chen, F., Shui, S., and Li, Z. (2025). Bi-level optimal scheduling of integrated energy systems considering incentive-based demand response and green certificate-carbon trading mechanisms. Energy Rep. 13, 330–344. doi:10.1016/j.egyr.2024.12.016
Chong, D., Tian, Z., Yan, H., Sha, Z., Wang, Z., and Zhao, Q. (2025). Coordination optimization within large-scale virtual power plant for frequency stability improvement under internal power and external frequency fluctuations. Appl. Energy 384, 125416. doi:10.1016/j.apenergy.2025.125416
Gong, X., Li, X., and Zhong, Z. (2025). Strategic bidding of virtual power plants in integrated electricity-carbon-green certificate market with renewable energy uncertainties. Sustain. Cities Soc. 121, 106176. doi:10.1016/j.scs.2025.106176
Ji, B., Song, Y., Yu, S. S., and Wei, Q. (2024). A modified adaptive large neighborhood search algorithm for solving the multi-port continuous berth allocation problem with vessel speed optimization. Comput. and Industrial Eng. 198, 110699. doi:10.1016/j.cie.2024.110699
Ji, C., Chen, B., Zhao, W., Wang, X., and Qian, W. (2025). Selection of emission reduction modes for energy-intensive enterprises under the dynamic carbon cap-and-trade regulation. Heliyon 11 (3), e42424. doi:10.1016/j.heliyon.2025.e42424
Li, H., Li, S., Jia, P., Zhang, J., and Ma, Q. (2025). Integrated optimization of berth and unloader allocation at dry bulk ports considering load reduction and berth shifting. Ocean. Eng. 321, 120454. doi:10.1016/j.oceaneng.2025.120454
Li, Y., Chang, W., and Yang, Q. (2025). Deep reinforcement learning based hierarchical energy management for virtual power plant with aggregated multiple heterogeneous microgrids. Appl. Energy 382, 125333. doi:10.1016/j.apenergy.2025.125333
Li, Y., Yang, Z., Li, G., Zhao, D., and Tian, W. (2019). Optimal scheduling of an isolated microgrid with battery storage considering load and renewable generation uncertainties. IEEE Trans. Industrial Electron. 66 (2), 1565–1575. doi:10.1109/tie.2018.2840498
Liu, L., Luo, X., Xiong, L., Guo, J., Liu, X., Liu, Y., et al. (2025). Preset power based droop control for improving primary frequency regulation of inverters under large disturbances. IEEE Trans. Power Electron. 40 (7), 9153–9166. doi:10.1109/tpel.2025.3547018
Lyu, X., Lalla-Ruiz, E., and Schulte, F. (2025). The collaborative berth allocation problem with row-generation algorithms for stable cost allocations. Eur. J. Operational Res., S0377221724009925. doi:10.1016/j.ejor.2024.12.048
Ma, G., Zhang, B., Li, X., and Zheng, J. (2025). An equilibrium model of the Chinese carbon trading market under the uncertainty of market demand: application to thermal power industry. Energy Policy 198, 114505. doi:10.1016/j.enpol.2025.114505
Ma, H., Xiang, Y., Zhao, A. P., Li, S., and Liu, J. (2025). Optimal peer-to-peer coupled electricity and carbon trading in distribution networks. Engineering. 329, 115229. doi:10.1016/j.eng.2025.01.006
Mao, A., Yu, T., Ding, Z., Fang, S., Guo, J., and Sheng, Q. (2022). Optimal scheduling for seaport integrated energy system considering flexible berth allocation. Appl. Energy 308, 118386. doi:10.1016/j.apenergy.2021.118386
Martin-Iradi, B., Pacino, D., and Ropke, S. (2024). An adaptive large neighborhood search heuristic for the multi-port continuous berth allocation problem. Eur. J. Operational Res. 316 (1), 152–167. doi:10.1016/j.ejor.2024.02.003
Molavi, A., Lim, G. J., and Shi, J. (2020). Stimulating sustainable energy at maritime ports by hybrid economic incentives: a bilevel optimization approach. Appl. Energy 272, 115188. doi:10.1016/j.apenergy.2020.115188
Nadimi, R., Takahashi, M., Tokimatsu, K., and Goto, M. (2025). Impact of minimum bid requirement of Japan’s electricity market on virtual power plant’s profit. Heliyon 11 (2), e42067. doi:10.1016/j.heliyon.2025.e42067
Nair, K. B. L., and Shereef, R. M. (2022). “Voltage stability assessment of transmission system with electric vehicles as virtual power plants,” in 2022 IEEE International Power and Renewable Energy Conference (IPRECON), Kollam, India, 16-18 December 2022 (IEEE), 1–6.
Nazri, S. N. A., Mokhtar, K., Abu, B. A., Mclellan, B. C., and Mhd Ruslan, S. M. (2024). Optimization berth allocation in container terminals: a Pyomo and Google Colab approach. Ocean and Coast. Manag. 258, 107359. doi:10.1016/j.ocecoaman.2024.107359
Pandey, A. K., Jadoun, V. K., and Sabhahit, J. N. (2025). Scheduling and assessment of multi-area virtual power plant including flexible resources using swarm intelligence technique. Electr. Power Syst. Res. 238, 111139. doi:10.1016/j.epsr.2024.111139
Parise, G., Parise, L., Martirano, L., Ben Chavdarian, P., Chun-Lien Su, , and Ferrante, A. (2016). Wise port and business energy management: port facilities, electrical power distribution. IEEE Trans. Industry Appl. 52 (1), 18–24. doi:10.1109/tia.2015.2461176
Saad Suliman, M., and Farzaneh, H. (2025). Data-driven modeling of the aggregator-based price-maker virtual power plant (VPP) in the day-ahead wholesale electricity markets; evidence from the Japan Electric power Exchange (JEPX) market. Int. J. Electr. Power and Energy Syst. 164, 110433. doi:10.1016/j.ijepes.2024.110433
ScienceDirect (2025). A method for evaluating the regulation capacity of thermostatically controlled load group based on state complementary control strategy. Available online at: https://www.sciencedirect.com/science/article/pii/S2352484724006395 (Accessed March 02, 2025).
Shao, X., Zhong, W., and Wu, G. (2024). “Optimization of primary frequency regulation for virtual power plants based on data-driven and grey wolf optimizer,” in 2024 IEEE PES 16th Asia-Pacific Power and Energy Engineering Conference, Nanjing, China, 25-27 October 2024 (IEEE), 1–5.
Smartport (2025). System integration energy. Available online at: https://smartport.nl/en/project/systeemintegratie-energie/ (Accessed February 21, 2025).
Thanos, E., Toffolo, T., Santos, H. G., Vancroonenburg, W., and Vanden Berghe, G. (2021). The tactical berth allocation problem with time-variant specific quay crane assignments. Comput. and Industrial Eng. 155, 107168. doi:10.1016/j.cie.2021.107168
Tozak, M., Taskin, S., and Sengor, I. (2024). “Stability analysis of virtual power plant with grid forming converters,” in 2024 International Conference on Smart Energy Systems and Technologies (SEST), Torino, Italy, 10-12 September 2024 (IEEE), 1–6.
Wang, B., Geng, L., and Tam, V. W. Y. (2025). Effective carbon responsibility allocation in construction supply chain under the carbon trading policy. Energy 319, 135059. doi:10.1016/j.energy.2025.135059
Wang, Y., Han, L., Deng, X., and Gao, H. (2025). Optimization scheduling of household integrated energy systems for improving thermal comfort with low cost. Energy Build. 329, 115229, doi:10.1016/j.enbuild.2024.115229
Wu, G., Li, T., Xu, W., Xiang, Y., Su, Y., Liu, J., et al. (2023). Chance-constrained energy-reserve co-optimization scheduling of wind-photovoltaic-hydrogen integrated energy systems. Int. J. Hydrogen Energy 48 (19), 6892–6905. doi:10.1016/j.ijhydene.2022.03.084
Xiang, X., Chang, X., Gong, L., and Liu, X. (2025). An innovative framework for optimizing discrete berth allocation and quay crane assignment problems. Comput. and Industrial Eng. 200, 110827. doi:10.1016/j.cie.2024.110827
Xu, Z., Zhong, W., and Liu, M. (2024). “Frequency response improvement through coordinated control of virtual power plants,” in 2024 6th Asia Energy and Electrical Engineering Symposium (AEEES), Chengdu, China, 28-31 March 2024 (IEEE), 687–692.
Yan, S., Lu, C. C., Hsieh, J. H., and Lin, H. C. (2015). A network flow model for the dynamic and flexible berth allocation problem. Comput. and Industrial Eng. 81, 65–77. doi:10.1016/j.cie.2014.12.028
Yue, M., Wang, Y., Guo, S., Dai, L., and Hu, H. (2025). A multi-objective optimization study of berth scheduling considering shore side electricity supply. Ocean and Coast. Manag. 261, 107500. doi:10.1016/j.ocecoaman.2024.107500
Zhang, J., Wu, H., Akbari, E., Bagherzadeh, L., and Pirouzi, S. (2025). Eco-power management system with operation and voltage security objectives of distribution system operator considering networked virtual power plants with electric vehicles parking lot and price-based demand response. Comput. Electr. Eng. 121, 109895. doi:10.1016/j.compeleceng.2024.109895
Zhang, Y., Liang, C., Shi, J., Lim, G., and Wu, Y. (2022). Optimal port microgrid scheduling incorporating onshore power supply and berth allocation under uncertainty. Appl. Energy 313, 118856. doi:10.1016/j.apenergy.2022.118856
Keywords: port virtual power plant, berth optimization, carbon trading, energy management, scheduling optimization
Citation: Lu J, Zheng J, Mei F, Ding Y, Xie Y and Gao A (2025) An optimal scheduling strategy of port virtual power plant considering orderly berth allocation and green certificate-tiered carbon trading mechanism. Front. Energy Res. 13:1610648. doi: 10.3389/fenrg.2025.1610648
Received: 12 April 2025; Accepted: 24 July 2025;
Published: 12 August 2025.
Edited by:
Nikolas Xiros, University of New Orleans, United StatesReviewed by:
Titan C. Paul, University of South Carolina Aiken, United StatesLei Liu, Xi’an Jiaotong University, China
Copyright © 2025 Lu, Zheng, Mei, Ding, Xie and Gao. This is an open-access article distributed under the terms of the Creative Commons Attribution License (CC BY). The use, distribution or reproduction in other forums is permitted, provided the original author(s) and the copyright owner(s) are credited and that the original publication in this journal is cited, in accordance with accepted academic practice. No use, distribution or reproduction is permitted which does not comply with these terms.
*Correspondence: Jianyong Zheng, emp5c2V1MTk2NkAxNjMuY29t