 Yige Sun*
 Hanlin Wang
- School of Economics, Shandong University of Technology, Zibo, China
This paper delves into how to collaboratively reduce emissions of sulfur dioxide, nitrogen oxides, and carbon dioxide through rational energy consumption and governance investment strategies with limited funds. The main research contents include: employing the Granger causality test to analyze the causal relationship between air quality and pollutant emissions; using functional analysis to determine the quantitative relationship between energy consumption and the emissions of various pollutants; applying multi-objective programming method to establish an integrated model for collaborative emission reduction optimization that considers both energy consumption and governance investment, and analyzing the optimality conditions of the model; and conducting an empirical analysis of the model using Tianjin’s social development data from 2005 to 2021. The optimal carbon dioxide emissions calculated by the model are significantly lower than the actual emissions, with an average optimization efficiency of 38.43%. Through reasonable energy allocation and governance investment strategies, it is possible to effectively reduce pollutant emissions while ensuring production demands. The research results of this paper provide a theoretical basis and practical guidance for formulating rational energy use and governance investment strategies.
1 Introduction
In most cities, the air quality primarily depends on the levels of air pollutant concentrations. As an industrial country, the development of Chinese cities largely relies on energy-intensive secondary industries. This development pattern, while driving rapid economic growth, has also led to the massive amount of pollutant emission into the air. In particular, exhaust gases emitted from fossil fuel combustion, which cannot disperse efficiently in urban areas, pose a significant threat to air quality. To evaluate air environmental quality, China has successively implemented the Air Pollution Index (API) and the Air Quality Index (AQI). According to the calculation criteria of these two indices, sulfur dioxide (SO2) and nitrogen oxides (NOx) are recognized as key determinants of air quality.
Since the signing of the Kyoto Protocol, China has prioritized the reduction of green-house gases such as carbon dioxide (CO2) in government work. In recent years, fine particulate matter (PM2.5) has increasingly garnered attention, with its harmful substances mainly originating from human activities such as energy combustion, power generation, metallurgy, petroleum, and chemical engineering. According to recent research by the Chinese Academy of Sciences (Huang et al., 2014), when considering coal burning, industrial pollution, and secondary inorganic aerosols together, emissions from fossil fuel combustion have become the primary source of PM2.5 pollution in Beijing. Furthermore, PM2.5 can also be converted from sulfur and nitrogen oxides, which are largely produced when humans burn fossil fuels (such as coal and oil) and waste.
It is evident that these severe environmental issues primarily stem from the combustion of fossil fuels to meet the demands of human social development and ensure people’s living. Although people have fully recognized the severity of the problem and have actively explored and practiced various approaches, including improving combustion technology, developing new energy sources, adjusting lifestyles, and restructuring industries, it cannot be denied that fossil fuels remain the primary energy support for China’s current social development. However, fossil fuels are diverse in types and vary in usage ways. Under different usage conditions, different types of energy produce varying amounts of pollutants, but there are also certain correlations among them.
Since sulfur dioxide (SO2) in the atmosphere mainly originates from the combustion of sulfur-containing fuels such as coal and oil, with more than 90% of SO2 emissions in China contributed by coal-fired activities (Sun, 2003). Since the 1980s, China has focused on con-trolling SO2 emissions through various technical measures, including optimizing the coal structure, increasing the use of cleaned coal, adopting clean combustion technologies, and encouraging key emitting sectors to install flue gas desulfurization facilities. At the economic management level, measures such as shutting down small thermal power units, formulating strict emission standards for coal-fired power plants, and implementing total emission control have been adopted. Nitrogen oxides (NOx) play a crucial role in the formation of photochemical smog and are also a major factor driving the transition of acid rain types from sulfuric acid to nitric acid in China. This is partly attributed to the late start of NOx control efforts in China, leading to a rapid increase in nitrogen dioxide (NO2) emissions during the “11th Five-year Plan” period. In the national “12th Five-year Plan”, NOx following SO2 was listed as another important air pollutant subject to total emission control. Currently, China’s NOx prevention and control strategies encompass promoting low-NOx combustion technologies, flue gas denitrification technologies, and implementing production capacity control, and so on. Furthermore, both SO2 and NOx are considered precursors of PM2.5. Therefore, their collaborative emission reduction holds far-reaching significance for preventing haze weather and effectively controlling PM2.5 concentrations.
Carbon dioxide (CO2), recognized globally as a greenhouse gas, has become a top priority for governments in their efforts to mitigate climate change since the issue of global warming has become increasingly prominent. According to the Fourth Assessment Report of the Intergovernmental Panel on Climate Change (IPCC), CO2 is the most critical anthropogenic greenhouse gas, and the continuous rise of global CO2 concentrations is mainly attributed to the extensive use of fossil fuels (IPCC, 2007). Statistical data from the International Energy Agency (IEA) also show that China’s total carbon emissions surpassed those of the United States in 2007, becoming the largest contributor to global carbon emissions. In 2016, China accounted for 19.12% of the world’s total carbon dioxide emissions (Quire et al., 2015). At the 2015 World Climate Conference, China submitted its nationally determined contribution report to committing to reduce carbon intensity by 60%–65% below 2005 levels by 2030. This will accelerate China’s green and low-carbon transition and provide a foundation for achieving the global temperature rise control target of 2 °C. China’s target of cutting carbon dioxide emissions per unit of GDP by 40%–45% from 2005 levels by 2020 was achieved ahead of schedule in 2019.
All three aforementioned gases originate from the combustion of fossil fuels. However, given the current technological limitations that prevent a complete substitution of fossil fuels, they will continue to be an important part of China’s energy structure in the near future. The primary fossil fuels used in China include coal, oil, and natural gas. Although all three produce these pollutants when burned, due to differences in combustion mechanisms, there are significant variations in the emissions of these gases for the same energy output. For instance, coal, with its higher sulfur content, produces much more sulfur dioxide (SO2) when burned compared to oil and natural gas. Oil combustion, on the other hand, generates significantly more nitrogen oxides (NOx) than the other two fuels. Natural gas is considered a clean energy source, but its combustion produces more carbon dioxide (CO2) than coal and oil. Additionally, different energy usage ways can also influence the proportion of gas emissions. For example, in the industrial sector, due to relatively advanced desulfurization and denitrification technologies for waste gases, the production of sulfur dioxide from coal combustion is relatively low. However, when oil is used, the higher temperatures result in higher nitrogen oxides emissions compared to other sectors.
Given these differences in energy types and usage ways, the topic of collaborative emission reduction studied in this paper focuses on how to rationally optimize the reasonable arrangement of different energies across various sectors, ensuring that production demands are met while minimizing energy consumption as much as possible. Currently, the issue of collaborative emission reduction has garnered considerable attention from some scholars. For example, Bollen et al. (2009) conducted an in-depth analysis of the co-benefits of collaborative governance for air pollution and global warming from an economic perspective. Rafaj et al. (2013) compared changes in emissions of atmospheric pollutants such as sulfur dioxide (SO2) and nitrogen oxides (NOx) before and after the implementation of global greenhouse gas control agreements. Their research results indicated that policy measures aimed at controlling greenhouse gas emissions have a positive impact on reducing emissions of atmospheric pollutants. Gu et al. (2016) selected three important industries in China, namely electric power, steel and cement, to analyze and calculate the SO2 emission reduction effect in the first 2 years of “11th Five-Year Plan” and “12th Five-Year Plan”, as well as the synergistic effect of CO2 emission reduction. Zhang et al. (2018) established a quantitative model for the effectiveness of energy conservation and emission reduction policies, and explored the differences in the impact of energy conservation and emission reduction policies on their effects in Beijing-Tianjin-Hebei. Wang et al. (2019) constructed an intergovernmental emission reduction evolution model to simulate the evolution process of strategy selection of independent emission reduction and cooperative emission reduction by local governments in the region, and then put forward relevant policy suggestions for improving the relationship of regional cooperation on emission reduction. Gao et al. (2021) constructed a synergistic effect evaluation method for pollutant control and greenhouse gas emission reduction, and evaluated the synergistic effect of greenhouse gas emission reduction caused by pollution control effects produced by energy structure adjustment and industrial structure adjustment in China from 2013 to 2017. Li et al. (2022) developed an evaluation model for coordinated control of PM2.5 and O3 in the Beijing-Tianjin-Hebei region, and identified the optimal project for NOx and VOCs co-reduction that minimizes abatement costs under different air quality targets. Zhao et al. (2023) used multi-period double difference to analyze and evaluate the synergistic effect and influence mechanism of China’s low-carbon city policies on CO2 emission reduction and PM2.5 pollution control at the urban scale from 2007 to 2019.
However, most of these studies have approached the issue from an economic or technical perspective, failing to delve into the rational allocation of energy and its corresponding emission reduction benefits based on the pollution-generating characteristics of different energy sources. This paper provides an in-depth analysis of collaborative emission reduction strategies for sulfur dioxide (SO2), nitrogen oxides (NOx), and carbon dioxide (CO2) based on their shared characteristics. Furthermore, as people’s awareness of environmental protection continues to rise and government governance efforts intensify, effective waste gas governance mechanisms have been widely established for major industrial pollution sources in China. The implementation of these emission reduction measures often requires government investment or government-guided private investment. Therefore, formulating optimal emission reduction strategies under limited funding has become a critical issue that needs to be addressed urgently. This paper aims to explore how to balance various pollutant emissions and energy usage projects for pollution control investment on the basis of emission reduction, in order to achieve the best results in collaborative emission reduction.
2 Methods and theories
This section elucidates the application of three mathematical methods. Firstly, the Granger causality test is mentioned, which aims to explore potential causal relationships between air quality and pollutant emissions. Secondly, functional analysis techniques are employed, focusing on revealing quantitative links between energy consumption and emissions of various pollutants. Lastly, the multi-objective optimization method is introduced, which is utilized to construct a comprehensive optimization model that considers both energy consumption and governance investment, with the goal of achieving collaborative emission reduction and further facilitating extended optimization.
2.1 Granger causality test model
The Granger causality test model, an analytical tool in the field of econometrics, was established by Granger (1969), a Nobel laureate in economics. Its kernel principle can be articulated as follows: when considering the historical data of variables
This paper will utilize the econometric software Eviews7 to verify the causal relationship between pollutant emissions and air quality by using the Granger causality test method.
2.2 Functional relation among energy consumption, pollutant gas emissions, and investment
In this paper, energy refers to fossil fuels, and energy consumption involves the combustion of fossil fuels, which emits carbon dioxide (CO2) and various atmospheric pollutants into the atmosphere, mainly including sulfur dioxide (SO2), nitrogen oxides (NOx), smoke and dust, carbon monoxide, hydrocarbons, and so on.
2.2.1 Relation of fossil fuel combustion and sulfur dioxide (SO2)
Both coal and oil contain a certain percentage of sulfur, with the sulfur content of coal in China generally ranging from 0.5% to 3%, and that of oil approximately between 0.06% and 0.8%. Under normal combustion condition, the sulfur contained in the fuel is oxidized into sulfur dioxide (SO2). Referencing the scientific method for predicting pollutant emissions outlined in the “National 12th Five-year Plan Resource (Energy) and Environmental Economic Forecast Research Report of China” (hereinafter referred to as the “Report”) (Ministry of Environmental Protection of China, 2011), this study subdivides the whole society into several sectors with energy consumption, based on which it derives a functional relationship between energy consumption and sulfur dioxide (SO2) emission, specifically expressed in Equation 2.
where,
2.2.2 Relation of fossil fuel combustion and nitrogen oxides (NOx)
The generation of sulfur oxide mainly originates from the sulfur content in fuels, which is relatively straightforward. In contrast, the production of nitrogen oxides (NOx) involves more complex factors. According to the “Report”, the primary sources of nitrogen oxides (NOx) include the oxidation reaction of nitrogen molecules in the combustion-supporting air under high-temperature conditions and the partial oxidation process of nitrogen compounds contained in fuels during burning. The functional relationship between energy consumption and nitrogen oxides (NOx) emissions is described by Equation 3, where
From a mathematical perspective, Equations 2, 3 can be equivalently expressed in logarithmic form as Equation 4 (Yue, 2003), where
2.2.3 Relation of fossil fuel combustion and carbon dioxide (CO2)
During the combustion process of fossil fuels, their core function is to convert the energy stored within them into thermal energy through the oxidation of carbon elements, while emitting large amount of carbon dioxide (CO2) in the process. By referring to the calculation method provided in the “Report,” we can establish a functional relationship between the carbon dioxide (CO2) emissions generated from fuel combustion and its related factors, specifically expressed in Equation 5 (Ministry of Environmental Protection of China, 2011). In this equation,
From the aforementioned formulas for sulfur dioxide (SO2), nitrogen oxides (NOx), and carbon dioxide (CO2) emissions, we can observe that although the generation mechanisms of these three gases differ, their emissions are all predominantly influenced by the total social energy consumption. More specifically, there exists a positive and linear correlation between the emissions of these three pollutants and energy consumption.
2.2.4 Relation of governance investment and gas emissions
From the emission calculation formulas for various pollutants listed earlier, we can understand that in addition to carbon dioxide (CO2), waste gases generated from energy combustion also contain harmful substances such as sulfur dioxide (SO2) and nitrogen oxides (NOx). These waste gases must undergo purification processes such as desulfurization and denitrification before being emitted into the atmospheric environment. The costs required to implement these purification measures are commonly referred to as governance investments. In Equations 2–4, the efficiency of waste gas governance, namely the removal rate of each pollutant, plays a decisive role in pollution emissions. It should increase along with greater governance investments. Meanwhile, ac-cording to the law of diminishing marginal returns in economics, as the amount of investment increases, the rate of improvement in the removal rate should gradually slow down. Therefore, the functional relationship between governance investment and removal rate should conform to Equation 6; (Xu, 1999).
Where,
This results in a mathematical model (Equation 8) representing the relation among the pollutant emissions, energy consumption and governance investment.
where
2.3 Multi-objective optimization model for collaborative emission reduction
The concept of multi-objective optimization was initially proposed by economist Pareto in 1927. Its core lies in exploring how to find a solution within a specific decision-making space that optimizes multiple objectives that need to be considered simultaneously. These objectives often exhibit characteristics of the absence of unified criteria or measurement units and contradictory (Yue 2003). The difficulty in unified criteria refers to the lack of a common evaluation scale or unit of measurement among the objectives, while contradictory implies that in most cases, it is challenging to find a solution that simultaneously optimizes all objectives. Koopmans, 1951 introduced the concept of Pareto efficient solutions for multi-objective optimization problems. Meanwhile, Kuhn and Tucker (1950) also discussed the sufficient and necessary conditions for the existence of optimal solutions in multi-objective optimization. Johnsen (1968) published the first monograph on multi-objective optimization. Following in-depth explorations by numerous scholars during the 1970s and 1980s, the basic theoretical framework of multi-objective optimization was established and gradually developed into an independent disciplinary field.
When solving multi-objective optimization problems, it is often necessary for decision-makers to provide information on the preference relationships among the various objectives in order to evaluate the merits and demerits of different solutions. Hwang and Masud (1979) classified the solution methods for multi-objective optimization problems into three categories based on the manner of expressing preference information: prior evaluation methods, concurrent evaluation methods, and posterior evaluation methods. In recent years, concurrent and posterior evaluation methods have received increasing attention due to their flexibility and practicality. Multi-objective optimization techniques have been widely applied to numerous practical problems such as chemical production process optimization, material manufacturing process improvement, and logistics network design, demonstrating their powerful practical value.
From the above analysis of the amount of emissions for the three types of gases, this article will subsequently delve into the issue of collaborative emission reduction under different energy consumption patterns. Dividing the entire society into
Regarding the consumption variables, they need to meet the following requirements. Firstly, energy supply must satisfy the essential needs of social development. Let
On the other hand, fossil fuels are exhaustible, and their supply is limited naturally. Furthermore, the current society’s capabilities of energy exploitation are also subject to various constraints. Hence, it is necessary to consider the important factor of energy limitation in our model. Let
Additionally, the consumption should be nonnegative, i.e.
Based on the above objective function and constraint conditions, the following multi-objective optimization model is obtained (Hwang, 1979):
Herein, the decision variables
2.4 Analysis of optimality conditions for the model
To facilitate the analysis of the mathematical properties of model (Equation 12), we first convert it into a standard form. Let
Then, model (Equation 12) is equivalent to the following standard form (Xu, 1999):
Firstly, from Lemmas 3.1 and 3.2 in (Xu, 1999), the necessary conditions for the existence of Pareto efficient solutions for the optimization problem (Equation 14) are presented.
Theorem 1. If
Based on this, we can obtain the sufficient conditions for the existence of Pareto efficient solutions for model (Equation 14).
Theorem 2. Assuming that
By comparing the optimality conditions of model (Equation 14) with the Kuhn-Tucker (K-T) conditions of the single-objective constrained optimization problem, it can be observed that the optimality conditions for their Pareto efficient solutions can both be regarded as adding a non-negative weight, namely
Therefore, we can assign
Then, the model (Equation 12) is transformed into the following model (Equation 19) (Hwang, 1979; Xu, 199):
3 Empirical analysis based on data in tianjin from 2005 to 2021
Tianjin, a historic industrial city, has long been dominated by coal consumption in its energy structure, leading to significant atmospheric pollution issues, particularly three major air pollutants--SO2, NOx and CO2. In this empirical section, we utilize data in Tianjin spanning from 2005 to 2021 to validate our model (Equation 19).
3.1 Empirical study on granger causality test
Figure 1 presents the trend diagram of sulfur dioxide (SO2) emissions (in
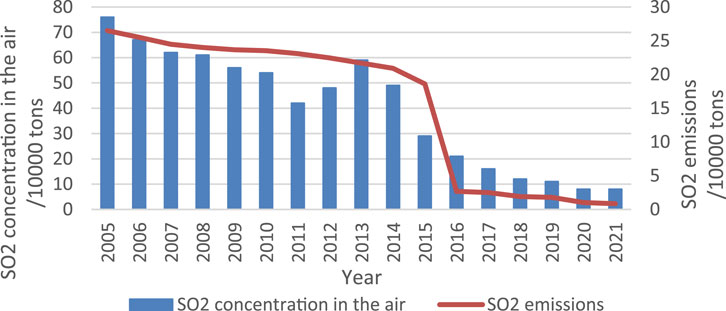
Figure 1. Trend diagram of sulfur dioxide emission and sulfur dioxide concentration in Tianjin.
From this diagram, a certain correlation can be observed between the concentration of sulfur dioxide in the air and the emission of this pollutant. To more precisely reveal the causality between them, this paper employs a statistical method--the Granger causality test. Using the professional econometric analysis software Eviews7, we conducted a detailed Granger causality test and organized the results in Table 1.
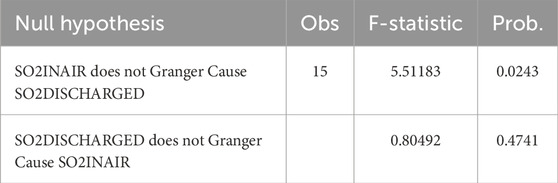
Table 1. Results of granger test.
The test results indicate that, under the condition of setting the lag term to 2, if we reject the null hypothesis that “SO2DISCHARGED is not a Granger cause of SO2INAIR,” the risk of committing Type I error is relatively high, reaching 0.4741. Conversely, if we reject the alternative null hypothesis that “SO2INAIR is not a Granger cause of SO2DISCHARGED,” the risk of committing Type I error is relatively low, at only 0.0243. Therefore, based on this statistical inference, we have reason to believe that sulfur dioxide emissions are a Granger cause of changes in sulfur dioxide concentrations in the air.
3.2 Actual parameters among energy consumption, polluting gas emission, and investment
3.2.1 Analysis of decision variables in the model
Based on the specific data of Tianjin, the conventional classification in the “Report” and statistical yearbooks, we have subdivided the whole society into 10 sectors, namely agriculture, power generation, heat supply, oil refining, gas manufacturing, industry, construction, transportation, commerce, and residential life. At the same time, fossil fuels are classified into 9 types: coal, coke, crude oil, gasoline, kerosene, diesel, fuel oil, natural gas, and coal gas. However, if this detailed classification is adopted, the standard form of the model will contain up to 90 variables, which undoubtedly leads to an extremely large calculation burden. In view of this, we have conducted appropriate merging and simplification. Specifically, based on the actual consumption scale of different energy sources by various sectors in Tianjin, we have reclassified Tianjin into five sectors: large-scale agriculture (covering agriculture, forestry, animal husbandry, fishery, and water conservancy), industry (including power generation and heat supply), transportation, retail and accommodation, and consumption of living. Furthermore, based on the similarity of emission coefficients when these sectors consume energy, the aforementioned 9 types of energy are further summarized into 3 main types: coal, oil, and natural gas.
3.2.2 Emission parameters in the model objective
Based on the Report and statistical yearbooks, the emission coefficients (in
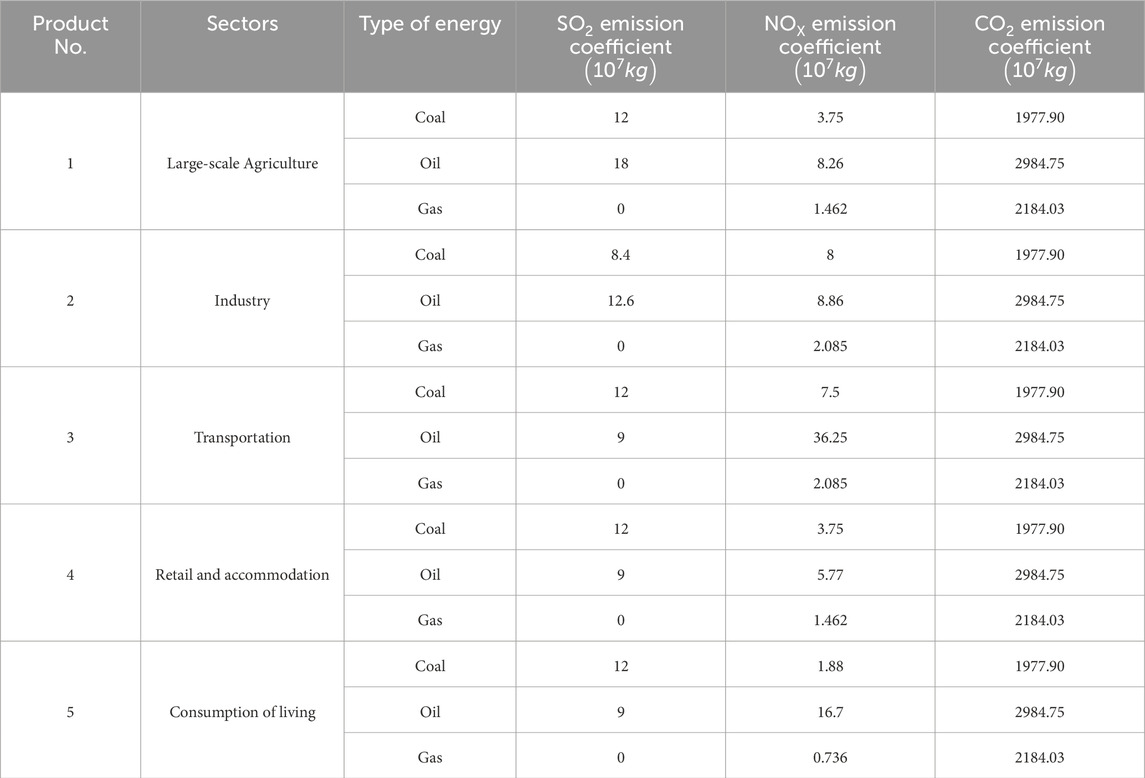
Table 2. Pollutant emission coefficient table.
This study has decided to adopt the pollutant emission coefficient data from Tianjin in 2012, which is supported by sufficient reason. Firstly, there is considerable difficulty in obtaining emission coefficient data for the period from 2017 to 2021. These data are often considered sensitive information by government departments and are dispersed across various departments and systems, posing significant challenges for external researchers attempting to access them. Additionally, opting to use the emission coefficient data of 2012 facilitates direct comparative analysis of the study’s results with those of previous years (Meng et al., 2016), thereby enabling a more accurate assessment of the evolutionary trends in pollutant emission and governance investment over time.
As shown in Table 2, the meanings of the subscripts corresponding to parameter
3.2.3 Governance investment parameter in the model objective
Given the lack of statistical data on nitrogen oxides (NOx) and carbon dioxide (CO2) emissions in Tianjin prior to 2010, this study decided to utilize the aggregate data on emissions of SO2, NOx and CO2 from 2011 to 2021 (China Emission Accounts and Datasets, 2023), combined with concurrent governance investment data of waste gas, to jointly create a trend diagram depicting the changes in governance investment data of waste gas versus emissions in Tianjin, as shown specifically in Figure 2.
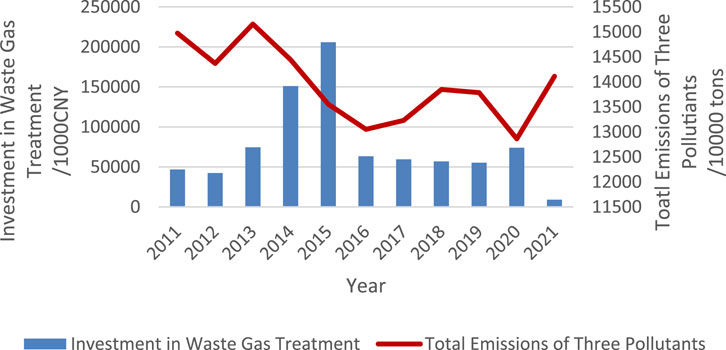
Figure 2. Trend diagram of waste gas governance investment versus emissions in Tianjin.
Specifically, we selected data on the total emissions of SO2, NOx, and CO2, as well as concurrent energy usage (China energy statistical yearbook, 2017–2021) and waste gas governance investment in Tianjin from 2011 to 2021, and incorporated these data into our model to estimate the model parameter
And the regression results are shown in Table 3 below:
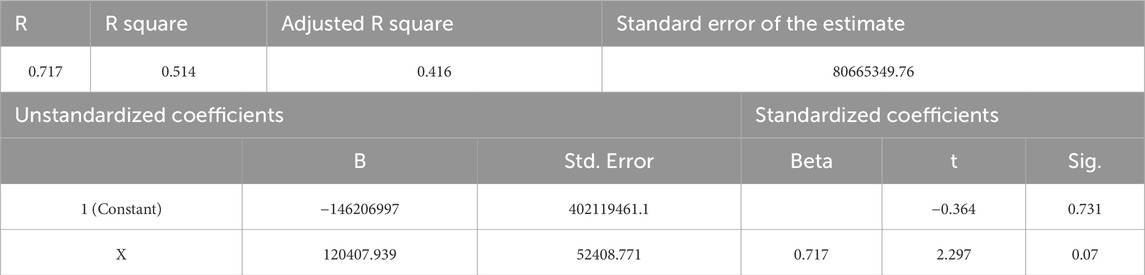
Table 3. Regression analysis results.
The regression analysis results presented in Table 3 reveal that the R-value of this model reaches 0.717, which strongly demonstrates a close and significant correlation between the model and the actual observed data. Furthermore, the R-squared value of the regression model is 0.514, indicating that the model is able to capture and explain more than half of the variability in the data, thus demonstrating the model’s excellent performance in data fitting. Additionally, the significance level of variable
3.2.4 Constraint parameters in the model
Based on the final consumption of 3 major energy products--coal, crude oil products, and natural gas-by various sectors in Tianjin from 2017 to 2021, as well as the coefficient for converting various energies into standard coal, this paper compiles the final consumption and the equivalent consumption in standard coal for each sector in Tianjin from 2017 to 2021. Table 4 presents the data for 2021 as an example.
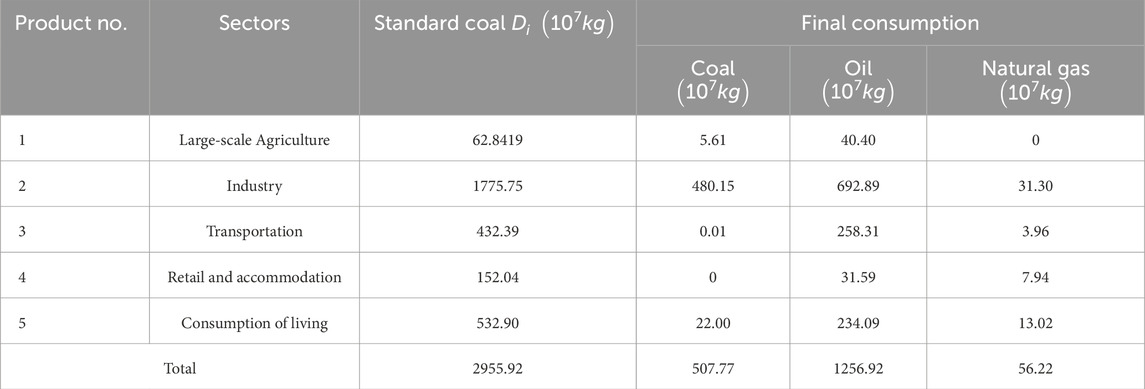
Table 4. Statistics of final energy consumption in Tianjin in 2021.
From Table 4, we can obtain the energy demand constraints in the model. Here,
Further considering the energy supply constraints of the model, since the three types of energy cannot be supplied unlimitedly and have a certain degree of complementarity under the premise of meeting energy consumption, the supply of the j-th type of energy product is set to 150% of Tianjin’s consumption for that year. The reason for this setting is that if it is set too low, there will be less room for adjustment in the energy structure.
3.3 Analysis of the solution to the optimization model
In recent years, the focus of China’s environmental protection efforts has increasingly shifted to the management of carbon dioxide (CO2) emission. Especially during the period from 2017 to 2021, the two major goals of “Carbon Peak” and “Carbon Neutrality” were established as the country’s core strategic orientations. This was followed by a series of policy releases, such as the “2023 Carbon Peak Action Plan” (State Council of China, 2021) and the “National 14th Five-Year Plan for Modern Energy System” (National Development and Reform Commission of China, 2022), which have endowed carbon dioxide governance with unprecedented policy significance and urgency. In view of this background, this paper closely examines the policy framework and established emission reduction targets, combining a meticulously constructed model to deeply analyse optimization strategies for carbon emission reduction. The aim is to provide solid theoretical support and practical guidance for the realization of the “Dual-carbon” goals.
In the specific research, based on the actual data provided in Sections 3.2.1 to 3.2.3, we substituted them into model (Equation 19) to construct a single-objective emission reduction optimization model that includes 15 non-negative decision variables and 8 linear inequality constraints. To solve this model, we fully utilized the established model parameters and efficient algorithms, with the aid of Matlab software for implementation. We present the solution process of the model in detail. Firstly, we set the weights of various pollutant emissions in the objective function of the model to
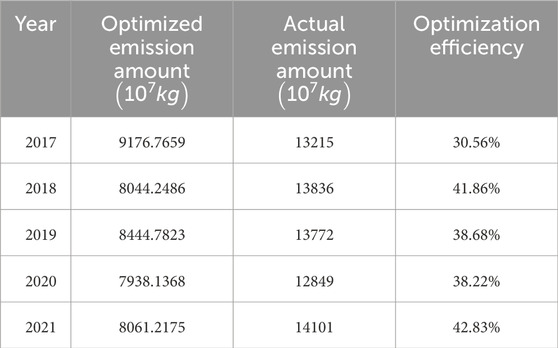
Table 5. Comparison of optimized emission with actual emission of carbon dioxide in Tianjin.
Here, this paper defines the optimization efficiency as follows:
From the table, it can be seen that under the conditions corresponding to different years, the optimized carbon dioxide (CO2) emission calculated by the model are generally lower than the actual emission for that year. Based on the above data and formulas, the average optimization efficiency of carbon di-oxide emissions in Tianjin from 2017 to 2021 was calculated to be 38.43%.
The following discussion focuses on the variation of optimized carbon dioxide (CO2) emissions under different weight scenarios, specifically the results when the weight ratio of the three gases in the model is set to 1:1: a (where a = 1, 3, 5, 7, 10), as shown in Table 6.
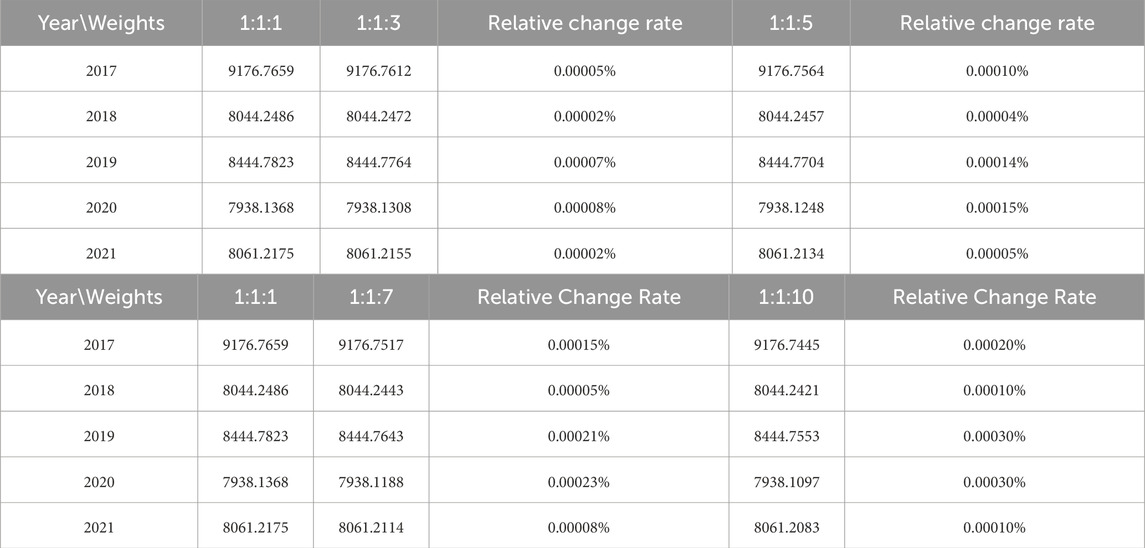
Table 6. Variation of optimized carbon dioxide emissions under different weight scenarios.
When the weight ratio of the three gases in the model is set to 1: 1: a (where a = 3, 5, 7, 10), the optimized carbon dioxide (CO2) emissions show minimal changes compared to when the weight ratio is set to 1:1:1. The relative change rates all fall within 0.001%. Therefore, variations in the weight a of carbon dioxide in the model within the range of 1–10 have a relatively small impact on the results.
To focus on the analysis of carbon dioxide (CO2) emission, the weights of various pollutant emissions in the objective function of the model were adjusted to
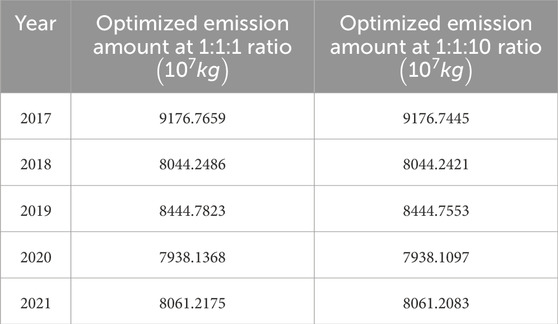
Table 7. Statistics of optimized carbon dioxide emissions in Tianjin.
Upon closely examining the table data, we can observe that even when the weight of carbon dioxide (CO2) emission is substantially increased to 10 times its original value in the model, the room for improvement in the optimization results remains relatively limited. This phenomenon suggests that when the weights are set to 1:1:1, the model has already demonstrated considerable optimization efficiency.
Next, let us further analyze the investment situation corresponding to emission reduction. Firstly, when the weights are set to 1:1:1, we calculate the cumulative optimized sulfur dioxide (SO2), nitrogen oxides (NOx), and carbon dioxide (CO2) emission in Tianjin from 2017 to 2021. Subsequently, we combine this cumulative value with the actual total energy consumption in Tianjin during the same period and substitute it into the function-al relationship between waste gas emissions, energy usage, and waste gas governance in-vestment mentioned in Section 3.2.3. By this step, we are able to estimate the amount of governance investment required to achieve optimized waste gas emissions at real energy consumption levels. The following Table 8 details the comparison between the optimized governance investment amount and the actual governance investment amount:
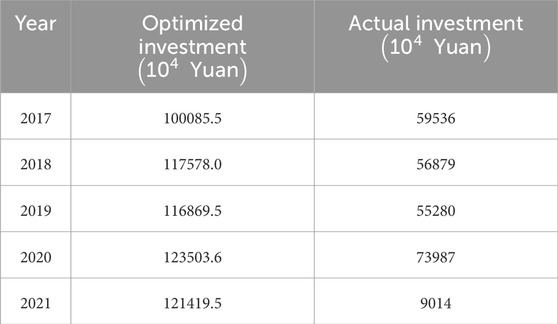
Table 8. Comparison of waste gas governance investment in Tianjin.
It can be observed from the table that the actual investment amount for waste gas governance in Tianjin from 2017 to 2021 was lower than the investment required to achieve optimal waste gas emission.
3.4 Test the waste gas governance investment in 2022
The collaborative emission reduction model (Equation 20) mentioned above can calculate the emission levels of waste gases and their corresponding governance investment. Below, we conduct a validation test on the emission-governance investment relationship for 2022. To ensure consistency with actual data, the waste gas emission
Step 1. Prediction of emission data for three kinds of waste gases.
The trend extrapolation method is adopted below to predict the emissions of major pollutants. Based on the historical data from 2017 to 2021, a linear regression model is established.
For SO2, the regression equation obtained is the following Equation 22:
where
For NOx, the regression equation obtained is the following (Equation 22):
where
For CO2, its emissions data from China energy statistical yearbook (2017–2021) are shown in Figure 3.
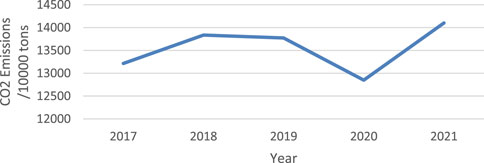
Figure 3. Trend diagram of carbon dioxide emissions from 2017 to 2021 in Tianjin.
There are significant fluctuations. Therefore, the average value of emissions from 2017 to 2021 is considered to be used as the emissions for 2022, which is 13554.60 ten thousand tons.
Step 2. Prediction of total energy consumption.
Considering the volatility of energy consumption data, the Exponential Smoothing method is used for short-term forecasting. This method is suitable for short-term forecasting of volatile data and can assign higher weights to recent data. The calculation formula is as (Equation 23):
where
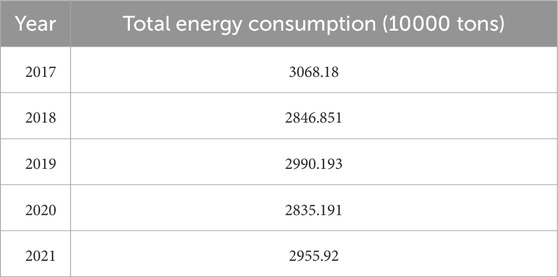
Table 9. Annual total energy consumption from 2017 to 2021.
By substituting the data into the aforementioned formula, the calculated predicted value of total energy consumption for 2022 is 2930.22 ten thousand tons.
Step 3. Prediction of waste gas governance investment in 2022.
By substituting the total energy consumption in 2022 and the predicted values of the total emissions of three types of waste gases into Formula 20, the predicted value of investment in waste gas treatment in 2022 is obtained as 260.0844 million yuan. However, after consulting the National Data (National Bureau of Statistics of China, 2024), the actual value of investment in waste gas treatment in Tianjin in 2022 is 477.46 million yuan, which is higher than the predicted value. This indicates that there is still room for a decrease in the investment in waste gas treatment in 2022, or that enterprises have increased their investment in waste gas treatment due to the impact of relevant policies.
4 Discussion
The model results show that the optimized CO2 emission amount of each year is significantly lower than the actual emission, with an average optimization efficiency of 38.43%, indicating that there is still considerable room for emission reduction in Tianjin under the current policy framework. However, the actual environmental investment amount is far below the model recommendation (for example, the actual investment in 2021 was only 7.4% of the optimized value), which directly constrains the achievement of emission reduction targets. Additionally, the sensitivity analysis of pollutant weights in the model shows that weight settings have a certain impact on the optimization results.
Based on the model results, we give the following suggestions:
1. Increase investment: It is suggested that the government should increase financial support, establish special funds for clean energy technology upgrading and “oil to gas” transformation in the transportation industry, and introduce social capital to participate in the project through PPP mode to ease the financial pressure.
2. Optimize energy structure: It is recommended to combine regional environmental carrying capacity, regularly assess and adjust weights to balance the needs of multi-pollutant co-governance. Promote the optimization of the energy structure, increase the proportion of clean energy usage, and reduce the dependence on fossil fuels. This not only helps to reduce exhaust emissions but also improves energy efficiency.
3. Improve energy efficiency: Improve energy efficiency through technological innovation and management optimization, reduce energy consumption per unit output, so as to reduce waste gas emissions.
4. Policy support: The government should introduce more incentive policies to encourage enterprises and individuals to adopt clean energy and efficient energy utilization technologies, while imposing stricter supervision and restrictions on highly polluting emission enterprises.
5. Public participation: Strengthen public education and participation, raise the awareness of the importance of waste gas treatment in the society, and encourage the public to adopt energy-saving and emission reducing lifestyles and consumption patterns.
Data availability statement
The original contributions presented in the study are included in the article/supplementary material, further inquiries can be directed to the corresponding author.
Author contributions
YS: Methodology, Conceptualization, Writing – original draft, Writing – review and editing. HW: Writing – review and editing, Software, Investigation, Methodology.
Funding
The author(s) declare that no financial support was received for the research and/or publication of this article.
Conflict of interest
The authors declare that the research was conducted in the absence of any commercial or financial relationships that could be construed as a potential conflict of interest.
Generative AI statement
The author(s) declare that no Generative AI was used in the creation of this manuscript.
Any alternative text (alt text) provided alongside figures in this article has been generated by Frontiers with the support of artificial intelligence and reasonable efforts have been made to ensure accuracy, including review by the authors wherever possible. If you identify any issues, please contact us.
Publisher’s note
All claims expressed in this article are solely those of the authors and do not necessarily represent those of their affiliated organizations, or those of the publisher, the editors and the reviewers. Any product that may be evaluated in this article, or claim that may be made by its manufacturer, is not guaranteed or endorsed by the publisher.
References
Bollen, J., Zwaan, B. V. D., Brink, C., and Eerens, H. (2009). Local air pollution and global climate change: a combined cost-benefit analysis. Resour. Energy Econ. 31, 161–181. doi:10.1016/j.reseneeco.2009.03.001
China Emission Accounts and Datasets (CEADs) (2023). Apparent carbon emission inventory. Available online at: https://www.ceads.net.cn/data/province/by_apparent_accounting/ (Accessed October 1, 2023).
China Statistical Yearbook (2021). China energy statistical yearbook (2017-2021). Beijing, China: China Statistics Press.
Gao, Q. X., Gao, W. O., Ma, Z. Y., Tang, J. J., Fu, J. F., Li, Y. X., et al. (2021). The synergy effect assessment method and its application for air pollutants and green-house gases reduction. Clim. Chang. Res. 17, 268–278. doi:10.12006/j.issn.1673-1719.2020.206
Granger, C. W. J. (1969). Investigating causal relations by econometric models and cross-spectral methods. Econometrica 37 (3), 424–438. doi:10.2307/1912791
Gu, A. L., Teng, F., and Feng, X. Z. (2016). Assessment and analysis on co-benefits of pollution control and greenhouse gases emission reduction in key sectors. China J. Popul. Resour. 26, 10–17. doi:10.3969/j.issn.1002-2104.2016.02.002
Huang, R. J., Szidat, S., Haddad, I. E., Zhang, Y. L., Schwikowski, M., Bozzetti, C., et al. (2014). High secondary aerosol contribution to particulate pollution during haze events in China. Nature 514, 218–222. doi:10.1038/nature13774
Hwang, C. L., and Masud, A. S. (1979). Multiple objective decision making methods and application. Berlin, Germany: Springer Verlag.
IPCC (2007). IPCC fourth assessment report: climate change. Cambridge, UK: Cambridge University Press.
Johnsen, E. (1968). Studies in multi-objective decision models. Gothenburg, Sweden: Studenlitteratur.
Koopmans, T. C. (1951). Analysis of production as an efficient combination of activities. Act. Anal. Prod. Alloc. 13, 33–37.
Kuhn, H. W., and Tucker, A. W. (1950). “Nonlinear optimization,” in Proceedings of proceeding of the second Berkeley symposium on mathematical statistics and probability (California, USA: University of California Press).
Li, X. Y., Wang, N., Liu, H. W., and Zhang, Z. K. (2022). Collaborative emission reduction cost and strategies of NOx and VOCs in bei-jing-tianjin-hebei region. Res. Environ. Sci. 35, 2618–2626. doi:10.13198/j.issn.1001-6929.2022.08.01
Meng, Q. C., Rong, X. X., Zhang, Y. M., Wan, X. L., Liu, Y. Y., and Wang, Y. Z. (2016). Collaborative emission reduction model based on multi-objective optimization for greenhouse gases and air pollutants. PLOS ONE 11, e0152057–17. doi:10.1371/journal.pone.0152057
Ministry of Environmental Protection of China (MEP) (2011). “Report on the forecast of resources, energy, environment, and economy in the national environmental protection,” in 12th five-year plan. Beijing, China: China Environmental Science Press.
National Bureau of Statistics of China (NBS) (2005-2021). China statistical yearbook (2005-2021). Beijing, China: China Statistics Press.
National Bureau of Statistics of China (NBS) (2024). Provincial annual data of national data. Available online at: https://data.stats.gov.cn/easyquery.htm?cn=E0103 (Accessed March 1, 2024).
National Development and Reform Commission of China (NDRC) (2022). The national 14th five-year plan for modern energy system. Natl. Dev. reform Comm. Available online at: https://www.ndrc.gov.cn/xxgk/zcfb/ghwb/202203/t20220322_1320016.html (Accessed January 29, 2022).
Quire, C. L., Moriarty, R., Andrew, R. M., Peters, G. P., and Zeng, N. (2015). Global carbon budget 2014. Earth Syst. Sci. Data Discuss. 7, 521–610. doi:10.5194/essd-7-47-2015
Rafaj, P., Schöpp, W., Russ, P., Heyes, C., and Amann, M. (2013). Co-benefits of post-2012 global climate mitigation policies. Mitig. Adapt. Strat. Gl. 18, 801–824. doi:10.1007/s11027-012-9390-6
State Council of China (SCC) (2021). Action plan for carbon dioxide peaking before 2030. Available online at: https://www.gov.cn/zhengce/zhengceku/2021-10/26/content_5644984.htm (Accessed October 24, 2021).
Sun, R. Q. (2003). Current status of sulfur dioxide pollution and control strategies in China. China Energy 7, 25–28. doi:10.3969/j.issn.1003-2355.2003.07.006
Wang, M. Y., Liu, Y., Zhong, C., Li, M. M., and Shi, W. Q. (2019). Study of strategy choice and promotion strategy of regional cooperative emission reduction. Oper. Res. Manag. Sci. 28, 35–45. doi:10.12005/orms.2019.0101
Zhang, G. X., Ye, Y. Q., Gu, X., Yin, J. H., and Lv, C. L. (2018). Difference and collaboration in jing-jin-ji’s energy saving and emission reduction policy measurers. China J. Manag. Sci. 21, 111–126. doi:10.3969/j.issn.1007-9807.2018.05.008
Keywords: energy consumption, governance investment, collaborative emission reduction, multi-objective programming method, optimization model
Citation: Sun Y and Wang H (2025) A collaborative analysis based on multi-objective programming method for energy consumption reduction and governance investment. Front. Energy Res. 13:1611945. doi: 10.3389/fenrg.2025.1611945
Received: 15 April 2025; Accepted: 02 September 2025;
Published: 23 September 2025.
Edited by:
Maria Johansson, Linköping University, SwedenReviewed by:
Ye Cai, Changsha University of Science and Technology, ChinaHao Lin, Wuyi University, China
Copyright © 2025 Sun and Wang. This is an open-access article distributed under the terms of the Creative Commons Attribution License (CC BY). The use, distribution or reproduction in other forums is permitted, provided the original author(s) and the copyright owner(s) are credited and that the original publication in this journal is cited, in accordance with accepted academic practice. No use, distribution or reproduction is permitted which does not comply with these terms.
*Correspondence: Yige Sun, eWlnZXN1bjIwMDRAMTYzLmNvbQ==