 Li Mengqi
 Chen Zhengguang3
 Huang Siqi
 Wang Qiaohua
- 1Wuhan NARI Co. Ltd., State Grid Electric Power Research Institute, Wuhan, China
- 2School of Electrical and Electronic Engineering, Huazhong University of Science and Technology, Wuhan, China
- 3State Grid Corporation of China, Beijing, China
- 4Electric Power Science Research Institute State Grid Sichuan Electric Power Company, Chengdu, China
- 5Department of Electrical Engineering, Shanghai Jiao Tong University, Shanghai, China
In dissolved gas analysis of transformers, methane is one of the key indicators for fault diagnosis, thus accurate methane detection means a lot for early transformer failure caused by partial discharge or overheat. Photoacoustic Spectroscopy (PAS) combined with Tunable Diode Laser (TDL) as light source, is to provide high precision and selectivity in gas measurement, especially in conditions of trace gas measurement with limited light length and sample volume. By constructing an experimental platform, the intensity, linearity, and stability of photoacoustic signals under different bias DC waveforms (sawtooth wave, triangle wave, and sine wave) were compared and analyzed. The experimental results indicate that different bias DC waveforms have a significant impact on the photoacoustic signal. With sine wave configuration the system achieves the best measurement performance and accurate methane measurement (under 1.4 s integrated time, the detection limit 0.2 ppm) and meets the requirement of on-line dissolved gas analysis (DGA) for transformers.
1 Introduction
Transformers, as critical components within power systems, have operational states that directly impact the safety and stability of the grid. Dissolved Gas Analysis (DGA) serves as a vital method for diagnosing internal faults in transformers, with methane (CH4) being one of the characteristic gases whose concentration changes can effectively indicate the severity of internal transformer faults (IEEE Xplore, 2019). Therefore, the accurate detection of methane concentration in oil is of significant importance for the early warning and diagnosis of transformer faults.
Traditional DGA detection technologies, such as gas chromatography, electrochemical sensing, and infrared spectroscopy, although widely used, are often limited by issues related to sensitivity, selectivity, or response time. In early photoacoustic spectroscopy DGA, broadband infrared light sources combined with narrowband filters were typically used as light sources, with mechanical choppers modulating the light signal. The moving parts could introduce instabilities, such as frequency fluctuations or phase changes, which might affect the accuracy and repeatability of measurements (Miklos et al., 2011; Liu et al., 2020). Additionally, narrowband filters, used to selectively transmit light of specific wavelengths, usually have a linewidth of tens to hundreds of nanometers, which can lead to overlapping absorption peaks of different gases, causing cross interference of absorption signals, especially severe in multi-component gas analysis (Hodgkinson and Tatam, 2013; Ren et al., 2020).
Tunable Distributed Feedback (DFB) lasers can provide very narrow linewidths (no more than 3 MHz) and highly stable output, reducing cross-interference from other gases. Moreover, as one of the most important features of tunable lasers, the wavelength of the output light can be altered by modulating the injection current of the laser (Ren et al., 2020), eliminating the need for mechanical chopping, thereby reducing vibrations and electromagnetic interference caused by mechanical choppers and simplifying the overall structure of the device.
In recent decades, there has been considerable research on laser photoacoustic spectroscopy for detecting gases in transformer oil. In 2014, WANG et al. from Dalian University of Technology utilized a DFB laser combined with an EDFA amplifier and a resonant photoacoustic cavity to detect C2H2 and CO2 in oil (Wu, 2013). In 2020, MA et al. from Harbin Institute of Technology employed a DFB laser combined with quartz-enhanced photoacoustic spectroscopy (QEPAS), using wavelength modulation and second-harmonic detection techniques, to achieve the detection of C2H2 in oil (Ma et al., 2017). In 2022, ZHU et al. from Dalian University of Technology used a DFB laser combined with an EDFA amplifier and a non-resonant cavity, along with wavelength modulation and second-harmonic detection techniques, to detect C2H2 and CH4 in oil (Zhu et al., 2022). In 2023, Zhang et al. from Xidian University designed a T-type multi-resonance cell optimized for transformer oil DGA, using quantum cascade lasers (QCLs) and interband cascade lasers (ICLs) to minimize cross-interference to measure C2H2 and CH4 (Zhang, 2010). While these studies predominantly relied on resonant photoacoustic cavities, wavelength modulation, and second-harmonic detection, practical challenges remain, particularly when dealing with cost and small gas sample volumes extracted from oil. Additionally, the influence of bias DC waveforms in tunable lasers on photoacoustic signals has not been thoroughly investigated, representing a critical gap in optimizing detection sensitivity and stability.
This paper proposes a photoacoustic spectroscopy gas detection method based on a tunable DFB laser and a non-resonant cavity. By adjusting the injection bias current waveform of the laser and comparing the gas signal strengths under different waveforms, the optimal bias DC waveform is determined to meet the requirements of practical field application.
2 Principle and method
Photoacoustic Spectroscopy (PAS) gas detection technology is a detection method based on the photoacoustic effect. Its fundamental principle relies on the absorption characteristics of gas molecules at specific wavelengths of light, and the concentration of the gas is determined by measuring the intensity of the photoacoustic signal (Zhang, 2010). In laser photoacoustic spectroscopy, a tunable laser is used as the light source, emitting modulated light that matches the absorption lines of the target gas (Chen et al., 2012). The photoacoustic cell is filled with the gas to be measured. When the modulated light passes through the cell, gas molecules absorb the light energy, generating the photoacoustic effect and producing acoustic signals. These signals are detected by a highly sensitive acoustic sensor and converted into electrical signals. After amplification, filtering, and other processing steps, the electrical signals are recorded and analyzed by a data acquisition system. By establishing the relationship between the intensity of the photoacoustic signal and the gas concentration, and using standard gases of known concentrations for calibration, the concentration of the target gas can be accurately determined (Wang et al., 2024).
2.1 The selection of laser wavelength
In the near-infrared band, methane gas exhibits strong absorption lines. According to the HITRAN database, the absorption line strength of methane at 1651 nm reaches the order of 10^-21 cm/molecule. In contrast, the absorption line strengths of carbon dioxide (CO2) and water vapor (H2O), which are present in the atmosphere at certain concentrations, are only on the order of 10^-27 cm/molecule at this wavelength. This significant difference in magnitude implies that, in practical applications, the absorption interference from carbon dioxide and water vapor on methane can be neglected. Additionally, in DGA detection, the interference from other hydrocarbon gases on methane is virtually negligible. Figure 1 shows the absorption spectra of methane, water vapor, and carbon dioxide near 1651 nm, all of which are at reasonable ambient concentration.
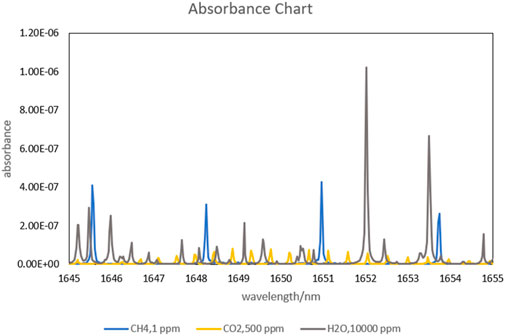
Figure 1. The absorption spectra of methane, water vapor, and carbon dioxide near 1,651 nm.
2.2 Experimental system
A schematic diagram of Laser photoacoustic is shown as Figure 2.
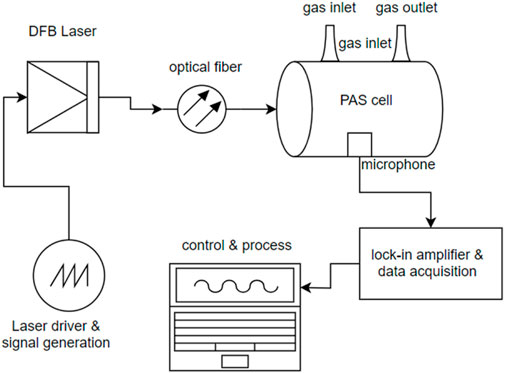
Figure 2. Schematic diagram of laser photoacoustic.
The experimental system employs a tunable DFB laser, QTDFB-16511510SA2S (Quantel Technology, China) with SM fiber pigtail, 15 mW and FC/APC connector. By adjusting the temperature and current parameters, the laser outputs a central wavelength of 1,651 nm at temperature of 30°C and bias DC of 91 mA. The laser light is delivered via a single-mode optical fiber and directly coupled into the photoacoustic cell through a coupler. To accommodate the small gas sample volumes typical in transformer DGA applications, the photoacoustic cell is designed as a non-resonant cavity made of brass. The internal shape of the cavity is cylindrical, with a volume of 5 mL, and the inner walls are polished and gold-plated to minimize adsorption and maximize reflection (Bijnen et al., 1996). A microphone is embedded within the photoacoustic cavity, model GRAS 40AD-FV1/2’ (GRAS Sound & Vibration A/S, Denmark), with a response frequency range of 3.15 Hz–10 kHz. The data acquisition device is an NI9181 (National Instruments, USA). The laser driver, signal generator, lock-in amplifier, and control software are all custom-developed programs.
2.3 Experimental method
2.3.1 Wavelength scanning method
The “Wavelength Scanning Method” involves modulating the bias DC injected into the tunable laser, thereby altering the output wavelength of the laser to periodically scan the absorption peaks of the target gas molecules. The gas molecules absorb laser light at specific wavelengths. This absorption follows the Beer-Lambert Law, which states that the amount of light absorbed is proportional to the concentration of the gas molecules. The mathematical expression of the Beer-Lambert Law is shown in Equation 1:
Where: I is the intensity of the light passing through the sample cell, I0 is the initial intensity of the light, α the absorptivity or formerly called the extinction coefficient; L is the length of light path, C is the gas concentration in the sample cell.
In this study, when the laser output light scans across the gas absorption line profile, a difference in the photoacoustic signal is formed between the absorption minimum and the absorption maximum. By periodically scanning the absorption minimum and maximum, a periodic photoacoustic signal S is generated. The microphone detects the changes in the photoacoustic signal (Zhang et al., 2018). This process can be expressed mathematically as follows:
Where: Sm is the sensitivity of the microphone; Ccell is the photoacoustic cell constant, determined by the geometric dimensions and material of the cell; Pλ the incident light power, α is the absorption coefficient of the gas molecules at the incident light wavelength, C the concentration of the target gas. When Sm and Ccell are determined, the amplitude of the photoacoustic signal is related to Pλ, α and C.
When the photoacoustic cell is filled with the target gas, C is a constant. Below, we discuss the relationship of the photoacoustic signal S with Pλ and α, respectively.
Under the assumption of negligible losses, the incident light power Pi(λ) can be replaced by the laser output power Pi(λ), which is related to the laser drive current (Li et al., 2024; Fukuda et al., 2010). At a constant temperature, the output wavelength is linearly related to the laser drive current, as expressed by the following formula:
Where: λs the initial output wavelength of the laser at a constant temperature; h is a constant related to the laser output power and wavelength.
The molecular absorption spectrum is not an ideal line with zero width but exhibits broadening due to various factors, resulting in different line profiles (Gamache, 2005; Boone et al., 2007). Depending on the broadening mechanisms, the line profiles can be categorized into three types:
Collision broadening, which dominates under high-pressure conditions and is described by the Lorentzian profile; Doppler broadening (natural broadening), which is significant in low-pressure environments and is described by the Doppler profile;
Voigt profile, which is used when both broadening mechanisms are present and neither the Doppler nor Lorentzian profile alone can accurately describe the absorption line shape. The Voigt profile is a convolution of the Lorentzian and Doppler profiles. The Voigt profile function is an integral form and does not have a simple analytical expression. Its integral form is related to the half-widths of the Lorentzian and Doppler profiles:
Where: αD is the half-width of Doppler profile; αL the half-width of the Lorentzian profiles,
By substituting Equations 3, 4 into Equation 2, the following formula is obtained:
From this, it can be concluded that the wavelength scanning method, by changing the input current to the laser, alters both the laser output power and the gas absorption coefficient (i.e., the height corresponding to the wavelength in the absorption line profile), thereby affecting the magnitude of the photoacoustic signal.
After integrating the scanned waveform, the area of the output waveform is:
where: λss and λse represent the starting and ending wavelengths generated by the laser scanning current, respectively.
Define K(λ) as:
In Equation 5, the Voigt profile remains essentially unchanged under normal temperature and pressure conditions but cannot be expressed in a simple analytical form. Instead, discrete numerical calculations of the line profile function can be employed (John, 1973).
From Equation 6, it can be observed that within a fixed wavelength scanning range, the power output aligns with the shape of the Voigt profile, and K(λ) remains constant as shown in Equation 7. The area of the photoacoustic signal exhibits a linear relationship with the gas concentration.
Based on the analysis above, the photoacoustic signal waveform, under constant laser output power, should generate a signal that matches the Voigt profile when scanning the absorption Voigt profile function. However, in practice, as the output wavelength changes during scanning, the laser output power also varies, resulting in a photoacoustic signal waveform that differs from the ideal Voigt profile.
2.3.2 The waveforms of bias DC
The bias DC input parameters include current magnitude, frequency, and waveform (Gospodinova et al., 2000; Şenel et al., 2014). The current magnitude is directly determined by the laser’s output wavelength and cannot be altered. Theoretically, the lower the frequency, the greater the cumulative photoacoustic signal (Tam, 1986). However, considering potential distortion in the microphone’s response to low-frequency signals, a modulation frequency of 15 Hz is chosen for the current.
Using a signal generator, three different waveforms of modulation current are generated: sawtooth wave, triangular wave, and sine wave. The schematic diagram of wavelength variation over time for these waveforms is shown in Figure 3 below:
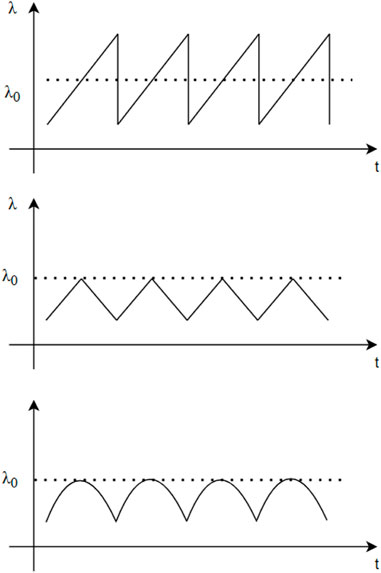
Figure 3. Three types of waveform for modulation.
3 Experimental results and discussion
3.1 PA signal waveform and phase
According to the Spectraplot database, the Voigt profile of CH4 at 1651 nm is shown in Figure 4. This absorption corresponds to second overtones (2ν3) and combination bands (ν3 + ν4) (Brown et al., 2013).
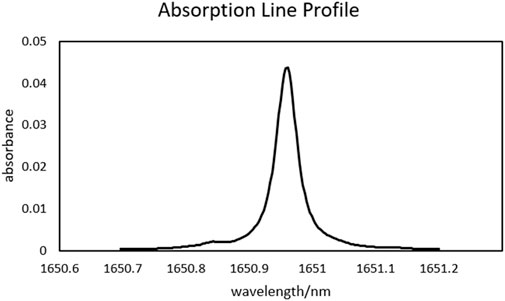
Figure 4. The absorption profile of methane at 1,651 nm.
The input waveforms of the bias DC for the tunable laser were set to sawtooth wave, triangle waveand sine wave respectively, and injected into the laser at the same frequency of 15 Hz. The photoacoustic cavity was pre-filled with 99.8 ppm calibration gas of methane. The obtained photoacoustic signal waveforms and their phase relationships with the reference waveforms are shown in the Figure 5 below.
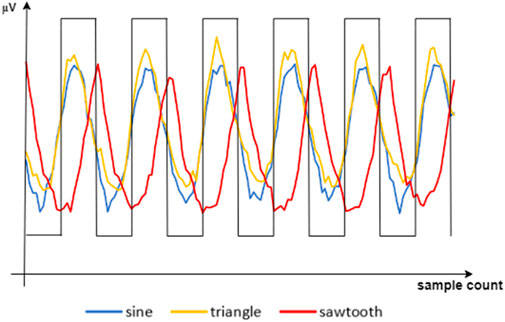
Figure 5. The PA signal waveforms with different types of waveform for modulation.
3.1.1 Sawtooth wave method
When using a sawtooth wave as the bias DC waveform, the calculation method for φ∆ is the same as in Equation 6. When the wavelength λ0 is between λss and λse, the photoacoustic signal waveform should approximate the truncated waveform of the gas Voigt absorption profile. As shown in Figure 6., the scanned range of wavelength is from 1650.8 nm to 1651.1 nm, covering the whole absorption peak, and the intercepted area forms a larger photoacoustic signal area. However, in this process, it is challenging in engineering application to stabilize the wavelength at the midpoint between λss and λse. When calculating the waveform area using a lock-in amplifier, the phase cannot remain consistent. Also as indicated in Figure 5., the phase of signal waveform is not in line with the reference, but in this case, has a 70° phase lag.

Figure 6. The scanned range of wavelength under sawtooth wave method.
3.1.2 Triangle wave method
To address the phase inconsistency issue of the sawtooth wave, a triangle wave was used to modulate the bias DC. The driving current was started from 1650.8 nm as λss and increased to the absorption peak central wavelength λ0 1650.95 nm as the ending point λse then gradually decreased from the peak back to λss. When this driving method operates on the left half-cycle of the gas absorption profile, the photoacoustic signal generated by the target gas is in the same phase with the background noise signal. When operating on the right half-cycle, the photoacoustic signal generated by the target gas is in the opposite phase with the background noise signal. This study focuses on the left half-cycle of the gas absorption profile, as shown in Figure 7 below.
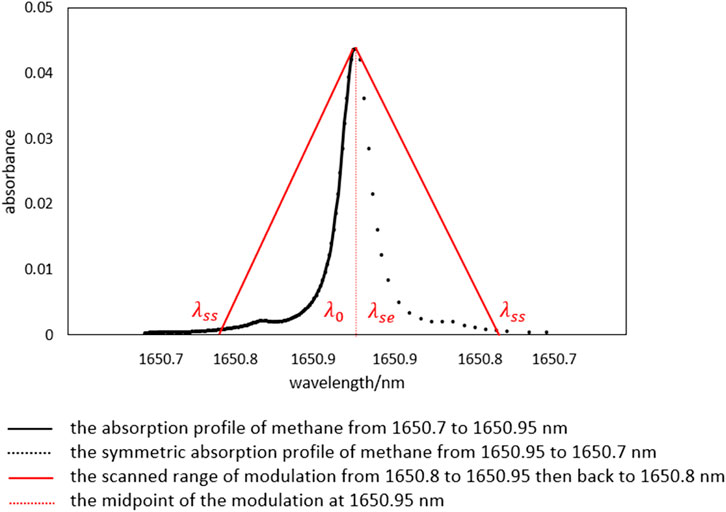
Figure 7. The scanned range of wavelength under triangle wave method.
The calculation method for φ∆ in the triangle wave is the same as in Equation 6. By selecting λ0 as the scanning cutoff wavelength and leveraging the symmetry of the Voigt profile, the rising and falling edges of the modulation current generate symmetrical photoacoustic signals. Although the waveform does not perfectly match the Voigt profile, it is more resembled on shape to the Voigt profile than the sawtooth wave. When λss and λse strictly scan the left half-cycle of the Voigt profile, the peak of the photoacoustic signal appears at a 180° phase, which helps reduce external interference during lock-in calculations.
3.1.3 Sine wave method
To further enhance the intensity of the photoacoustic signal, i.e., increase the scanning area, a sine wave was used as the modulation current waveform. The practice is generally the same as it is under triangle wave method only the sine waveform applied, as shown in Figure 8.
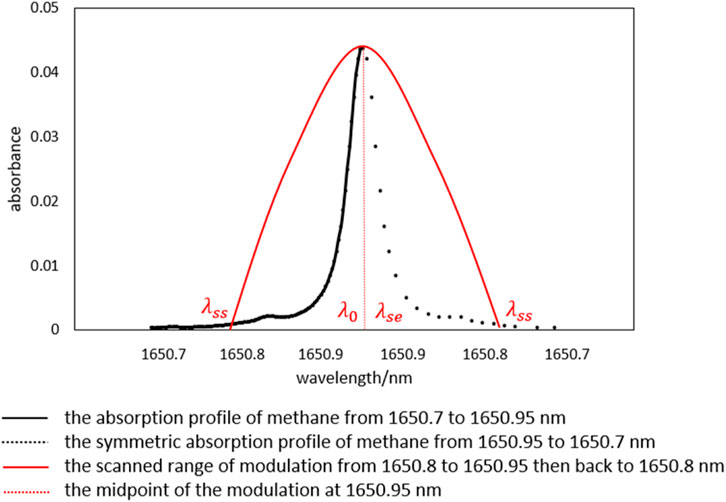
Figure 8. The scanned range of wavelength under sine wave method.
The calculation method for φ∆ in the sine wave differs slightly from Equation 6. In the sine wave half-cycle method, the wavelength rises during the 0∼π/2 phase, with the waveform rising faster in the initial part and slower in the latter part. Due to equidistant time sampling, this scanning method results in more signal points being acquired closer to λ0 in the latter part. During the π/2∼π phase, the wavelength decreases, with the waveform falling slower in the initial part and faster in the latter part, resulting in more signal points being acquired closer to λ0 in the initial part. Overall, this scanning method generates a larger photoacoustic signal area and a stronger photoacoustic signal.
3.2 Photoacoustic signal intensity and linearity
The input waveforms of the bias DC for the tunable laser were set to sawtooth wave, triangular wave, and sine wave respectively, and injected into the laser at the same frequency of 15 Hz. The photoacoustic cavity was pre-filled with pure nitrogen and 5.9/11/22/37.6/99.8/240.3 ppm calibration gas of methane respectively. The obtained photoacoustic signal intensities and linearities are shown in the Figure 9 below:
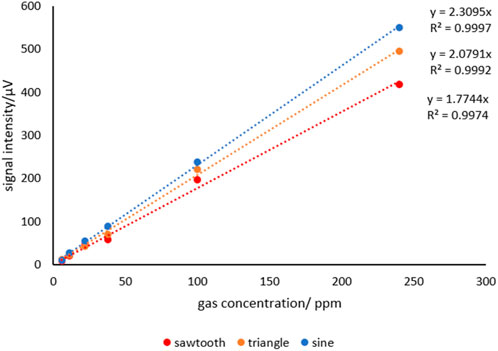
Figure 9. The PA signal intensity and linearity with different types of waveform.
Consistent with theoretical predictions, the peak area under the sine waveform is the largest, resulting in the highest photoacoustic signal intensity, followed by the triangle waveform, while the sawtooth waveform exhibits the smallest peak area and signal intensity.
In term of linearity, due to the ability of sine wave and triangle wave to better lock the phase, the position of the maximum value is relatively fixed. Over the entire measurement range, this ensures minimal phase drift, thereby guaranteeing the reliability and accuracy of the data, as they exhibit excellent linearity. In contrast, the phase of the sawtooth wave is more difficult to stabilize, especially at low concentrations, where the position of the maximum value is more susceptible to interference from environmental factors and internal electrical noise, resulting in lower reliability.
3.3 Limit of detection (LOD)
After determining the optimal bias DC modulation waveform as the sine wave, the limit of detection can be calculated by Equation 8.
To record the noise N with pure nitrogen, the number of data is 128 and the average value of N is 0.148μV, as Figure 10 shown. The signal intensity K of sine wave is 2.3095 μV/ppm as shown in Figure 9.
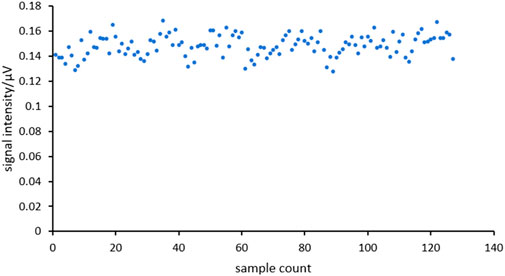
Figure 10. The zero signal with sine wave.
With an integration time of 1.4 s, the LOD of methane was determined to be 0.2 ppm. This meets the requirements for online oil-gas monitoring applications.
4 Conclusion
This study systematically investigated the effects of different bias DC waveforms (sawtooth wave, triangle wave, sine wave) on the measurement of methane concentration in oil using photoacoustic spectroscopy by constructing an experimental platform. The experimental results demonstrate that the bias DC waveform of the laser significantly affects the intensity, linearity, and stability of the photoacoustic signal, with the sine wave providing the best measurement performance.
Specifically, under the same experimental conditions, the sawtooth wave was unsuitable due to difficulties in phase locking. The photoacoustic signal intensity under sine wave bias was higher than that under triangle wave bias. This is primarily because waveform variation of the sine wave results in more sampling points near the center wavelength, thereby increasing the scanning area and intensity of the photoacoustic signal. Additionally, the linearity under sine wave bias was superior to that under sawtooth and triangle wave biases, benefiting from the smooth and continuous waveform characteristics of the sine wave, which effectively suppresses high-frequency noise interference. In terms of stability, the photoacoustic signal under sine wave bias exhibited the smallest fluctuations, demonstrating excellent repeatability and reliability.
In conclusion, sine wave bias DC modulation is the optimal choice for photoacoustic spectroscopy measurement of methane concentration in oil. With the sine wave as the bias modulation, the detection system exhibited good linearity and a low detection limit. This study provides theoretical and experimental references for optimizing the performance of photoacoustic spectroscopy systems and improving the accuracy and reliability of methane detection in oil. Future research could explore the effects of other waveforms or composite waveforms on the photoacoustic signal and develop more efficient and stable online monitoring systems for methane in oil based on practical application scenarios.
Data availability statement
The raw data supporting the conclusions of this article will be made available by the authors, without undue reservation.
Author contributions
LM: Writing – original draft. CZ: Writing – original draft. WJ: Writing – original draft. QH: Writing – review and editing. ZZ: Writing – review and editing. HS: Writing – review and editing. WQ: Writing – review and editing.
Funding
The author(s) declare that financial support was received for the research and/or publication of this article. This study was generously supported by the Science and Technology fund of State Grid Corporation of China, under contract No. 5500-202340529A-3-2-ZN. The funder was not involved in the study design, collection, analysis, interpretation of data, the writing of this article, or the decision to submit it for publication.
Conflict of interest
Authors LM, QH, and ZZ were employed by State Grid Electric POWER Research Institute Wuhan NARI CO. Ltd. Author CZ was employed by State Grid Corporation of China. Author WJ was employed by Electric Power Science Research Institute State Grid Sichuan Electric Power Company.
The remaining authors declare that the research was conducted in the absence of any commercial or financial relationships that could be construed as a potential conflict of interest.
Generative AI statement
The author(s) declare that no Generative AI was used in the creation of this manuscript.
Publisher’s note
All claims expressed in this article are solely those of the authors and do not necessarily represent those of their affiliated organizations, or those of the publisher, the editors and the reviewers. Any product that may be evaluated in this article, or claim that may be made by its manufacturer, is not guaranteed or endorsed by the publisher.
References
Bijnen, F., Reuss, J., and Harren, F. (1996). Geometrical optimization of a longitudinal resonant photoacoustic cell for sensitive and fast trace gas detection. Rev. Sci. Instrum. 67 (8), 2914–2923. doi:10.1063/1.1147072
Bolshov, M., Kuritsyn, Y., and Romanovskii, Y. (2015). Tunable diode laser spectroscopy as a technique for combustion diagnostics. Spectrochim. Acta Part B At. Spectrosc. 2015 (106), 45–66. doi:10.1016/j.sab.2015.01.010
Boone, C., Walker, K., and Bernath, P. (2007). Speed-dependent Voigt profile for water vapor in infrared remote sensing applications. J. Quantitative Spectrosc. Radiat. Transf. 105 (3), 525–532. doi:10.1016/j.jqsrt.2006.11.015
Brown, L. R., Margolis, J. S., and Crisp, D. (2013). High-resolution near-infrared spectroscopy of methane and its isotopologues. J. Quantitative Spectrosc. Radiat. Transf. 119, 69–83. doi:10.1021/jp3128803
Chen, W., Liu, B., Zhou, H., Wang, Y., and Wang, C. (2012). Diode laser-based photoacoustic spectroscopy detection of acetylene gas and its quantitative analysis. Chin. J. Sci. Instrum. 31 (3), 665–670. doi:10.1002/etep.588
Fukuda, M., Mishima, T., Nakayama, N., and Masuda, T. (2010). Temperature and current coefficients of lasing wavelength in tunable diode laser spectroscopy. Appl. Phys. B, Lasers Opt. 100 (2), 377–382. doi:10.1007/s00340-009-3878-0
Gamache, R. (2005). Lineshape parameters for water vapor in the 3.2–17.76μm region for atmospheric applications. J. Mol. Spectrosc. 229 (1), 9–18. doi:10.1016/j.jms.2004.08.004
Gospodinova, M., Mollov, V., Arnaudov, R., and Philippov, P. (2000). Study of the DC biasing effect on insertion losses in high-frequency interconnections. Microelectron. J. 31 (11), 1009–1014. doi:10.1016/s0026-2692(00)00090-2
Hodgkinson, J., and Tatam, R. P. (2013). Optical gas sensing: a review. Meas. Sci. Technol. 24 (1), 012004. doi:10.1088/0957-0233/24/1/012004
IEEE Xplore (2019). “IEEE approved draft guide for the interpretation of gases generated in oil-immersed transformers,” in IEEE PC57.104/D6.2, March 2019 (IEEE), 1–103.
John, F. (1973). New approximation to the Voigt function with applications to spectral-line profile analysis. J. Opt. Soc. Am. 63, 987–995. doi:10.1364/josa.63.000987
Li, Z., Zhao, J., Xu, Z., Yang, Z., Wang, Z., Zhang, Y., et al. (2024). Current-tuned tunable in-series DFB laser array assisted with thin film heater. IEEE Photonics Technol. Lett. 36 (15), 921–924. doi:10.1109/LPT.2024.3411047
Liu, K., Gao, X., Chen, W., Zhang, Y., and Wang, L. (2020). A novel photoacoustic spectroscopy gas sensor using a low-cost polyvinylidene fluoride film. Sensors Actuators B Chem. 305, 127454. doi:10.1016/j.snb.2018.09.037
Ma, Y., Tong, Y., Zhang, L., He, Y., Zhang, J., Wang, L., et al. (2017). Study on high-sensitivity detection of trace acetylene gas based on QEPAS technology. Spectrosc. Spectr. Analysis 37 (9), 2869–2872. doi:10.3964/j.issn.1000-0593(2017)09-2869-04
Miklos, A., Hess, P., and Bozoki, Z. (2011). Application of acoustic resonators in photoacoustic trace gas analysis and metrology. Rev. Sci. Instrum. 82 (6), 063110. doi:10.1063/1.1353198
Ren, S., Wu, H., and Liu, X. (2020). Research status of online monitoring technology for dissolved gas in transformer oil. Electr. Eng. 2020 (019), 86–90. doi:10.19768/j.cnki.dgjs.2020.19.029
Şenel, B., Çağlar, M., and Genç, A. (2014). “Effects of DC bias conditions to performance of 2.4GHz power amplifier,” in 2014 22nd signal processing and communications applications conference (SIU), 353–356.
Tam, A. (1986). Applications of photoacoustic sensing techniques. Rev. Mod. Phys. 58 (2), 381–431. doi:10.1103/revmodphys.58.381
Wang, Q., Sun, P., Zhang, Z., Cai, Y., Huang, W., Pang, T., et al. (2024). Near-infrared ethylene detection based on calibration direct absorption spectroscopy. Chin. J. Lasers. 51 (8), 275–282. doi:10.3788/CJL231597
Wu, Z. (2013). Independent component analysis of mixed gas photoacoustic spectroscopy. Dalian, China: Dalian University of Technology.
Zhang, T., Kang, J., Meng, D., Wang, H., Mu, Z., Zhou, M., et al. (2018). Mathematical methods and algorithms for improving near-infrared tunable diode-laser absorption spectroscopy. Sensors 18 (12), 4295. doi:10.3390/s18124295
Zhang, W. (2010). Research on the photoacoustic spectroscopy for trace gas detection and applications. Dalian, China: Dalian University of Technology.
Keywords: tunable laser, photoacoustic, methane, sine waveform, dissolved gas analysis
Citation: Mengqi L, Zhengguang C, Jie W, Haohao Q, Zhenqin Z, Siqi H and Qiaohua W (2025) Study on the photoacoustic spectroscopy measurement of methane with different laser bias DC waveforms. Front. Energy Res. 13:1615548. doi: 10.3389/fenrg.2025.1615548
Received: 21 April 2025; Accepted: 20 May 2025;
Published: 30 May 2025.
Edited by:
Yani Wang, Shanghai University of Electric Power, ChinaCopyright © 2025 Mengqi, Zhengguang, Jie, Haohao, Zhenqin, Siqi and Qiaohua. This is an open-access article distributed under the terms of the Creative Commons Attribution License (CC BY). The use, distribution or reproduction in other forums is permitted, provided the original author(s) and the copyright owner(s) are credited and that the original publication in this journal is cited, in accordance with accepted academic practice. No use, distribution or reproduction is permitted which does not comply with these terms.
*Correspondence: Wang Qiaohua, cWh3YW5nQHNqdHUuZWR1LmNu