- State Grid Jiangsu Electric Power Co., Ltd Yancheng Power Supply Company, Yancheng, China
In order to respond to the call of double carbon and further follow up the port energy construction in the new era, a virtual power plant load aggregation optimization scheduling strategy for port adjustable resources was proposed in view of the uncertainty of port adjustable resources and the insufficient consumption of new energy. Firstly, a port multi-energy coupling virtual power plant model including electricity, cold, heat and gas is constructed. Secondly, according to the load response law and demand characteristics, the load model of ship power change and electric heavy truck is added. Finally, considering the stepped carbon trading mechanism, the carbon emission cost of buildings is optimized by adjusting energy output, the carbon emission of buildings is improved, the clean transformation of energy structure is promoted, and the economic and environmental benefits of system operation are optimized. Through the comparative analysis of three scenarios, the introduction of flexible load and carbon trading mechanism in the energy system of intelligent buildings can give full play to the interaction and plasticity of the energy structure of intelligent buildings, effectively promote the consumption of clean energy, and realize the low-carbon economic operation of the energy system.
1 Introduction
With the growth of the global economy, the demand of energy continues to rise, and the energy mix is gradually transitioning, with the proportion of renewable energy steadily increasing. Ports, as critical logistics hubs and significant energy consumers, are also witnessing a rise in energy demand, along with a growing need for renewable energy integration (Tang et al., 2025). Ports host a variety of distributed energy and controllable resources, including solar power generation, wind power generation, energy storage systems, and charging stations. However, these resources are often dispersed across various locations, which complicates their aggregation and efficient utilization (Gabrielii et al., 2025). Furthermore, the electricity demand within ports is highly diverse and complex, encompassing industrial, commercial, and residential loads. The volatility and uncertainty associated with these loads pose significant challenges to the stable operation of the power system.
Amid the goals of carbon peaking and carbon neutrality, traditional energy management models no longer suffice to meet the evolving demands of ports. The multi-energy complementary virtual power plant (VPP) has garnered increasing attention. As an emerging smart grid technology, the VPP can aggregate and optimize dispersed energy resources to create a unified power system, facilitating rapid adjustments and responses to grid demands (Zhang et al., 2021). Most existing VPP models focus on energy storage units and consumption units to enable more precise and adaptive energy system modeling. Reference (Shang et al., 2025) introduced a stepwise Shapley value distribution method, integrating day-ahead market resources to address profit distribution issues when virtual power plants participate in the electricity market. This approach reduces uncertainty-related penalty costs and enhances the profitability of all market participants. Additionally, the VPP must consider the aggregation of multiple energy sources. Reference (Zhenan et al., 2023) improved the self-learning capabilities of models by constructing virtual units, thereby enhancing the overall prediction accuracy for physical devices in various energy systems. Reference (Moghadam et al., 2025) considered factors such as temperature and high-frequency disturbances affecting photovoltaic and wind power generation and seamlessly integrated such systems into the VPP. This reduced potential costs associated with damage to grid-connected equipment caused by power fluctuations. Reference (Guo et al., 2021) proposed a method for optimizing the access points and capacity planning of VPP, based on the geographical distribution of resources in the area, effectively improving the load-to-capacity ratio and flexibility of substations. Simultaneously considering the regional characteristics of VPP, reference (Wu et al., 2024) integrated rural biomass energy into traditional uncertainty planning for VPP. Through a double-vertex-fixed optimization algorithm, the planning approach effectively reduced over-robustness and achieved economically and environmentally friendly operations for VPP. Regarding the quantification of uncertainties in VPP, reference (Li et al., 2024a) proposed a renewable energy generation scenario reduction strategy based on network states, it helps reduce costs and risks caused by uncertainty, thereby improving the operational efficiency and reliability of VPP. Reference (Zhang et al., 2022) considers the planning of port ship berthing time and number of quay Bridges to achieve the best berth allocation, so as to improve the scheduling optimization of port ship energy use. By decoupling time in the charging and discharging models of energy storage systems, the safety and reliability of VPP scheduling were improved. Reference (Li Q. et al., 2025), by integrating bidding plans for active distribution networks from various markets, interactions with multiple virtual power plants, and operating costs, effectively incorporated dispatching and control strategies, promoting coordinated operations between VPP and active distribution grids. However, while these studies highlight various resource aggregation and optimization strategies, they overlook the specific challenges of integrating multiple energy types within a port environment, particularly concerning the state of port system load aggregation.
In the context of integrating multiple energy types into port virtual power plants, the port’s load is crucial for resource aggregation within the VPP. The load aggregation capability of the port significantly affects the overall energy utilization of the system (Mears and Martin, 2020). To address the issue of load volatility in various load types, reference (Chen et al., 2022) used a two-stage rolling optimal scheduling strategy to enhance the flexible load reserve (FLR) capability of the vVPP, promoting the absorption of renewable energy such as wind and photovoltaics. Reference (Li et al., 2016) uses the temperature characteristics of heating pipes to coordinate with the operation of the power system to achieve flexible heating, thus decoupling the thermoelectric supply and improving the ability to flexibly absorb wind power. For the issue of shared energy storage and multi-virtual power plant optimized operations, reference (Wang et al., 2024) aggregated flexible loads and energy storage units. Using a bi-level decision model, this approach effectively improved the utilization rate of renewable energy, reasonably allocated load resources, and achieved mutual benefits between VPP and shared energy storage. Reference (Dong et al., 2024) achieved an “generation-load interaction” regulation mode by efficiently aggregating and optimizing control of renewable energy and demand-side resources. This effectively addressed mismatches in power supply and demand, while improving the system’s acceptance of renewable energy. Reference (Liu et al., 2021) regards hydrogen vehicles as shared energy storage for scheduling, which improves the gas-energy interaction in the energy system. With the popularity of electric vehicles, in order to solve a large number of users charging needs, reference (Qais et al., 2025) aggregated dispersed residential batteries and electric vehicles, reasonably prioritizing charging responses to ensure fairness in users’ energy usage. To address complex load scheduling issues while balancing economic, environmental, and customer experience factors within a VPP, Reference (Du et al., 2025) incorporated the uncertainties in forecasting photovoltaic generation, residential electricity demand, and electric vehicle (EV) charging. By employing a multi-objective particle swarm optimization (MOPSO) algorithm, the study successfully optimized the benefits of the VPP. Although the existing literature has proposed effective optimization strategies for flexible load scheduling, energy storage management, and renewable energy integration, most methods have not adequately addressed the uncertainties associated with port load or the coordination between port load and carbon emissions.
In light of these challenges,the carbon trading mechanism provides ports with an enhanced opportunity to engage in the energy market and facilitates the development of “zero-carbon” zones. For carbon trading planning in VPP, reference (Li Q. et al., 2024) used carbon credits and carbon pricing to plan coal generator leasing. It also adopted user-type targeted demand response strategies, providing flexible support for optimizing VPP scheduling. Reference (Li et al., 2024c) proposed a decoupling correction for carbon capture systems (CCS), introducing a flexible carbon storage model that combined physical and virtual energy storage. This effectively improved load response margins and carbon market trading revenue. Based on cooperative game theory, reference (Liu et al., 2024) proposed a bidding strategy for VPPs that considered China’s certified emission reduction mechanism and demand response. This effectively reduced carbon emissions while achieving peak shaving and valley filling. To address conflicts of interest between VPPs and carbon markets, reference (Li et al., 2024d) adopted an incentive-based layered carbon price constraint to achieve equilibrium between the two through game-theoretic approaches. Although the aforementioned research attempts to integrate carbon trading with VPP scheduling, it overlooks the specific challenges posed by port loads.
To address these challenges, this paper investigates the adjustable resource characteristics of ports with the goal of minimizing total operational costs. By modeling and simulating port loads, such as electric heavy-duty trucks and shore power swapping, the study integrates a tiered carbon trading mechanism and establishes carbon quota incentives. Furthermore, it proposes an optimized dispatching strategy for VPP load aggregation, encompassing electricity, cooling, heating, and gas to enhance the flexibility of port resources. Case validation demonstrates that this approach smooths load curves, enhances the utilization rate of clean energy, reduces the operating costs of the virtual power plant for ports (VPP-Ports), and promotes economically and environmentally sustainable operations.
The rest of this paper is organized as follows. Section 2 introduces the typical load, energy structure model and carbon trading model of VPP-Ports. Section 3 expresses the energy scheduling of VPP-ports as a mathematical problem. Section 4 analyzes the proposed method using extensive simulations, and Section 5 concludes the paper.
2 VPP-Ports considering adjustable resources
2.1 VPP-ports model
VPP-Ports represents an innovative model for power resource management and operation. It integrates various distributed energy resources, such as solar and wind energy, energy storage devices, and controllable loads, dispersed throughout the grid via a demand response platform. This model facilitates coordinated optimization, operational control, and market trading of these resources. Ports encompass a diverse range of business types, including residential areas, office buildings, hotels, docks, and factories, each with varying population densities, which contribute to complex energy interaction dynamics.
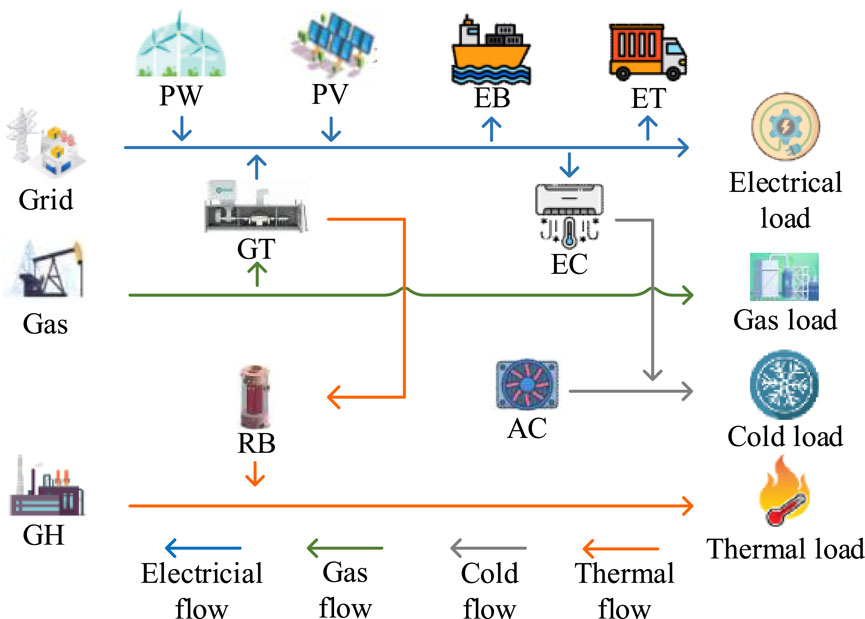
VPP-Ports can aggregate a large number of small and medium-sized controllable loads into independent entities to participate in demand response, and play an active role in port power grid day-ahead scheduling and real-time scheduling (Li et al., 2024d; Rouzbahani et al., 2021; Du et al., 2025). The effective integration of port resources depends on a comprehensive energy system support structure. By considering the specific characteristics of shore power systems and coordinating multi-energy coupling, this approach seeks to enhance the overall efficiency of port resource allocation. The structure of VPP-Ports is shown in Figure 1.
2.2 Port load model
Typical port loads primarily consist of electric boat (EB) loads and electric truck (ET) loads. Taking into account the spatiotemporal characteristics of these loads, corresponding simulation models are developed for integration into VPP-Ports.
2.2.1 EB model
A ship battery exchange model is developed to account for the spatiotemporal characteristics of port vessels. As operational vessels move back and forth between the sea and the port, their routes are variable. Consequently, the distance of each journey segment, denoted as d, is modeled using a log-normal distribution, with the probability density function described as follows:
where σD represents the standard deviation, μD represents the expected value of the travel distance.
Since the Weibull distribution is highly adaptable and flexible for modeling random data (Abubakar et al., 2024), it is employed to fit the starting time ta for each journey segment. The probability density function of the Weibull distribution for the starting time ta is expressed as follows:
where ta is the random variable, k is the shape parameter, c is the scale parameter, and γ is the location parameter.
A Poisson distribution is used to model the arrival behavior of EB at the port. The specific distribution is represented as follows:
where P (X = xtb) refers to the probability of xtb boats arriving at time tb, λ is the average frequency of vessel arrivals within a unit time interval.
The EB sailing time tf and docking time tp are defined as follows:
2.2.2 ET model
The simulation and prediction of ET load need to account for factors such as the truck’s weight, driving speed, and the slope of the driving area. The electrical power is derived from the truck’s mechanical power. The prediction formula for the energy consumption of the ET is as follows:
where d is the driving distance of ET, m is the total weight of ET, g is the gravitational constant, Kr is the rolling resistance coefficient, Kd is the aerodynamic resistance coefficient, Ka is the external surface area of ET, ρ is the air density, θ is the average road gradient, v is the instantaneous speed of ET, Kp is the battery efficiency of ET, Kh is the regression coefficient.
The speed-flow relationship of ET is defined as follows:
where V0 is the zero-flow speed of the road, q is the traffic flow at time t, Q is the road’s ET capacity per unit of time, ε1 and ε2 are the adaptive coefficients based on the road grade or quality.
The charging model for electric trucks is:
where Sc(t) is the battery charge percentage of ET at time t, λc is the charging efficiency, Cp is the battery capacity, Pc(t) is the charging power at time t.
2.3 Energy unit model
To ensure the stability of the energy supply for VPP-Ports while reducing operational costs, it is necessary to integrate various types of energy conversion devices. This integration enables the port to maintain a sufficient energy supply under diverse weather conditions. The primary energy units connected to VPP-Ports include wind turbines, photovoltaic power generation units, wave energy converters, gas turbines, and energy storage systems. Furthermore, to promote energy conservation and emission reduction within the port area, optimize the energy structure, and enhance the utilization of renewable energy, a carbon trading mechanism is incorporated into the port’s energy interaction system, facilitating effective carbon emission planning.
2.3.1 Offshore distributed energy model
The annual total radiation in the port’s maritime area is relatively high, with unobstructed sunlight. Additionally, Based on stochastic optimization theory, the uncertainty of offshore wind power output follows an empirical distribution extracted from historical prediction error data. By integrating stochastic optimization theory with robust optimization theory, a fuzzy set is constructed to capture the uncertainty set of the potential true distribution. This set encompasses the worst-case scenario of the true distribution. The fuzzy set is characterized using the Wasserstein distance, which quantifies the distance between the empirical distribution
where inf (⋅) represents the infimum function,
The Wasserstein distance is incorporated into the construction of the fuzzy set, resulting in a fuzzy set that can be interpreted as a sphere with a radius of θ. This sphere encompasses all potential true distributions of wind power forecast errors. Therefore, the Wasserstein fuzzy set F can be defined as:
Wind power forecast errors are estimated using non-parametric kernel density estimation. Historical wind power forecast error data are clustered using the K-means algorithm to generate scenarios and their corresponding probabilities. The historical data sample Et is defined as:
where
The output of PV panels is influenced by factors such as solar irradiance and temperature. Solar irradiance follows a Beta distribution. The offshore PV model is described as follows:
where Г(·) represents the gamma function, while α and β are the shape parameters of the PV system.
2.3.2 Harbor gas turbine
The gas turbine, as a traditional energy device, generates electricity by consuming natural gas, thereby providing stable power to the port. Compared to coal or oil-based power generation, it produces lower carbon emissions and offers a safer production process. To further enhance energy conservation and emission reduction, gas turbine equipment will be integrated with carbon capture and storage (CCS) technology. Additionally, waste heat from gas turbine power generation will be recovered through a waste heat boiler for secondary power generation or directly used for port heating via a heat converter. The power model is as follows:
where GGT is the natural gas consumption of the gas turbine during operation, PGT and QGT are the electric power output of the gas turbine and the recovered waste heat from the unit, βGT1, βGT2 and βGT3 are the corresponding coefficients that represent the relationship between the gas turbine’s electric power output and natural gas consumption, β’GT is the waste heat recovery index, ηGT is the electricity-to-heat energy conversion ratio of the gas turbine.
2.3.3 Gas boiler model
The gas boiler satisfies the port’s continuous thermal load demand by consuming natural gas. The heating power model is as follows:
where ηGH is the heating efficiency of the gas boiler, and GGH is the natural gas consumption of the gas boiler.
2.3.4 Temperature control system model
The port’s temperature control system primarily comprises the temperature regulation system for the living area and the cold chain system for the cargo area.
The time-series model for temperature control in the living area (Lin and Yi, 2000) is presented as follows:
where Tg,t is the supply water temperature of the heating network at time t, Th,t is the return water temperature, Tr,t is the indoor temperature of the heating building, Tw,t is the outdoor temperature coefficient, αj, βj, γj, θ1, φ1 and ω1 are the physical parameters related to the thermal inertia of the heating system, J representing the order of thermal inertia of the system.
For temperature control in the living area, the predicted mean vote (PMV) index is utilized to evaluate the relationship between environmental temperature and comfort (Li H. et al., 2025). The PMV formula used by VPP-Ports is as follows:
where M and W represent the human metabolic rate and mechanical work, fct is the ratio of covered to exposed body surface area, hc is the surface heat transfer coefficient, Pa is the water vapor partial pressure around the body, ta, tr and tcl are the air temperature, mean radiant temperature, and clothing surface temperature.
For the cold chain system in the cargo area, which has stricter upper and lower temperature limits, the equivalent thermal parameter (ETP) model (Zhang and Lu, 2013) is utilized for simulating temperature inertia. The specific model is as follows:
where
2.3.5 Energy storage system model
Energy storage devices in ports primarily include energy storage batteries and thermal storage tanks.
The energy storage battery model is described as follows:
where
The thermal storage tank model is described as follows:
where
2.3.6 Carbon trading model
To support energy conservation and emission reduction efforts and to achieve a “zero-carbon port area”, it is essential to integrate the port energy system into the carbon trading mechanism. This integration will help improve carbon emission management and optimize the energy structure. Currently, carbon trading is primarily divided into traditional and tiered mechanisms. The tiered carbon trading mechanism, introduced to more accurately simulate port carbon emissions, assigns prices to each tier based on the carbon emission weights within that range. This approach aims to incentivize VPP-Ports to engage in strategic carbon emission planning. The formula for the tiered carbon trading cost Fc (Lv et al., 2023) is as follows:
where Fc,n is the carbon trading cost for each stage, Fc is the total carbon trading cost, E is the total carbon emissions of the port, βe is the standard carbon trading price, D is the total carbon quota, d is the carbon emissions per unit in each interval, αe is the tiered carbon trading price growth coefficient, When the port’s carbon emissions E < D, it indicates a surplus in the carbon quota, allowing the excess quotas to be sold to reduce total costs while providing users with corresponding rebates to incentivize them, promoting energy conservation and emission reduction.
For the general load consumed by the port, carbon emissions primarily originate from gas turbines. The historical baseline can be established by adjusting historical data, allowing for the calculation of the corresponding carbon quota Ds for this segment. The specific formula is as follows:
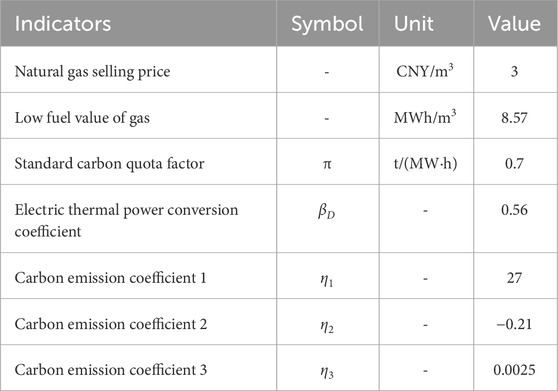
where π is the standard carbon quota coefficient, Q, P are the thermal power and electrical power consumed by the port, βD is the electricity-heat power conversion coefficient.
The carbon emissions E of the port can be calculated based on its electrical power P and thermal power Q, using the following formula:
where η1, η2 and η3 represent the corresponding carbon emission coefficients for the port.
3 VPP-Ports load aggregation optimization model
By integrating the port’s typical load, distributed renewable energy, and carbon trading mechanisms, various loads and energy unit outputs can be regulated by corresponding constraints. The objective function, serving as the specific optimization target, can then be employed to construct VPP-Ports load aggregation optimization model.
3.1 Objective function
For energy supply measurement, the load aggregation response optimization of VPP-Ports primarily addresses the operational costs of port energy. These include the total electricity purchase cost, operating cost of distributed power generation equipment, equipment maintenance cost, curtailment costs for solar and wind energy, equipment depreciation cost, energy conversion cost, and carbon trading cost. The specific formula is as follows:
where FSB represents the operational cost of the port energy system, Fnet is the external grid interaction cost of the port, Fdgoc、Fdgop are the operating cost and maintenance cost of the distributed power generation equipment, Fd is the cost of wind and solar curtailment, Fde is the depreciation cost of energy storage equipment, Fl is the gas network interaction cost.
(1) Port power purchase cost
The difference between the cost of electricity purchased from the external grid by VPP-Ports and the profit from selling electricity to the external grid. The specific formula is as follows:
where
(2) Port distributed power supply operation and maintenance cost
where
(3) The cost of abandoning light and wind
For the underutilized solar and wind energy in VPP-Ports, the corresponding penalty costs should be calculated to accurately reflect the system’s utilization rate of renewable energy.
where πw, πpv are the wind and solar energy abandonment cost coefficients,
(4) Gas network interaction cost
where
(5) Depreciation cost
where Cbat and CH represent the depreciation cost coefficients of the energy storage battery and the thermal storage tank, respectively.
(6) Carbon trading cost
The carbon trading cost can be calculated using a tiered carbon trading mechanism, as shown in formula (28).
3.2 Constraint condition
3.2.1 Equality constraint
(1) Electrical network
where
(2) Thermal network
where
(3) Cold network
where
(4) Gas network
where
3.2.2 Inequality constraint
(1) Electrical network
where
(2) Thermal network
where
(3) Cold network
where
(4) Gas network
where
3.3 Solution mode
The model constructed in this study was implemented in the MATLAB R2020a environment using the YALMIP toolbox. The model was formulated as a Mixed Integer Linear Programming (MILP) problem and solved using the Gurobi solver.
where C represents the coefficient vector of the objective function, x represents the vectors of all decision variables.
In terms of time complexity, MILP problems generally exhibit exponential complexity in the number of integer variables, as the worst-case scenario for solving such problems involves a combinatorial search across 2m branches, where m is the number of integer variables. However, the specific implementation using the Gurobi solver reduces the practical computational burden through advanced heuristics, branch-and-bound techniques, and cutting planes, making it significantly faster than traditional methods. The continuous relaxation of the linear programming portion contributes a polynomial complexity of O (n3), where n is the number of continuous variables. Thus, the proposed approach strikes a balance between theoretical complexity and practical efficiency, as evidenced by the reduced computational time. On average, the computational time was 250 s, demonstrating high efficiency, with a total solution time of 300 s. Compared to traditional algorithms, the proposed approach reduced calculation time by 30%.
4 Case analysis
In this section, we conduct comprehensive evaluations of the proposed scheduling optimization method through comparative simulations from various perspectives. In Section 4.1, we provide a detailed overview of the basic configuration and load data in VPP-Ports, establishing the foundational parameters for our experiments. Section 4.2 validates the feasibility and effectiveness of the proposed scheduling strategy from the perspectives of load response and parameter sensitivity, and evaluates the economic efficiency and environmental performance of three scenarios from the perspectives of the overall VPP-Ports carbon cycle and cost considerations.
4.1 Data description and experimental simulation platform
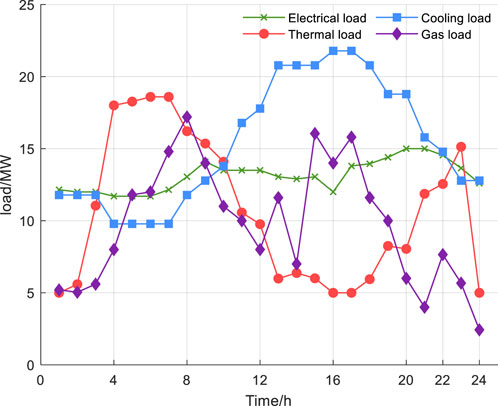
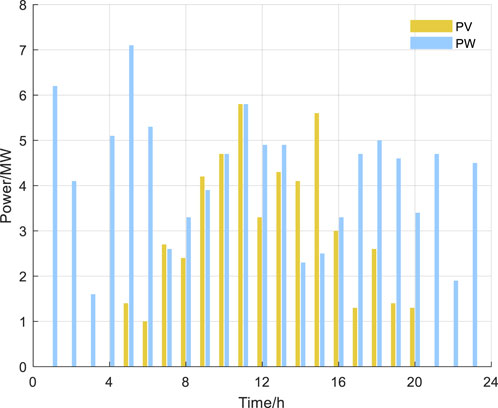
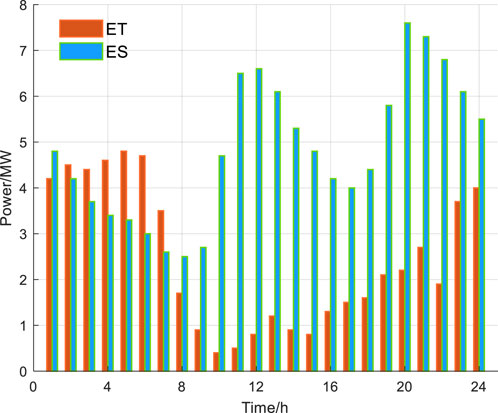
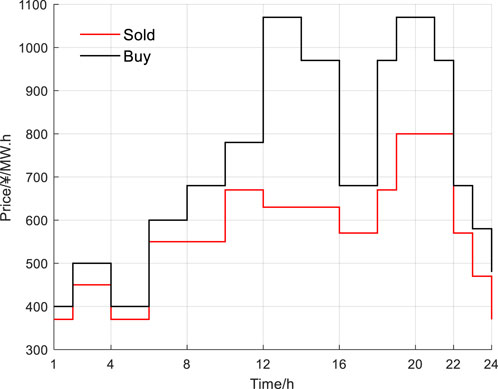
To validate the effectiveness of the proposed model, a certain port area in the eastern region is selected as the data source for the VPP. The VPP-Ports is composed of energy units such as offshore photovoltaic power generation, wind power generation, and gas turbines. A 24-h period is used as the time cycle, with 1-h intervals as the time scale. The base data for the model includes the electricity load, cooling load, heating load, and gas load of the port area, with the average load values shown in Figure 2. The average forecast values for the photovoltaic and wind power output at the port are shown in Figure 3. The average forecast values for the electric trucks and ship battery swapping loads are shown in Figure 4. According to the economic development plan of the port region, the time-of-use electricity prices for the local grid are shown in Figure 5. The operational parameters of the port’s energy units are presented in Table 1, while the relevant parameters of VPP-Ports are provided in Table 2.
4.2 Optimized analysis
4.2.1 Port resource aggregation optimization analysis
By developing an optimized dispatch strategy for the aggregation of port resources, prescheduling results for the load can be obtained.
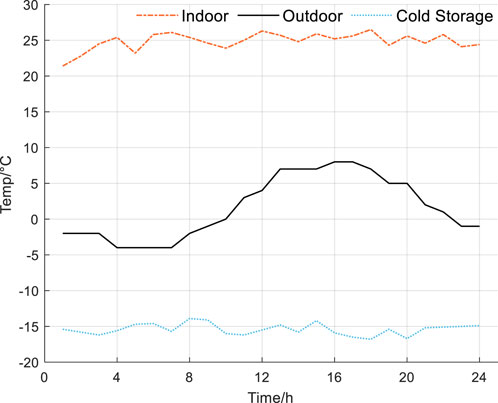
As shown in Figure 6, to meet the requirements of the port’s population activity area, the indoor temperature is maintained between 23°C and 26°C, ensuring a suitable environment for work and daily life. Meanwhile, the cold storage temperature is kept around −15°C to satisfy refrigeration needs.
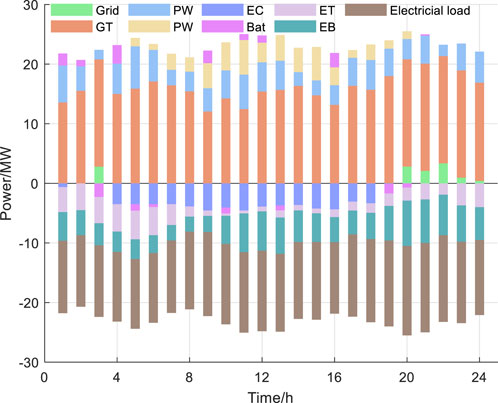
Based on Figure 7 it can be concluded that the gas turbine maintains a stable output throughout the day. The electric heavy-duty trucks primarily charge between 20:00 and 06:00 the following day, while the ship battery swapping load is mainly concentrated between 11:00-14:00 and 20:00-24:00, and the battery charge and discharge to balance the power load response. Due to the absence of photovoltaic power generation at night, additional electricity is purchased between 01:00-02:00 and 19:00-24:00.
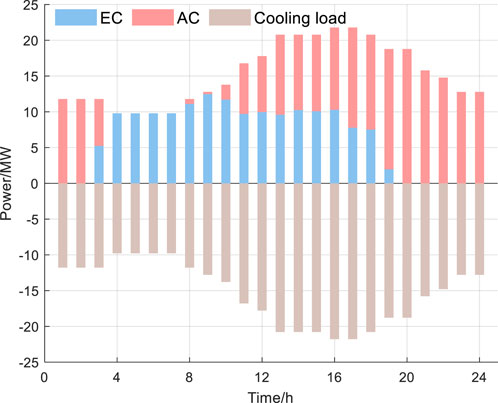
As shown in Figure 8, due to the high and stable output of the gas turbine, the absorption chiller’s output proportion is relatively high. During the 03:00-10:00 period, the cooling load is lower while the heating load is higher, so the waste heat boiler’s thermal output primarily serves the basic heating demand. As a result, the cooling network is supplied by electric chillers. From 11:00 to 19:00, when the cooling load demand increases, both the electric chiller and the absorption chiller work together to meet the cooling load balance.
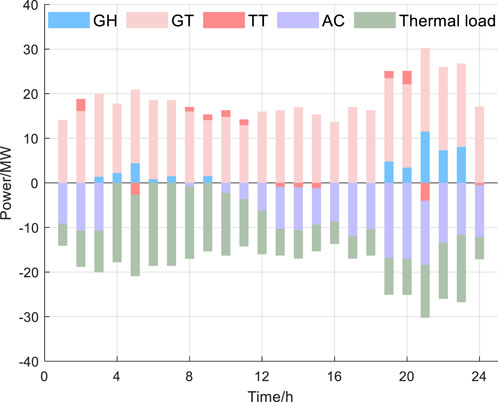
As shown in Figure 9, during most periods, the waste heat boiler from the absorption gas turbine’s waste heat provides the majority of the thermal energy, with the surplus heat energy supporting the stable output of the absorption chiller. However, during the 05:00-10:00 and 19:00-23:00 periods, the heat storage tank exhibits significant heat storage behavior, and the waste heat boiler alone cannot meet the higher thermal load demand. In these timeframes, the gas boiler consumes gas energy to provide the additional thermal energy required.
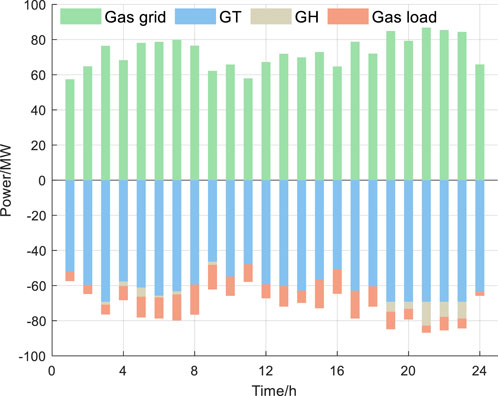
As shown in Figure 10, the state of the gas network is consistent with the balance between the cooling network and the heating network. To ensure the balance of demand while improving economic efficiency, the gas turbine’s gas consumption in the gas network remains relatively high. The gas boiler only consumes gas energy when required by the system to meet the demand.
4.2.2 Port carbon trading mechanism analysis
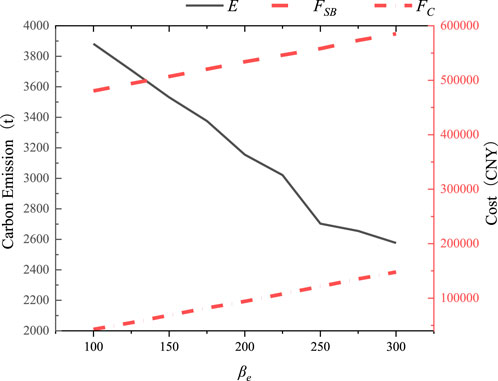
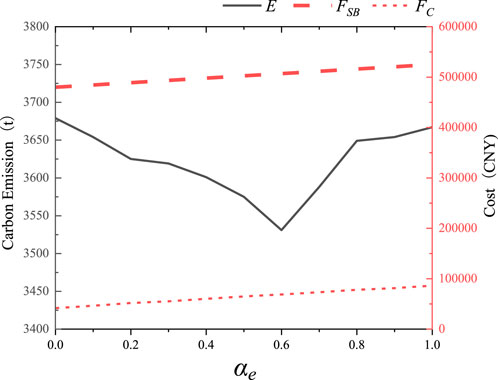
Based on the aforementioned scenario, the impact of changes in the benchmark price βe and price growth rate αe within the tiered carbon trading mechanism on the low-carbon economy of ports is analyzed. The results are illustrated in Figures 11, 12.
As shown in Figure 11, with the increase in the benchmark price, the system’s total cost and carbon emission cost rise correspondingly. Under the premise of maintaining economic viability, the port demonstrates an increased willingness to reduce emissions, leading to a gradual decrease in carbon emissions. However, when the benchmark price of carbon trading exceeds 250 CNY/t, the emission reduction potential for individual systems becomes limited, and port carbon emissions stabilize. At this stage, further guiding system emission reductions through price adjustments becomes less effective.
As shown in Figure 12, when the price growth rate is in the range of [0, 0.6], the carbon emission cost increases correspondingly. Under the constraints of system operating costs, equipment output becomes restricted, leading to a reduction in carbon emissions. When the price growth rate exceeds 0.6, the outputs of various system components gradually reach equilibrium, and carbon emissions begin to stabilize. With further increases in the price growth rate, both carbon emission costs and the system’s total costs continue to rise.
It is evident that to effectively guide the clean operation of port energy networks through the carbon trading mechanism, both the benchmark price and the price growth rate must be adjusted simultaneously. Achieving a coordinated configuration between tiered carbon trading and port scheduling optimization is necessary.
4.2.3 Low carbon scheduling analysis
Taking into account the impact of port-specific loads and the carbon trading mechanism on the port’s electricity dispatch, this simulation focuses on the load response within VPP-Ports. The optimization objective is to minimize the total operational cost of the VPP. Three scenarios are defined for comparison:
Scenario 1: Only the general port load is considered, excluding the involvement of the carbon trading mechanism in the operation of VPP-Ports.
Scenario 2: The loads from electric trucks and ship battery swapping are considered, but the carbon trading mechanism is not incorporated into the operation of VPP-Ports.
Scenario 3: The operation of VPP-Ports considers both the loads from electric heavy-duty trucks and ship battery swapping, as well as the involvement of the carbon trading mechanism.
To analyze the impact of the carbon trading mechanism on the economic and environmental benefits of the port energy system operation, the dispatch costs for each scenario are shown in Table 3.
From Table 3, it can be seen that Scenario 1, which does not consider the operation of electric heavy-duty truck loads and ship battery swapping, relies more on traditional energy sources to supply the port’s work and living needs. As a result, it has the highest overall operational cost, the largest carbon emissions, and relatively low renewable energy output. Scenario 2, which considers the electric heavy-duty truck and ship battery swapping loads based on the port’s resource characteristics, reduces the consumption of petroleum and other fuels by heavy-duty trucks and ships. The total cost is reduced by 11.11% compared to Scenario 1, and renewable energy output increases by 4.08% compared to Scenario 1. Scenario 3, which considers both the electric heavy-duty truck and ship battery swapping loads along with the carbon trading mechanism, still reduces the total cost by 11.97% compared to Scenario 2, despite the inclusion of carbon trading costs. Renewable energy consumption increases by 8.23% compared to Scenario 2. This scenario reduces carbon emissions while meeting the port’s work and living needs and effectively increases the utilization of renewable energy.
In conclusion, accounting for the loads from electric heavy-duty trucks and ship battery swapping enables better adaptation to the port’s resource characteristics and more effective aggregation of these resources. Incorporating the carbon trading mechanism significantly reduces carbon emissions from VPP-Ports operations and encourages the use of clean energy. Therefore, considering both the port’s resource characteristics and the carbon trading mechanism ensures the economic and environmental performance of the port energy network, optimizing the efficiency and sustainability of VPP-Ports.
5 Conclusion
To effectively advance port energy systems in the new era, improve port management, and promote carbon neutrality, it is essential to facilitate resource aggregation and scheduling optimization within VPP-Ports. This involves developing green and economically complementary operations that consider the specific characteristics of port resources. In this context, this paper proposes a resource aggregation scheduling strategy. Based on the case study analysis, the following conclusions were drawn:
Port Resource Characteristics and Load Uncertainty: By characterizing the uncertainty of loads from electric heavy-duty trucks and ship battery swapping, and employing load balance constraints, it is possible to optimize energy load economics effectively. This approach allows for flexible energy distribution adjustments, achieving a balance between the economic performance and robustness of port VPP operations, thereby efficiently aggregating port load resources.
Incorporating Carbon Trading Mechanism: Integrating carbon trading mechanisms into the VPP-Ports significantly reduces port carbon emissions by approximately 23.8%, increases renewable energy utilization by 8.23%, and facilitates the deep integration of offshore renewable energy systems. This approach supports the low-carbon, economically viable operation of multi-energy systems.
Economic and Environmental Balance: The proposed resource concentration strategy successfully reduces total operating costs by 11.97% while enabling flexible load scheduling. However, the current implementation lacks the inclusion of diversified indicators. Further research and analysis are required to enhance its effectiveness and applicability.
This paper proposes that resource aggregation strategies, when tailored to specific port characteristics and integrated with carbon trading mechanisms, can effectively optimize and sustain energy management in ports. Future improvements to these strategies will involve incorporating diverse indicators, such as satisfaction and comfort levels.
Data availability statement
The original contributions presented in the study are included in the article/supplementary material, further inquiries can be directed to the corresponding author.
Author contributions
YZ: Writing – review and editing, Methodology, Conceptualization, Writing – original draft, Data curation. JP: Writing – original draft, Software, Data curation, Conceptualization, Writing – review and editing. SJ: Conceptualization, Validation, Project administration, Methodology, Writing – review and editing. HZ: Formal Analysis, Visualization, Resources, Conceptualization, Writing – review and editing, Funding acquisition. FC: Software, Writing – review and editing, Formal Analysis, Investigation, Data curation, Methodology, Conceptualization. QS: Writing – review and editing, Resources, Visualization, Validation, Project administration. JZ: Conceptualization, Writing – review and editing, Investigation, Project administration, Methodology.
Funding
The author(s) declare that financial support was received for the research and/or publication of this article. The work is supported by State Grid JiangSu Electric Power Co., LTD. Science and Technology project (J2024198). The funder was not involved in the study design, collection, analysis, interpretation of data, the writing of this article, or the decision to submit it for publication.
Conflict of interest
Authors YZ, JP, SJ, HZ, FC, QS, and JZ were employed by State Grid Jiangsu Electric Power Co., Ltd Yancheng Power Supply Company.
Generative AI statement
The author(s) declare that no Generative AI was used in the creation of this manuscript.
Publisher’s note
All claims expressed in this article are solely those of the authors and do not necessarily represent those of their affiliated organizations, or those of the publisher, the editors and the reviewers. Any product that may be evaluated in this article, or claim that may be made by its manufacturer, is not guaranteed or endorsed by the publisher.
References
Abubakar, H., Misiran, M., and Sayed, A. I. A. (2024). Estimation of shifted weibull distribution parameters using optimization algorithms for optimal investment decisions making. Frankl. Open 8, 100152. doi:10.1016/j.fraope.2024.100152
Chen, Y., Du, Q., Wu, M., Yang, L., Wang, H., and Lin, Z. (2022). Two-stage optimal scheduling of virtual power plant with wind-photovoltaic-hydro-storage considering flexible load reserve. Energy Rep. 8, 848–856. doi:10.1016/j.egyr.2022.05.268
Dong, Z., Zhang, Z., Huang, M., Yang, S., Zhu, J., Zhang, M., et al. (2024). Research on day-ahead optimal dispatching of virtual power plants considering the coordinated operation of diverse flexible loads and new energy. Energy 297, 131235. doi:10.1016/j.energy.2024.131235
Du, G., Li, S., Cao, S., Wang, G., and Duan, J. (2025). Weekly economic scheduling of virtual power plant with electric vehicles: deep-learning-based prediction and daily operation mode classification. Electr. Power Syst. Res. 241, 111362. doi:10.1016/j.epsr.2024.111362
Gabrielii, C., Gammelsæter, M., Mehammer, E. B., Damman, S., Kauko, H., and Rydså, L. (2025). Energy systems integration and sector coupling in future ports: a qualitative study of Norwegian ports. Appl. Energy 380, 125003. doi:10.1016/j.apenergy.2024.125003
Guo, M., Ding, J., Lyu, R., Zhang, M., Wang, S., Fei, F., et al. (2021). Access point and capacity optimization planning method of virtual power plant. 22-24 October 2021. IEEE. Taiyuan, China. IEEE Conference Publication | IEEE Xplore. doi:10.1109/EI252483.2021.9712891
Li, Z., Wu, W., Shahidehpour, M., Wang, J., and Zhang, B. (2016). Combined heat and power dispatch considering pipeline energy storage of district heating network. IEEE Trans. Sustain. Energy 7 (1), 12–22. doi:10.1109/TSTE.2015.2467383
Li, J., Mo, H., Sun, Q., Wei, W., and Yin, K. (2024a). Distributed optimal scheduling for virtual power plant with high penetration of renewable energy. Int. J. Electr. Power and Energy Syst. 160, 110103. doi:10.1016/j.ijepes.2024.110103
Li, Q., Zhou, Y., Wei, F., Li, S., Wang, Z., Li, J., et al. (2024b). Multi-time scale scheduling for virtual power plants: integrating the flexibility of power generation and multi-user loads while considering the capacity degradation of energy storage systems. Appl. Energy 362, 122980. doi:10.1016/j.apenergy.2024.122980
Li, J., Li, S., Wu, Z., Yang, Z., Yang, L., and Sun, Z. (2024c). Two-stage multi-objective optimal scheduling strategy for the virtual power plant considering flexible CCS and virtual hybrid energy storage mode. J. Energy Storage 103, 114323. doi:10.1016/j.est.2024.114323
Li, J., Sun, Z., Niu, X., and Li, S. (2024d). Economic optimization scheduling of virtual power plants considering an incentive based tiered carbon price. Energy 305, 132080. doi:10.1016/j.energy.2024.132080
Li Q., Q., Dong, F., Zhou, G., Mu, C., Wang, Z., Liu, J., et al. (2025a). Co-optimization of virtual power plants and distribution grids: emphasizing flexible resource aggregation and battery capacity degradation. Appl. Energy 377, 124519. doi:10.1016/j.apenergy.2024.124519
Li, H., Hu, H., Wu, Z., Kong, X., and Fan, M. (2025b). Modified predicted mean vote models for human thermal comfort: an ASHRAE database-based evaluation. Renew. Sustain. Energy Rev. 209, 115042. doi:10.1016/j.rser.2024.115042
Lin, F., and Yi, J. (2000). Optimal operation of a CHP plant for space heating as a peak load regulating plant. Energy 25 (3), 283–298. doi:10.1016/S0360-5442(99)00064-X
Liu, J., Chen, X., Yang, H., and Shan, K. (2021). Hybrid renewable energy applications in zero-energy buildings and communities integrating battery and hydrogen vehicle storage. Appl. Energy 290, 116733. doi:10.1016/j.apenergy.2021.116733
Liu, R., Chen, K., Sun, G., Lin, S., and Jiang, C. (2024). Bidding strategy for the virtual power plant based on cooperative game participating in the Electricity-Carbon joint market. Int. J. Electr. Power Energy Syst. 163, 110325. doi:10.1016/j.ijepes.2024.110325
Lv, G., Zhang, Y., Zhu, J., Liu, L., Wu, Y., and Wang, T. (2023). Low-carbon optimal operation of electricity–heat–gas systems based on bi-directional tiered-pricing carbon trading. Energy Rep. 9, 377–387. doi:10.1016/j.egyr.2023.04.116
Mears, A., and Martin, J. (2020). Fully flexible loads in distributed energy management: PV, batteries, loads, and value stacking in virtual power plants. Engineering 6 (7), 736–738. doi:10.1016/j.eng.2020.07.004
Michael, N. E., Hasan, S., Al-Durra, A., and Mishra, M. (2023). Economic scheduling of virtual power plant in day-ahead and real-time markets considering uncertainties in electrical parameters. Energy Rep. 9, 3837–3850. doi:10.1016/j.egyr.2023.02.092
Moghadam, M., Ghaffarzadeh, N., Tahmasebi, M., and Pasupuleti, J. (2025). Virtual power plant management with hybrid energy storage system. Unconv. Resour. 5, 100107. doi:10.1016/j.uncres.2024.100107
Qais, M., Kirli, D., Moroshko, E., Kiprakis, A., and Tsaftaris, S. (2025). A virtual power plant for coordinating batteries and EVs of distributed zero-energy houses considering the distribution system constraints. J. Energy Storage 106, 114905. doi:10.1016/j.est.2024.114905
Rouzbahani, H. M., Karimipour, H., and Lei, L. (2021). A review on virtual power plant for energy management. Sustain. Energy Technol. Assessments 47, 101370. doi:10.1016/j.seta.2021.101370
Shang, Y., Li, X., Xu, T., and Cui, L. (2025). Uncertainty-output virtual power plant participates in multi-electricity market considering the improved Shapley value distribution method. Int. J. Electr. Power and Energy Syst. 165, 110462. doi:10.1016/j.ijepes.2025.110462
Tang, D., Zheng, Z., and Guerrero, J. M. (2025). A hybrid multi-criteria dynamic sustainability assessment framework for integrated multi-energy systems incorporating hydrogen at ports. Int. J. Hydrogen Energy 99, 540–552. doi:10.1016/j.ijhydene.2024.12.075
Wang, W., Kong, Z., He, Y., Li, C., and Jia, K. (2024). Research on the collaborative operation strategy of shared energy storage and virtual power plant based on double layer optimization. J. Energy Storage 101, 113997. doi:10.1016/j.est.2024.113997
Wu, S., Wang, Y., Liu, L., Yang, Z., Cao, Q., He, H., et al. (2024). Two-stage distributionally robust optimal operation of rural virtual power plants considering multi correlated uncertainties. Int. J. Elect. Power Energy Systems. 161, 110173, doi:10.1016/j.ijepes.2024.110173
Zhang, Y., and Lu, N. (2013). Parameter selection for a centralized thermostatically controlled appliances load controller used for intra-hour load balancing. IEEE Trans. Smart Grid 4 (4), 2100–2108. doi:10.1109/TSG.2013.2258950
Zhang, Y., Pan, W., Lou, X., Yu, J., and Wang, J. (2021). “Operation characteristics of virtual power plant and function design of operation management platform under emerging power system,” in 2021 International Conference on Power System Technology (POWERCON), Haikou, China, 08-09 December 2021 (IEEE), 194–196. doi:10.1109/POWERCON53785.2021.9697609
Zhang, Y., Liang, C., Shi, J., Lim, G., and Wu, Y. (2022). Optimal port microgrid scheduling incorporating onshore power supply and berth allocation under uncertainty. Appl. Energy 313, 118856. doi:10.1016/j.apenergy.2022.118856
Zhenan, X., Zesan, L., Hongmin, M., Shu, H., Aijun, W., Shan, L., et al. (2023). Design and implementation of virtual power plant system based on equipment-level power and load forecasting, in Advances in natural computation, fuzzy systems and knowledge discovery Editors N. Xiong, M. Li, K. Li, Z. Xiao, L. Liao, and L. Wang (Cham: Springer International Publishing), 1045–1055. doi:10.1007/978-3-031-20738-9_114
Keywords: virtual power plant, port loads, adjustable resources, carbon trading, optimal scheduling
Citation: Zhang Y, Pan J, Jiang S, Zhu H, Chen F, Shu Q and Zhao J (2025) Virtual power plant load aggregation optimization scheduling strategy for port adjustable resources. Front. Energy Res. 13:1617362. doi: 10.3389/fenrg.2025.1617362
Received: 24 April 2025; Accepted: 23 July 2025;
Published: 01 September 2025.
Edited by:
Nikolas Xiros, University of New Orleans, United StatesReviewed by:
Tengfei Zhang, Nanjing University of Posts and Telecommunications, ChinaChao Liu, China Electric Power Research Institute (CEPRI), China
Copyright © 2025 Zhang, Pan, Jiang, Zhu, Chen, Shu and Zhao. This is an open-access article distributed under the terms of the Creative Commons Attribution License (CC BY). The use, distribution or reproduction in other forums is permitted, provided the original author(s) and the copyright owner(s) are credited and that the original publication in this journal is cited, in accordance with accepted academic practice. No use, distribution or reproduction is permitted which does not comply with these terms.
*Correspondence: Yun Zhang, emhhbmd5dW4wNTE1aEAxNjMuY29t
 Yun Zhang
 Jie Pan