 Yongqing Lai1
 Yang Yang
- 1PowerChina Huadong Engineering Corporation Limited, Zhejiang, China
- 2Faculty of Maritime and Transportation, Ningbo University, Zhejiang, China
Offshore wind turbines (OWTs) installed in cold regions are prone to risking ice collisions, leading to potential damage of the support structure. It is imperative to quantitatively investigate the ice loading effect on the structural loads of OWTs. In order to address this research need, a novel module capable of predicting ice loads on OWTs based on six empirical models has been developed, and subsequently integrated within Bladed for considering the coupled effects of ice and wind loading when performing dynamic analysis of OWTs. The structural loads of a monopile-supported 5 MW OWT under operational state are predicted for different wind-ice combined conditions. The effects of ice load prediction model and ice thickness on the structural loads are examined. The results show that ice load prediction model significantly affects the structural loads of the OWT, especially for low wind speed conditions. The maximum increase in mudline shear force is around 242.54% as predicted by the continuous random crushing model for 1 m thickness ice, while the coned structure is able to reduce the ice-induced load by around 85%. Moreover, it is found that the shear force and pitching bending moment at the pile-base are enhanced linearly to the increase of ice thickness. The pitching bending moment is increased by up to 267.83% and 59.21% at 0.1 m and 0.5 m ice thickness, respectively. This study has indicated that ice loading must be considered for the design of OWTs in cold regions.
1 Introduction
With the depletion of the traditional energy resources such as fossil fuel and oil, the renewable energy has gained widespread popularity worldwide. Wind energy has seen significant growth these years, thanks to the advantages of being clean, abundant, and sustainable (Ding et al., 2024). The potential of wind energy is especially vast in the deep-sea areas, contributing to the development of offshore wind turbines (OWTs). However, the offshore environment is extremely complicated, characterized by wind, wave and even ice loads (Liu et al., 2025). Apparently, the ice load is capable of affecting the structural response of the offshore structure. Therefore, it is of great significance to thoroughly investigate the influences of ice load on the dynamic behavior of the OWTs, providing valuable insights for the modelling design.
However, most existing studies have focused on the numerical methods to investigate the coupled dynamic response of the OWTs subjected to ice and other environmental loads. Shi et al. (2016) studied the dynamic interaction between the structural response of the monoplie wind turbine and ice loads under operating and parked conditions, using a semi-empirical simulation model developed based on HAWC2. Heinonen and Rissanen. (2017) evaluated the influence of ice velocity, thickness and shape on the structure performance of the wind turbine based on the FAST under various operating modes. The coupling dynamics between the wind-ice loads and structural response have also been investigated. Seidel and Hendrikse. (2018) evaluated the impacts of the frequency lock-in ice load on the monopile-type OWT performance. Zhou et al. (2019) developed a numerical model taking account for the non-simultaneous ice crushing failure, which acted on the foundation of the OWT. The discrepancies in peak ice force between numerical and model tests were less than 10%. Huang et al. (2021) developed a method considering the coupling effects of the structural response, ice dynamics, earthquakes, and fluid interactions to investigate the impact of sea ice on the wind turbine tower. It was found that the damage fatigue of the tower was increased by up to 50% subjected to the ice loads. Tang et al. (2021) examined the impacts of additional ice-breaking loads on the hydrodynamic behavior of the monopile wind turbine structure close to the sea water level using computational fluid dynamics method. Barooni M. et al. (2022) compared the dynamic response of the 5 MW spar-type wind turbines subjected to various ice-induced loads based on the coupled analysis numerical framework. The results indicated that the output power of the wind turbine was not significantly influenced due to ice loads under the rated wind speed. Ji and Yang. (2022) evaluated the ice-induced structural vibration and ice force between the monopile-type OWT and sea ice based on a coupled DEM-FEM method. The findings showed that the resonance occurred for the wind turbine subjected to the ice load model with a velocity and thickness of 0.04 m/s and 0.4 m, respectively. Hammer et al. (2023) analyzed the interaction between the monopile-supported OWT and sea ice based on a real-time hybrid test setup. The findings revealed that there were four regimes of ice-induced vibrations for the monopile OWT, while the influence of turbine operating states on the ice-induced interaction was slight under a relative lower ice velocity. On top of that, the lateral structural response was hampered by the lower-speed ice. Sui et al. (2024) analyzed the structural responses of a 10 MW jacket-type OWT under combined ice-wind loads using the LS-DYNA and KARNA ice force spectrum. The researchers developed a structure employing concrete-filled double-skin steel tubes to replace the initial hollow legs of the wind turbine for mitigation of the vibrations under icing scenarios. It was found that the maximum displacements and accelerations were decreased by up to 30% of the proposed structure.
In addition, current research has analyzed the ice characteristics involving ice thickness, velocity, and shapes to better understand the impact of ice loads on the dynamic response of the wind turbine. For instance, Hu et al. (2017) evaluated the ice characteristics including ice mass and thickness, demonstrating that ice distributions made a significant effect on the structural response of the wind turbine. The numerical data showed that the tower and blade fatigue damage were respectively increased by up to 70.8% and 97.6% due to asymmetric ice loading. Blasco et al. (2017) investigated the impacts of ice roughness on the output power of a 1.5 MW wind turbine. Song et al. (2019) explored the interaction between the wind turbine tower and various ice load models using the explicit nonlinear tool LS-DYNA. The influence of mesh size, impact speed, and thickness of sea ice load models on the ice forces has been compared. Lagdani et al. (2021) investigated the structural response and fatigue damage of the wind turbine blade with respect to sea ice loads. Three ice model shapes and three blade positions have been adopted to evaluate the blade performance based on the finite element method using ABAQUS. The impacts of wind loads and pile-soil interaction on the dynamic characteristics of the OWT under different modes were investigated by Liu et al. (2022); Liu et al. (2023). The soil-structural and fluid-structural interaction have both been considered based on the nonlinear software LS-DYNA. Moreover, the impact of ice thickness and velocity have been studied. It was found that the peak damage rates for the ice thickness and velocity were achieved by up to 3.08% and 6.69%, respectively. Ramadhani et al. (2022) evaluated the dynamic behavior of the offshore structures subjected to ice load under different wind velocity and wave height. In addition, Wang et al. (2022) identified that the cone angle of ice breaking model could significantly affect the dynamic response and fatigue damage of the wind turbine. The optimal cone angle was determined to be 60 deg.
Most existing studies overlook the flexible deformation of the wind turbine blades, treating them as rigid bodies subjected to ice loads. The aerodynamic loads of the tower and blade have been neglected. Additionally, the wind turbine operates in the complex environmental loadings, with subjected to combined wind-wave-ice loads, however, most studies disregarded wave loads, like Ji and Yang. (2022). It may lead to inaccurate reflections of the variations in wind speed with respect to collision. Therefore, this study develops a novel simulation module in Bladed named IceLoading to better analyze the dynamic behavior of the OWT subjected to wind-ice loads. The effect of ice thickness and ice load prediction model has also been considered.
The remaining sections of this study are organized as follows: Section 2 describes the development and validation of IceLoading module for simulation of structural responses of the OWTs. Section 3 presents the examined load cases (LCs). Section 4 illustrates the results and discussions of the structural responses of the OWT subjected to ice loads. Section 5 concludes the main findings of this research.
2 Development of the ice loading simulation module
2.1 Brief description of bladed
Bladed is a software tool developed by DNV GL specifically for modelling and load calculation of the wind turbines. It can accurately evaluate the time-series loads, ultimate loads, and fatigue loads for various components, highlighting the essential role in the modelling design and lifecycle improvement of the wind turbines.
On top of that, this study has developed a fully coupled simulation module named IceLoading with consideration of the ice load acting on the OWTs. Specifically, the analysis of ice loading is simulated by defining external load time series data compatible with Bladed.
2.2 NREL 5 MW monopile wind turbine
The structural loads of the OWT are possibly influenced by the collision of ice loading. In order to comprehensively investigate how the ice-wind turbine collision affects the performance of wind turbine structures, key characteristics for the ice have been selected for further study, including ice load models and thickness.
The 5 MW wind turbine developed by the National Renewable Energy Laboratory (NREL) has been selected in this study. Specifically, it is a monopile structure suitable for a water depth of 20 m, with the sea water level (SWL) situated 10 m below. The hub height of the wind turbine is 87.6 m, with a diameter of 6 m. Figure 1 presents the 5 MW monopile wind turbine and the surrounding environment. In addition, Table 1 shows the main parameters of the NREL 5 MW wind turbine.
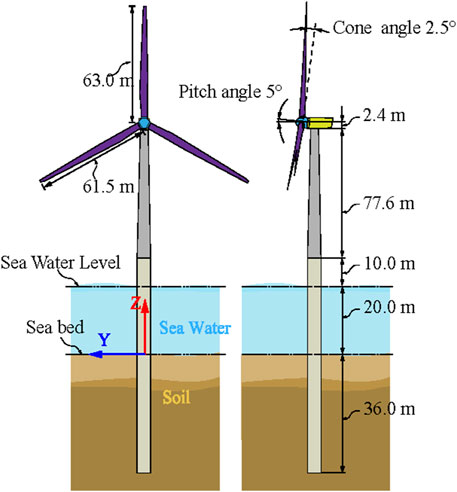
Figure 1. The NREL 5 MW monopile OWT.
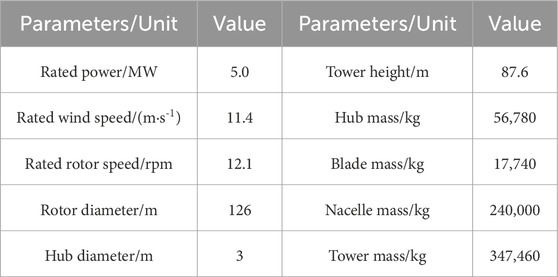
Table 1. The main properties of the NREL 5 MW wind turbine.
2.3 Ice load prediction models
2.3.1 Continuous random crushing model
In the process of continuous random collisions of the ice loading, a consistent collision load is generated under the peak velocity, accompanied by low-amplitude random vibrations. Specifically, the dynamic load can be analyzed using the power spectral density function as follows:
where
The average value of dynamic load is derived from the peak value, where is a certain collation between the maximum and mean data:
where
The maximum value of dynamic ice load calculated based on Equation 2 has a standard deviation range from 4 to 5 between the peak and mean data. The standard deviation can be evaluated using an empirical strength function as follows:
where I represents the range of strength of the continuous random ice loads.
Due to the specifications of the ISO 19906 criterion, the I is 0.2–0.5. Therefore, 0.4 is selected as the assigned value based on observations. The average and standard deviation values can be estimated from the maximum load using Equations 2 and 3, as can be see in Equations 4 and 5.
2.3.2 ISO intermittent crushing model
Due to the creep and plastic deformation of the ice load, the peak value in the intermittent crushing model is influenced by collisions. The reductions in the ice load intensity can be caused due to the variations in structural damping. Since the period of the load pulse is typically more significant than that of the natural vibration period (lowest natural frequency), there is no lock-in phenomenon between the load frequency and the structural frequency of the ISO intermittent crushing model.
2.3.3 ISO lock-in crushing model
The applicability of the ISO lock-in crushing model depends on the damping characteristics of the structure and the degree of frequency resonance. In practice, when the ice collision is influenced by damping, leading to energy loss, the dynamic response is not increased significantly. Moreover, the effect of frequency lock-in can be neglected with a large damping ratio. Typically, frequency lock-in is not caused with the ice concentration below 7/10.
where
2.3.4 IEC lock-in crushing model
The lock-in crushing model based on the IEC standard presents a sine waveform. For vertical collisions, the IEC lock-in crushing model using the Korzhavin formula as follows (Equation 7):
wherein,
2.3.5 ISO bending crushing model
Based on the 19,906 ISO criterion of ice loading models, the discrete coefficient of the double amplitude load is 0.4. Meanwhile, it is assumed that the maximum ratio of the peak load is 95%. Therefore, the average load of the floating ice can be expressed as follows (Equation 8):
wherein
The duration of the load peak depends on the ice velocity, and the fracture length of the ice can be expressed as follows (Equation 9):
where T the fracture length of the ice (m), and v means the ice velocity (m/s).
The fracture length is according to the ice thickness, strength, elastic modulus, structural dimensions, and ice velocity. Typically, the fracture length is 3–10 times of the ice thickness. According to the ISO standard, the ratio of the fracture length to the ice thickness gradually decreases as the ice thickness increases.
2.3.6 IEC bending crushing model
The total force exerted by the ice loading of the IEC bending crushing model is represented as follows (Equation 10):
wherein,
where Y is 2.711 under the Tresca criterion; G is a factor regarding ice strength, representing the relationship between the weight and ice strength.
The last two coefficients, x and gr, are derived based on the elastic theory of ice layer failure and the associated velocity field as Equation 13 shows:
where E1 and E2 represent the first and second kinds of elliptical integrals. hd is the arch height. To ensure the rationality of the ice model,
2.4 Development and validation of IceLoading
To better investigate the dynamic response of the wind turbines subjected to wind-ice load, a novel simulation module IceLoading is developed in Bladed. It is able to evaluate the dynamic characteristics of various ice loading models, therefore the structural responses of the wind turbine can be precisely calculated. This section will present how to develop and validate the accuracy of the IceLoading.
2.4.1 Framework of IceLoading
This study has developed a fully coupled simulation module with consideration of the ice load acting on the OWT based on Fortran code. On top of that, the analysis of ice floe load is simulated by defining external load time series data compatible with Bladed. The IceLoadingBladed framework includes the following key features.
1) Support for six various ice floe calculation models: continuous random crushing, ISO intermittent crushing, ISO lock-in crushing, IEC lock-in crushing, ISO bending crushing, and IEC bending crushing models.
2) Capability to analyze the ice load for arbitrary ice velocities, ice thicknesses, elastic modulus/crushing force.
3) Flexibility for user-defined parameters, including the diameter, vibration frequency, and lock-in frequency of the wind turbine foundation.
4) Direct generation of external load data files compatible with simulations in Bladed v4.10 and above.
5) Inclusion of basic parameter self-check functionality, with output prompts to the interface to guide users in make corrections.
2.4.2 Verification of IceLoading
The floating ice load, based on the ISO bending crushing model with a thickness of 1 m and an ice velocity of 0.2 m/s, is used in this study to validate the reliability and computational accuracy of the IceLoading developed in this study. The results have been compared to the OpenFAST v3.5. The floating ice load generated by IceLoading module and OpenFAST has been investigated and compared in Figure 2. The floating ice load is derived from the ISO bending crushing model with a 60 deg cone angle. The time duration is set to 600 s. The ice force obtained by IceLoading is identical to the OpenFAST, verifying that the program developed in this study can accurately and efficiently calculate the loads of specific ice load models.
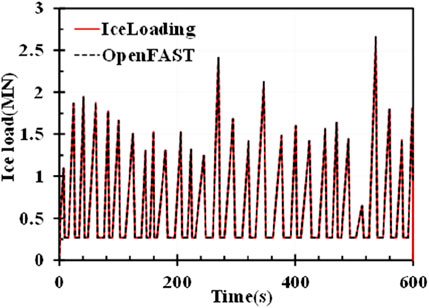
Figure 2. The comparison results of ice force between IceLoading and OpenFAST.
To further verify the precise of the IceLoading, the dynamic responses of the NREL 5 MW monopile-type wind turbine subjected to ice load have been simulated in Bladed 3.10. The simulation is conducted under a parked scenario to better minimize discrepancies caused by the aerodynamic loads acting on the wind turbine, ensuring a more accurate comparison between Bladed and OpenFAST. Figure 3 shows the lateral shear force at the collision point and pitching bending moment at the mudline of the monopile-type wind turbine subjected to ice loads. As can be observed, the shear force at the collision point and bending moment of the wind turbine generated by OpenFAST and Bladed are in significant agreement. The agreement between the results of Bladed and OpenFAST significantly proves the accuracy and viability of the IceLoading module for analysis of the structural loads of the wind turbine subjected to ice loads.
Figure 3. The comparison of structure loads between OpenFAST and Bladed. (a) Shear force (b) Pitching bending moment.
To recapitulate, it proves that the effects of ice loading can be effectively considered based on the external node loads using IceLoading developed in this study.
2.5 Limitation and validity of IceLoading
The IceLoading module has been developed and compiled into Bladed for comprehensive study of dynamic behavior of the monopile-type OWT with respect to various ice loadings.
It can simulate a wild range of floating ice loads, including different ice velocities, thicknesses, and elastic moduli/breaking forces. Additionally, it allows users to customize parameters such as the diameter, vibration frequency, and the lock-in vibration frequency range of the wind turbine.
However, this code currently supports the external load data files only for Bladed of version 4.10 and above. Moreover, all input parameter identifiers and comments in the IceLoading are in English due to compatibility issues with the code.
3 Load case definition
3.1 Environmental conditions
To comprehensively analyze the impact of ice thickness of different models on the structural loads of the OWTs, the wind speeds ranging from 4 m/s to 25 m/s have been selected for analysis. The turbulent wind field is generated based on the Kaimal spectrum, while the simulation time of each load case are set to 500–520 s. Table 2 presents the wind speed and corresponding met-ocean data of the examined environmental scenarios in this research.
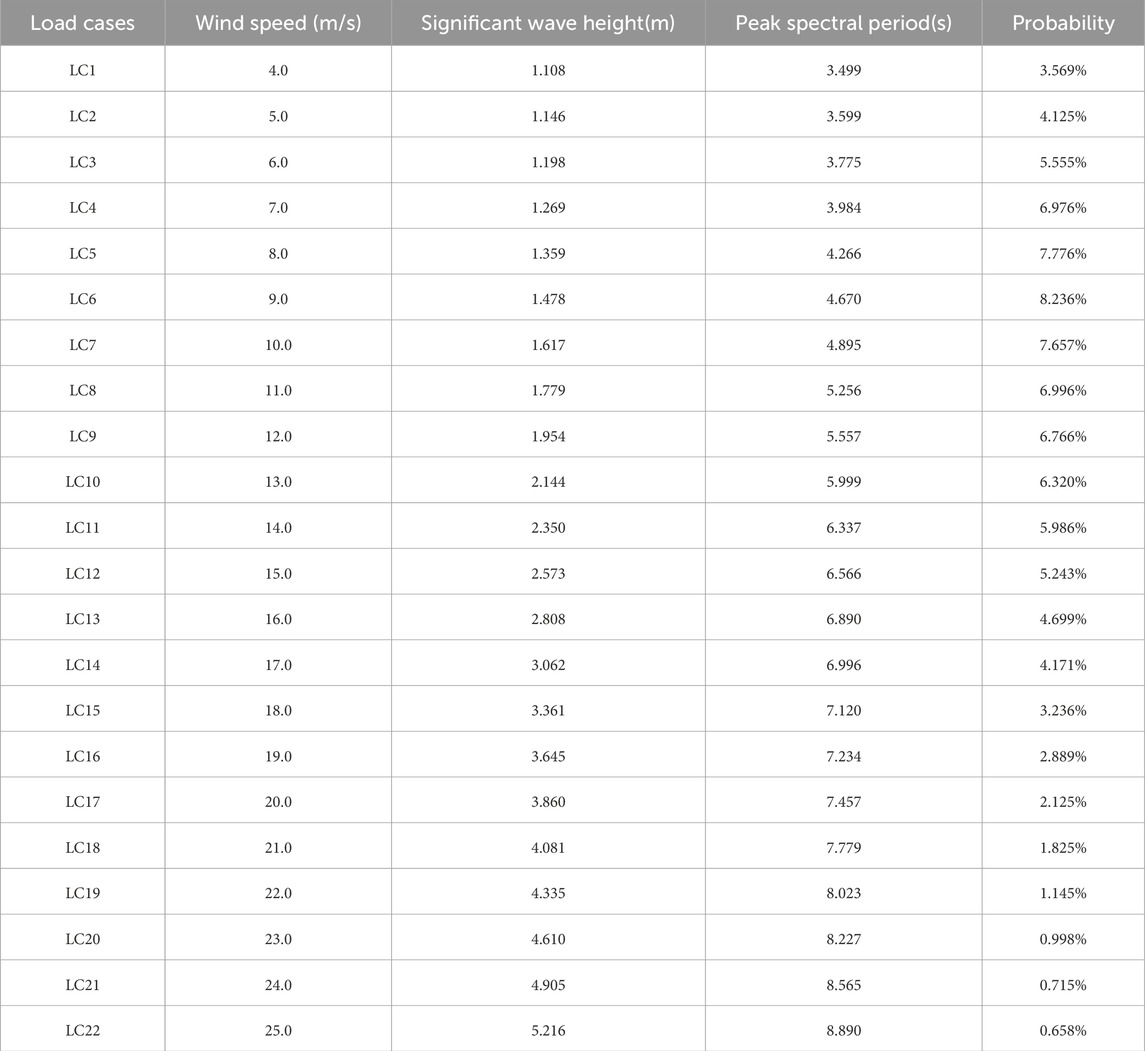
Table 2. The examined load cases.
3.2 Ice load models
Various ice models can significantly make a difference in the structural loads of the support structure of the wind turbines. Therefore, it is of great significance to study the influence of ice prediction models on the dynamic load to improve the safety of the operating wind turbines. It is generally accepted that there are four primary failure modes for the structures under ice loading, involving creep or plastic deformation, intermittent crushing, frequency lock-in, and random crushing. This paper focuses on investigating the latter three crushing models.
On top of that, six ice loading models have been adopted, including continuous random crushing model, ISO intermittent crushing model, ISO lock-in crushing model, IEC lock-in crushing model, ISO bending crushing model, and IEC bending crushing model. The cone angles of the ISO and IEC bending crushing models are set to 60 deg, while all other models have a cone angle of 0 deg. In addition, the basic frequency and friction coefficient of these six models are all set to 0.25 and 0.15, respectively. The tower diameters of IEC and ISO bending crushing models are all set to 7.55 m, while the corresponding value of the four remaining models are 6 m.
3.3 Ice thicknesses
In addition, to investigate the influence of ice thickness on the dynamic load of the wind turbine support structure, four ice thicknesses have been selected, including 0.1 m, 0.3 m, 0.5 m, and 1.0 m applied to six ice loading models. The ice velocity of each model is uniformly set to 0.05 m/s. In addition, the dynamic load of the wind turbine foundation is investigated under 4–25 m/s wind speed conditions.
4 Results and discussions
4.1 Influence of the ice load model
This section will examine the impact of floating ice collision models on the dynamic load of the wind turbine foundation, with a particular focus on the various breaking modes of the floating ice. The key performance indicators, including shear force at the collision point and the pitching bending moment at the mudline will be calculated under 4–25 m/s wind speeds. The obtained results will be compared to those without ice load. The ice thickness and velocity are 0.1 m and 0.05 m/s, respectively.
To directly investigate the comparison between the structural response of the wind turbine subjected to ice load or not, the maximum shear force at the collision point and pitching bending moment at the mudline under complicated environmental conditions have been presented in Tables 3 and 4, respectively. The ice velocity has been selected as 0.2 m/s for analysis, while the ice thicknesses are illustrated in Section 3.3.
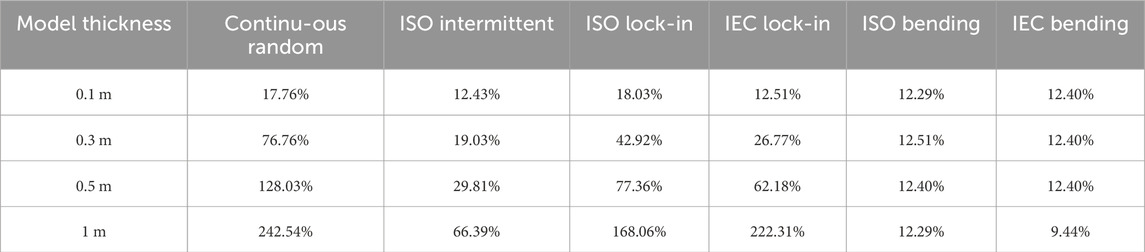
Table 3. The variations of maximum shear force.
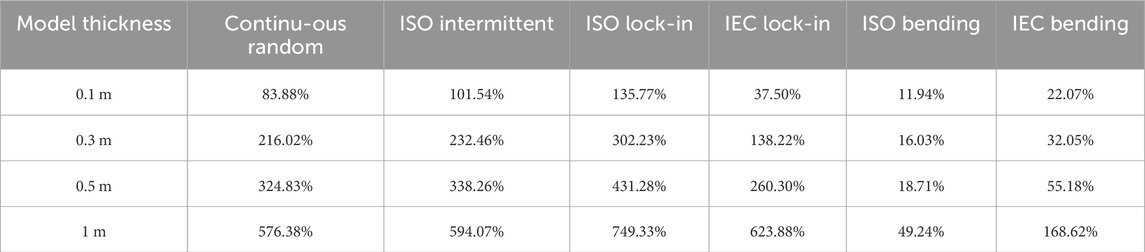
Table 4. The variations of maximum pitching bending moment at the mudline.
As can be observed in Tables, the structural loads of the wind turbine exhibit significant discrepancies with respect to six ice floe models. Specifically, the impacts of the random continuous crushing model make a dramatic difference on the structural loads compared to the other five models. In addition, the increase ratio of the shear force and pitching bending moment resulted from the continuous random crushing model are significantly improved due to increasing ice thickness. It indicates that the ice thickness is linearly related to the structural loads of the OWT supported structures.
Moreover, as can be seen, the variation of structural loads is a little slight subjected to ISO intermittent crushing model, ISO and IEC lock-in crushing models compared to the random continuous model. On the other hand, the structural responses of wind turbine subjected to the IEC and ISO bending crushing models are slightly influenced by the ice thicknesses. The discrepancies between shear force and pitching bending moment with 0.3 m and 0.5 m thicknesses are not large.
In addition, it can be found that the pitching bending moment of the wind turbine subjected to ice prediction models is more sensitive compared to the shear force. The maximum variation value in shear force is exhibited by up to 242.54% with respect to the continuous random model, while the corresponding result is achieved by 576.38%.
To recapitulate, the effect of continuous random crushing model on the structural responses of the OWT is more significant that other ice floe models. In addition, the ice thickness has a substantial impact on the structural loads of the wind turbine for the six ice load models. Particularly, the maximum value of shear force and pitching bending moment subjected to the continuous model is increased as ice thicknesses increases.
Figure 4 shows the maximum shear force and pitching bending moment of the wind turbine under various ice load conditions in 4–25 m/s wind speed conditions. It is evident that the variations in the pitching bending moment at the pile foundation are more significant than that of the shear force. As can be observed in Figure 4, the shear force generated due to ice-structure collision is larger than that without ice, except at 11 m/s wind speed. Specifically, the shear force of the wind turbine subjected to continuous random collision model is 0.0874 MN larger than the 1.074 MN without ice at a wind speed of 20 m/s.
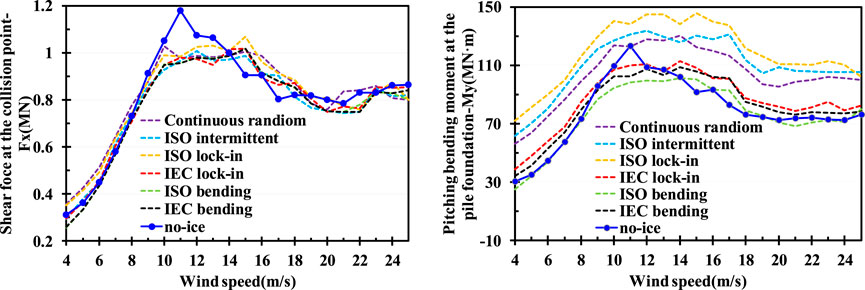
Figure 4. The comparison of structural loads of OWT under various wind-ice loads.
In addition, the pitching bending moment at the pile foundation is also significantly larger than that without ice load, with similar trends observed in different conditions. Notably, the pitching bending moment is achieved the largest for the wind turbine subjected to the ISO lock-in crushing model under 4–25 m/s wind speed conditions, while the influence of ISO bending crushing model is the least significant.
4.2 Influence of the ice thickness
The ice thickness is a critical factor influencing the ice load characteristics acting on the pile foundation of the wind turbine. To more comprehensively investigate the impacts of ice thickness on the structural responses of the wind turbine structures, Figures 5–10 presents the time-domain analysis of the shear force and pitching bending moments at the pile foundation of the monopile-type wind turbine, considering various types of ice loadings. The wind speed is set to 4 m/s, while the rated ice speed is selected as 0.05 m/s for analysis. Obviously, it can be seen in the figures that with increasing ice thickness, the shear forces at the collision point of the continuous random crushing model, ISO intermittent crushing model, ISO lock-in crushing model, and IEC lock-in crushing model are significantly increase. In addition, it is found that the rate of increase in the shear force becomes more pronounced as the ice thickness grows. Specifically, the maximum shear force at the collision points of the wind turbine subjected to the ISO lock-in crushing loads is achieved by 0.35 MN, 0.45 MN, 0.53 MN, and 0.84 MN, respectively, according to the floating ice thicknesses of 0.1 m, 0.3 m, 0.5 m, and 1.0 m. In the case of no ice load, the corresponding value is 0.31 MN, indicating that as the ice thickness increases, the shear force is increased by 12.84%, 38.04%, 48.47%, and 99.28%, respectively. The data above highlights that the variation in force at the collision point of the wind turbine is significantly affected by the ice thickness.
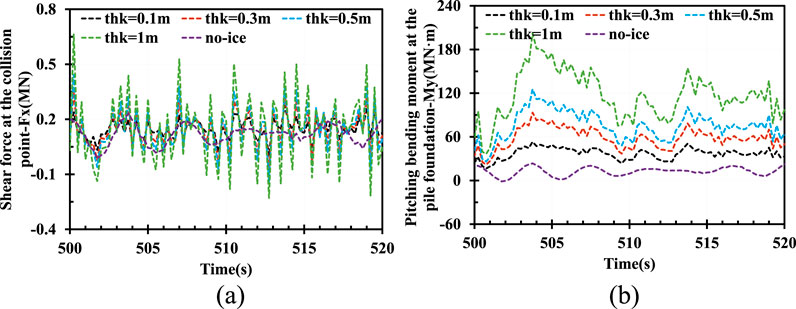
Figure 5. Continuous random crushing model. (a) Shear force (b) Pitching bending moment.
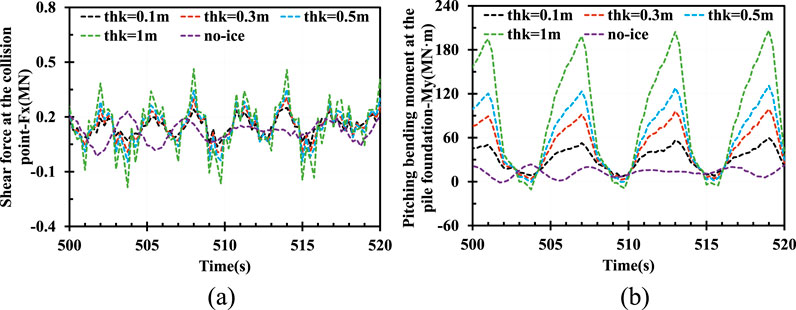
Figure 6. ISO intermittent crushing model. (a) Shear force (b) Pitching bending moment.
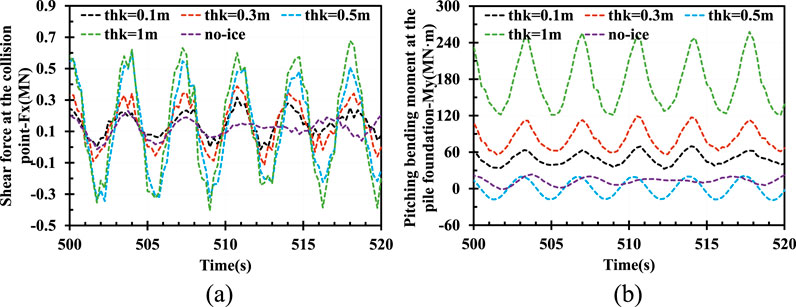
Figure 7. ISO lock-in crushing model. (a) Shear force (b) Pitching bending moment.
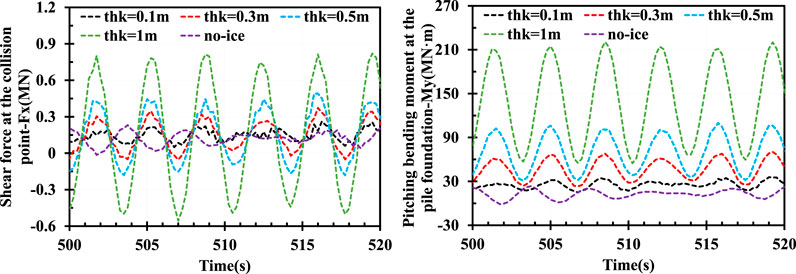
Figure 8. IEC lock-in crushing model. (a) Shear force (b) Pitching bending moment.
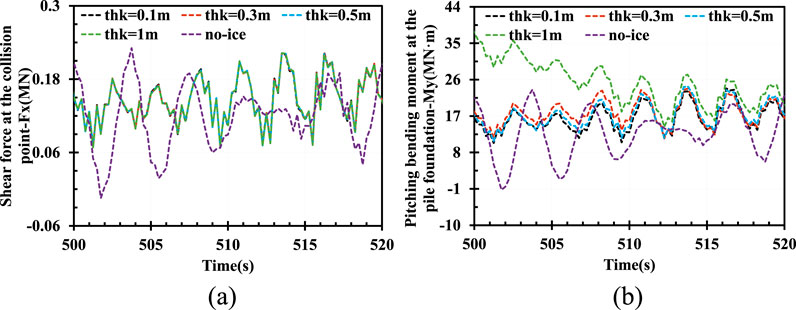
Figure 9. ISO bending crushing model. (a) Shear force (b) Pitching bending moment.
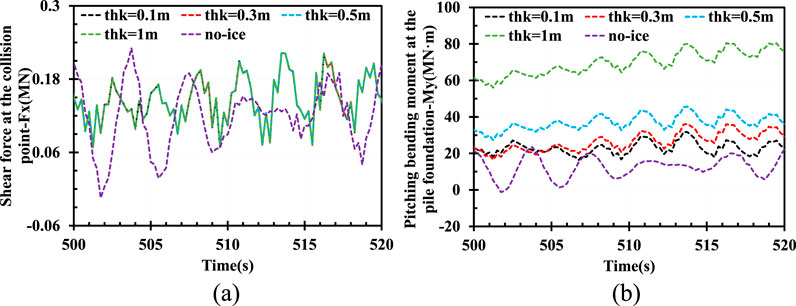
Figure 10. IEC bending crushing model. (a) Shear force (b) Pitching bending moment.
In contrast, it can be observed in Figures 9, 10 that the shear forces of the wind turbine collision point subjected to bending crushing models remain relatively minimal, regardless the ice thicknesses. It means that the floating ice thickness in bending crushing models makes a slight influence on the shear force, further demonstrating that the influence of ice load model on the structural response of the wind turbine. Interestingly, the shear force is even larger than that without ice loads, suggesting that floating ice collisions suppress the shear force at the wind turbine collision point subjected to the ISO and IEC bending crushing models.
In addition, it is clear that the pitching bending moment at the pile foundation is the minimal without ice. However, as the floating ice thickness increases, the corresponding values of the monopile wind turbine are increased steadily subjected to various ice load models, expect for the bending crushing models. The rate of increase is consistent with the magnitude of increase in ice thickness. It shows that the impact on the wind turbine pile foundation structure becomes more significant as the floating ice thickness increases. Specifically, the maximum pile foundation load for the wind turbine during collisions are achieved by 56.14 MN m, 96.48 MN m, 129.70 MN m, and 206.50 MN m, respectively, subjected to the continuous random crushing model. In the absence of ice load, the corresponding value is 30.53 MN m. It equals to the increase of 83.88%, 216.02%, 324.83%, and 576.38%, respectively, signifying that the wind turbine pile foundation load increases linearly as the floating ice thickness increases. It also represents that the impact of floating ice load on the pile foundation is substantially greater than that on the collision point of the monopile wind turbine.
All the data above indicate that the ice load models have a significant effect on both the wind turbine pile foundation structure and the collision point besides the bending crushing models, especially on the pile foundation load. Therefore, the influence of ice loading on the wind turbine pile foundation structure should be carefully considered to improve the structural safety in the design of wind turbines.
To further analyze the effects of ice thickness on the structural behavior of the wind turbine foundation, the wind speeds are selected range from 4 m/s to 25 m/s, while the floating ice velocity is set to 0.05 m/s. The maximum shear force at the collision point is shown in Figures 11–16. It can be seen that the maximum shear force due to six ice load models is respectively increased with the rising ice thickness. Specifically, the shear force reaches its peak at 1.94 MN of an ice thickness of 1 m, which is an increase of 0.18 MN compared to the value for 0.1 m, under a 12 m/s wind speed condition.
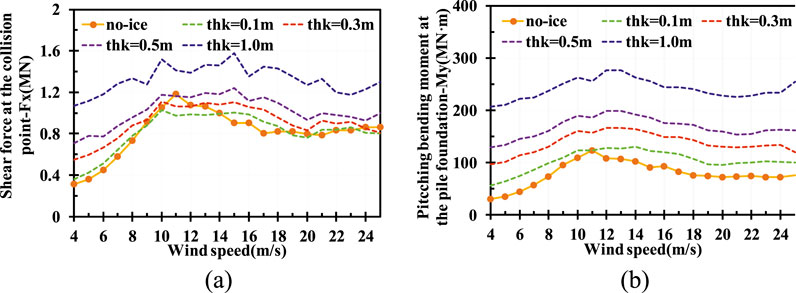
Figure 11. Continuous random crushing model. (a) Shear force (b) Pitching bending moment.
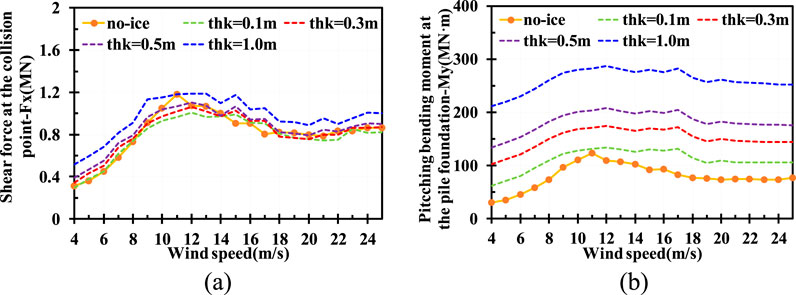
Figure 12. ISO intermittent crushing model. (a) Shear force (b) Pitching bending moment.
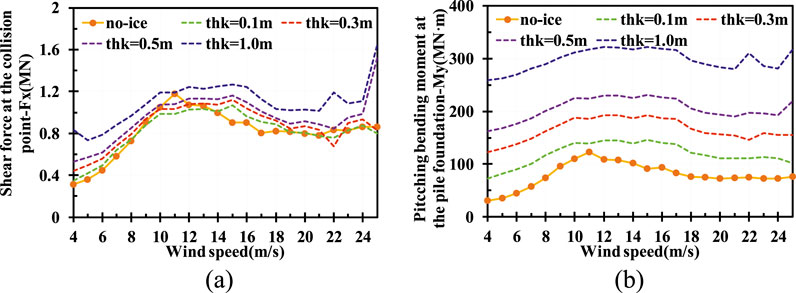
Figure 13. ISO lock-in crushing model. (a) Shear force (b) Pitching bending moment.
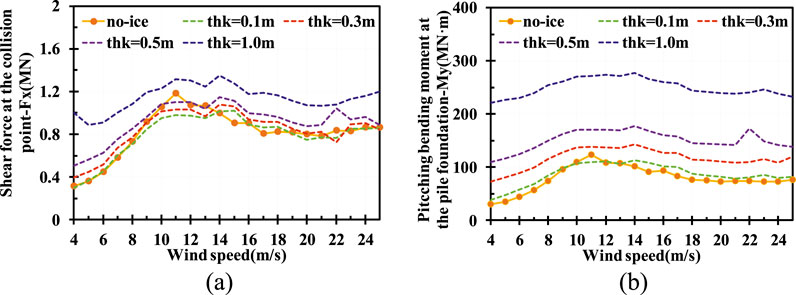
Figure 14. IEC lock-in crushing model. (a) Shear force (b) Pitching bending moment.
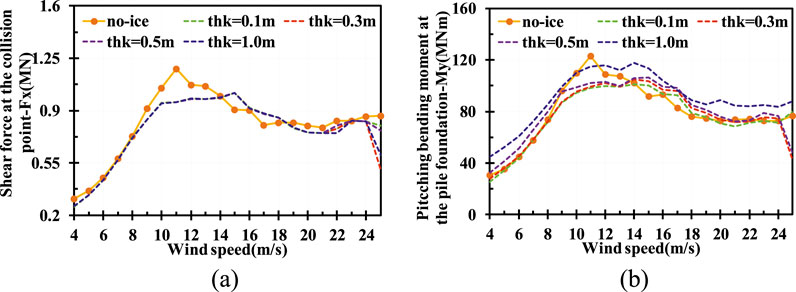
Figure 15. ISO bending crushing model. (a) Shear force (b) Pitching bending moment.
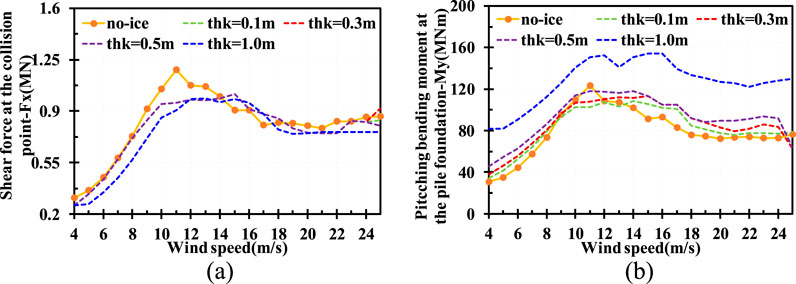
Figure 16. IEC bending crushing model. (a) Shear force (b) Pitching bending moment.
In addition, the maximum pitching bending moment at the pile foundation can also directly reflect the effects of floating ice thickness on the structural response of the wind turbine. As illustrated in Figure 11b, the maximum pitching bending moment increases as the ice thickness increases. The maximum value is achieved by 61.09 MN with the ice thickness of 0.1 m, while the corresponding value is 138.23 MN with the ice thickness of 1 m, under a wind speed of 20 m/s. It represents an increase of 77.14 MN in the pitching bending moment as the ice thickness increases from 0.1 m to 1.0 m.
On top of that, it is found that the pitching bending moment at the pile foundation and shear force are relatively minimal in the case of no ice load, indicating that the ice load makes a significant difference in structural responses of the wind turbine foundation, especially for the pile foundation. Moreover, the values are able to be enlarged as the ice thickness increases. Specifically, the maximum pitching bending moment with no ice load is 323 MN, while the corresponding value subjected to ice load of 1 m thickness is 109 MN, exhibiting an increase of 196.33%. In addition, the pitching bending moment at the pile foundation of the continuous random crushing model with an ice thickness of 0.5 m is 129.7 MN under a 4 m/s wind speed condition. It presents an increase of 73.56 MN compared to the 0.1 m ice thickness of 206.5 MN.
The above data shows that the rate of increase in the pitching bending moment accelerates as the ice thickness increases, revealing a positive linear correlation between floating ice thickness and the pitching bending moment at the mudline of the OWT.
5 Conclusion
Wind turbines deployed in the cold regions may experience ice collisions, potentially causing damage to the structural integrity of the support structures. A novel module is developed in this study for predicting ice loads in Bladed to examine the coupled effects of wind and ice. The influence of the ice load prediction model and thickness is quantitatively examined for the NREL 5 MW monopile OWT under operational states. The conclusions of this study are presented as follows.
(1) A novel model has been developed in this study for analysis of the dynamic behavior of OWTs subjected to floating ice. The ice loading module is integrated within Bladed to examine the wind-ice coupling effects. The accuracy has been validated by comparing the results calculated using OpenFAST.
(2) The structural loads of the support structures of the OWT are significantly affected by the ice thickness and ice prediction model. Notably, the pitching bending moment at the mudline of the wind turbine is more sensitive to ice loads compared to shear force at the collision point under 4–25 m/s wind speed scenarios.
(3) The ice load prediction model has significant influence on the structural loads of the OWT, especially for continuous random crushing model under low wind speed scenarios. Specifically, the shear force at the collision point is increased the most significantly by up to 101% of the wind turbine with respect to the continuous random crushing model of an 1 m thickness ice, while the coned structure can mitigate the ice-induced load by approximately 85%.
(4) The structural loads of the 5 MW OWT are improved linearly to the increasing floating ice thickness. Particularly, the peak value of the shear force is enhanced with the increase of ice thickness, especially for the continuous random crushing model, ISO intermittent crushing model, ISO and IEC lock-in crushing model. Specifically, the maximum shear force is increased respectively by 12.84%, 38.04%, 48.47%, and 99.28% subjected to the ISO lock-in crushing models with ice thicknesses of 0.1 m, 0.3 m, 0.5 m and 1 m, under a 4 m/s wind speed condition.
Data availability statement
The raw data supporting the conclusions of this article will be made available by the authors, without undue reservation.
Author contributions
YL: Conceptualization, Investigation, Methodology, Software, Writing – original draft, Visualization. BH: Data curation, Methodology, Project administration, Writing – review and editing. JD: Data curation, Investigation, Software, Writing – review and editing. NL: Project administration, Visualization, Writing – review and editing. YY: Funding acquisition, Project administration, Supervision, Writing – review and editing.
Funding
The author(s) declare that financial support was received for the research and/or publication of this article. The authors are grateful for the financial support from the National Natural Science Foundation of China (Grant No: 52301343, 52476205, 52271294), Natural Science Foundation of Zhejiang Province (Grant No.: LQ23E090003), “Leading Goose” R&D Program of Zhejiang (No. 2023C03122).
Conflict of interest
Authors YL, BH, and NL were employed by PowerChina Huadong Engineering Corporation Limited.
The remaining authors declare that the research was conducted in the absence of any commercial or financial relationships that could be construed as a potential conflict of interest.
Generative AI statement
The author(s) declare that no Generative AI was used in the creation of this manuscript.
Publisher’s note
All claims expressed in this article are solely those of the authors and do not necessarily represent those of their affiliated organizations, or those of the publisher, the editors and the reviewers. Any product that may be evaluated in this article, or claim that may be made by its manufacturer, is not guaranteed or endorsed by the publisher.
References
Barooni, M., Nezhad, S. K., Ali, N. A., Ashuri, T., and Sogut, D. V. (2022). Numerical study of ice-induced loads and dynamic response analysis for floating offshore wind turbines. Mar. Struct. 86, 103300. doi:10.1016/j.marstruc.2022.103300
Blasco, P., Palacios, J., and Schmitz, S. (2017). Effect of icing roughness on wind turbine power production. Wind. Energy. 20 (4), 601–617. doi:10.1002/we.2026
Ding, J., Yang, Y., Yu, J., Bashir, M., Ma, L., Li, C., et al. (2024). Fully coupled dynamic responses of barge-type integrated floating wind-wave energy systems with different WEC layouts. Ocean. Eng. 313, 119453. doi:10.1016/j.oceaneng.2024.119453
Hammer, T. C., Willems, T., and Hendrikse, H. (2023). Dynamic ice loads for offshore wind support structure design. Mar. Struct. 87, 103335. doi:10.1016/j.marstruc.2022.103335
Heinonen, J., and Rissanen, S. (2017). Coupled-crushing analysis of a sea ice-wind turbine interaction–feasibility study of FAST simulation software. Ships Offshore Struct. 12 (8), 1056–1063. doi:10.1080/17445302.2017.1308782
Hu, L., Zhu, X., Hu, C., Chen, J., and Du, Z. (2017). Wind turbines ice distribution and load response under icing conditions. Renew. Energy 113, 608–619. doi:10.1016/j.renene.2017.05.059
Huang, S., Huang, M., Lyu, Y., and Xiu, L. (2021). Effect of sea ice on seismic collapse-resistance performance of wind turbine tower based on a simplified calculation model. Eng. Struct. 227, 111426. doi:10.1016/j.engstruct.2020.111426
Ji, S., and Yang, D. (2022). Ice loads and ice-induced vibrations of offshore wind turbine based on coupled DEM-FEM simulations. Ocean. Eng. 243, 110197. doi:10.1016/j.oceaneng.2021.110197
Lagdani, O., Tarfaoui, M., Nachtane, M., Trihi, M., and Laaouidi, H. (2021). Numerical investigation of ice accretion on an offshore composite wind turbine under critical loads. Int. J. Energy Res. 45 (3), 4112–4132. doi:10.1002/er.6073
Liu, W., Ding, J., Fu, J., Zhang, Z., Yu, J., Hu, H., et al. (2025). Comparison of the fully coupled dynamic responses of spar-type integrated wind-current floating energy systems with various tidal turbine layouts. Ocean. Eng. 325, 120866. doi:10.1016/j.oceaneng.2025.120866
Liu, Y., Shi, W., Wang, W., Li, X., Qi, S., and Wang, B. (2022). Dynamic analysis of monopile-type offshore wind turbine under sea ice coupling with fluid-structure interaction. Front. Mar. Sci. 9, 839897. doi:10.3389/fmars.2022.839897
Liu, Y., Shi, W., Wang, W., Li, X., Qi, S., Wang, B., et al. (2023). Investigation on the interaction between ice and monopile offshore wind turbine using a coupled CEM–FEM model. Ocean. Eng. 281, 114783. doi:10.1016/j.oceaneng.2023.114783
Ramadhani, A., Khan, F., Colbourne, B., Ahmed, S., and Taleb-Berrouane, M. (2022). Resilience assessment of offshore structures subjected to ice load considering complex dependencies. Reliab. Eng. and Syst. Saf. 222, 108421. doi:10.1016/j.ress.2022.108421
Seidel, M., and Hendrikse, H. (2018). Analytical assessment of sea ice-induced frequency lock-in for offshore wind turbine monopiles. Mar. Struct. 60, 87–100. doi:10.1016/j.marstruc.2018.02.003
Shi, W., Tan, X., Gao, Z., and Moan, T. (2016). Numerical study of ice-induced loads and responses of a monopile-type offshore wind turbine in parked and operating conditions. Cold. Regions. Sci. Technol. 123, 121–139. doi:10.1016/j.coldregions.2015.12.007
Song, M., Shi, W., Ren, Z., and Zhou, L. (2019). Numerical study of the interaction between level ice and wind turbine tower for estimation of ice crushing loads on structure. J. Mar. Sci. Eng. 7 (12), 439. doi:10.3390/jmse7120439
Sui, H., Zhang, J., Liu, F., Ma, Z., Gu, C., Qiu, H., et al. (2024). Dynamic response analysis and vibration reduction of a 10-MW jacket offshore wind turbines under the combined wind and ice loads. Ocean. Eng. 303, 117553. doi:10.1016/j.oceaneng.2024.117553
Tang, Y., Shi, W., You, J., and Michailides, C. (2021). Effects of nonlinear wave loads on large monopile offshore wind turbines with and without ice-breaking cone configuration. J. Mar. Sci. Technol. 26 (1), 37–53. doi:10.1007/s00773-020-00719-4
Wang, B., Liu, Y., Zhang, J., Shi, W., Li, X., and Li, Y. (2022). Dynamic analysis of offshore wind turbines subjected to the combined wind and ice loads based on the cohesive element method. Front. Mar. Sci. 9, 956032. doi:10.3389/fmars.2022.956032
Keywords: offshore wind turbine, floating ice loading, structural load, anti-ice design, ice crushing model
Citation: Lai Y, He B, Ding J, Lyu N and Yang Y (2025) Effects of ice load prediction model and thickness on the structural loads of an offshore wind turbine. Front. Energy Res. 13:1618307. doi: 10.3389/fenrg.2025.1618307
Received: 25 April 2025; Accepted: 30 June 2025;
Published: 11 July 2025.
Edited by:
Joshuva Arockia Dhanraj, Dayananda Sagar University, IndiaReviewed by:
Jesus Alejandro Franco Piña, Universidad Nacional Autónoma de México, MexicoBofeng Xu, Hohai University, China
Copyright © 2025 Lai, He, Ding, Lyu and Yang. This is an open-access article distributed under the terms of the Creative Commons Attribution License (CC BY). The use, distribution or reproduction in other forums is permitted, provided the original author(s) and the copyright owner(s) are credited and that the original publication in this journal is cited, in accordance with accepted academic practice. No use, distribution or reproduction is permitted which does not comply with these terms.
*Correspondence: Yang Yang, eWFuZ3lhbmcxQG5idS5lZHUuY24=