 Vikram Rathore
 Paul Blair2
 Gustav Robertson
- 1Applied Nuclear Physics, Department of Physics and Astronomy, Uppsala University, Uppsala, Sweden
- 2Vattenfall Nuclear Fuel AB, Stockholm, Sweden
- 3Westinghouse Electric Sweden AB, Västerås, Sweden
Small modular reactors (SMRs) are gaining popularity due to several economic and safety benefits, along with their desirable load-following capability, which allows them to complement intermittent renewable energy sources. However, the impact of load-following operation on fuel performance remains underexplored. This study uses the fuel performance code, TRANSURANUS, to assess the effects of such operations on pressurized water reactor (PWR) fuel performance, given the design similarities between many SMRs and large light water reactors (LWRs). Hypothetical load-following operations were simulated using varying linear heat rate levels, neutron flux, and coolant flow rate, in accordance with a parameterized load-following operation. Most fuel performance parameters remained below safety limits. However, in some cases, the pellet–cladding interaction–stress corrosion cracking (PCI–SCC) model (SPAKOR) predicted cladding cracks and failures that were not observed during regular reference operation. A sensitivity analysis of load-following parameters indicated minimal deviations in fuel performance, apart from the PCI–SCC-related issues.
1 Introduction
In 2021, Sweden established a national competence center, the Academic-Industrial Nuclear Technology Initiative to Achieve a Sustainable Energy Future (ANItA) (Håkansson, 2024), to conduct research and development on the introduction of small modular reactors (SMRs). At the competence center, numerous research projects—both technical and non-technical—have been initiated to address various aspects of SMRs in Sweden. This work was conducted as part of a project dedicated to fuel performance studies of SMRs. The project focuses on identifying the key differences and specific features of SMRs compared to large-scale conventional reactors, on which many SMRs are based (Carlson et al., 2022), and examining their impact on fuel performance.
One of the sought-after features of SMRs is their load-following operation capability. It is anticipated that SMRs will operate under load-following conditions (Park et al., 2023; Genglei et al., 2014; Ah et al., 2023; Zhang and Jiang, 2024) to integrate with intermittent renewable energy sources. This capability enables SMRs to adjust their power output in response to fluctuating energy demands, thereby enhancing their operational flexibility and synergy with diverse energy resources. However, power cycling associated with load-following operations may affect fuel performance (Aas, 1975; Bjurenfalk, 2020; IAEA, 2021) and operational lifespan. Power cycling causes variations in the heat output of fuel rods, leading to significant variations in the temperature of the fuel and cladding, which, in turn, affect many phenomena critical to nuclear fuel performance. This is particularly concerning in load-following operation, where repeated changes in power levels may exacerbate pellet–cladding interaction (PCI) and pellet–cladding mechanical interaction (PCMI) (Videm et al., 1979; Sercombe et al., 2012;IAEA, 1987; von Jan and Hering, 1981; NEA, 2024), posing challenges to fuel integrity and safety. The scope of this work is, therefore, to study the effects of load-following operations on fuel performance. As SMR operation data and fuel histories are not yet openly available, this study utilized fuel rod data and power histories from a large pressurized water reactor (PWR).
We analyzed the impact of load-following operations on fuel performance using the TRANSURANUS fuel performance code (Lassmann, 1992; Lassmann and Blank, 1988). Real power histories from an existing PWR were used as a reference, and hypothetical load-following operations were simulated by adjusting the linear heat rate, neutron flux, and coolant flow rate. These adjustments were made according to a parameterized load-following signal, with key parameters including cycle length, power reduction, and transition rate, which are further described in the Methods section. The impact on fuel performance was then systematically evaluated. Additionally, a sensitivity study on load-following parameters was conducted using the DAKOTA toolkit (Adams et al., 2023) to assess the effects of variations in these parameters.
Hypothetical load-following operations allow controlled variations in load-following parameters, providing flexibility to explore load-following without being constrained by historical practices. Simulating these operations with fuel performance codes is a useful starting point for studying their effects. The results can guide future research, including observational studies on irradiated nuclear fuel, irradiation experiments, and further development of the models used in fuel performance codes.
2 Methods
In this work, we used the fuel performance code TRANSURANUS to simulate and analyze fuel performance (Van Uffelen et al., 2019; Magni et al., 2021) in a reactor. Thermal and mechanical analyses of an irradiated fuel rod can be performed using TRANSURANUS, in which a fuel rod is represented in 1.5 dimensions (Van Uffelen, 2015), where all transport processes are solved in one (radial) dimension and the axial segments/slices/nodes are coupled via balance equations. The code requires input data on fuel design (such as dimensions and material properties) and power history (irradiation conditions such as linear heat rate, neutron flux, and coolant mass flow rate). Various fuel performance parameters, such as temperatures, pressures, stresses, strains, fission gas release, and burnup, can be obtained from the output data generated by the code. For this study, we utilized power history data from a PWR, which contains irradiation parameters at different time intervals. A total of 50 different fuel rod power histories were used. Some key fuel properties and boundary conditions are given in Table 1. In the TRANSURANUS simulations, the fuel rod was divided into 12 equal sections (or nodes), each approximately 300 mm long. To simulate a hypothetical load-following operation, the operating power history was adjusted by applying a load-following signal. The methodology for generating the load-following signal is described in the next section.
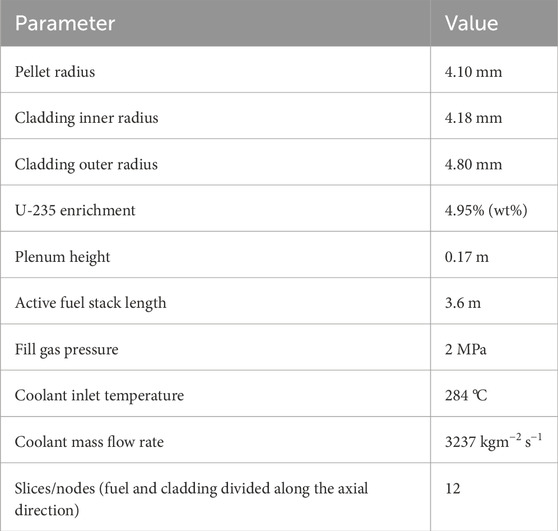
Table 1. Dimensions and material properties of the fuel and the boundary conditions used in the simulations.
2.1 Load-following signal
A load-following signal was synthesized by using four parameters:
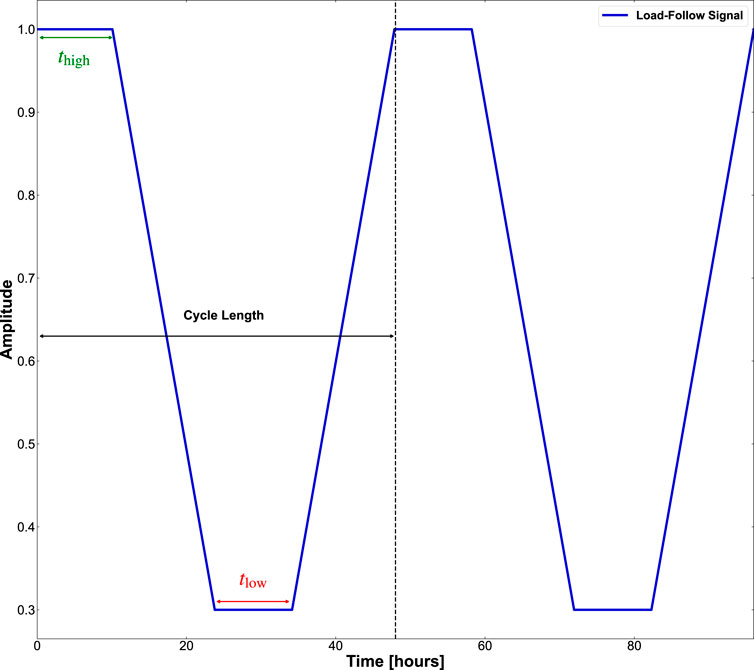
Figure 1. An example of a load-following signal. The cycle length refers to the total duration during which the power level transitions from high to low and back to high, as illustrated in the figure.
2.2 Load-following operation and fuel performance
A load-following signal is synthesized based on the parameters provided in Table 2. Using these parameters, the duration of one load-following operation cycle is 108 h, which can be interpreted as a mild cycle. The load-following signal is applied to the power history data of a PWR fuel rod during the middle of its operating history. The linear heat rate level, neutron flux, and coolant mass flow rate are modified in accordance with the load-following signal for the duration of the load-following operation. These values are uniformly adjusted along the fuel rod length to preserve the original axial power profile shape.
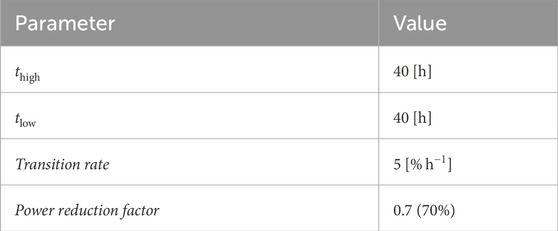
Table 2. Load-following signal parameters.
For reference, the power profile (linear heat rate) of the middle slice/node (sixth) of the fuel rod, under normal steady-state and load-following operation, is shown in Figure 2. We first simulated a single fuel rod power history with the applied load-following operation. To ensure consistency of the effects, we then applied the same load-following operation to 50 different fuel rod power histories.
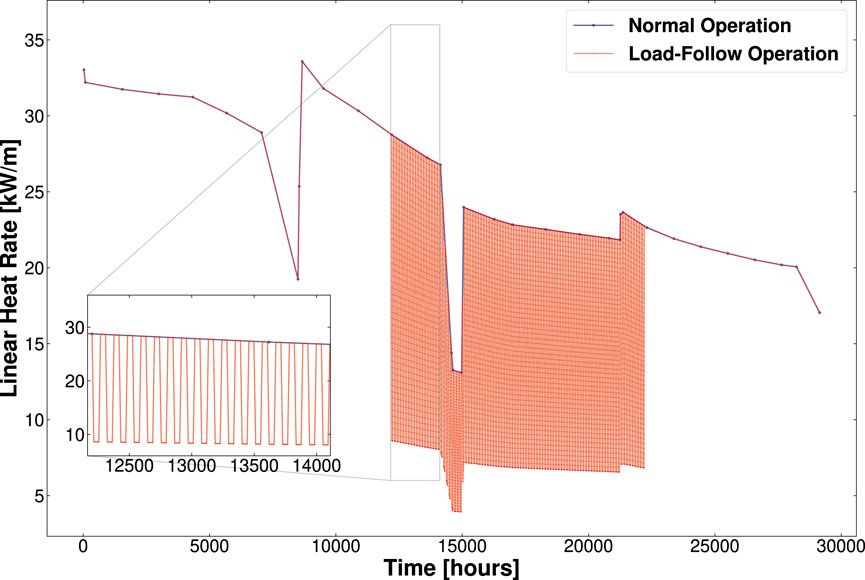
Figure 2. Power profile of the middle slice/node of the fuel rod in both normal and load-following operation cases. Zoomed-in view in the inset.
2.3 Sensitivity study on load-following signal parameters
The load-following signal applied to the normal steady-state operational history to simulate load-following operation is well defined and appears ideal. However, in reality, this may not be the case. The parameters of the load-following signal can vary or exhibit uncertainties, which may impact fuel performance (Ikonen, 2016; Ikonen and Tulkki, 2014). Therefore, to analyze the effects of uncertainties in input parameters on fuel performance, we conducted a sensitivity study on the load-following signal parameters using the DAKOTA toolkit. DAKOTA (Adams et al., 2023) is an open-source software toolkit for sensitivity analysis, uncertainty quantification, optimization, and design exploration. DAKOTA can be coupled with TRANSURANUS through its interface to perform iterative analyses on multiple input variables, allowing the evaluation of their effects on multiple output responses. The input variables, load-following signal parameters, were varied assuming a uniform probability distribution with upper and lower bounds provided in Table 3. The Latin hypercube sampling (LHS) method (McKay et al., 1979) was used to generate the input samples. A total of 20,000 samples were generated in two batches of 10,000 each. This approach was used to sample
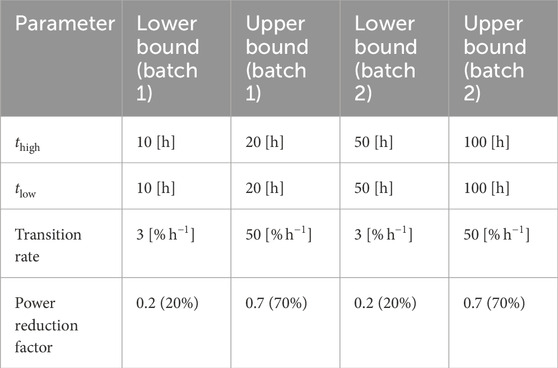
Table 3. Load-following signal parameters for sensitivity study with upper and lower bounds.
TRANSURANUS can output several quantities related to fuel performance, but for simplicity, we have extracted only a few key quantities to avoid complicating the analysis. The following quantities were extracted: fuel centerline temperature, cladding hoop stress, cladding hoop strain, fractional fission gas release, rod average burnup, hydrogen absorption, cladding oxide thickness, and cladding deformation. Hydrogen absorption, cladding oxide thickness, and cladding deformation were extracted only for the sensitivity analysis. For both the sensitivity analysis and the comparative study involving 50 different power histories, only the in-life maximum values of the extracted quantities were considered. It is important to note that, in the sensitivity analysis, the maximum fission gas release is reported as the total amount of released fission gases (Xe + Kr) in µmol, rather than fractional release. Additionally, two input parameters, cycle length (defined in Section 2.1) and duty cycle, were derived from the input parameters of the load-following signal. Duty cycle is the fraction of the cycle length during which the reactor operates at high nominal power, defined as
It is also important to highlight the limitations of our work, which arise from the simplified assumptions we have made. The linear heat rate has been adjusted uniformly along the length of the fuel rod during power cycling, which may be unrealistic in a real power maneuvre and would depend on the reactivity control mechanisms in place for a particular SMR. Axial non-uniformity arising from the usage of control rods can have significant implications for temperature distribution, cladding stress, local power peaking, and other factors. Additionally, using large-scale conventional PWR power history (which served as a foundation for implementing the load-following operation) in SMR fuel performance simulations introduces limitations as it does not accurately reflect SMR-specific characteristics, such as the limited degrees of freedom in core loading, smaller core size, intricate burnable absorber configurations, and advanced control mechanisms.
Although this study does not focus on any specific SMR design and is based on a generic PWR-type design, some similarities and differences between a standard PWR and an SMR are evident. Since the fuel performance code TRANSURANUS analyzes a single fuel rod, the main differences arise from the axial dimensions of the fuel rod and the boundary conditions. The similarities include almost identical radial dimensions, such as pellet radius and cladding thickness, along with fuel composition (standard
In addition, the cycle length for each load-following operation remains the same throughout the entire duration. Similarly, the power reduction factor for each load-following scheme remains constant in every cycle. These variations should also be considered for a more realistic load-following operation. Furthermore, it would also be interesting to study fuel performance under load-following operation of other SMR designs, such as the BWRX-300, which has been proposed to use natural circulation for heat removal.
Box 1 Crack initiation and growth conditions
1. The burnup must exceed 5 MWd/kgU.
2. The cladding temperature must exceed 270 °C.
3. The strain rate in the cladding must be positive.
4. The cladding hoop stress must be positive.
3 Results
Uranium oxide fuel pellets and Zircaloy cladding have different thermal expansion coefficients, causing differential responses to changes in heat output. This disparity can lead to mechanical interactions between the two, potentially compromising cladding integrity. TRANSURANUS provides various important parameters to assess the behavior of nuclear fuel under different operating conditions. We have obtained key parameters and compared them under both normal and load-following operating conditions. Some of the key parameters extracted and compared for slice/node 6 (located at the middle of the fuel rod) between normal and load-following operation cases include cladding hoop stress, permanent tangential cladding strain, fuel centerline temperature, and fractional fission gas release. These parameters were plotted against rod average burnup for both cases and are presented in Figure 3.
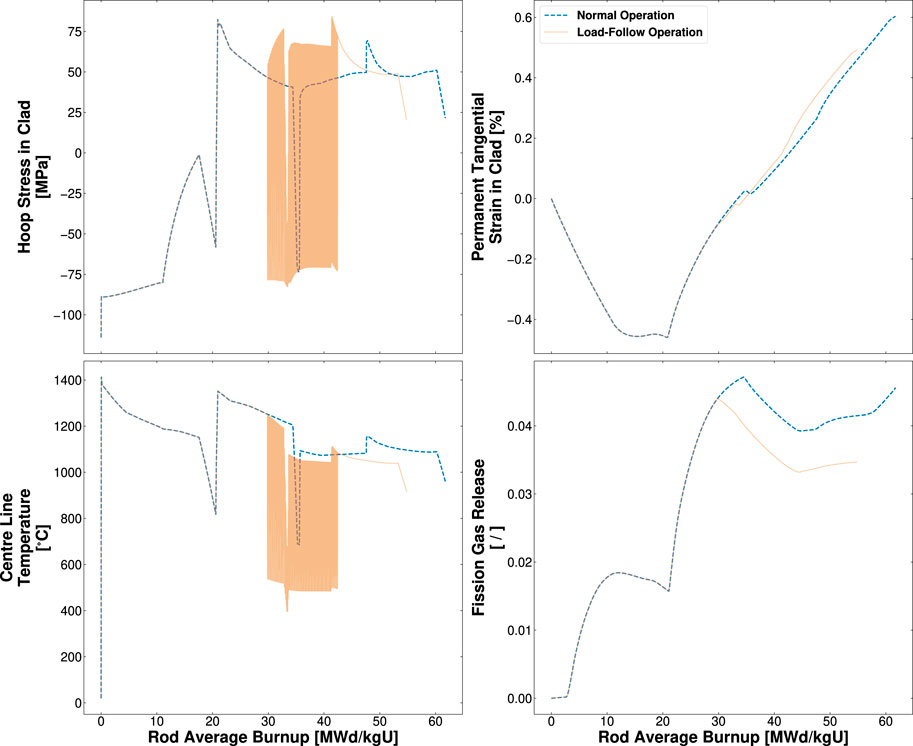
Figure 3. Some fuel performance parameters are compared in normal and load-following operation cases with respect to rod-average burnup. The extracted parameters correspond to slice/node 6, located at the middle of the fuel rod. The end-of-life burnup is reduced in the load-following operation case as a result of repeated low-power operation.
The rod average burnup is lower in the load-following operation case as the reactor operates at low power for a prolonged duration. Comparison of fuel performance parameters shows that the maximum values during load-following operation were either comparable to or lower than those observed under normal operation, with all values remaining well within the defined safety margins (NRC, 1987). However, for the load-following operation case, TRANSURANUS also outputs cracks in the cladding, the lengths of which are calculated using the SPAKOR subroutine. These cracks are initiated as a result of pellet–cladding interaction–stress corrosion cracking (PCI–SCC). In the subroutine, crack initiation and growth are calculated based on the model proposed by Jernkvist (2005), but with an improved correlation for the critical stress intensity factor, as proposed by Jernkvist (2005). According to Mattas et al. (1979), crack initiation results from the chemical attack of iodine and progresses independently of applied stress, as described in Equation 1a, until a critical stress intensity factor,
where
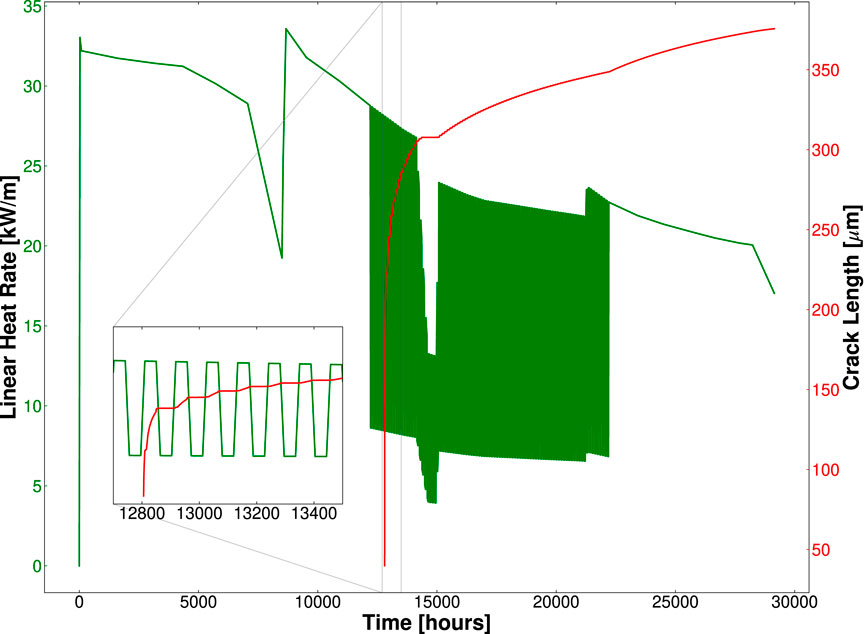
Figure 4. Crack growth in the cladding at slice/node 6, calculated using the SPAKOR subroutine of TRANSURANUS. A crack initiates once certain conditions are met and subsequently propagates based on the model parameters.
The same load-following signal was applied to 50 different power histories. A few parameters from each case of load-following operation and the corresponding normal operation were compared to assess whether the same trend persists across all cases or if there are any deviations. In Figure 5, the maximum cladding hoop stress (left) and the maximum fuel centerline temperature (right) are shown for both the load-following and corresponding normal operation cases across all 50 power histories, plotted at a rod average burnup level of 42 MWd/kgU. No deviation appears in any of the cases. Additionally, PCI–SCC crack propagation is observed in all 50 cases, as shown in Figure 6. In some cases, the maximum crack length is equal to the cladding thickness.
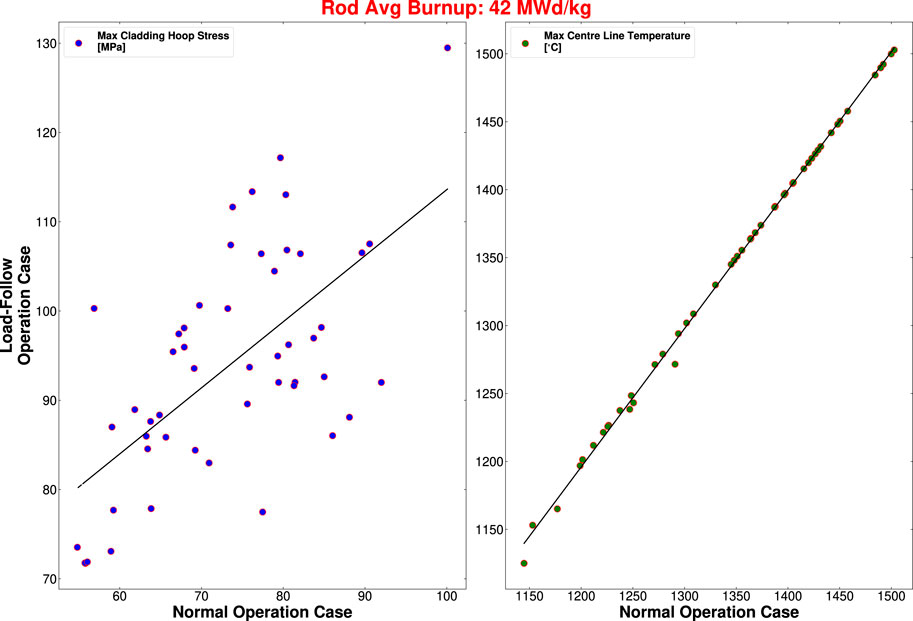
Figure 5. The load-following scheme from Table 2 was applied to 50 different power history profiles to confirm that results are not limited to a single case (illustrated in Figure 3). Two fuel performance parameters, maximum cladding hoop stress (left) and maximum fuel centerline temperature (right), were compared at 42 MWd/kgU between normal and load-following operation. Values under normal operation are plotted on the x-axis, and those under load-following on the y-axis. The near-linear trend indicates consistency across all power histories, showing that any profile could be used to study load-following effects.
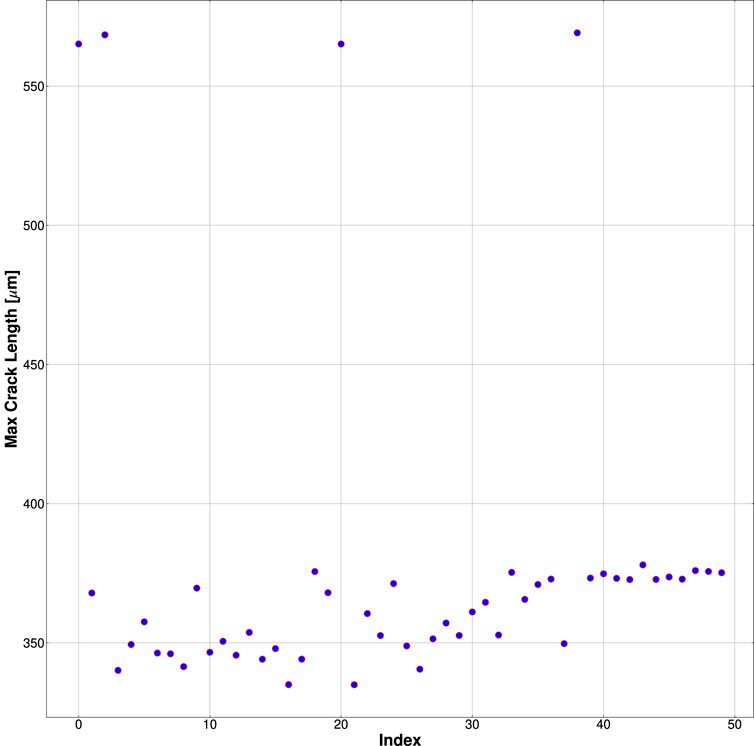
Figure 6. In all 50 power history profiles assessed under load-following operation, PCI–SCC cracks propagated in the cladding. The crack length is calculated from Equation 1, or Equation 2, depending on the prevailing conditions during the process. The maximum crack length for each profile is plotted, with the power history profile number (index) on the x-axis and the length in
Results from the sensitivity study on load-following signal parameters are presented in Figures 7–10. In both batches of the sensitivity study, comprising two different ranges of
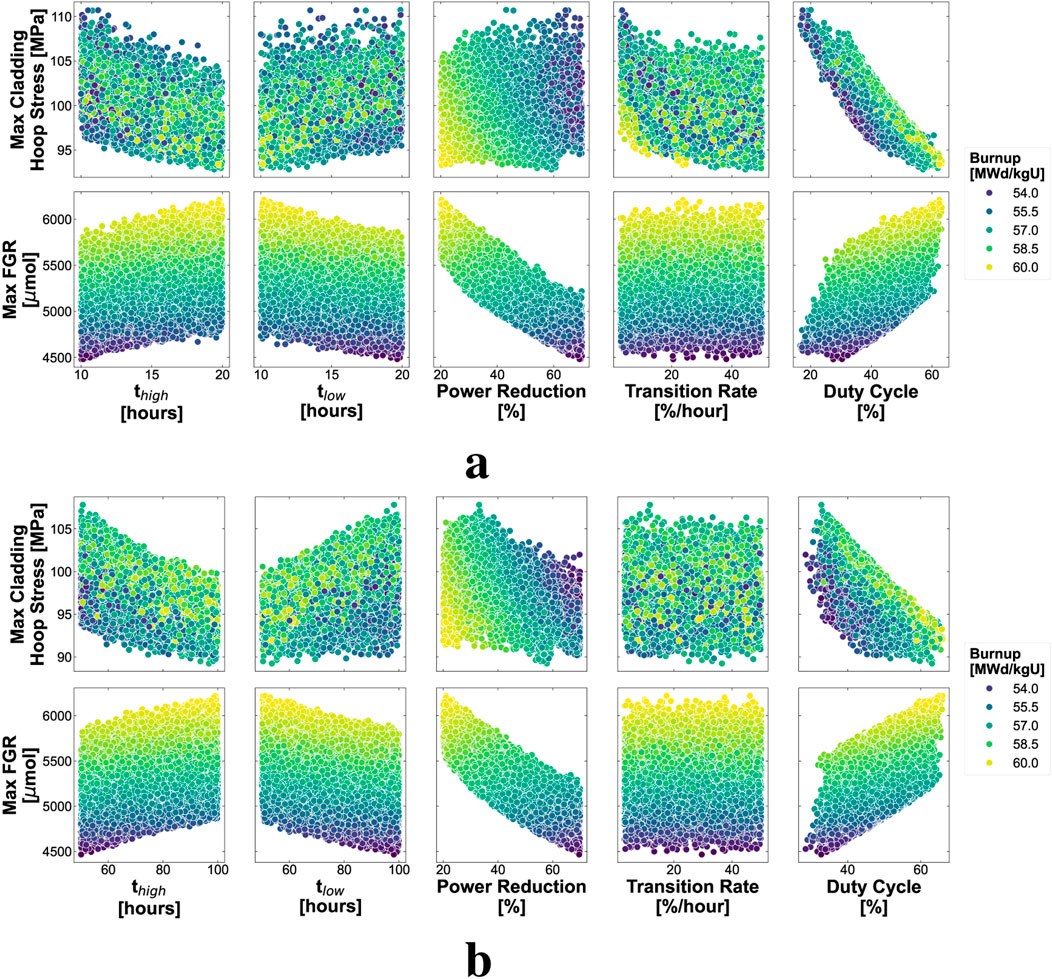
Figure 7. Scatterplot of two output variables (on the y-axes) versus five input/derived variables (on the x-axes). The circles are colored according to burnup values. Batch-1 (a), Batch-2 (b).
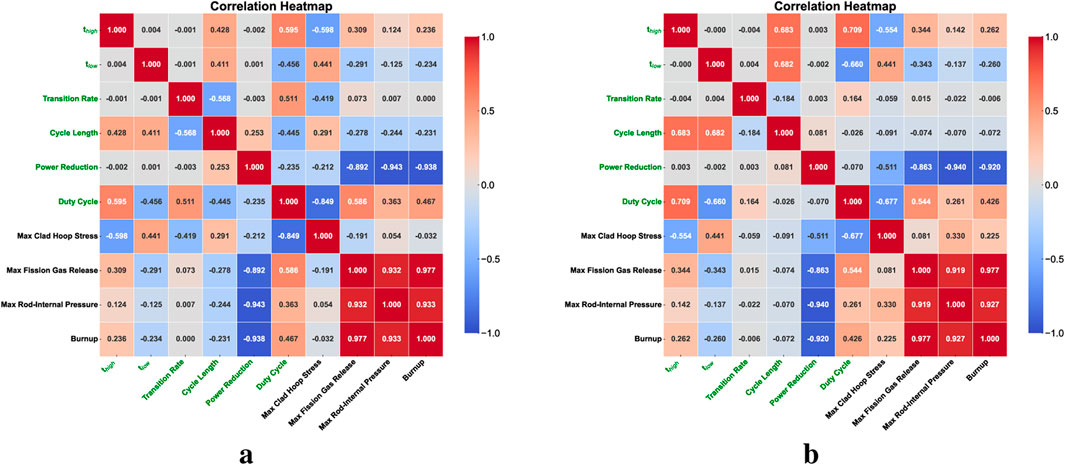
Figure 8. The correlation heatmaps between input/derived variables (labeled in green) and output variables (labeled in black). Batch-1 (a), Batch-2 (b).
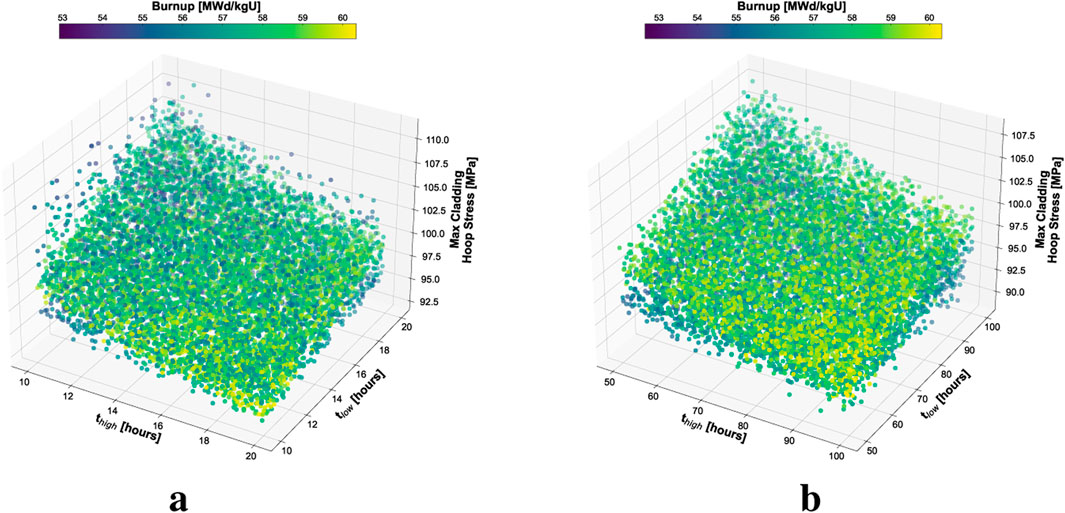
Figure 9. 3D scatterplot of maximum cladding hoop stress versus
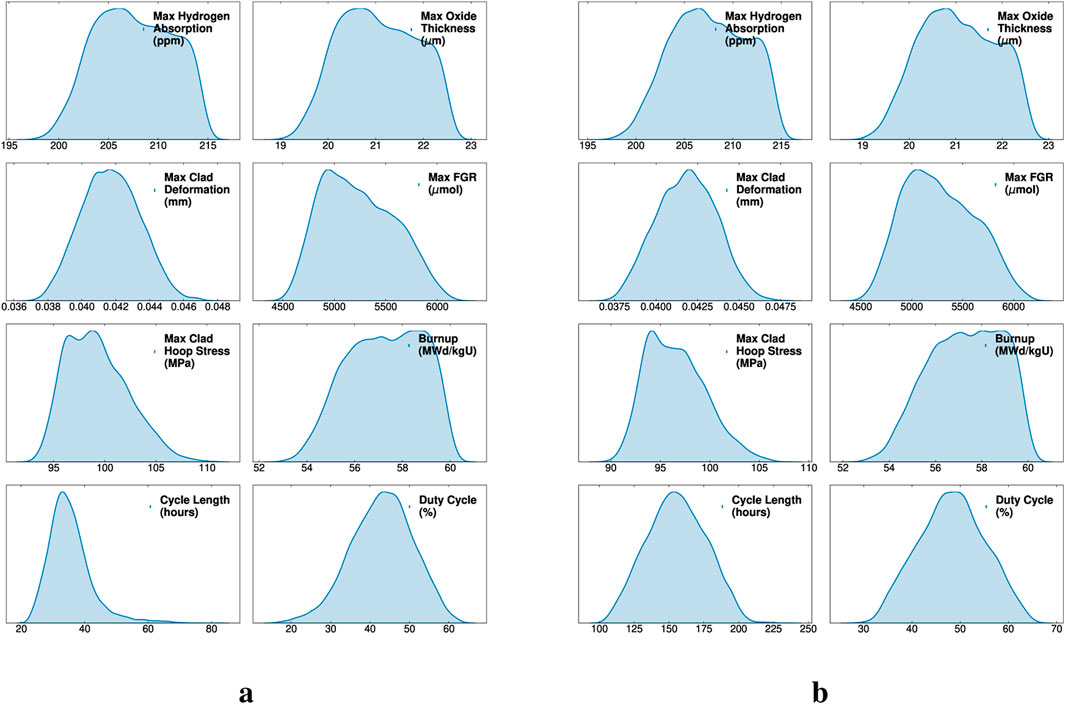
Figure 10. KDE plots for input (derived) variables (bottom row) and output variables (first three rows from the top). Batch-1 (a), Batch-2 (b).
To understand the correlation between input and output variables, correlation heatmaps were generated for both batches and are shown in Figure 8. The overall trend is similar in both batches. The transition rate has a small influence on the output variables in both cases; however, compared to Batch-1 (which has a shorter load-following cycle length), its influence on hoop stress is negligible in Batch-2 (which has a longer load-following cycle length). A 3D plot, as shown in Figure 9, illustrates the influence of
Figure 10 shows the kernel density estimate (KDE) plots for both batches, displaying all the extracted fuel performance parameters, including maximum cladding outer oxide thickness, maximum hydrogen absorption in the cladding, and maximum cladding deformation. The output quantities are plotted in the first three rows from the top, while the bottom rows display cycle length and duty cycle. The cycle length has an average value of 35 h for Batch-1 and 155 h for Batch-2.
4 Conclusions and discussion
In this study, we have attempted to assess the effects of hypothetically implemented load-following operation on PWR fuel performance using the fuel performance code TRANSURANUS. The primary objective was to evaluate the fuel performance of near-deployment SMRs, anticipating their participation in extensive load-following operations. However, conventional PWR fuel operating history was used in the study as it closely resembles some of the upcoming SMR designs, and no SMR operating history data were available. A parameterization of the load-following schemes was developed and applied to multiple PWR power operating histories. Variations in the load-following scheme were simulated by modifying these parameters, and fuel performance was assessed. Previous studies (Videm et al., 1979; von Jan and Hering, 1981; Sercombe et al., 2012; Billaux and Haas, 1982; Fischer et al., 1988; Aas, 1975) have extensively examined the effects of power cycling on fuel performance, but typically over shorter durations. However, the impact of prolonged power cycling throughout the power history, along with variations in the load-following scheme, has not been thoroughly investigated. In addition, it is not practical to experimentally test fuel behavior under a wide range of different load-following operating conditions. Therefore, studying these effects using fuel performance codes becomes essential, making our work particularly relevant in this context.
Based on the simulation results from the TRANSURANUS code, we conclude that, apart from the cladding cracks discussed below, load-following operation does not have any adverse effects on fuel behavior, as indicated by the evaluated fuel performance parameters. Similar observations have also been made in Lokhov (2011), and nuclear power plants in Germany and France operate in load-following mode (Lokhov, 2011) with strong operational flexibility. However, many phenomena, either individually or in combination, influence fuel rod behavior, and some may be probabilistic in nature. The sensitivity study reveals that variations in the parameters of the load-following signal have distinct impacts on fuel performance. Although certain parameters, such as
No abnormal fuel behavior was observed in simulated load-following operation cases, apart from the occurrence of cladding cracks, which appeared in nearly all cases. However, the PCI–SCC model, SPAKOR, implemented in TRANSURANUS is highly questionable and cannot be relied upon to draw any firm conclusions. The model functions as a stand-alone component and neither receives nor provides feedback to other models within TRANSURANUS. In the past (Pastore et al., 2009; Rozzia et al., 2011), its predictions have been compared with data from ramp experiments, with cladding failure correctly predicted in only 50% of the cases. Therefore, further development and improvements of the PCI–SCC model are essential for reliable predictions of cladding cracks and failures in load-following operation. There is thus an identified need to improve and validate the models for PCI–SCC, which is of importance for the wider utilization of load-following operation.
Data availability statement
The raw data supporting the conclusions of this article will be made available by the authors, without undue reservation.
Author contributions
VR: Visualization, Formal Analysis, Data curation, Methodology, Writing – review and editing, Software, Investigation, Writing – original draft, Conceptualization. PB: Software, Conceptualization, Methodology, Supervision, Investigation, Writing – review and editing, Resources, Formal Analysis. GR: Writing – review and editing, Resources, Formal Analysis, Software, Data curation, Methodology, Investigation, Conceptualization. MJ: Resources, Writing – review and editing, Software, Methodology, Investigation, Supervision. PA: Project administration, Methodology, Conceptualization, Supervision, Writing – review and editing, Funding acquisition, Resources.
Funding
The author(s) declare that financial support was received for the research and/or publication of this article. This work has been financially supported by the Swedish Energy Agency under project number 52680-1.
Acknowledgments
This work has been carried out within the framework of the ANItA collaboration.
Conflict of interest
Author PB was employed by Vattenfall Nuclear Fuel AB. Author MJ was employed by Westinghouse Electric Sweden AB.
The remaining authors declare that the research was conducted in the absence of any commercial or financial relationships that could be construed as a potential conflict of interest.
Generative AI statement
The author(s) declare that no Generative AI was used in the creation of this manuscript.
Any alternative text (alt text) provided alongside figures in this article has been generated by Frontiers with the support of artificial intelligence and reasonable efforts have been made to ensure accuracy, including review by the authors wherever possible. If you identify any issues, please contact us.
Publisher’s note
All claims expressed in this article are solely those of the authors and do not necessarily represent those of their affiliated organizations, or those of the publisher, the editors and the reviewers. Any product that may be evaluated in this article, or claim that may be made by its manufacturer, is not guaranteed or endorsed by the publisher.
References
Aas, S. (1975). The effects of load-following operation on fuel rods. Nucl. Eng. Des. 33, 261–268. doi:10.1016/0029-5493(75)90025-4
Adams, B. M., Bohnhoff, W. J., Dalbey, K. R., Ebeida, M. S., Eddy, J. P., Eldred, M. S., et al. (2023). Dakota 6.19.0 documentation. Technical report SAND2023-13392O. Albuquerque, NM: Sandia National Laboratories.
Ahn, S. H., Hyun, J. H., Choi, J. H., Lee, S. G., Kim, G. G., Bhang, B. G., et al. (2023). Load-following operation of small modular reactors under unit commitment planning with various photovoltaic system conditions. Energies 16, 2946. doi:10.3390/en16072946
Billaux, M., and Haas, D. J. (1982). Parametric calculations of load follow effects on fuel behaviour. IAEA, 104–115.
Carlson, L., Miller, J., and Wu, Z. (2022). Implications of HALEU fuel on the design of SMRs and micro-reactors. Nucl. Eng. Des. 389, 111648. doi:10.1016/j.nucengdes.2022.111648
Fischer, G., Sontheimer, F., Ruyter, I., and Markgraf, J. (1988). Experiments on the load following behaviour of PWR fuel rods. Nucl. Eng. Des. 108, 429–432. doi:10.1016/0029-5493(88)90231-2
Genglei, X., Minjun, P., and Xue, D. (2014). Analysis of load-following characteristics for an integrated pressurized water reactor. Int. J. Energy Res. 38, 380–390. doi:10.1002/er.3053
Håkansson, A. (2024). ANItA – a new Swedish national competence centre in new nuclear power technology. Nucl. Eng. Des. 418, 112871. doi:10.1016/j.nucengdes.2023.112871
IAEA (1987). “Power ramping, cycling and load following behaviour of water reactor fuel,” in Proceedings of a technical committee meeting held in Lyon, France.
IAEA (2021). Progress on pellet–cladding interaction and stress corrosion cracking. Text. Vienna, Austria: International Atomic Energy Agency. Progress on Pellet–Cladding Interaction and Stress Corrosion Cracking.
Ikonen, T. (2016). Comparison of global sensitivity analysis methods – application to fuel behavior modeling. Nucl. Eng. Des. 297, 72–80. doi:10.1016/j.nucengdes.2015.11.025
Ikonen, T., and Tulkki, V. (2014). The importance of input interactions in the uncertainty and sensitivity analysis of nuclear fuel behavior. Nucl. Eng. Des. 275, 229–241. doi:10.1016/j.nucengdes.2014.05.015
Jernkvist, L. O. (2005). PCI failure criteria for liner and non-liner fuel rods, intended for the STAV7 code. Tech. Rep. Tr. 05-001, Quantum Technol. Ab. Upps. Swed.
Lassmann, K. (1992). TRANSURANUS: a fuel rod analysis code ready for use. J. Nucl. Mater. 188, 295–302. doi:10.1016/0022-3115(92)90487-6
Lassmann, K., and Blank, H. (1988). Modelling of fuel rod behaviour and recent advances of the transuranus code. Nucl. Eng. Des. 106, 291–313. doi:10.1016/0029-5493(88)90292-0
Magni, A., Del Nevo, A., Luzzi, L., Rozzia, D., Adorni, M., Schubert, A., et al. (2021). “Chapter 8 - the TRANSURANUS fuel performance code,” in Nuclear power plant design and analysis codes (woodhead publishing). Editors J. Wang, X. Li, C. Allison, and J. Hohorst (Woodhead Publishing Series in Energy), 161–205. doi:10.1016/B978-0-12-818190-4.00008-5
Mattas, R. F., Yaggee, F. L., and Neimark, L. A. (1979). “Iodine stress-corrosion cracking in irradiated zircaloy cladding,” in American nuclear society topical meeting on light water reactor fuel. IL (USA): Portland, Oregon: Argonne National Lab.
McKay, M. D., Beckman, R. J., and Conover, W. J. (1979). A comparison of three methods for selecting values of input variables in the analysis of output from a computer code. Technometrics 21, 239–245. doi:10.2307/1268522
Nea, O. (2024). “Benchmark study on pellet-cladding mechanical interaction in light water reactor fuel (volume I),” in Hypothetical beginning-of-life power ramps (cases 1 and 2). Tech. rep. Paris: OECD Publishing.
NRC (1987). Standard review plan for the review of safety analysis reports for nuclear power plants. Tech. Rep. NUREG-0800, U. S. Nucl. Regul. Comm.
Park, K., Park, T., Zee, S. K., and Koo, B. S. (2023). Control rod driven long-term load-follow operation in small modular reactor. Ann. Nucl. Energy 182, 109620. doi:10.1016/j.anucene.2022.109620
Pastore, G., Botazzoli, P., Di Marcello, V., and Luzzi, L. (2009). Assessment of the prediction capability of the TRANSURANUS fuel performance code on the basis of power ramp tested LWR fuel rods.
Rozzia, D., Adorni, M., Del Nevo, A., and D’Auria, F. (2011). Capabilities of TRANSURANUS code in simulating power ramp tests from the IFPE database. Nucl. Eng. Des. 241, 1078–1086. doi:10.1016/j.nucengdes.2010.04.027
Sercombe, J., Aubrun, I., and Nonon, C. (2012). Power ramped cladding stresses and strains in 3D simulations with burnup-dependent pellet–clad friction. Nucl. Eng. Des. 242, 164–181. doi:10.1016/j.nucengdes.2011.08.069
Sowder, A., Bernhoft, S., and Moneghan, D. (2020). “Expanding the concept of nuclear flexibility for the current fleet and the next generation of advanced reactors,” Tech. Rep. Golden, CO: NREL Technical Report.
Van Uffelen, P., Hales, J., Li, W., Rossiter, G., and Williamson, R. (2019). A review of fuel performance modelling. J. Nucl. Mater. 516, 373–412. doi:10.1016/j.jnucmat.2018.12.037
Videm, K., Lunde, L., Hollowell, T., Vilpponen, K., and Vitanza, C. (1979). Cracking of cladding tubes caused by power ramping and by laboratory stress corrosion experiments. J. Nucl. Mater. 87, 259–267. doi:10.1016/0022-3115(79)90562-2
von Jan, R., and Hering, W. (1981). Experience and plans with PCI protection in KWU LWR plants. Nucl. Eng. Des. 65, 313–318. doi:10.1016/0029-5493(81)90096-0
Keywords: load-following operation, fuel performance, small modular reactors, TRANSURANUS, pellet–cladding interaction–stress corrosion cracking (PCI-SCC), DAKOTA
Citation: Rathore V, Blair P, Robertson G, Jonson M and Andersson P (2025) Study of the impact of load-following operation on light water reactor fuel performance using the TRANSURANUS code. Front. Energy Res. 13:1623060. doi: 10.3389/fenrg.2025.1623060
Received: 05 May 2025; Accepted: 09 September 2025;
Published: 30 October 2025.
Edited by:
Turgay Korkut, Sinop University, TürkiyeReviewed by:
Xiang Wang, Harbin Engineering University, ChinaHusam Khalefih, King Fahd University of Petroleum and Minerals, Saudi Arabia
Copyright © 2025 Rathore, Blair, Robertson, Jonson and Andersson. This is an open-access article distributed under the terms of the Creative Commons Attribution License (CC BY). The use, distribution or reproduction in other forums is permitted, provided the original author(s) and the copyright owner(s) are credited and that the original publication in this journal is cited, in accordance with accepted academic practice. No use, distribution or reproduction is permitted which does not comply with these terms.
*Correspondence: Vikram Rathore, dmlrcmFtLnJhdGhvcmVAcGh5c2ljcy51dS5zZQ==