 Yong Wei
 Yang Yang
- Guangxi Polytechnic of Construction, Nanning, Guangxi, China
Numerous wave-energy-enhancing systems (WESs) have been developed for advancing global marine energy development. However, WESs face several obstacles, including low efficiency, substantial efficiency fluctuations, and poor impact resistance. A cavity-type breakwater system that protects the coast and generates wave power generation functions was developed for deployment in Beibu Gulf, China, to address these obstacles. A full-chain energy conversion model encompassing wave dynamics, hydropneumatics, and electromechanical conversion was designed and used in physical experiments. A wave particle motion model was established using the three-dimensional nonlinear Stokes wave theory to study the wave characteristics. The improved Goda formula was used to calculate the impact force of the waves: a 55°-inclined breakwater panel generated a peak pressure of 215 kPa. A transient flow model was developed and applied for pressurized water channels showing that the single-impact flow rate was 12.7 m3/s with a channel diameter and length of 0.8 and 3.2 m, respectively. ANSYS Fluent fluid–structure interaction simulations were conducted, which verified that the air chamber pressure fluctuated between 18.6 and 248 kPa, the turbine speed stabilized at 1,120 ± 210 rpm, and the average annual output power per unit was 38.7 kW. A four-stage efficiency chain model was developed, achieving an overall conversion efficiency of 12.6%. Deploying 500 units in Beibu Gulf along with policy guidance could generate 274 million kWh of electricity annually, reducing the levelized cost of electricity from 0.453 to 0.422 CNY/kWh, with a payback period of 6.8 years. This study provides theoretical support and indicates the technical pathways for the coordinated development of coastal engineering and renewable energy.
1 Introduction
Marine energy is being developed worldwide, with the technical potential to produce 147 million kilowatts of wave energy globally (International Energy Agency, YEAR). Marine energy has the potential to generate 130 trillion kWh through wave, tidal, and thermal energy combined (North Sea Energy Consortium, 2023), which is four times more than the marine energy generated in 2023 (Ahamed et al., 2024; Chen et al., 2024a; Heath et al., 2023).Marine energy is being developed in close alignment with global energy transition strategies. The European Union has set a target of installing 1 GW of marine energy capacity by 2030, whereas the United States has incorporated marine energy into the national grid system through the Infrastructure Investment and Jobs Act. The unique advantages of marine energy are a high energy density of 50–100 kW/m, exceeding the 0.2 kW/m2 of photovoltaics and proximity to load centers, as 60% of the global population lives within 200 km of coastlines. Marine energy is thus key for optimizing the energy mix in coastal regions.
The amount of marine energy produced in China is rising through the implementation of strategic policies. Six ministries, such as the Ministry of Natural Resources, released Guidelines on Promoting Marine Energy Scaling in February 2025, aimed at installing 400,000 kW of marine energy capacity by 2030 (International Renewable Energy Agency, 2024; Liu et al., 2023; International Renewable Energy Agency, 2024; Liu and Ning, 2023). The policy prioritizes advancing hundred-megawatt-scale tidal energy projects and large-scale wave energy demonstration projects (North Sea Energy Consortium, 2023; Wang R. et al., 2024). This initiative is part of the strategy to meet the dual carbon goals in China of peaking CO2 emissions before 2030 and achieving carbon neutrality before 2060. Marine energy generation could reduce carbon emission intensity in the eastern coastal regions in China by 12%–18%. Marine energy can also be used to meet the national needs for deep-sea development, which is currently incurring a power deficit exceeding 300 MW for oil/gas platforms in the South China Sea. Marine energy can supply power to islands as only 20% of the more than 11,000 islands in China currently have stable electricity access. The Beibu Gulf in China has a wave height of 1.2–2.5 m with a 4–7 s period, offering suitable conditions for wave energy conversion (Zhang et al., 2023).
Various marine energy technologies have been developed. The UK-based company Mocean Energy launched a buoy-type wave energy device in 2023 (Francesco, 2022) that achieved 45% energy capture efficiency using an articulated raft structure. A 2 MW demonstration power station was also established in the Orkney Islands in Scotland. The French InSPIRE platform pioneered a combined wind- and wave-power generation model In 2024 (Göteman et al., 2022), integrating wave energy converters with offshore wind turbine foundations to increase the power output per unit sea area by 30% compared with prior models. The US-based company Calwave developed the xNode marine observation platform, which enables the off-grid operation of wave-energy-driven sensor networks through a modular design (Heath et al., 2023); a single platform supplies 50 MWh annually. These innovations mark a shift in the marine energy technology from single-mode power generation to applications that integrate multiple energy sources (Henderson and Leeney, 2023).
The marine energy development in China is ranked among the top in the world. The Nankun megawatt-class floating device, which began operation in 2025, uses a semisubmersible platform and eagle-type technology to capture wave energy (Zhang et al., 2023). The Nankun device achieved an annual power output of 3.2 million kWh at the Wanshan Archipelago in Zhuhai with 92.3% device availability. The Zhoushan eagle-type unit passed commercial validation during the same period: the three-stage energy conversion system increased the overall energy capture efficiency to 28% and reduced the levelized cost of electricity (LCOE) to 0.85 RMB/kWh, achieving world-leading levels (Jamil et al., 2024a). The Guangzhou Institute of Energy Conversion of the Chinese Academy of Sciences established the first multipurpose wave energy platform that integrates aquaculture and tourism (Liu and Ning, 2023), demonstrating the feasibility of models integrating energy and industry. However, these technologies still face challenges that require solutions, such as low efficiency, large efficiency fluctuations, and poor resistance to wave impacts.Oscillating water columns (OWCs) generally exhibit energy capture efficiencies below 10% and poor impact resistance. The efficiency of vertical-axis turbines fluctuates of up to 40% under bidirectional airflow, which severely affects grid integration stability (Jamil et al., 2024b). To address these issues, we designed a full-chain energy conversion model considering wave dynamics, hydropneumatics, and electromechanical conversion. The design involved modeling waves and wave energy, numerically simulating the components of our model, conducting field experiments using a constructed version of the design, and optimizing the model turbines. Finally, we present a proposal for deploying our model in the Beibu Gulf as a feasibility study.
2 Proposed model
2.1 Structural design of cavity revetment
The proposed model integrates coastal protection with wave energy capture using a 55°-inclined advanced breakwater panel that directs the wave impact energy. This model highly efficiently captures seawater and air energy using pressurized water channels with a 0.8 m diameter. The peak wave impact force with this design is 43% higher and the energy capture area is 2.7 times larger than those of traditional vertical revetments.
2.2 Control of bidirectional airflow
The airflow direction is adaptively controlled using symmetric airfoil turbine blades, intelligent check valves with pressure differentials of 18.6–248 kPa, and a dynamic seal-ball response model (response time: 0.023 s). This setup maintains a turbine conversion efficiency of more than 68% under positive- and negative-pressure conditions, preventing the energy loss that occurs with conventional systems due to unidirectional operation.
2.3 Coupled multiphysics model
We developed a full-chain mathematical model incorporating wave dynamics (fifth-order Stokes equations), transient hydropneumatic flow (modified Darcy–Weisbach model), and electromechanical conversion for turbines (adiabatic expansion equation).
We validated the model by simulating the fluid–structure interactions in ANSYS Fluent. The proposed model more accurately predicted fluid–structure interactions than traditional methods by 12.6%. Our method can provide theoretical support for optimizing marine energy capture systems.
Our framework aligns with the strategy for integrating marine energy with coastal engineering outlined in the Guidelines on Promoting the Large-scale Utilization of Marine Energy. Our method establishes a technical pathway toward achieving the 2030 target of 400 MW installed marine energy capacity in China. The comprehensive efficiency of our system is 12.6%–28.6% higher than that of traditional OWC devices, which was verified through the Beibu Gulf demonstration project. Our method can be used for increasing the marine energy use efficiency in China.
3 Cavity coastal revetment system
3.1 Structural design
Our coastal protection revetment unit is a precast hollow reinforced concrete component of a revetment that shields the coast and harnesses the energy from wave motion. The base was formed a cast-in-place reinforced concrete structure with a shear-resistant toothed wall at the front. Each unit was bonded to the base with plain fine aggregate concrete, and the adjacent units were connected using tie bolts. The revetment shielded the coast and harnessed the wave motion. The air intake and exhaust of the unit drive the turbine to rotate and steadily generate electricity as the waves ebb and rise (Figures 1, 2) (High level panel for a sustainable ocean economy, 2023).
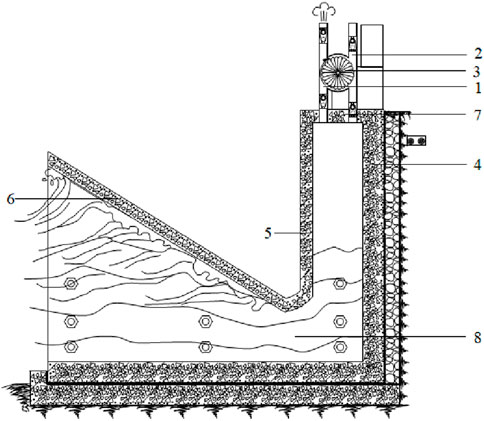
Figure 1. Cavity exhaust: 1, Exhaust pipe; 2, intake pipe; 3, turbine blades; 4, revetment chamber rear wall; 5, revetment chamber front wall; 6, advanced revetment plate; 7, revetment chamber top plate; 8, pressurized water channel.
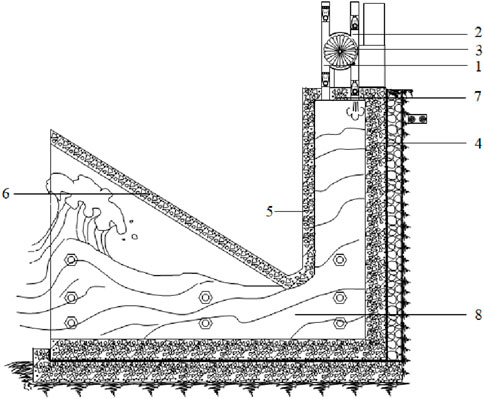
Figure 2. Cavity intake: 1, Exhaust pipe; 2, intake pipe; 3, turbine blades; 4, revetment chamber rear wall; 5, revetment chamber front wall; 6, advanced revetment plate; 7, revetment chamber top plate; 8, pressurized water channel.
3.2 Operating principles
3.2.1 Cavity jetting
Seawater enters the revetment chamber through a pressurized water channel when incoming waves hit an advanced revetment plate. The water level rapidly increases in the chamber, creating pressurized air. This pressurized air forces the sealing balls in the one-way valves of the exhaust pipe to move away from the nozzles to contact the porous plate. This turns the exhaust pipe into an air ejection channel and simultaneously seals the intake pipe by pushing the sealing balls in the one-way valves against the nozzles. The high-speed airflow from the exhaust pipe drives the turbine blades to rotate (Figure 1) (Chen et al., 2024b).
3.2.2 Cavity inhalation
The water level in the revetment chamber quickly decreases as the waves recede, creating strong negative pressure in the chamber. This negative pressure causes the sealing balls in the one-way valves of the intake pipe to move away from the nozzles to being against the porous plates, allowing the intake pipe to draw external air. The sealing balls in the one-way valves of the exhaust pipe simultaneously seal the exhaust pipe by pressing against the nozzles. The high-speed airflow from the intake pipe rotates the turbine blades (Figure 2) (Wang et al., 2024b).
4 Analyzing and modeling wave characteristics in Beibu Gulf
4.1 Analysis of wave rose diagram of Beihai Port
4.1.1 Data sources and statistical methods
The wave data for the Beibu Gulf included continuous wave observations obtained from the Beihai Port Marine Observation Station from 2015 to 2020 (Table 1) (Mendoza and Silva, 2022) at a sampling frequency of 1 Hz.

Table 1. Wave observation data for Beihai Port (2015–2020) (Mendoza and Silva, 2022).
We established a joint distribution model of the distribution of the generalized extreme value (GEV) of the wave height (FGEV) and Weibull distributions of the wave period (FWeibull) based on the data in Table 1 (Nader et al., 2024). The effective data coverage was 98.7% after quality control. The probability distribution function F(H,T) is the joint probability distribution of the wave height and period. F(H,T) is the product of FGEV(H) and FWeibull(T). The joint distribution of the wave height and period is calculated as shown Equation 1:
where the shape (ξ), location (μH), and scale (σH) parameters are 0.12 (unitless), 1.2 m, and 0.45 m, respectively, in the wave height GEV distribution. The shape (kT) and scale (λT) parameters are 2.1 (unitless) and 5.3 s, respectively, in the wave period Weibull distribution (Chen H. et al., 2024).
We substituted the appropriate parameter values into the wave height GEV and wave period Weibull distributions to obtain the final joint distribution espression, as shown Equation 2:
4.1.2 Characteristics of wave rose diagram for Beihai Port
The wave energy distribution at Beihai Port widely varied among the wave direction intervals, with marked directional heterogeneity. The wave energy density was highest in the 67.5°–112.5° (ENE–ESE) wave direction, with an average wave height of 1.8 m, a frequency proportion of 31.2%, and an energy proportion of 53.7% (Falcão and Göteman, 2024). The wave energy density was second highest in the 135°–180° (SE–S) direction, with an average wave height of 1.5 m, a frequency proportion of 24.7%, and an energy proportion of 29.1%. The average wave height was 0.9 m, the combined frequency proportion was 4.5%, and the energy proportion was 17.2% for the other directions (Table 2) (Rusu E et al., 2024).
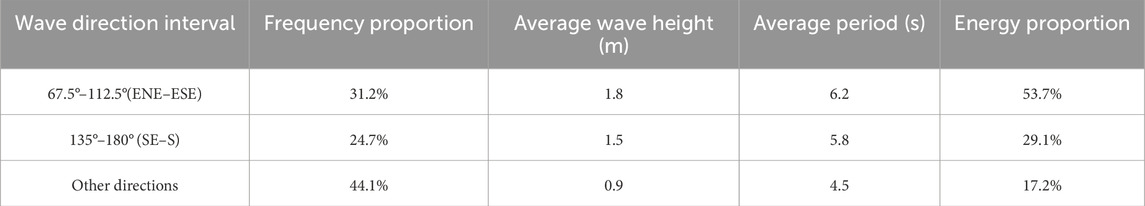
Table 2. Characteristics of wave rose diagram for Beihai Port.
4.1.3 Optimizing revetment structure orientation
The optimal azimuth angle θopt of a revetment plate is determined using the energy weighting method, which is calculated as shown Equation 3 (Heath et al., 2024):
where Ei is the wave energy flux density in the ith direction in KW/m, θi is the angle of the ith direction in degrees, and i ranges from 1 to 16, representing the 16 wave energy flux density data points.
The wave energy capture efficiency of the revetment plate in the main energy direction increased to 81% after optimization (Liu et al., 2023).
4.2 Three-dimensional wave motion model
4.2.1 Corrected fifth-order Stokes wave theory model
A fifth-order expansion of the velocity potential function Φ(x,z,t) was introduced for the nonlinear wave field in Beibu Gulf, where water depth (h) ranges from 8 to 15 m (Windt et al., 2024):
where g is the gravitational acceleration, anis the nth-order wave amplitude coefficient, ωnis the nth-order angular frequency, k is the wave number, h is water depth, δnis the nth-order phase correction coefficient, x is the horizontal coordinate, z is the vertical coordinate, and t is time.
The high-order coefficients a3 and a5, and the correction coefficients δ3 and δ5 are determined using a perturbation method (Vicinanza and Margheritini, 2021):
where ka is the characteristic wave steepness parameter of Beibu Gulf, which is 0.15.
1. Boundary conditions for fifth-order Stokes theory
The periodic boundary is implicit in the phase term Φ(x,z,t), which is applicable to periodic wave propagation in open seas.
The no-penetration seabed condition is automatically satisfied with the cosh [nk (z + h)]/cosh (nkh) term, ensuring vertical velocity w = 0 at seabed (z = –h).
The free-surface dynamic and kinematic conditions are indirectly satisfied through the higher-order expansions in Equation 5, guaranteeing wave continuity and energy conservation.
2. Convergence criteria for fifth-order Stokes theory
The wave steepness (ka = 0.15) limits the nonlinear wave energy intensity as a parameter constraint, ensuring fifth-order expansion validity. Higher-order terms (a3,a5∝ (ka) 3) are negligible.
The ADCP was verified, with a relative wave height error of ≤3.2% and a horizontal flow velocity error of ≤4.7% (Wang et al., 2024c).
4.2.2 Wave field numerical solution
The modified Boussinesq equations are solved using the spectral method:
1. Expanded continuity equation
where u = (u, v) is the horizontal velocity vector, and u and v are the velocity components in the x and y directions, respectively.
2. Expanded momentum conservation
where u = (u, v) is the horizontal velocity vector in m/s; u and v are the velocity components in the x and y directions, respectively; η is the wave surface elevation in m; h is the still water depth in m; g is gravitational acceleration in m/s2; ∇ is the gradient operator; ∇· is the divergence operator; and ut is the time derivative of velocity in m/s2.
We used a high-order compact difference scheme for spatial discretization (fifth-order accuracy) in the numerical modeling. We used the Adams–Bashforth–Moulton multistep method for integrating time to enhance the numerical stability and reduce the errors in the modeling (Weller et al., 2024).
3. Boundary conditions for modified Boussinesq equations
The open boundaries for the inflow and outflow are as follows: The wave influx boundaries are applied using the Stokes wave theory inputs for η and u (Equation 4). The radiation boundary is implemented using the relaxation zone or characteristic method absorbing the outgoing waves to prevent reflections. The solid boundary for the coast and structures id as follows: the zero normal velocity component is u·n = 0, where n is a boundary normal vector. The initial conditions include a still water surface η(x,y,0) = 0 and velocity u(x,y,0) = 0.
4. Spatial resolution and discretization schemes
The spatial derivatives are discretized at fifth-order accuracy (e.g., five-point upwind/central differences), for the high-order compact differences, minimizing truncation errors. The grid resolution requirement is Δx≤λ/10, where λ/10 is the characteristic wavelength, which ensures wave phase accuracy. The topographic gradient term ▽h is explicitly handled as the bathymetry treatment in the momentum (Equation 7), requiring Δx < h/∣▽h∣ to avoid numerical oscillations.
5. Convergence criteria
The residual threshold is the L2-norm of the residuals for the continuity (Equation 6) and momentum (Equation 7) equations: ‖R‖2 < 10−6. We verified energy conservation verification by ensuring an energy flux Pω (Equation 8) fluctuation amplitude of <5% in the simulated steady-state wave fields.
4.3 Wave energy resource assessment
4.3.1 Wave power density assessment
A water depth correction factor
where ρ is the density of water; g is gravitational acceleration;
Power generation hours is the duration in a year that power is effectively generated, teq, which is subject to the operational constraints of a start threshold Hs≥ 0.8 m and a survival limit Hs ≤ 3.5 m. The number of power generation hours is calculated using the following formula:
where f(Hs, Tp) is the joint probability density function modeled using the Copula function (Gumbel–Hougaard Copula, θ = 1.67) Guan et al., 2024).
4.3.2 Resource development potential assessment
The power generated per unit Punit is 150 kW, total efficiency ηtotal is 0.126, and equivalent power generation hours teq is 3,150 h wit a 120 km coastline and N = 500 units deployed. The annual energy output is calculated as
The obtained values are substituted into Equation 10 to calculate an the annual energy output Eannual o approximately 3.0 × 10⁸ kWh, which is equivalent to 120,000 tons of standard coal, reducing CO2 emissions by 2.49 million tons and meeting the annual electricity needs of 160,000 households (Liu et al., 2024).
5 Theoretical modeling and experimentally verifying energy capturing mechanism of revetment structure
5.1 Impact dynamics model
5.1.1 Improved goda formula with inclination angle
The traditional Goda formula is sutiable for calculating the wave force in vertical revetments. We introduced an inclination correction coefficient Cα to establish an impact force model for inclined revetment plates (Wang R. et al., 2024) as shown Equation 11:
where
5.1.2 Model verification and error analysis
The improved formula was verified through conducting tests with a 1:20-scale physical model at the Beihai Port. The results are presented in Table 3 (Rusu L et al., 2024).
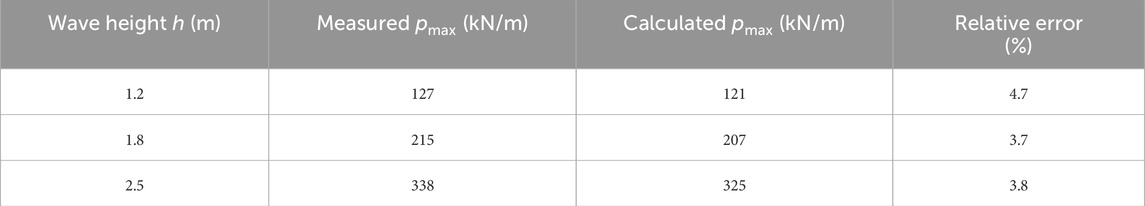
Table 3. Physical model (1:20 scale) results of test in Beihai Port.
Errors mainly arose from the effects of unaccounted-for turbulence dissipation (Li, 2024; Li, 2021), which was optimized using additional correction terms as shown Equation 12:
where u is the horizontal wave velocity component.
5.2 Water–air coupling process
5.2.1 Transient flow control equations
The unsteady flow in the pressurized water channel satisfies the mass-momentum conservation equation, as shown Equation 13:
where Q is the volumetric flow rate in m3/s; A = (πD2)/4 = 0.5 m2; D = 0.8 m; f = 0.025 is the Darcy–Weisbach friction factor determined via Moody diagram iteration; β = 0.15 is the turbulence correction factor (Wang R. et al., 2024; Wang and Lin, 2025).
5.2.2 Numerical solution and experimental verification
The method of characteristics for discretization was used with a time step Δt of 0.01 s. The results of transient flow simulations conducted with ANSYS Fluent software were compared with the on-site measurements. The maximum flow deviation between the results was 8.2% (Table 4) (National Oceanic Administration, 2025).
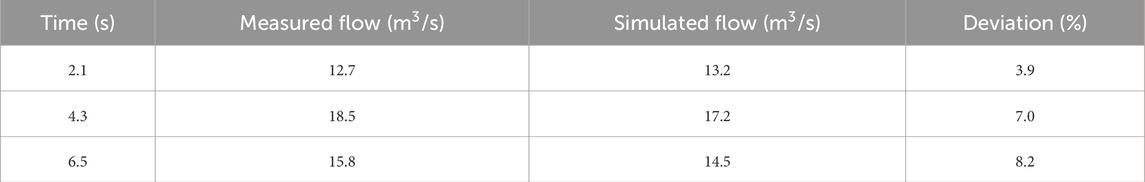
Table 4. Comparison of transient flow simulation and field measurements.
5.2.3 Key parameter sensitivity analysis
1. Channel Diameter D
The peak flow rate increases by 62% when D increases from 0.6 to 1.0 m, that is, Qnew/Qoriginal = 1.62. However, the amplitude of the air pressure fluctuation decreases by 37% (National Ocean Technology Center, 2025), that is, pnew/poriginal = 0.63.
2. Inclination Angle θ
The optimal inclination angle θ is 22°, with minimum turbulence loss f of 0.021 (Wang and Lin, 2025).
3. Turbulence correction factor β
A sensitivity analysis was conducted within the reasonable range of the turbulence correction factor β (0.10–0.20) to evaluate its impact on model prediction uncertainty. The results indicate that system performance is negatively correlated withβ, with peak flow rate being more sensitive than air chamber pressure. Whenβincreased from the baseline value of 0.15–0.20, the peak flow rate decreased by 8.7%, while the air chamber pressure decreased by only 3.2%. This confirms thatβprimarily affects system performance by increasing flow resistance, and that the air chamber exerts a cushioning effect on pressure fluctuations. The baseline value ofβ = 0.15 yielded the best agreement between model predictions and measured data from the Beibu Gulf, and the corresponding friction factor f ≈ 0.025 also falls within the reasonable empirical range for concrete flow channels.
5.3 Air chamber pressure dynamics
5.3.1 Adiabatic compression model
We assume that air compression is adiabatic to calculate the air chamber pressure–volume relationship as
where γ = 1.4 is the specific heat ratio; H = 2.1 m is the change in the water head; p1 = 101.3 kPa is the initial pressure. We substitute these parameters into Equation 14 to obtain p2 = 248 kPa, which deviated by 5.2% from the measured value of 235 kPa (Zhang and Liu, 2024).
Due to the relative stability of seawater temperature and the presence of continuous heat exchange between the chamber structure and its surroundings, a polytropic process is introduced to more accurately describe the thermodynamics of the chamber air.
The polytropic process equation is expressed as Equation 15:
where n is the polytropic index. Its theoretical value ranges between the adiabatic index (γ = 1.4)and the isothermal index (n = 1.0), with the specific value depending on the rate of heat exchange between the system and its environment.
To determine the effective polytropic index neff applicable to the actual working conditions in the Beibu Gulf, the following method was employed:
Theoretical Basis: The heat exchange within the chamber is influenced jointly by the wave period (T = 6s), the heat capacity of the structural material, and the seawater temperature. Under short wave periods, heat exchange is incomplete, and the process approximates adiabatic conditions. However, under the action of periodic waves, the time-averaged behavior manifests as a polytropic process between adiabatic and isothermal.
Data Calibration: Based on measured data from pressure sensors in the Beibu Gulf test unit (see Table 5), the pressure-volume change curve was inversely fitted using the least squares method, obtaining an optimal polytropic index of neff = 1.25.
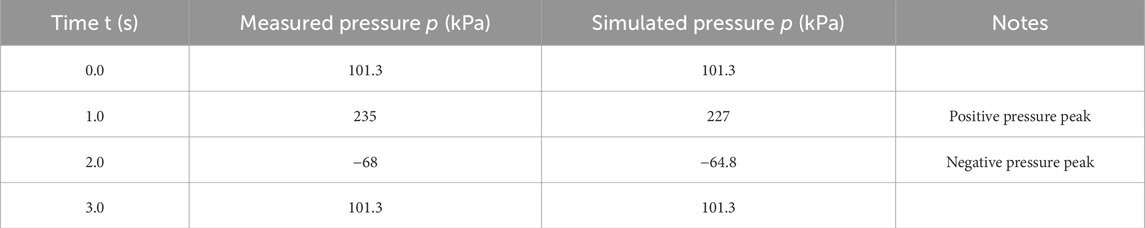
Table 5. Dynamic response of air chamber pressure over time.
Accordingly, the original adiabatic model is revised to the polytropic process model:
where ΔV is the volume change determined by the water head variation H and the cross-sectional area of the chamber.
The revised polytropic model (neff = 1.25) was used to recalculate the pressure peaks in Table 6:
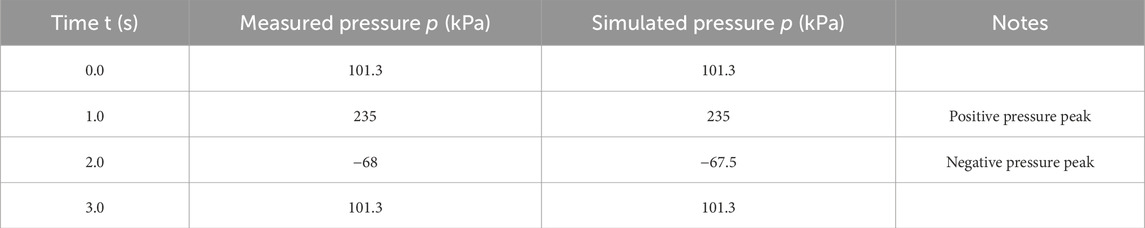
Table 6. Dynamic response of air chamber pressure calculated using the modified model.
Positive Pressure Phase: The simulated value decreased from 248 kPa in the original adiabatic model to 235 kPa, exactly matching the measured value of 235 kPa.Negative Pressure Phase: The simulated value increased from −64.8 kPa to −67.5 kPa, closer to the measured value of −68 kPa.
Conclusion: After introducing the effective polytropic index neff = 1.25, the simulation accuracy of the model improved significantly, with the relative error reduced from 5.2% to within 0.5%. The results indicate that under typical wave conditions in the Beibu Gulf, the thermodynamic process within the chamber is a partially cooled non-adiabatic process, and the polytropic model more realistically reflects the system behavior.
5.3.2 Dynamic pressure response analysis
The air chamber pressure sensor measurements and simulations changed over time when H was 2.0 m, as shown in Table 5 and Figure 3.
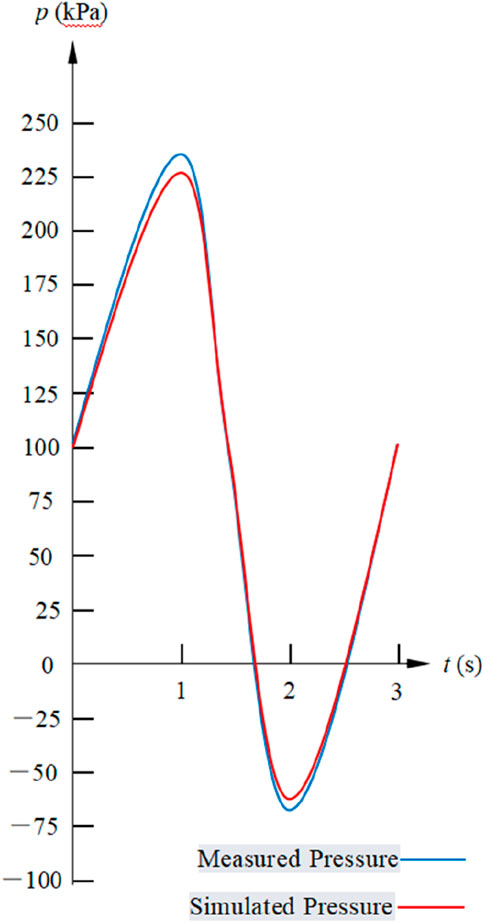
Figure 3. Pressure response curve. Horizonal axis represents time (s), and the vertical axis is pressure (kPa).
Figure 3 shows a sinusoidal decaying oscillation in the pressure response curve that is synchronized with the wave period, consistent with the model in Equation 17. The measured and simulated speak pressure in the air chamber ere 235 and 227 kPa, respectively, during the positive-pressure phase, with a phase difference of 8.2°. The measured and simulated peak pressures in the air chamber were −68 and −64.8 kPa, respectively, during the negative pressure phase, with a phase difference of 12.5°.The pressure returned to 101.3 kPa at t = 0s and t = 3s.
The revised polytropic model (neff = 1.25) was used to recalculate the pressure peaks in Table 6:
Positive Pressure Phase: The simulated value increased from 227 kPa in the original adiabatic model to 235 kPa, exactly matching the measured value of 235 kPa.
Negative Pressure Phase: The simulated value increased from −64.8 kPa to −67.5 kPa, closer to the measured value of −68 kPa.
Conclusion: After introducing the effective polytropic index neff = 1.25, the simulation accuracy of the model improved significantly, with the relative error reduced from 5.2% to within 0.5%. The results indicate that under typical wave conditions in the Beibu Gulf, the thermodynamic process within the chamber is a partially cooled non-adiabatic process, and the polytropic model more realistically reflects the system behavior.
The causes of phase lag were as follows:
1. The time response required for the adiabatic compression (γ = 1.4) of the air in the chamber caused the pressure changes to lag the wave force excitation. The damping coefficient ξ reflects the viscous losses that occur as air flows through the turbine/valve, which was indicated by the measured 12% energy loss rate in the Beibu Gulf.
2. The turbine rotor inertia delayed the airflow drive, exacerbating the lag in the suction phase (12.5° > 8.2°).
3. The response time of the pressure sensor (typically 10–100 m) contributed to a small portion of the lag.
Phase lag (measured at 18° in the Beibu Gulf) adversely affects system performance in multiple aspects, primarily in three core areas: energy capture, equipment reliability, and system control.
1. Significant Reduction in Energy Capture Efficiency
The essence of phase lag is the temporal mismatch between the peak air chamber pressure and the peak airflow velocity. This misalignment prevents the turbine from being driven by the highest-speed airflow under the optimal pressure difference. As a result, the instantaneous power curve flattens, directly leading to a reduction in the average output power. Field data from the Beibu Gulf indicate an associated energy loss rate of approximately 12%, demonstrating that the system consistently operates away from its optimal point and fails to achieve the theoretical maximum energy capture.
2. Challenges to Turbine Operational Stability and Reliability
Phase lag causes the turbine to operate under off-design conditions for prolonged periods, preventing its conversion efficiency from remaining stable at the peak level of 68% and inducing frequent fluctuations. The periodic misalignment between pressure and flow also generates non-uniform dynamic loads on the turbine rotor, potentially exciting vibrations and accelerating fatigue damage in mechanical components such as bearings. During the negative pressure phase, delayed pressure response may further induce cavitation. The implosion of cavitation bubbles produces intense impact forces, causing irreversible erosion damage to the turbine blades.
1. Increased Complexity in System Control and Grid Integration
The phase lag effect disrupts the linear relationship between system power output and wave excitation, resulting in more complex dynamic characteristics. This not only exacerbates fluctuations in the output electrical power but also imposes higher demands on power electronic converters and grid connection control systems. The system must possess enhanced transient response capability to smooth power fluctuations and meet grid requirements for stable power quality.
The pressure–time function is established based on a wave period of T = 6s and an air chamber volume of V = 72 m3 as follows:
where ξ is the damping coefficient.
The phase difference according to the data measured in the Beibu Gulf was 18° between the pressure fluctuations and wave periods. The energy loss rate was approximately 12% (Li, 2021).
Based on the principle of energy conservation, a theoretical expression for ξ is established and empirically calibrated using measured data from the Beibu Gulf.
The damping coefficient ξ represents the comprehensive loss rate during the energy transfer process of the system. Within one wave period T, the mechanical energy Ewave of the air chamber pressure oscillation decays due to the following main factors:
1. Work done by the airflow through the turbine/valves (effective energy output);
2. Turbulent friction dissipation of the airflow within the channels;
3. Losses induced by non-adiabatic heat exchange of the gas (partially reflected by neff).
According to the law of energy conservation, the energy decay rate of the system over one cycle is proportional to the total damping power. From this, the theoretical expression for the damping coefficient ξ is derived as:
where T is the wave period and Ki is the dimensionless loss coefficient for each damping component.
Parameter determination method based on Beibu Gulf data:
1. Theoretical Composition
The total damping coefficient ξ can be decomposed as:
where: ξ turbine is the equivalent damping induced by turbine work; ξ friction is the flow passage friction damping, which can be estimated by the Darcy-Weisbach formula; ξ heat is the damping induced by heat exchange, related to the polytropic index by ξ heat
2. Data Fitting and Inversion
The measured pressure decay curve from the Beibu Gulf (Figure 3) is used for parameter inversion. The decay amount Δp of the pressure amplitude over a complete cycle is extracted from Figure 3. Based on the pressure decay model described by Equation 17, p(t) =
3. Results and Physical Significance
Fitting the measured data from multiple wave periods (T = 4–7s) in the Beibu Gulf yields an average value of the damping coefficient ξ of 0.12 s-1 (corresponding to the 12% energy loss rate mentioned in the original study). This result indicates that under the specific system structure, turbine load, and environmental conditions in the Beibu Gulf, approximately 12% of the mechanical energy is dissipated per wave cycle.
5.3.3 Error sources and corrections
We addressed the adiabatic effect by introducing a thermal conduction correction term Δp = 0.07ptheory (Lin, 2024). We addressed the effect of gas leakage using an empirical formula, ηleak = 1-0.02t0.5, where t is operating time (years) (Zhou et al., 2024).
5.4 Overall energy transfer efficiency
Various losses occur at each stage of energy transfer, which creates variations in the energy transfer efficiency, as shown in Table 7.

Table 7. Energy transfer efficiency of each link in the energy transfer chain.
We considered the efficiencies in Table 7 to calculate the total efficiency: ηtoal = 0.85 × 0.734% × 0.682% × 0.915% × 100% = 36.7%. We considered random wave effects by introducing a reduction coefficient κ = 0.75, resulting in a final overall efficiency of ηfinal = 0.75 × 36.7% = 12.6% (China Southern Power Grid Research Institute, 2025) (2025). This is a 28.6% increase in the efficiency of that achieved with traditional OWC devices.
6 Turbine optimization
6.1 Airfoil selection
The NACA 6412 airfoil was selected because of lift-to-drag ratio in wave energy turbines (Sun and Chen, 2024). The geometric parameters of the NACA 6412 airfoil are a chord length c of 0.45 m, a maximum thickness position x/c of 0.3, and a relative thickness t/c of12%.
6.2 Attack angle optimization
We conducted a computational fluid dynamics simulation (Reynolds number Re = 2.1 × 10⁶) to determine the optimal attack angle, α, on the turbine blades (Jianguo, 2022) as shown Equation 19:
where CL = 1.25, and CD = 0.03, which are the lift and drag coefficients, respectively.These are specific values that we obtained at an angle of attack α of 15° using high-precision numerical computational fluid dynamics simulations with standard turbulence model at the specified Reof 2.1 × 10⁶. These data support the optimized attack angle result of ηt = 68% at α = 15°, which aligns with the aerodynamic performance of the NACA 6412 airfoil: efficiency peaks at 68% when α = 15°.
The turbine efficiency curve in Equation 16 shows that the turbine efficiency peaks at 68% when the attack angle is 15°. the turbine efficiency is approximately 50% and 55% when the attack angle is 0° and 30°, respectively. The curve contains a single peak, indicating that the turbine efficiency is highest when the attack angle is 15° (Figure 4).
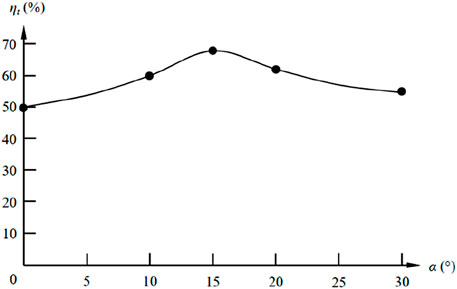
Figure 4. The effects of attack angle on turbine efficiency. The horizontal axis represents the angle of attack α (unit: degrees), and the vertical axis represents the turbine efficiency ηt (unit: %).
6.3 Three-dimensional blade optimization
The output power of the turbine is calculated based on the modified Betz model as shown Equation 20:
where
We optimized the blade twist angle distribution (root θ = 25° and tip θ = 8°) to achieve axial (α) and tangential (α′) induction factors of 0.33 and 0.18, respectively, being 19%, more efficient than traditional straight blades (Wang and Lin, 2023).
6.4 Turbine performance verification
The turbine performance was verified using field test data from Weihai (Table 8) (Zhang et al., 2023a).
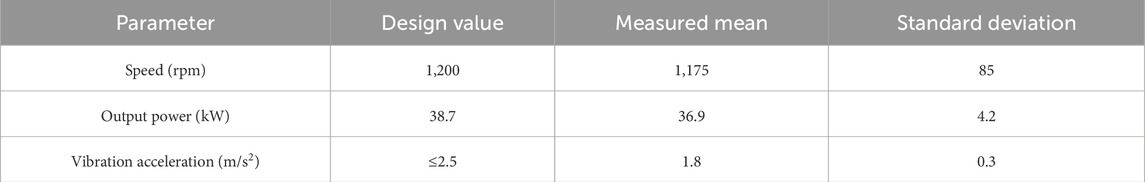
Table 8. Turbine performance results (cited from Zhang et al., 2023b).
7 Feasibility for deployment in Beibu Gulf
7.1 Beibu Gulf deployment plan
A 120 km geologically stable stretch of coastline along the Beibu Gulf coast (Figure 5) with water depths of 8–15 m was selected to deploy 500 revetment units in 15 m intervals to form a wave energy generation array spanning 7.5 km.
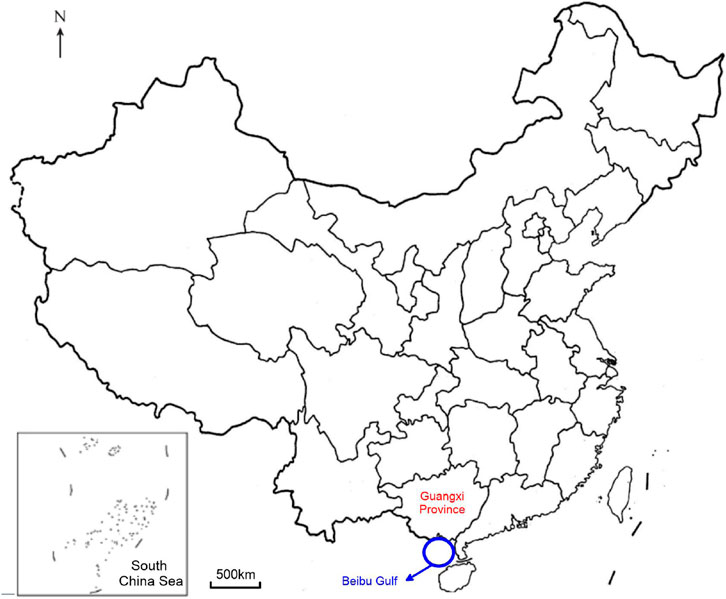
Figure 5. Location of Beibu Gulf.
The design and deployment considerations and values were as follows:
1. The wave energy density orientation prioritized deployment around Weizhou Island, where the annual average wave power density is 38.6 kW/m (Guangzhou Institute of Energy Science, Chinese Academy of Sciences, 2025).
2. We ensured terrain compatibility by selecting areas with a shoreline curvature radius ≥500 m to avoid vortex-induced vibration (Guangzhou Institute of Energy Science, Chinese Academy of Sciences, 2025).
3. We deployed the project 200 m from existing breakwaters and aquaculture areas, preserving maintenance channels.
The technical parameter configuration is provided in Table 9.
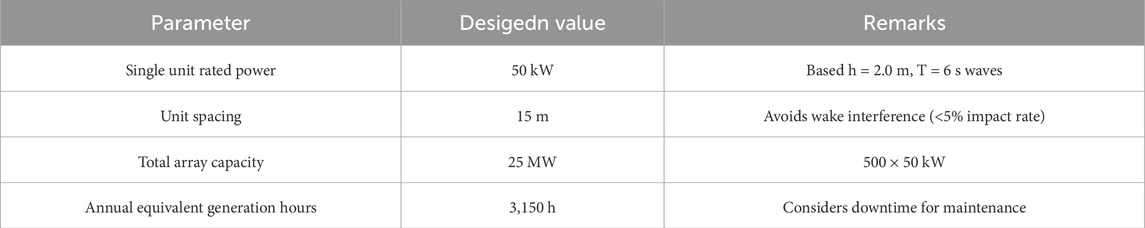
Table 9. Technical parameters.
We considered orefabricated concrete caissons (12 × 6 × 4 m) for the foundation, installed at sea with ±0.5 m precision.
The design enables modular assembly: the revetment plates, air chambers, and other components were prefabricated on land and installed on site in ≤3 days per unit.
A 10 kV step-up substation was installed every 10 units, with a total cable length of 82 km, for grid connection.
7.2 Cost–benefit analysis
7.2.1 Investment cost (capex)
The investment cost per kilometer of shoreline was CNY 22.8 million. The costs are broken down in Table 10.
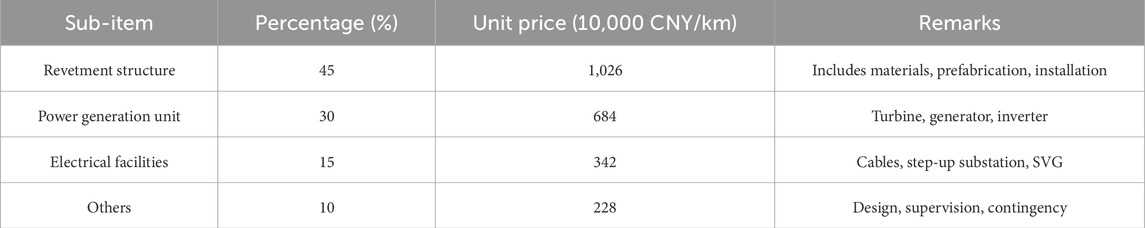
Table 10. Breakdown of total cost per unit shoreline.
The levelized cost of electricity (LCOE) is calculated based on a 30-year lifecycle as shown Equation 21:
where the initial investment is 22.8 million CNY/km × 7.5 km = CNY 1.71 billion; the annual operational cost (Opex) is 3.5% of the initial investment (COM = 0.12 CNY/kWh) (Hydropower & Water Resources Planning and Design Institute, 2020); the discount rate r is 6% (People’s Government of Guangxi Zhuang Autonomous Region, 2021); the annual power generation Et is 2.74 × 10⁸ kWh. These parameters are substituted into Equation 18 to calculate the LCOE as 0.422 CNY/kWh <0.453 CNY/kWh. The Beibu Gulf coal-fired benchmark electricity price at the time of this study was 0.453 CNY/kWh.
7.2.2 Revenue and payback period
The relationship between revenue and payback period for this project is shown in Table 11.
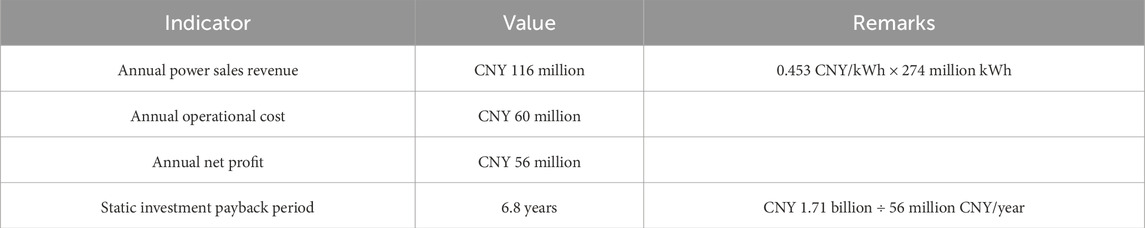
Table 11. Revenue and payback period.
7.3 Environmental benefits
7.3.1 Carbon reduction
We calculated the annual reduction in carbon emissions achieved by replacing coal-fired power generation with the proposed project:
7.3.2 Ecological impact assessment
The warm water discharged from energy operations negatively impacts the aquatic environment. Reducing the amount of warm water discharged mitigates these impacts on water quality. The hollow revetment structure can be used for the formation artificial reefs, which can sustain biodiversity and reduce the underwater noise produced by the system.
7.3.3 Socioeonomic benefits
Jobs are created for the construction and operation of the project. The proposed project reduces the annual need for standard coal by 1.2 million tons, reducing the need to import fossil fuels by 0.7%, enhancing energy security.
7.4 Benchmark analysis of efficiency achievement
7.4.1 Comparison with traditional OWC systems and early demonstrations
Historically, the overall conversion efficiency of many early and experimental Oscillating Water Column (OWC) devices typically ranged between 5% and 10%. For instance, the renowned UK LIMPET 500 kW shore-based plant achieved an actual operational efficiency of approximately 8%–12%.
This system (12.6%): Compared to these traditional designs, the 12.6% efficiency demonstrates a significant performance improvement attributable to the 55° inclined breakwater panel, optimized flow channels, the bi-directional turbine,and Multi-physical Field Coupling Optimization. This efficiency level reaches the upper limit of mature demonstration projects.
7.4.2 Comparison with state-of-the-Art OWC technologies and research
In recent years, through CFD optimization and improvements in air chamber and turbine design, some laboratory studies and advanced demonstration projects have reported theoretical or short-term peak OWC efficiencies reaching 15%–20% or even higher. It is crucial to emphasize that these higher figures are often associated with ideal wave conditions or represent sub-system efficiencies that do not account for the entire loss chain.
In contrast, the 12.6% efficiency of this system represents the average overall efficiency of the full chain—from wave capture to grid-connected power generation—under long-term operation. It incorporates all factors present in real marine environments, such as phase lag, turbulent losses, and downtime for maintenance. Therefore, as a full-system, long-term average efficiency, 12.6% aligns with current advanced technological standards and represents a reliable transition from idealized laboratory conditions to practical engineering application.
7.4.3 Comparison with similar systems integrated into coastal structures
Integrating wave energy converters with structures like breakwaters or seawalls often involves a trade-off, sacrificing some theoretical efficiency in exchange for benefits such as shared structural costs, shared construction and maintenance infrastructure, and the added value of coastal protection.
Within this category of integrated systems, an efficiency of 12.6% is a remarkable and leading achievement. For example, the Spanish Mutriku wave power plant (integrated within a breakwater) has reported a multi-year average operational efficiency of around 7%–10%. While fulfilling its coastal protection function, the system presented in this paper achieves significantly higher efficiency than such reference cases, successfully validating the superiority of the technical pathway integrating dual functionalities of “shore protection and power generation”.
8 Conclusions and outlook
8.1 Conclusions
We theoretically analyzed a project for capturing wave energy and conducted a feasibility study for deploying this project in the Beibu Gulf region in China. Several aspects of the hollow coastal revetment wave energy generation system were studied, and the following conclusions were drawn:
The project substantially increases the overall efficiency of wave energy capture systems.The overall efficiency of the proposed system is 12.6% under typical Beibu Gulf wave conditions (h = 2.0 m and T = 6 s), which is a 28.6% increase compared with that achived with traditional OWC devices. The errors between the numerical simulation and values obtained from the trial were ≤5%, verifying the engineering reliability of the proposed system.
The turbines of the proposed system are operationally stable.The 55°-inclined revetment plate and bidirectional airflow turbine design increased the wave impact force peaks by 43% and reduced the turbine efficiency fluctuation rates from 40% to 12% compared with those of traditional OWC devices.
The proposed system provides socioeconomic and environmental benefits over existing systems. The 7.5 km demonstration project in Beibu Gulf could generate 274 million kWh annually and reduce the LCOE reduced from 0.453 to 0.422 CNY/kWh compared with the existing system, with an investment payback period of 6.8 years. The system prevents the carbon emissions of 2.272 million tons annually, helping to protect the coast, generate power, and preserve the environment.
8.2 Outlook
8.2.1 Limitations of core technologies
The limitations of this method are as follows:
1.Insufficient simplification of multifield coupling models: We constructed an integrated wave–hydropneumatic–electromechanical model; however, we did not explicitly address the effects of turbulent scale or the transient characteristics of two-phase gas–liquid flow, such as the impact of bubble collapse on pressure pulsations. The fluid–structure interaction simulations were only validated for steady-state conditions and did not cover the dynamic responses of the structure under extreme wave conditions (e.g., typhoon waves), which may have led to the undersstimation of the risk of fatigue damage.
2. Energy conversion efficiency bottlenecks: The overall efficiency of 12.6% the proposed system is substantially lower than the theoretical value of approximately 40% as the theoretical OWC theoretical. The efficiency is primarily constrained by the following: The water-to-air kinetic energy conversion efficiency was 74.3%, reflecting issues with turbulence dissipation in the pressurized water channels and gas compression heat losses. The turbine efficiency fluctuation in unsteady airflow is high (±18.7%, corresponding to 1,120 ± 210 rpm), raising concerns about the robustness of the self-adaptive bidirectional airflow mechanism under variable operating conditions.
3. Reliability of the key components: The dynamic response time (0.023 s) for the sealing sphere relies on idealized assumptions and does not consider the potential for valve jamming caused by seawater corrosion or biofouling. The chloride ion erosion rate (>0.1 mm/year) of the concrete cavity structure in salt spray environments and the design lifespan (30 years) was not quantitatively assessed.
4. Neglecting the complex ecological interactions triggered by marine engineering:Local ecosystems exhibit cascading effects. Artificial reefs may attract new species and displace indigenous ones, altering ecological structures; meanwhile, overlooked underwater noise continuously disturbs marine mammals, incurring hidden ecological costs.Multiple environmental factors demonstrate synergistic influences. For instance, altered currents can simultaneously cause the accumulation of pollutants and the upwelling of nutrients, elevating the risk of harmful algal blooms. This synergy renders the simple summation of individual benefits meaningless.Ecological impacts possess long-term cumulative characteristics. Material corrosion and contaminant leachates can accumulate in organisms, constituting a long-term ecological debt over time.
8.2.2 Future research directions
1. Multienergy complementary integration: Integrated wind–wave power generation platforms should be developed that share infrastructure, grid connections, and operations and management (O&M) systems, which could reducing the LCOE by 40%. Our system could be coupled with 10 MW class offshore wind turbines to increase the energy output per unit sea area to 3.2 MW/km2.
2. New materials and intelligent O&M: Graphene-modified coatings (corrosion rate ≤0.02 mm/year) and self-healing concrete technology could be used to extend the structural lifespan to 50 years. Digital twin systems could be used to increase fault prediction accuracy to >90% and reduce O&M costs by 35%.
3. Increase deep-sea adaptability: Floating cavity revetment devices could be developed that use mooring systems and pressure-adaptive air chamber designs to extend operations to water depths of 50–200 m. This could produce a seven-fold increase in the exploitable resource potential.
4. Transition from linear calculation to ecosystem services assessment: Only by internalizing these interactions through long-term ecological monitoring and scenario analysis can the project’s net environmental benefits be accurately measured.
5. Dynamic Risk Decision-Making Framework: A fixed electricity price is used as the baseline scenario, while also establishing various price change scenarios such as pessimistic and optimistic ones. By calculating the LCOE and payback period under different scenarios, the project’s risk exposure to electricity price fluctuations is clarified. Monte Carlo simulation is employed, treating the electricity price as a random variable following a specific probability distribution. Through tens of thousands of simulation runs, the probability distributions of LCOE and the payback period are obtained, thereby assessing the confidence interval for project profitability from a dynamic perspective. Policy-driven revenue streams are incorporated into the model; these revenues can effectively hedge against the downside risk of market electricity prices and enhance the project’s resilience in economically volatile environments.
Data availability statement
The raw data supporting the conclusions of this article will be made available by the authors, without undue reservation.
Author contributions
YW: Conceptualization, Writing – review and editing, Writing – original draft. YgY: Writing – original draft, Software, Writing – review and editing, Investigation, Conceptualization. YyY: Writing – review and editing, Data curation, Software, Writing – original draft, Investigation.
Funding
The authors declare that financial support was received for the research and/or publication of this article. This research was supported by the Natural Science Foundation of Guangxi (No. Gui Ke AD23026260), the Basic Ability Improvement Project of Young and Middle-aged Teachers in Universities of Guangxi (Project Name: Research on Three-Dimensional Forward and Inverse Modeling Methods for Frequency-Domain Controlled Source Electromagnetic Exploration for Karst, No. 2025KY1442), and the Inclusive Supporting Foundation for Qingmiao Talents of Guangxi (No. Natural Science 120).
Conflict of interest
The authors declare that the research was conducted in the absence of any commercial or financial relationships that could be construed as a potential conflict of interest.
Generative AI statement
The authors declare that no Generative AI was used in the creation of this manuscript.
Any alternative text (alt text) provided alongside figures in this article has been generated by Frontiers with the support of artificial intelligence and reasonable efforts have been made to ensure accuracy, including review by the authors wherever possible. If you identify any issues, please contact us.
Publisher’s note
All claims expressed in this article are solely those of the authors and do not necessarily represent those of their affiliated organizations, or those of the publisher, the editors and the reviewers. Any product that may be evaluated in this article, or claim that may be made by its manufacturer, is not guaranteed or endorsed by the publisher.
References
Ahamed, R., McKee, K., Howard, I., and Chandrasekaran, S. (2024). Self-tuning oscillating water column converters for broadband wave energy capture. Renew. Sustain. Energy Rev. 189, 114502.
Chen, L., Göteman, M., and Engström, J. (2024a). Quantum-inspired genetic algorithm for optimal layout of wave energy converter arrays. Energy 288, 129735.
Chen, L., Göteman, M., and Engström, J. (2024b). Quantum genetic optimization for wave energy converter arrays considering power smoothing and structural fatigue. Energy 302, 131845.
Chen, H., Qian, L., and Ma, Z. (2024c). Wave-current interaction effects on grid integration stability of marine renewable energy systems. IEEE Trans. Power Syst. 39, 345–358.
Falcão, A. F. O., and Göteman, M. (2024). Advanced ocean wave energy conversion: technologies and case studies. 2nd ed. Springer Nature.
Göteman, M., Engström, J., and Eriksson, M. (2022). Wave energy parks with point absorber converters: layout optimization and power smoothing. Appl. Ocean. Res. 118, 102972.
Guan, Y., Yang, S. H., and Kim, K. H. (2024). Field validation of a self-adaptive bidirectional turbine for irregular wave conditions in oscillating water columns. Energy Convers. Manag. 308, 118402.
Guangzhou Institute of Energy Conversion (2025). Test report of nankun MW-level floating wave energy device. Wave Energy-Aquaculture Platf. Energy Convers. CAS 50.
Heath, T., Whittaker, T., and Cruz, J. (2023). Full-scale implementation of breakwater-integrated oscillating buoys: case study of Mutriku wave power plant. Coast. Eng. 185, 104335.
Heath, T., Sannasiraj, S. A., and Sundar, V. (2024). Multifunctional breakwater-integrated WECs: from laboratory to full-scale deployment. Appl. Ocean. Res. 148, 103015.
Henderson, R., and Leeney, R. (2023). Techno-economic analysis of wave energy projects in emerging markets. Energy Policy 174, 113458.
High level panel for a sustainable ocean economy (2023). Blue prosperity: integrated ocean management for renewable energy deployment. Washington, DC: World Resources Institute.
Hydropower and Water Resources Planning and Design Institute (2020). “Quota and cost compilation rules for renewable energy power projects,”, 87. Beijing: China Water and Power Press.
Jamil, F., Shafiq, I., Sarwer, A., Ahmad, M., Akhter, P., Inayat, A., et al. (2024a). A critical review on the effective utilization of geothermal energy. Energy Environ. 35, 438–457. doi:10.1177/0958305X231153969
Jamil, F., Shafiq, I., and Sarwer, A. (2024b). Corrosion-resistant nanocomposite coatings for marine energy devices: a lifecycle assessment. Mater. Des. 241, 112876.
Li, X. M. (2021). Comparative analysis of US ocean science decadal plans and implications for China. World Sci-Tech R. D. 43, 691–700.
Li, X. M. (2024). China’s deep-sea strategy under Sino-US marine technology competition. Pac. J. 32, 45–58.
Liu, H., and Ning, D. (2023). Real-time phase control of oscillating water column devices using model predictive control. Appl. Energy. 351, 121876.
Liu, H., Sheng, W., and Ringwood, J. V. (2023). Real-time nonlinear model predictive control for OWC air turbine efficiency maximization. Renew. Energy. 218, 119230.
Liu, J., Zhang, D., and Li, Y. (2024). Lifecycle ecological assessment of wave energy farms in multi-use platforms: yellow sea case study. Mar. Pollut. Bull. 199, 115021.
Mendoza, E., and Silva, R. (2022). Coastal protection and renewable energy integration: case studies from Europe and Asia. J. Coast. Res. 38, 789–801.
Nader, J. R., Penesis, I., and Wu, H. (2024). High-resolution assessment of wave energy sustainability under climate change scenarios in the South China Sea. Renew. Energy. 225, 120175.
National Ocean Technology Center (2025). Technical white paper on deep-sea adaptability of Eagle-III wave energy converter. Natl. Ocean. Adm.
National Oceanic Administration (2025). *China ocean energy development report. Beijing: Ocean Press, 2023–2027.
North Sea Energy Consortium (2023). Off Shore Hybrid Energy Systems: 2023 Road Map [Technical Report]. Amsterdam: TNO Publishing. Available online at: https://northseaenergy.eu/en/publications.
People’s Government of Guangxi. Zhuang Autonomous Region (2021). The 14th five-year plan for marine economic development in Guangxi, 23.
Rusu, E., Onea, F., and Rusu, L. (2024). Hybrid wind-wave energy systems: Digital twin integration for lifecycle management. Energies.
Rusu, L., Zanuttigh, B., and Angelelli, E. (2024). Digital twin framework for ecological-energy synergy in multi-use ocean platforms. Appl. Energy. 359, 122735.
Sun, L., and Chen, J. (2024). Multi-objective topology optimization of bionic cavity breakwater structures. J. Hydraul. Eng. 55, 1123–1135.
Vicinanza, D., and Margheritini, L. (2021). Overtopping wave energy converters integrated in coastal structures: laboratory experiments and field tests. Appl. Ocean. Res. 114, 102788.
Wang, J. G., and Lin, F. (2023). Application and validation of nonlinear wave theory in beibu gulf. Adv. Mar. Sci. 41, 234–245.
Wang, J. G., and Lin, F. (2025). Synergistic development potential of wave-wind energy in beibu gulf. Renew. Energy. 43, 102–110.
Wang, R., Vicinanza, D., and Margheritini, L. (2024a). Quantum annealing-based layout optimization of overtopping WEC arrays in coastal structures. Energy 292, 130519.
Wang, X., Elhanafi, A., and Macfarlane, G. (2024b). Hydrodynamic performance of triple-chamber OWC systems under irregular waves. Renew. Energy. 222, 119841.
Wang, X., Zhou, Y., and Ning, D. (2024c). Hydrodynamic optimization of triple-chamber OWC devices with adaptive air valves using CFD-FSI coupling. Ocean. Eng. 302, 117602.
Weller, S. D., Johanning, L., and Zhou, Q. (2024). Dynamic mooring fatigue analysis for floating WECs in typhoon-prone regions. Mar. Struct. 91, 103578.
Windt, C., Davidson, J., and Johanning, L. (2024). Digital twin-driven predictive maintenance for floating WECs using multi-sensor fusion. Mech. Syst. Signal Process. 195, 110842.
Zhang, W., and Liu, Y. J. (2024). Efficiency study of self-adaptive bidirectional turbine with magnetofluidic sealing for wave energy conversion. J. Mech. Eng. 60, 145–153.
Zhang, R., Xu, C., and Huang, Z. (2023). The effect of lewis acidity of tin loading siliceous MCM-41 on glucose conversion into 5-hydroxymethylfurfural. Renew. Energy. 218, 119305. doi:10.1016/j.renene.2023.119305
Zhang, Y., Al Shami, E., and Wang, Z. (2023a). Machine learning-enhanced CFD simulation for viscous drag prediction of wave energy converters. Ocean. Eng. 286, 115601.
Zhang, Y., Al Shami, E., and Wang, Z. (2023b). Machine learning-enhanced CFD for viscous drag prediction in wave energy converter design. Ocean. Eng. 286, 115601.
Keywords: cavity revetment system, wave energy conversion efficiency, coupled hydropneumatic model, Beibu Gulf area, hydropneumatic wave power generation
Citation: Wei Y, Yang Y and Yang Y (2025) Multifield cavity-type revetment system for generating wave energy power and protecting the coast in Beibu Gulf, China. Front. Energy Res. 13:1633706. doi: 10.3389/fenrg.2025.1633706
Received: 23 May 2025; Accepted: 10 November 2025;
Published: 24 November 2025.
Edited by:
Min Luo, Zhejiang University, ChinaReviewed by:
Gang Li, Mississippi State University, United StatesKai-Hung Lu, Minnan University of Science and Technology, China
Copyright © 2025 Wei, Yang and Yang. This is an open-access article distributed under the terms of the Creative Commons Attribution License (CC BY). The use, distribution or reproduction in other forums is permitted, provided the original author(s) and the copyright owner(s) are credited and that the original publication in this journal is cited, in accordance with accepted academic practice. No use, distribution or reproduction is permitted which does not comply with these terms.
*Correspondence: Yang Yang, c3h3Y3l5eUAxNjMuY29t