 S. S. Venkatesh
 V. Pandiyarajan1
 R. Velraj
- 1Department of Chemical Engineering, AC Tech, Anna University, Chennai, Tamil Nadu, India
- 2Institute for Energy Studies, Anna University, Chennai, Tamil Nadu, India
- 3Department of Mechanical Engineering, Indian Institute of Technology Madras, Chennai, Tamil Nadu, India
As global water scarcity intensifies, sustainable alternatives to reverse osmosis (RO), which is an energy-intensive process, are essential, especially given the environmental risks posed by wastewater and brackish water discharge. This study explores forward osmosis (FO) as a viable alternative, using 2M MgCl2 as the draw solution (DS) and brackish water RO reject as the feed solution (FS). In the present work, a computational fluid dynamics (CFD) study is performed to model water transport through FO membranes using two thin-film flat sheet membranes—polysulfone (PSF) and polybenzimidazole (PBI)—enhanced with MWCNT additives, aiming to recover water from brackish water RO reject. This type of CFD evaluation of MWCNT-modified FO membranes is a unique aspect of the present work. A non-Darcy porous medium model was applied in CFD to simulate flow through the FS, DS, and the membrane, with pressure drop correlated to the osmotic pressure gradient. The PBI/MWCNT2 wt% membrane achieved the best overall performance with a CFD-predicted WF of 31.5 L/m2.hr or LMH, closely aligning with the experimental value of 31.2 ± 0.4 LMH. The CFD results for all the membranes are also in close agreement with the experimental data, confirming the accuracy of the model. The WF in the PBI and PBI/MWCNT membranes has a greater effect than the PSF and PSF/MWCNT membranes due to its affinity for water, the π–π bonds between PBI and MWCNT, and the interaction of nitrogen atoms on its imidazole ring with water, forming hydrogen bonds.
1 Introduction
Water is vital for human health, economic development, and environmental sustainability. However, only 0.3% of earth’s freshwater is accessible for direct human consumption (Venkatesh et al., 2024; Grover, 2006; Porowski and LaMoreaux, 2019). Increasing demand driven by population growth, industrialisation, climate change, and pollution is intensifying freshwater scarcity (Qadir et al., 2010; Kye et al., 2023). By 2030, global water consumption is projected to rise by 53%, reaching 6.9 trillion m3 (Amarasinghe and Smakhtin, 2014). This demands innovative and sustainable water treatment solutions to ensure reliable access to clean water.
Desalination plays an important role in addressing water shortages, particularly in arid and coastal regions, with global installed capacity exceeding 100 million m3/day. Desalination technologies are broadly classified into thermal-based and membrane-based processes, each with distinct operational principles, energy requirements, and environmental impacts. Among the various desalination techniques, membrane-based processes have gained significant attention due to their effectiveness in removing contaminants and ensuring a stable freshwater supply (Aende et al., 2020; Alkaisi et al., 2017; Curto et al., 2021; Famiglietti, 2014; Gleick, 2014).
Forward osmosis (FO) is an emerging membrane-based desalination technique that utilises the natural osmotic pressure difference between a feed solution (FS) and a concentrated draw solution (DS). Water naturally migrates from the FS (e.g., seawater or brackish water) into the DS (typically containing highly osmotic solutes) across a semi-permeable membrane, leaving salts and impurities behind, as seen in Figure 1. Once the DS is diluted, pure water is recovered through secondary processes such as thermal, chemical, or membrane-based separation (Cath et al., 2006; Zhao et al., 2012a; Chung et al., 2012).
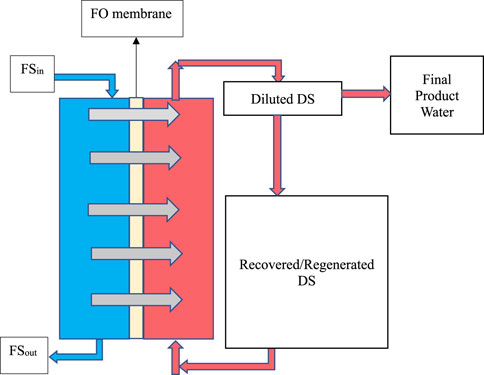
Figure 1. Schematic showing the process of FO.
Compared to thermal desalination methods like multi-stage flash (MSF) distillation, multi-effect distillation (MED), solar still distillation (SSD), and vapour compression (VC), FO is significantly more energy-efficient. It requires minimal or no thermal input and operates without hydraulic pressure, relying solely on the osmotic gradient. This, in turn, reduces energy consumption, operational complexity, and membrane stress, leading to lower maintenance and longer membrane lifespan. FO also offers reduced pumping power, lower carbon footprint, and high water recovery and water flux (WF) (Aende et al., 2020; Shabani et al., 2021; Ghanbari et al., 2016; Parveen and Hankins, 2018).
Moreover, FO demonstrates superior fouling resistance compared to electrodialysis (ED), nanofiltration (NF), reverse osmosis (RO) and ultrafiltration (UF). Since FO does not utilise hydraulic pressure, it limits foulant compaction on membrane surfaces, reducing the need for extensive pretreatment and cleaning. FO is particularly effective for treating highly saline waters—including seawater, brackish water and wastewater—where other methods struggle to operate efficiently or economically (Parveen and Hankins, 2018; Kamel et al., 2023; Yan et al., 2023).
Despite these advantages, challenges remain in optimising FO membranes for high WF and salt rejection while mitigating internal concentration polarisation (ICP). The identification and selection of ideal DS also continues to be an active area of research (McGinnis and Elimelech, 2007; Jain and Garg, 2021). A detailed comparison of FO with other desalination technologies is presented in Table 1.
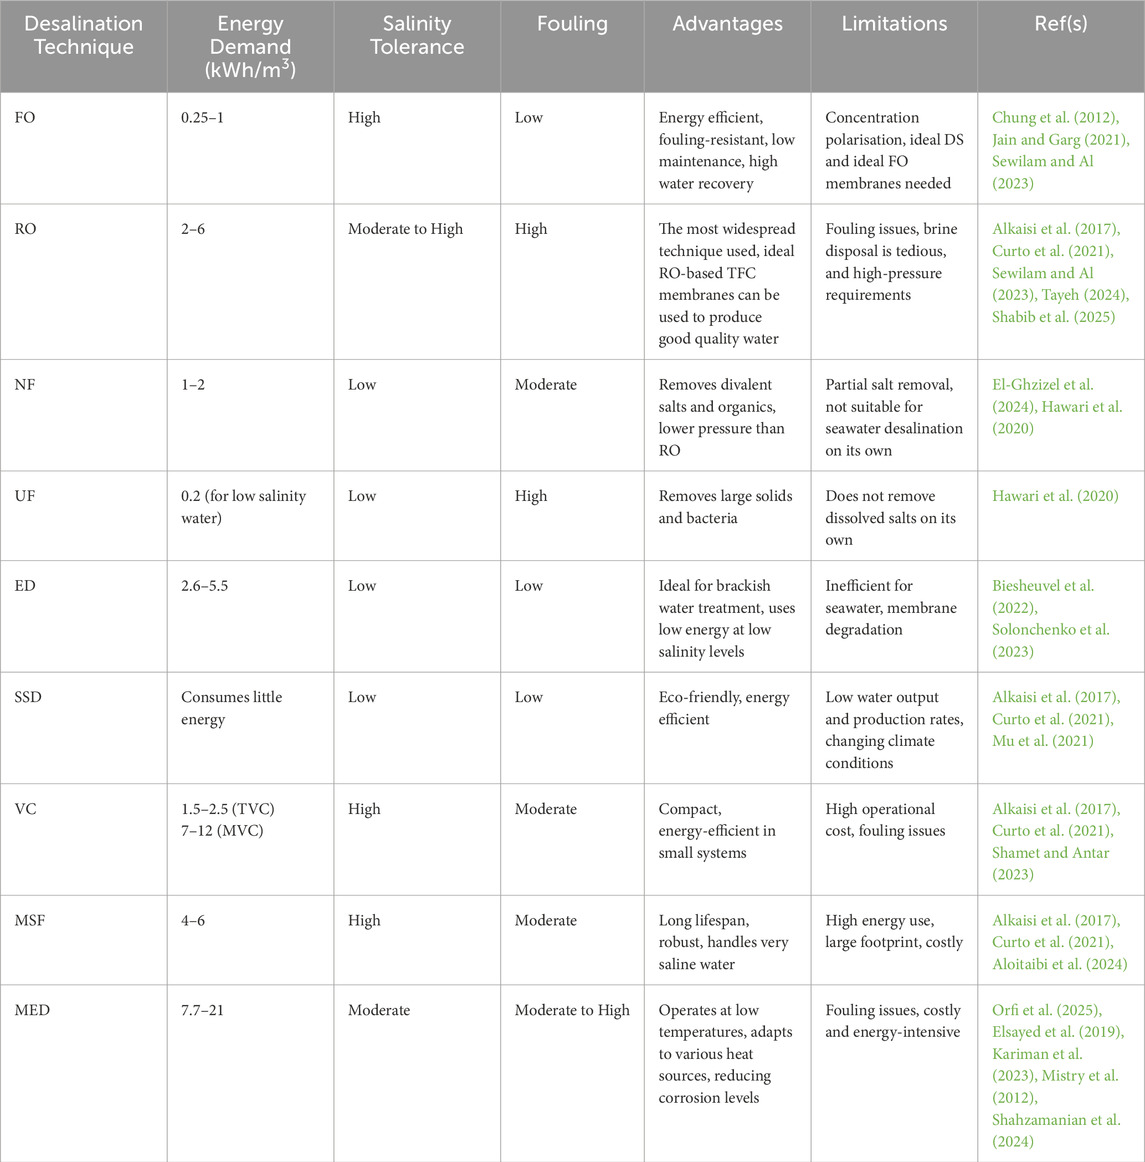
Table 1. Comparative analysis of different desalination techniques reported in the literature.
Effective membrane design is essential for optimal FO performance. An ideal FO membrane should exhibit high mechanical, thermal, and chemical stability, along with low ICP, low fouling propensity, high WF, and strong hydrophilicity (Shabani et al., 2021; Ghanbari et al., 2016; Krishnan et al., 2022; McCutcheon and Elimelech, 2006; McCutcheon et al., 2007; Arjmandi et al., 2020). Achieving both high WF and salt rejection is critical for FO membrane development (Morales-Torres et al., 2016; Akther et al., 2019; Sahebi et al., 2016).
Thin-film composite (TFC) and thin-film nanocomposite (TFN) membranes are widely used in FO due to their superior permeability and selectivity (Jain and Garg, 2021). TFC membranes feature an active separation layer atop a porous support layer, allowing for independent optimisation of support layer properties while maintaining robust performance across a wide pH and temperature range (Jain and Garg, 2021; Morales-Torres et al., 2016; Akther et al., 2019; Sahebi et al., 2016).
TFN membranes are advanced variants of TFC membranes, created by embedding nanoparticles into the polymer matrix. This incorporation enhances salt rejection and prevents the passage of fine contaminants (Jain and Garg, 2021). Common fabrication methods for TFC and TFN membranes include phase inversion (PI) and interfacial polymerisation (IP) (Jain and Garg, 2021; Emadzadeh et al., 2014; Park et al., 2015; Amini et al., 2013). Recent innovations in TFN membranes involve the integration of nanoparticles such as graphene oxide (GO), multi-walled carbon nanotubes (MWCNT), and metal/metal oxide particles, including aluminium oxide (Al2O3), copper (Cu), gold (Au), iron (III) oxide (Fe3O4), titanium dioxide (TiO2), zinc oxide (ZnO), silica (SiO2) and zeolites. These additives significantly improve membrane permeability, hydrophilicity, selectivity, and structural stability, while mitigating fouling and enhancing mechanical strength. Additionally, nanoparticles improve the mechanical characteristics of membranes, facilitate better water transport, and prevent hazards linked to radioactive pollutants (Shabani et al., 2021; Morales-Torres et al., 2016; Abbas et al., 2023; Darabi et al., 2018; Jang et al., 2019; Li et al., 2022).
The implementation of powerful numerical tools to analyse complex flow phenomena and to validate with the experimental data obtained in membrane processes, particularly for FO, is necessary (Akther et al., 2019; Gruber et al., 2011). The technique of using computational fluid dynamics (CFD) simulations has become increasingly popular for modelling hydrodynamics, mass transfer, and fouling behaviour in FO systems. These simulations offer detailed visualisations of solute transport and concentration polarisation (CP), which occur not only in the FS and DS but also within the porous structure of the membrane. To accurately capture these effects, CFD models require fine meshing of both the FS and DS flow domains and the internal membrane layers (Gruber et al., 2011). This allows for precise prediction of WF, mixing behaviour, and CP mitigation strategies. ICP and external concentration polarisation (ECP) tend to reduce the effective osmotic driving force, thus lowering WF. CFD helps to quantify and visualise these phenomena by solving fluid flow and solute transport equations, enabling optimisation without exhaustive experimental trials (Akther et al., 2019; Gruber et al., 2011). Researchers have employed CFD to explore strategies for mitigating CP, such as increasing cross-flow velocity, optimising module geometry, incorporating turbulence promoters, and adding spacers to disrupt boundary layers. CFD also facilitates the evaluation of membrane geometry, material modifications, and operating parameters, contributing to the design of FO membranes with enhanced antifouling characteristics, reduced CP, and improved performance. Several studies have effectively used porous media formulations in CFD models to simulate and analyse FO membrane separation behaviour (Ren et al., 2020; Toh et al., 2020; Kahrizi et al., 2020; Sahebi et al., 2021; Liang and Fletcher, 2023).
Brackish water RO reject has been treated using hybrid systems such as FO/RO/NF, FO/RO/UF, and FO/NF processes (Zhao et al., 2012b; Altaee and Hilal, 2015; Khanzada et al., 2017). However, the application of polymeric TFC and TFN membranes for FO process through CFD modelling validated with the experimental results are not available in the literature, which is the uniqueness of the present work. The present study aims to recover water from brackish water RO reject and involves the development of a simplified, suitable non-Darcy porous medium model to simulate water transport across polysulfone (PSF), PSF/MWCNT, polybenzimidazole (PBI), and PBI/MWCNT membranes. The CFD analysis was performed by providing property values of the membranes and the porosity values measured and previously reported by the same research group in (Venkatesh et al., 2024). The CFD results were then validated with the experimental data.
2 Materials and methods
Initially, suitable DS and membranes were identified for the FO process. CFD analysis was conducted to evaluate WF and osmotic pressure gradients across the membranes, and the results were validated with the experimental results. This section outlines the selection criteria for DS and membranes, a summary of the experimental procedure, and the CFD analysis.
2.1 Selection of DS and membrane
The selection of the DS is crucial for the efficient performance of the FO process, which establishes the osmotic pressure gradient necessary for water transport. An ideal DS should possess high osmotic pressure, low viscosity, and promote high WF while minimising ICP. Additionally, the DS should be cost-effective, abundant, non-toxic, and easily regenerable (Johnson et al., 2017). Magnesium chloride (MgCl2) was selected as the DS in this study due to its high osmotic pressure, low diffusion coefficient in water, and ease of recovery via NF. The divalent nature of MgCl2 promotes greater osmotic driving force and reduced ICP, making it a suitable candidate over other salts such as calcium sulphate (CaSO4), potassium bromide (KBr), potassium chloride (KCl), magnesium sulphate (MgSO4) and sodium chloride (NaCl) (Morales-Torres et al., 2016; Akther et al., 2019; Johnson et al., 2017; Suwaileh et al., 2018; Salih and Al-Alawy, 2022).
Pertaining to the membrane selection, commercial membranes such as cellulose triacetate (CTA), though widely used, suffer from low permeability, thermal instability, and high structural resistance (Cath et al., 2006; McCutcheon and Elimelech, 2006; Ding et al., 2020). To address these limitations, polymeric materials such as PSF and PBI were selected due to their superior chemical, thermal, and mechanical stability. PSF, commonly used as a substrate polymer in TFC and TFN membranes, exhibits strong resistance to chemical and biological degradation due to its sulfonyl groups, as well as high salt rejection resulting from its dense structure (Jain and Garg, 2021; Morales-Torres et al., 2016; Park et al., 2015; Amini et al., 2013; Febriasari et al., 2021; Rashed et al., 2020). PBI, known for its imidazole ring structure, becomes self-charged in aqueous environments due to proton delocalisation, making it suitable for FO and other water separation processes (Akther et al., 2019; Rashed et al., 2020; Daer et al., 2020; Suryani et al., 2011; Datsyuk et al., 2013). To enhance membrane performance, MWCNTs were incorporated into both PSF and PBI membranes. MWCNTs improve membrane hydrophilicity, salt rejection, and antifouling properties, and contribute to higher WF by enhancing water transport pathways and reducing the contact angle (Jain and Garg, 2021; Morales-Torres et al., 2016; Akther et al., 2019; Amini et al., 2013; Sirinupong et al., 2017; Shah et al., 2019; Koutahzadeh et al., 2016). In this study, PSF, PBI, PSF/MWCNT, and PBI/MWCNT membranes were selected and systematically evaluated using CFD simulations, and the results were validated with the experimental data.
2.2 Experimental methods
2.2.1 Membrane fabrication
A summary of the membrane fabrications done in (Venkatesh et al., 2024) is as follows: The PSF dope casting solution was prepared by dissolving 18 wt% PSF in a mixture of dimethylformamide (DMF) and polyvinylpyrrolidone (PVP). DMF served as an effective solvent, helping PSF to dissolve easily and aiding in the formation of a uniform support layer. Similarly, the PBI dope casting solution was prepared by dissolving 18 wt% PBI in dimethylacetamide (DMAc) with the addition of lithium chloride (LiCl) to enhance solubility. DMAc, a polar aprotic solvent, was chosen for its compatibility with the chemical, thermal, and mechanical stability of PBI, thereby assisting in the facilitation of the membrane casting process. MWCNTs, with diameters ranging from 20 to 80 nm and lengths of 3–8 μm, were incorporated into the PSF and PBI dope solutions at concentrations of 0–3 wt%. To fabricate the active polyamide layer, IP reaction was performed using 0.2 wt% trimesoyl chloride (TMC) and 4 wt% m-phenylenediamine (MPD). The IP reaction was completed within 3 min. Before this, MWCNTs were ultrasonically dispersed in the 4 wt% aqueous MPD solution for 4 h using a Branson® ultrasonic bath (Danbury, Connecticut, United States).
PSF/MWCNT and PBI/MWCNT casting solutions were prepared by dispersing MWCNTs (1, 2, and 3 wt%) in appropriate solvents—DMF for PSF and DMAc for PBI. Correspondingly, the PSF and PBI concentrations were adjusted to 17, 16, and 15 wt% to accommodate the added MWCNTs. The mixtures were homogenised, stirred, and degassed for 24 h (Akther et al., 2019; Rashed et al., 2020). The flat-sheet membranes were then fabricated using a casting knife equipped with a heating system. The compositions of PSF and PBI membranes with varying MWCNT content are given in Tables 2, 3, respectively.
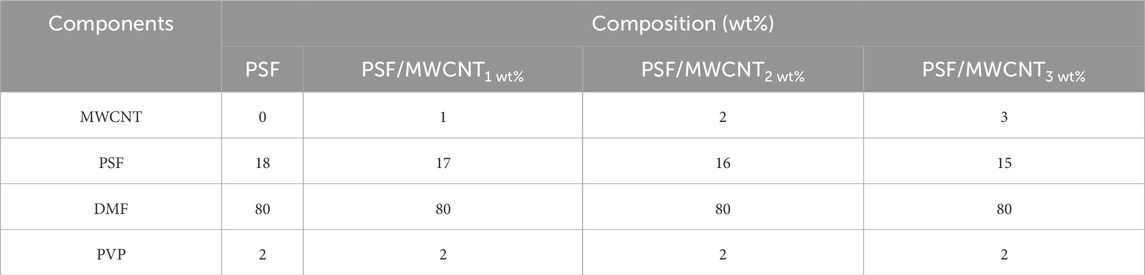
Table 2. The wt% of components in the PSF membrane for various MWCNT concentrations.
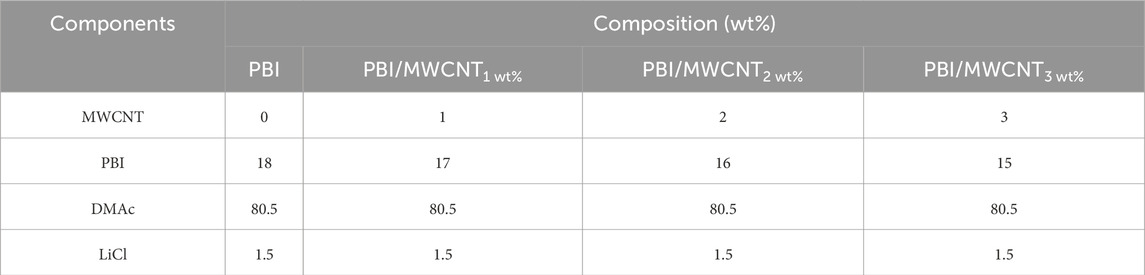
Table 3. The wt% of components in the PBI membrane for various MWCNT concentrations.
2.2.2 Experimental setup and procedure
Figures 2a,b illustrate the schematic and experimental setup for the FO process, as described in (Venkatesh et al., 2024). The system consisted of two rectangular flow channels (30 × 15 × 10 cm in the order of length, width and height/thickness) separated by a flat-sheet membrane (30 × 15 × 0.4 cm in the order of length, width and height/thickness).
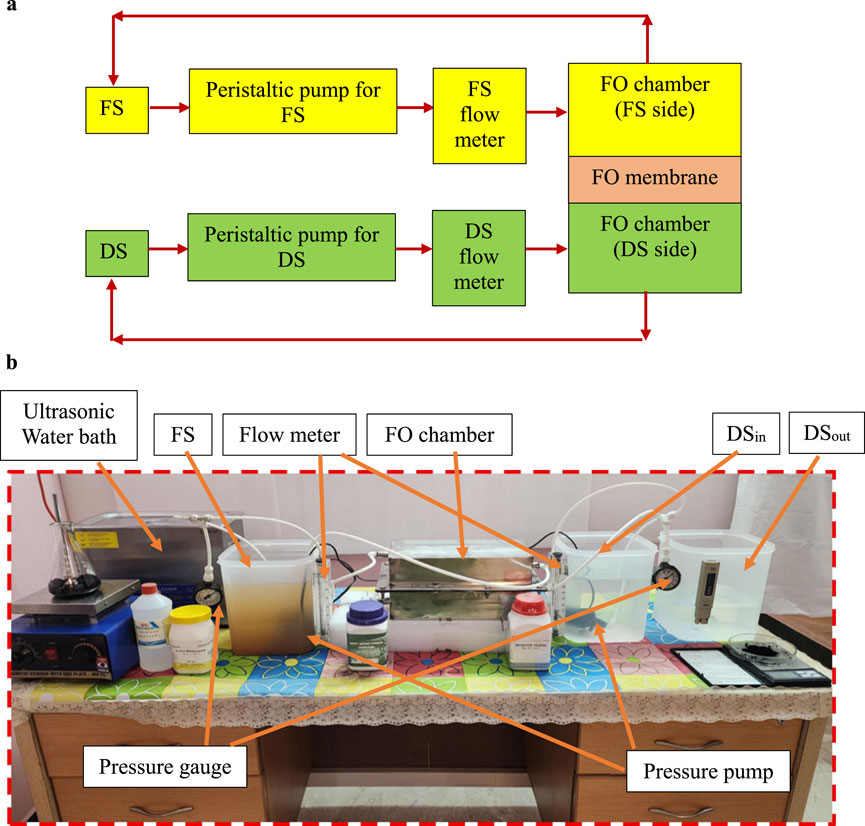
Figure 2. (a) FO process flow diagram for the experiment. (b) Photographic view of the experiment setup.
FO experiments were conducted using 2M MgCl2 as the DS and brackish water RO reject as the FS. Both solutions were circulated at a flow rate of 0.0067 m/s in a closed-loop configuration to maintain constant concentrations. The membrane was oriented in an active layer facing the feed solution (AL–FS) configuration, with the FO chamber arranged horizontally, FS in the upper channel and DS in the lower channel. Each experiment was carried out at room temperature for 30 min. The equations used to evaluate membrane performance were consistent with the equations reported in (Venkatesh et al., 2024).
2.2.3 Membrane characterisations and performances
The X-ray diffraction (XRD) (XRD-2kW-RIKAGU Miniflex 600 model, Japan) patterns for the PSF and PBI membranes are presented in Figure 3. Diffraction peaks appear within the 2θ range of 12°–20° for PSF and 14°–25° for PBI, while distinct peaks at 2θ = 26° confirm the presence of MWCNTs. These sharp peaks indicate enhanced crystallinity and improved molecular orientation in the PSF/MWCNT2 wt% and PBI/MWCNT2 wt% membranes. Mechanical and thermal stability are improved due to the crystalline nature of MWCNT. The increased crystallinity also enhances both porosity and WF. The CFD simulations incorporate the measured porosity values and validate the WF values with the experimental data WF values (Shah et al., 2019; Koutahzadeh et al., 2016; Sulaiman et al., 2022).
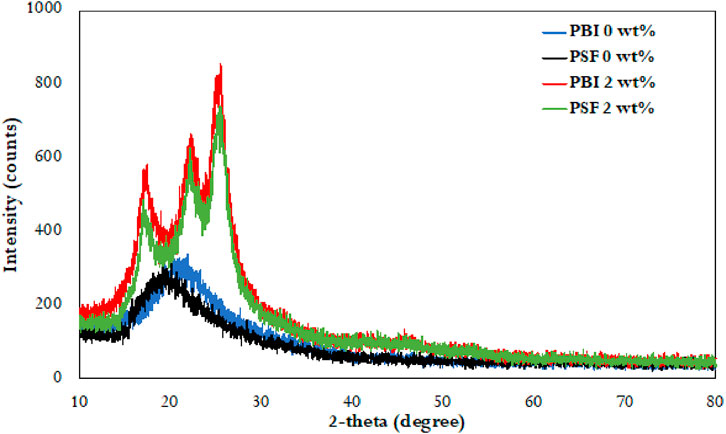
Figure 3. Intensity counts from the XRD analysis for PSF, PBI, PSF/MWCNT2 wt% and PBI/MWCNT2 wt% membranes.
The water contact angles (Drop Shape Analyser 25 model, Krüss, Germany) for both PBI and PSF membranes are displayed in Figures 4a,b. A general decrease in contact angle upon MWCNT incorporation indicates enhanced hydrophilicity. However, at 3 wt% MWCNT loading, a slight increase in contact angle is observed due to nanoparticle agglomeration on the membrane surface, consistent with previous studies (Daer et al., 2020; Akhtar et al., 2017; Wang et al., 2022; Park and Jeong, 2015; Wang et al., 2015). PBI membranes exhibit greater hydrophilicity than PSF, attributed to hydrogen bonding between PBI and water as well as intermolecular π–π bonds between PBI and MWCNT. These characteristics correlate with the higher WF and porosity observed in both experimental and CFD results.
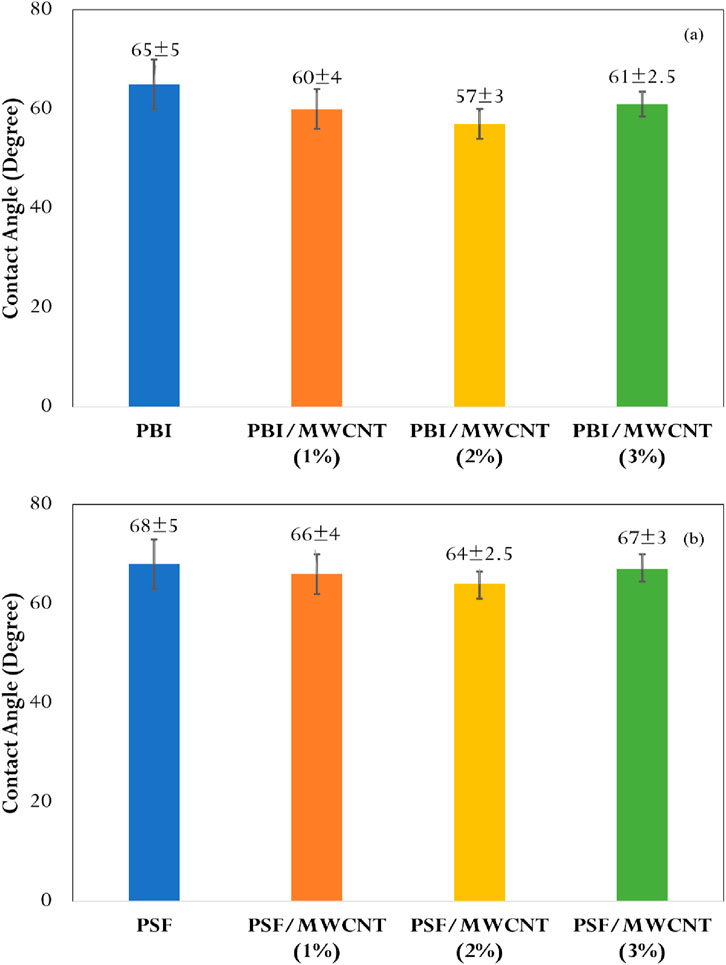
Figure 4. Water contact angles (a) with PBI membranes; (b) with PSF membranes.
The porosity values of PSF and PBI are presented in Table 4. Despite the decrease in pore size, the inclusion of MWCNT results in an increase in porosity for PBI and PSF. Up to 2 wt%, the addition of MWCNT effectively increases porosity (by increasing the number of pores per unit volume); after that, MWCNT agglomeration takes place. The inclusion of MWCNT alters the morphological properties of the membrane, which has positive impacts on WF enhancement. Together with increased hydrophilicity, reduced pore size, and increased porosity, these enhancements improve the performance of the PSF/MWCNT and PBI/MWCNT membranes compared to plain PSF and PBI. After 3 wt%, the MWCNT particles appear to agglomerate, which lowers the porosity (Morales-Torres et al., 2016; Akther et al., 2019; Amini et al., 2013; Li et al., 2022; Daer et al., 2020). The values of the porosities are implemented in the CFD analysis to calculate the velocity, which determines the WF. Performance-wise, PBI/MWCNT2 wt% outperformed the other membrane samples with a porosity value of 70 ± 4.
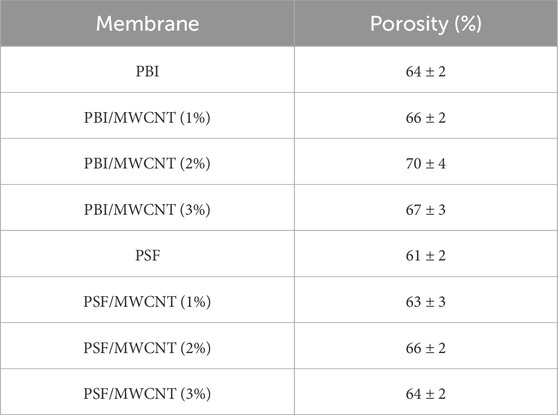
Table 4. Porosity values for PSF and PBI FO membranes.
2.3 Procedure for CFD simulation
The FO water separation process involves complex physicochemical phenomena. However, a simplified computational model was developed by adopting the following assumptions to focus solely on water transport driven by osmotic pressure differences: –
• Steady-state
• Isothermal conditions
• Incompressible flow
• Negligible gravity
• Constant density and viscosity
• FS and DS areas show laminar flow (Re < 2000)
• Thermodynamic equilibrium is present at the interfacial parts of the active layer of FO membranes.
In the ANSYS Fluent model, the pressure-based solver under steady state and viscous laminar flow model were chosen as per the assumptions. A generalised non-Darcy porous medium model was developed and employed to account for variable porosity conditions, ranging from Darcy flow in densely packed media to free fluid flow in the absence of a solid matrix. All cell zones in the CFD model were defined as fluid domains. The membrane region was modelled as a saturated porous medium, with membrane-specific properties and experimentally obtained porosity values from (Venkatesh et al., 2024) applied to each sample. Permeability was defined based on porosity and particle size. In this study, solid matrix drag effects were neglected in both the DS and FS regions. Within the membrane, where pore sizes are small, a linear drag term was applied. Consequently, the standard Navier–Stokes equations were solved in the FS and DS domains, while flow within the membrane was governed by the non-Darcy-based model. The osmotic pressure across the membrane was equated to the static pressure difference between FS and DS. The governing equations of continuity for the FS and DS are given as follows (Nithiarasu et al., 1996; Nithiarasu et al., 1997; Nithiarasu et al., 2002; ANSYS Inc, 2009):
Where,
The equations of momentum (Navier-Stokes equations) for the FS and DS are as shown below (Nithiarasu et al., 1996; Nithiarasu et al., 1997; Nithiarasu et al., 2002; ANSYS Inc, 2009):
Where,
In Fluent, the addition of a source term related to pressure drop due to the solid matrix is often implemented to model porous media. This source term, which is included in the standard equations of fluid flow, comprises two parts: (1) a viscous loss term representing the Darcy law model pressure drop; (2) an inertial loss term. The complete form of the source term is shown below (Nithiarasu et al., 1996; Nithiarasu et al., 1997; Nithiarasu et al., 2002; ANSYS Inc, 2009):
Where Si (Pa/m) represents the ith momentum equation source term, ρ (kg/m3) is the FS density, μ (kg/m.s) represents the FS viscosity, α (m2) represents the membrane permeability, C2 (m−1) denotes the factor denoting the inertial resistance (Nithiarasu et al., 1997). In laminar seepage flow through densely packed porous media, the velocity and pressure drop are directly proportional, and the constant C2 is taken as zero. The Darcy model for porous medium estimates pressure drop per unit length across the medium as shown below (Nithiarasu et al., 1996; Nithiarasu et al., 1997; Nithiarasu et al., 2002; ANSYS Inc, 2009):
Where,
C2 = 0.
CFD simulations were performed using ANSYS Fluent 18.1. The geometric model (Figure 5a) comprises FS and DS chambers separated by a flat FO membrane of the same dimensions as in the experimental setup. Meshing was carried out using the ANSYS meshing module (Figure 5b) with two mesh interfaces defined between the membrane and the FS/DS domains. All 8 membrane samples were simulated, and their properties are summarised in Table 5. The velocity inlet boundary conditions were assigned to both the FS and the DS at a uniform flow velocity of 0.0067 m/s, matching the experimental setup. Pressure outlet conditions were used at the exits of both channels. Non-membrane walls were treated as no-slip surfaces, while the membrane surface was modelled as a permeable wall allowing flow in the Y-direction (normal to the membrane).
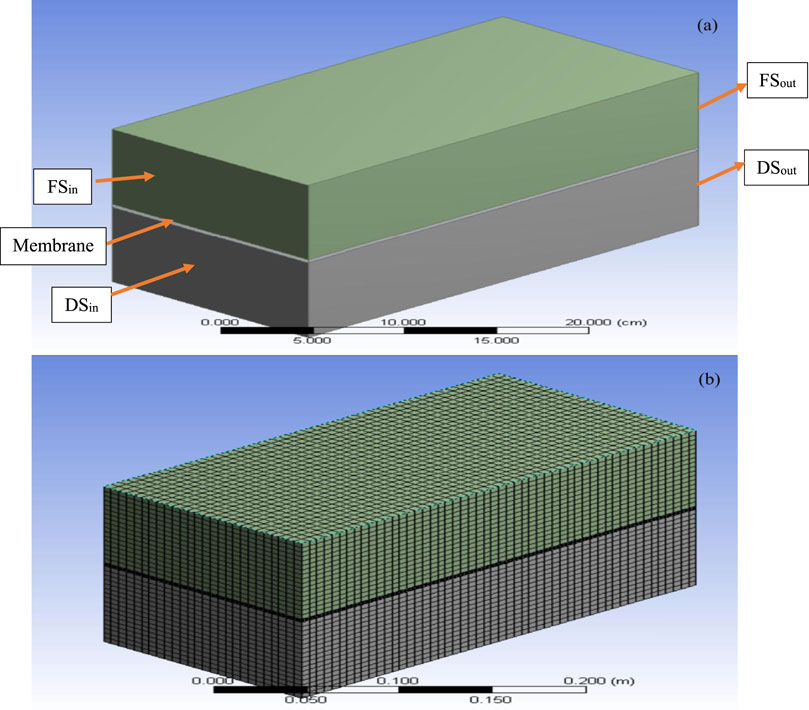
Figure 5. FO chamber (a) Geometric model for the CFD analysis; (b) Model with mesh.
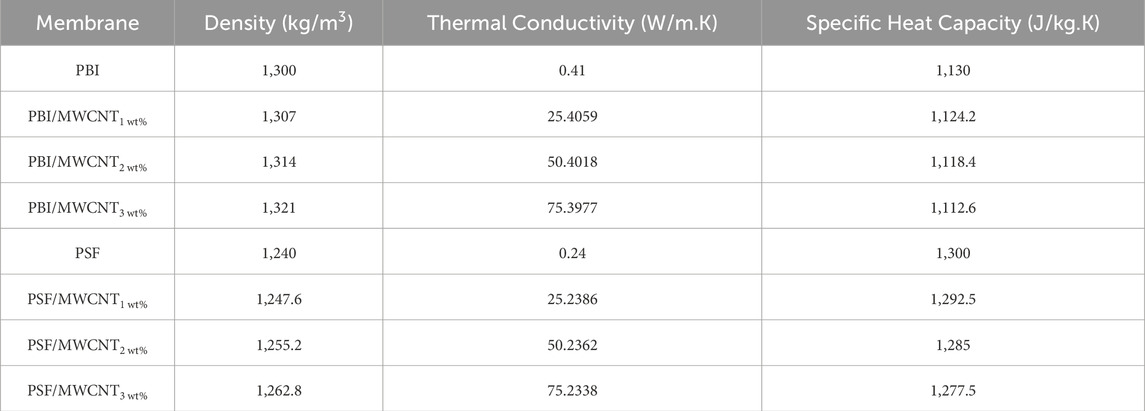
Table 5. Properties of PBI and PSF membranes used for the CFD analysis (MatWeb, 2025; AZOMaterials, 2003; NETZSCH, 2025; Kern, 2025).
The Reynolds numbers (ReL) for the CFD analysis were calculated for both FS and DS using the formula ReL =
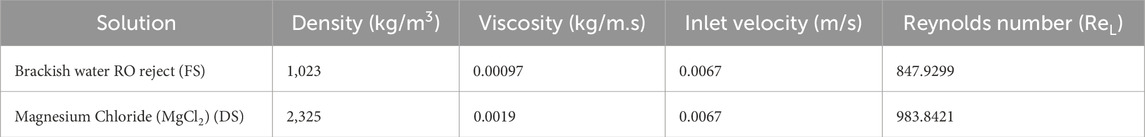
Table 6. Properties of brackish water RO reject, MgCl2, inlet velocity and the estimated Reynolds number values (ToolBox, 2025a; ToolBox, 2025b; North American Salt Company, 2025; Wang et al., 2024).
The simulation used the SIMPLE algorithm with a least-squares cell-based gradient method. Convergence criteria were set with residuals of 10−5 for the velocity and continuity components, and 10−8 for the energy component. For incompressible flow, the pressure field was resolved by setting a reference pressure; in this case, the FS reference pressure was set higher than that of the DS, with the pressure difference representing the osmotic pressure. The osmotic pressure differential drives water transport across the membrane from FS to DS. Experimentally determined porosity values from (Venkatesh et al., 2024) were incorporated to estimate WF. Salt transport was not considered for the sake of simplicity.
3 Results and discussions
The values of porosity obtained from the experimental study and the properties of the membrane samples presented in the previous section are used in the CFD analysis. The results of the CFD analysis and their validation with the experimental data are presented in this section.
3.1 Mesh independence test
In the CFD analysis, the mesh independence test was conducted by varying the number of mesh volume elements from 78,592 to 177,892, as given in Table 7, with mesh refinement applied primarily in the direction normal to the membrane. Figures 6a,b show the variation in velocity output of the FS and DS, respectively, as a function of the number of mesh volume elements. The input parameters used for the mesh independence test are listed in the figure itself. Significant changes in the output velocity of the DS were observed up to Mesh 3 (113,657 volume elements), beyond which further refinement (Mesh 4 and Mesh 5) yielded negligible differences. Thus, Mesh 3 was selected as the optimal mesh, balancing computational accuracy, efficiency and economy.
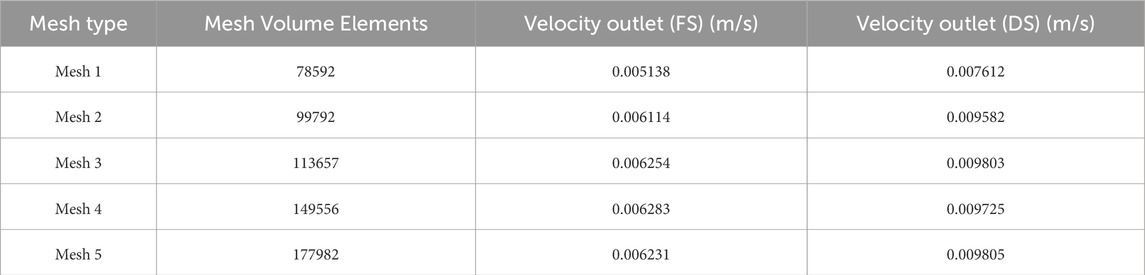
Table 7. Mesh independence test results for PBI/MWCNT2wt% membrane listing the values of the mesh volume elements, and velocity outlets of FS and DS.
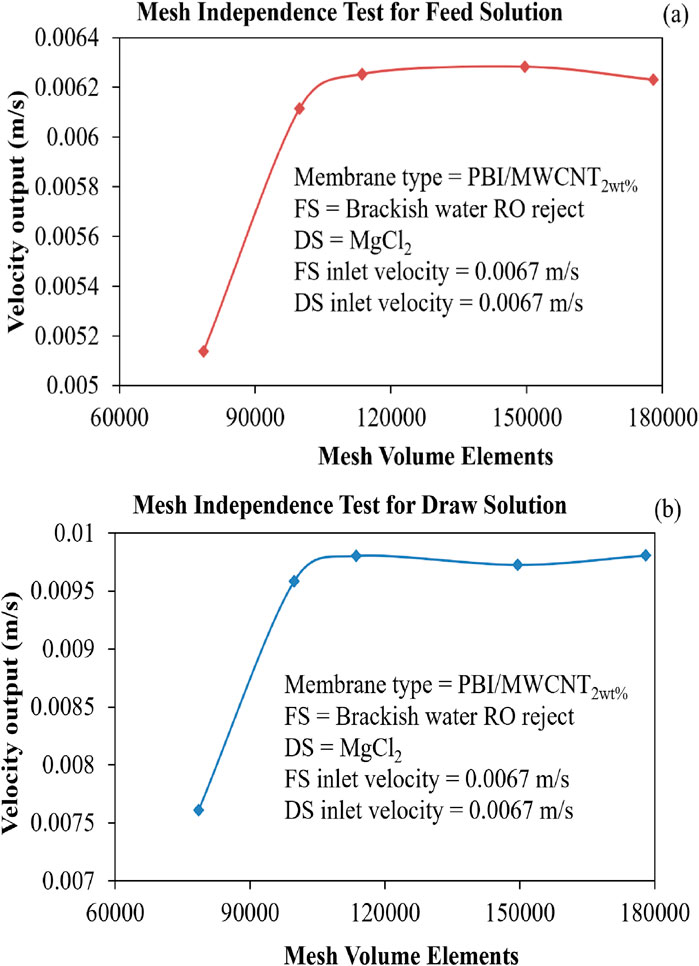
Figure 6. (a) Velocity output of the FS for various mesh volume elements. (b) Velocity output of the DS for various mesh volume elements.
3.2 Velocity contours
The post-processed CFD velocity contours for the PBI membranes are shown in Figures 7a–d, while the velocity contours for the PSF membranes are shown in Figures 8a–d. These figures reveal that the direction of the flow is from the brackish water RO reject (FS) to 2M MgCl2 (DS) solution and that the FS travels normal to the membrane (Y-axis). It is evident from this observation that as the brackish water RO reject flows from the inlet to the outlet in the top FS portion, there is a gradual decrease in velocity. This is due to the uniform normal flow of the water through the membrane into the DS. Similarly, as MgCl2 flows from the inlet to the outlet in the bottom DS portion, a continuous uniform increase in velocity is observed, which is due to the osmotic flow of water drawn from the FS through the membrane.
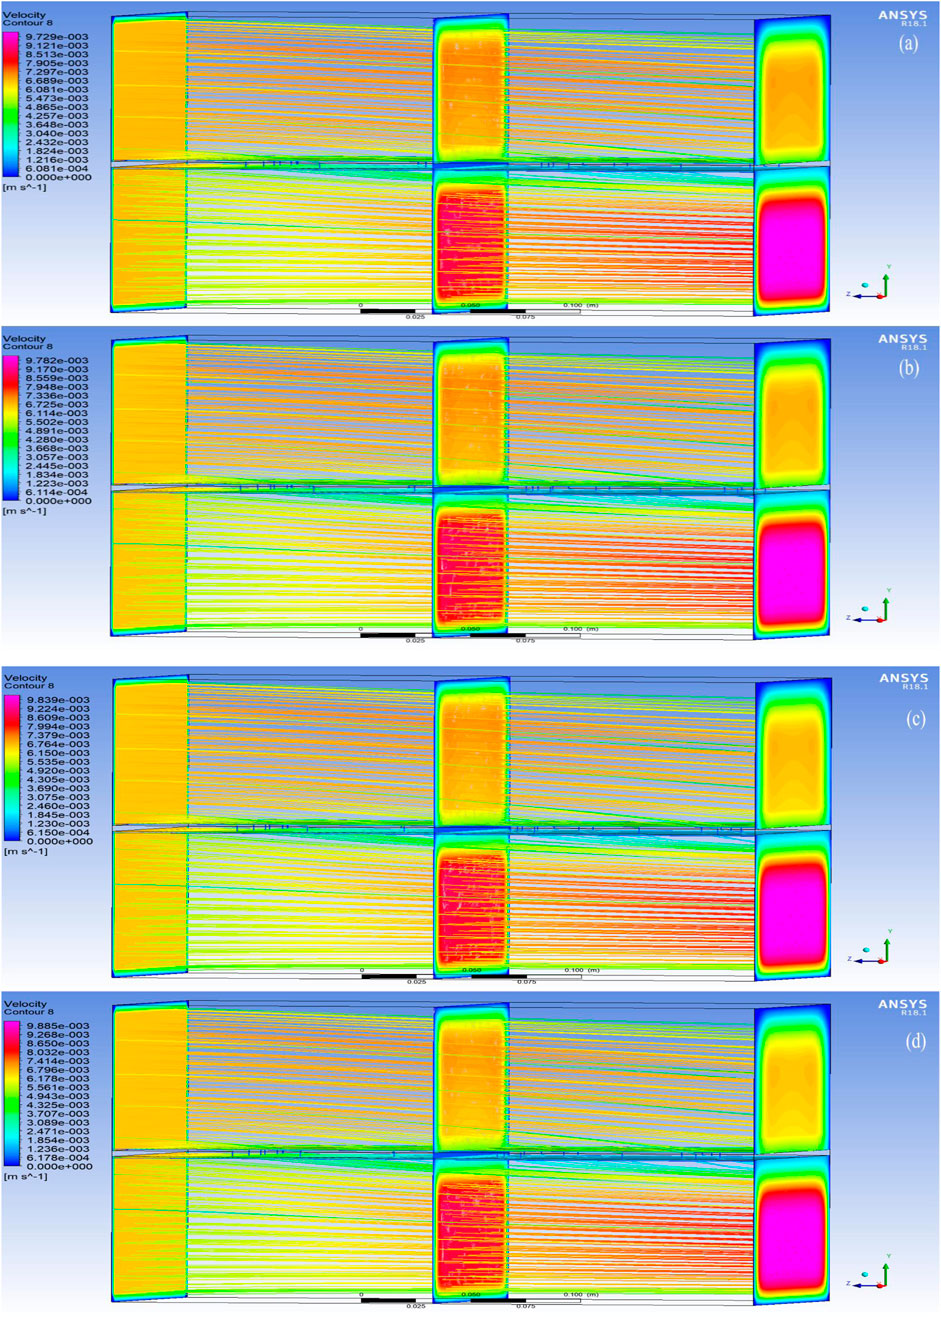
Figure 7. Velocity contours in the region of analysis using PBI membranes (a) with 0 wt% of MWCNT; (b) 1 wt% of MWCNT. Velocity contours in the region of analysis using PBI membranes (c) with 2 wt% of MWCNT; (d) with 3 wt% of MWCNT.
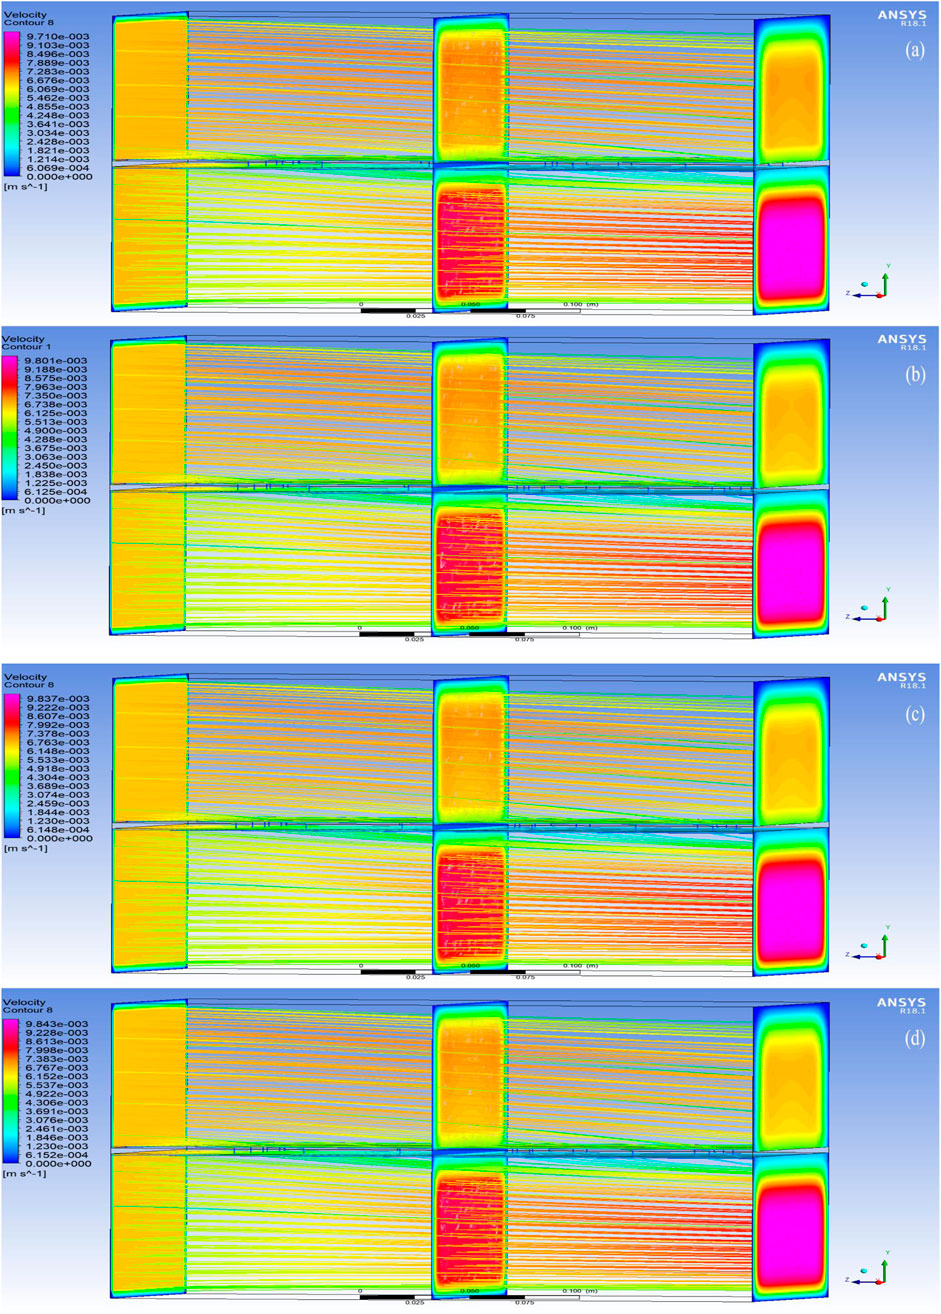
Figure 8. Velocity contours in the region of analysis using PSF membranes (a) with 0 wt% of MWCNT; (b) with 1 wt% of MWCNT. Velocity contours in the region of analysis using PSF membranes (c) with 2 wt% of MWCNT; (d) with 3 wt% of MWCNT.
The velocity increase in PBI is observed to be marginally higher than PSF, indicating the effect of the better hydrophilicity of PBI due to its affinity for water, high intermolecular π–π bonds between PBI and MWCNTs, and the interaction of the nitrogen atoms on its imidazole ring with water, thereby forming hydrogen bonds. This indicates that the FO process is taking place due to osmotic pressure difference, and it is also clearly depicted by the velocity orientations in the predicted results.
3.3 Osmotic pressure gradient
The osmotic pressure differences obtained from the CFD simulations, the values of C0 from Equation 6 of the CFD analysis used for calculating WF and the maximum penetration depth (Δ) of the FS into the DS domain are presented in Table 8. As the wt% of MWCNT increases, the values of C0 decrease while the values of Δ slightly increase. As a result of higher hydrophilicity, the osmotic pressure gradient slightly decreases with an increase in MWCNT concentration; consequently, an enhanced amount of water transport occurs through the membrane, with PBI having more effect than PSF due to the hydrogen bonding and π–π interactions between PBI and MWCNT.
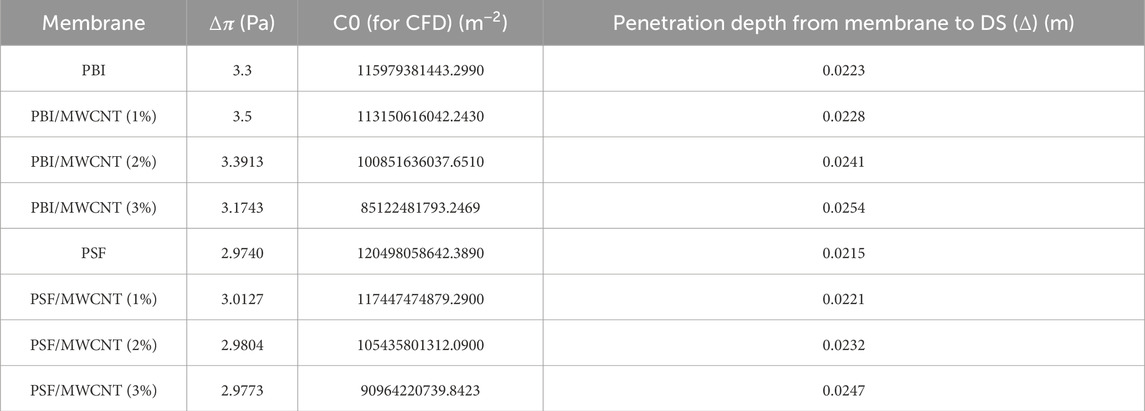
Table 8. Values of osmotic pressure gradient, C0 and maximum penetration depth (Δ) for the various PSF and PBI membranes.
The osmotic pressures are plotted along the direction of the flow of the FS and DS (denoted as X) in Figures 9a–d for PBI membranes and Figures 10a–10d for PSF membranes. The figures show that the pressure gradient is well-represented in the simulations. A marginally higher osmotic pressure gradient is seen when PBI membranes were tested as compared to when PSF membranes were tested, which signifies a greater tendency for water recovery from brackish water RO reject as it travels from FS to DS through the membrane. Despite using a simplified porous medium model for the FO domain, the CFD results show good agreement with the experimental data, validating the approach of the model.
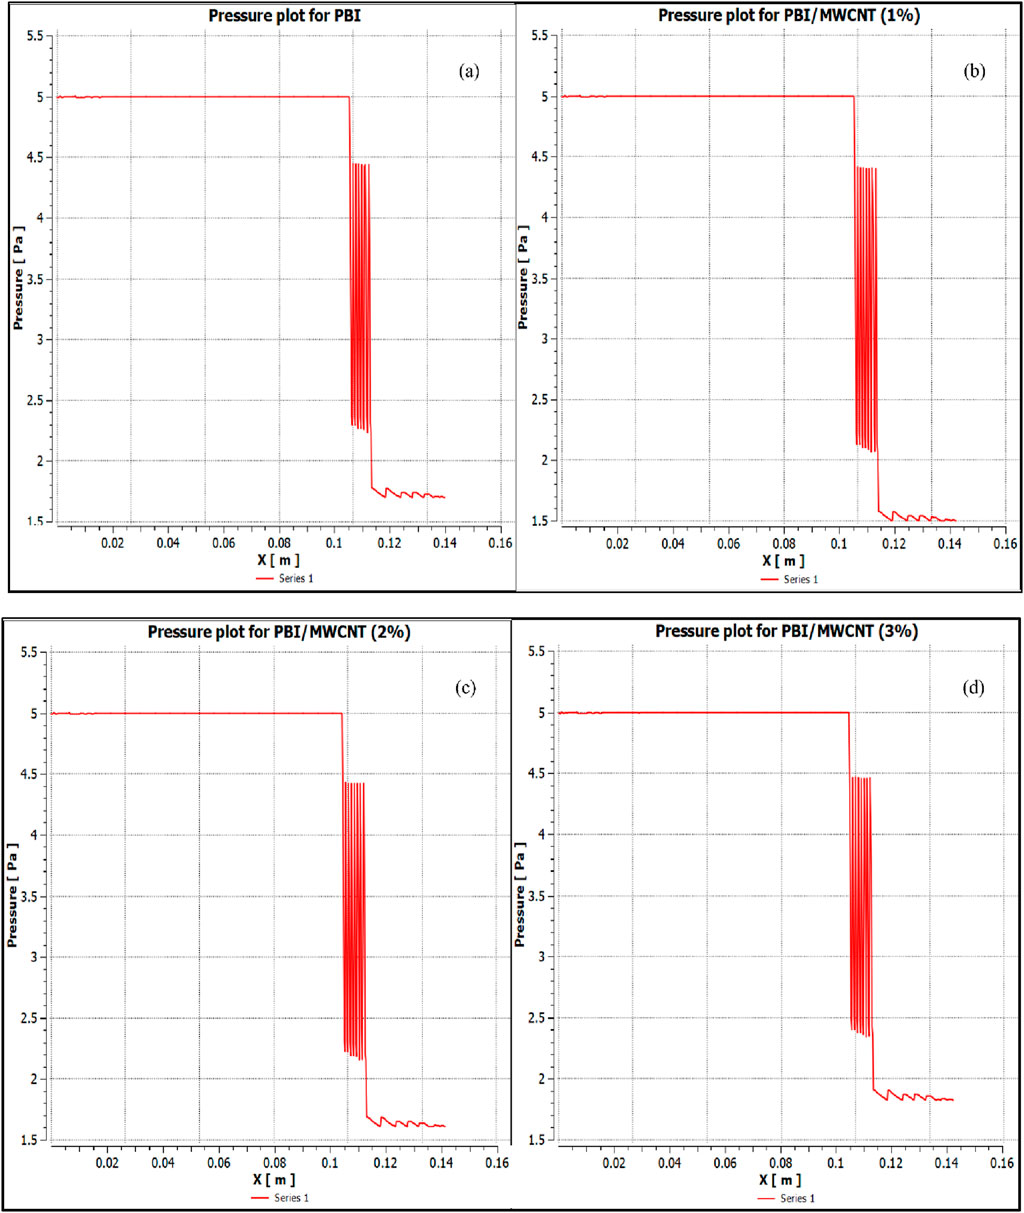
Figure 9. Variation of osmotic pressure along the direction of the flow (denoted as X) for PBI membranes (a) with 0 wt% of MWCNT; (b) with 1 wt% of MWCNT. Variation of osmotic pressure along the direction of the flow (denoted as X) for PBI membranes (c) with 2 wt% of MWCNT; (d) with 3 wt% of MWCNT.
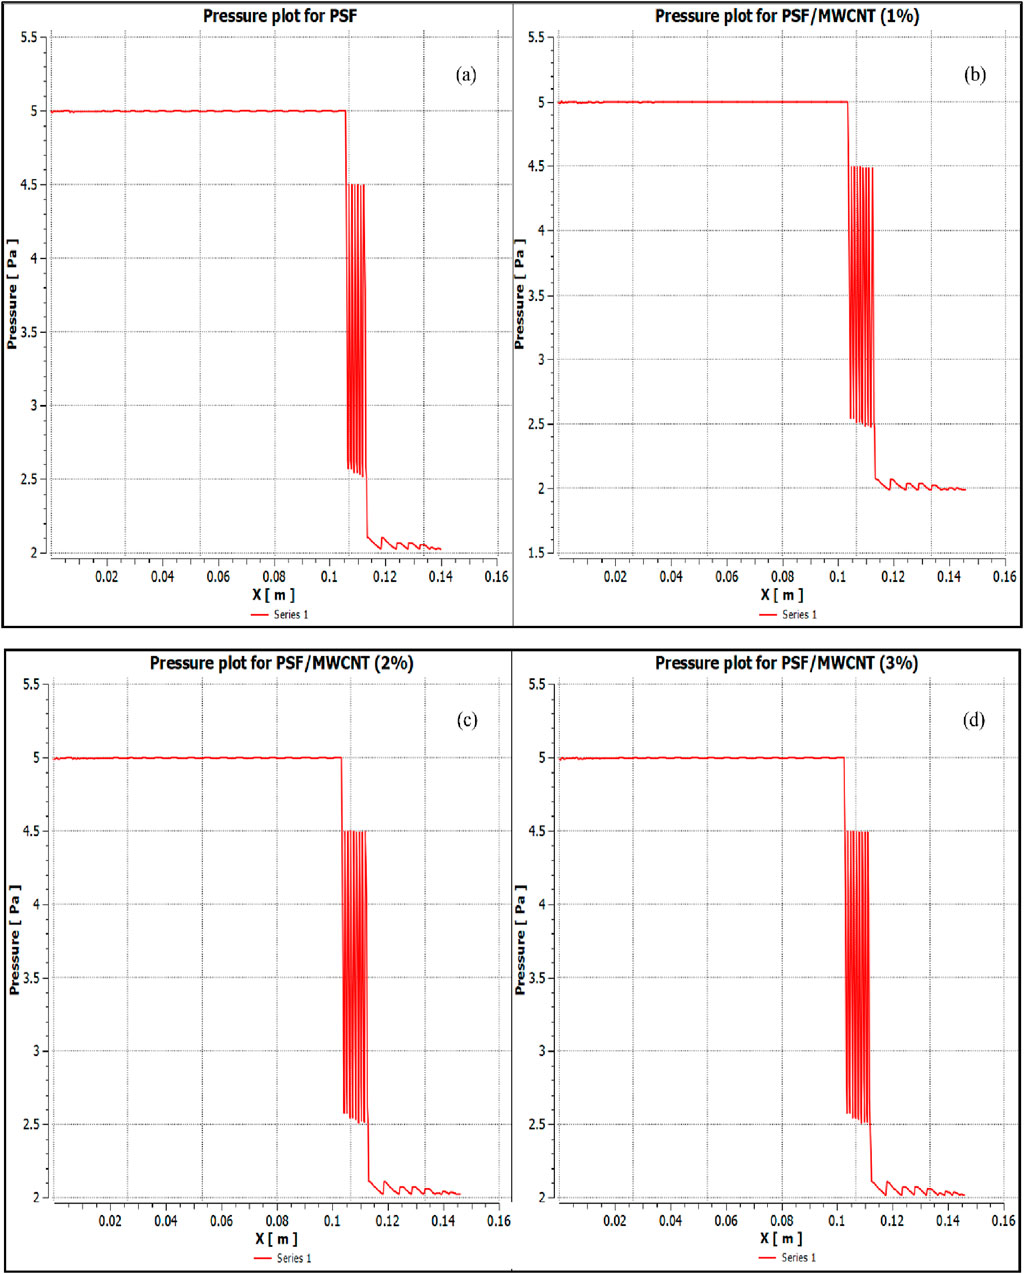
Figure 10. Variation of osmotic pressure along the direction of the flow (denoted as X) for PSF membranes (a) with 0 wt% of MWCNT; (b) 1 wt% of MWCNT. Variation of osmotic pressure along the direction of the flow (denoted as X) for PSF membranes (c) with 2 wt% of MWCNT; (d) with 3 wt% of MWCNT.
3.4 Validation of CFD results
The CFD-predicted WF values for PSF and PBI membranes are compared with the experimental data from (Venkatesh et al., 2024) in Figures 11a,b, respectively. Considering the assumptions made and the incorporation of effective parameters such as porosity, the CFD results closely align with the experimental values. Given that the experimental data were derived from multiple repetitions, the CFD model reliably and accurately captures the FO process. It is seen from Figure 11a that the WF increases from 22.9 to 30.4 L/m2.hr or LMH as the concentration of MWCNT increases from 0 to 3 wt% for PSF membranes. In all the cases, the CFD results are marginally higher than the experimental results, with the WF values increasing from 23 to 30.7 LMH. The maximum variation is 0.4 LMH for the case with PSF/MWCNT2 wt% membrane.
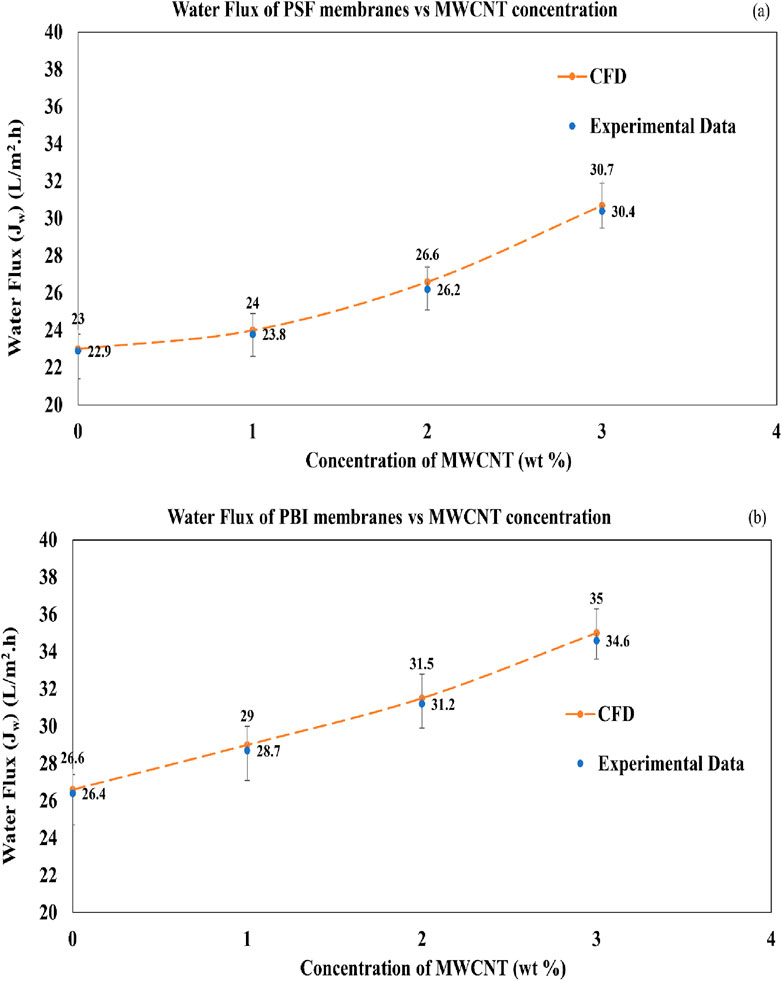
Figure 11. (a) Comparison of WF in the PSF membranes. (b) Comparison of WF in the PBI membranes.
In the case of PBI membranes in Figure 11b, the WF increases from 26.4 to 34.6 LMH as the concentration of MWCNT increases from 0 to 3 wt%. Similar to the PSF membranes, the CFD results are marginally higher than the experimental results, with the WF values increasing from 26.6 to 35 LMH for PBI membranes. The maximum variation is 0.4 LMH for the case with PBI/MWCNT3 wt% membrane. The minor variations between the experiment and CFD values for the PSF, PSF/MWCNT, PBI and PBI/MWCNT membranes could be attributed to the fact that the CFD model considers only water transport across the membrane and does not take into account the salt transport.
The incorporation of MWCNTs enhances the hydrophilicity of both PSF and PBI membranes. However, the increase in porosity and decrease in contact angle values reported earlier in the membrane characterisation section confirm that PBI exhibits better hydrophilicity and WF than PSF. Furthermore, the effects of hydrogen bonding and strong π–π bonds between PBI and MWCNTs lead to a gradual increase in WF, making PBI and PBI/MWCNT membranes better-performing membranes than PSF and PSF/MWCNT membranes. Thus, the CFD results are validated with the experimental results.
The CFD results are validated with the experimental data by showing that the velocity and WF increase uniformly with the addition of MWCNT wt%. The effect of increasing hydrophilicity and osmotic pressure gradient signifies a greater tendency for the PSF and PBI membranes to facilitate water transport from FS to DS. PBI and PBI/MWCNT membranes are found to exhibit better performance than PSF and PSF/MWCNT membranes since PBI displays a high affinity for water, strong intermolecular π–π bonding between PBI and MWCNTs, and the interaction of its nitrogen atoms on its imidazole ring with water forming hydrogen bonds, making it more effective.
4 Conclusion
In this study, TFC and TFN FO membranes based on PSF and PBI, incorporated with different concentrations of MWCNT (0–3 wt%), were already developed in an experimental study by the same research group in (Venkatesh et al., 2024). These results were reported, and their performances were evaluated using CFD analysis. Brackish water RO reject and 2M MgCl2 were used as FS and DS, respectively. The key observations and the major outcome of the present research are presented below:
1. The mesh independence test revealed that Mesh 3 (with 113,657 volume elements) yielded optimal results, balancing the computational accuracy and efficiency.
2. The WF through the membrane is captured well in the CFD analysis, which is evident from the gradual decrease in FS velocity and gradual increase in the DS velocity.
3. The values of C0 decrease, and the values of Δ slightly increase with an increase in MWCNT concentration. In the case of osmotic pressure gradient, an increase is observed until 1 wt% of MWCNT, and then it decreases with an increase in MWCNT concentration. However, as a result, the WF increases with an increase in MWCNT concentration in both PSF and PBI membranes due to effective hydrogen bonding.
4. The WF in the PBI and PBI/MWCNT membranes have more effect than the PSF and PSF/MWCNT membranes due to its affinity for water, the π–π bonds between PBI and MWCNT, and the interaction of nitrogen atoms on its imidazole ring with water, forming hydrogen bonds.
5. The PBI/MWCNT2 wt% membrane showed the overall best performance, with a simulated WF of 31.5 LMH, closely matching the experimental value of 31.2 ± 0.4 LMH. The maximum error in WF is 0.4 LMH for both PSF and PBI membranes (which is 1.15% of its maximum value). Hence, it is ensured that the procedure adopted in the CFD analysis can be extended for any FO membrane analysis with good accuracy.
The results presented in this research are useful in FO–RO hybrid integration, wastewater and saltwater treatment, and other industrial applications. However, the commercial acceptance depends on the cost, scalability and integration challenges for the particular application. The limitations in the CFD analysis due to the assumptions such as laminar flow, steady state, isothermal system, incompressible fluids and no salt transport may be minimised in future works by increasing the complexity of the CFD model.
Data availability statement
The original contributions presented in the study are included in the article/supplementary material, further inquiries can be directed to the corresponding author.
Author contributions
SV: Data curation, Writing – original draft, Conceptualization, Software, Visualization, Investigation, Methodology, Validation, Resources, Writing – review and editing. VP: Formal Analysis, Supervision, Project administration, Conceptualization, Writing – review and editing, Investigation, Validation. RV: Writing – review and editing, Project administration, Software, Formal Analysis, Conceptualization, Investigation. TS: Validation, Writing – review and editing, Investigation, Supervision, Software, Formal Analysis, Methodology.
Funding
The author(s) declare that no financial support was received for the research and/or publication of this article.
Acknowledgments
The SWRO Nemmeli Seawater Desalination Plant (P63G + G86, SH 49, Sulerikadu, Nemmeli, Vadanemmeli, Tamil Nadu 603104) personnel are acknowledged by the authors for their analysis of the quality of the DS (after the FS passed through the membrane) and the brackish water RO reject. The Chemplast Sanmar ZLD Research Laboratory staff at IIT Madras, Chennai, are also acknowledged by the authors for their prompt assistance with this study.
Conflict of interest
The authors declare that the research was conducted in the absence of any commercial or financial relationships that could be construed as a potential conflict of interest.
Generative AI statement
The author(s) declare that no Generative AI was used in the creation of this manuscript.
Publisher’s note
All claims expressed in this article are solely those of the authors and do not necessarily represent those of their affiliated organizations, or those of the publisher, the editors and the reviewers. Any product that may be evaluated in this article, or claim that may be made by its manufacturer, is not guaranteed or endorsed by the publisher.
References
Abbas, T. K., Rashid, K. T., Al-Saady, S., Alsarayrehd, A. A., Figoli, A., and AlSalhy, Q. F. (2023). Decontamination of aqueous nuclear waste via pressure-driven membrane application – a short review. Eng. Technol. J. 41 (9), 1–23. doi:10.30684/etj.2023.140193.1454
Aende, A., Gardy, J., and Hassanpour, A. (2020). Seawater desalination: a review of forward osmosis technique, its challenges, and future prospects. Processes 8 (8), 901. doi:10.3390/pr8080901
Akhtar, F. H., Kumar, M., Villalobos, L. F., Vovusha, H., Shevate, R., Schwingenschlogl, U., et al. (2017). Polybenzimidazole-based mixed membranes with exceptionally high water vapor permeability and selectivity. J. Mater. Chem. A 5, 21807–21819. doi:10.1039/C7TA05081J
Akther, N., Daer, S., Wei, Q., Janajreh, I., and Hasan, S. W. (2019). Synthesis of polybenzimidazole (PBI) forward osmosis (FO) membrane and computational fluid dynamics (CFD) modeling of concentration gradient across membrane surface. Desalination 452, 17–28. doi:10.1016/j.desal.2018.11.003
Alkaisi, A., Mossad, R., and Sharifian-Barforoush, A. (2017). A review of the water desalination systems integrated with renewable energy. Energy Procedia 110, 268–274. doi:10.1016/j.egypro.2017.03.138
Aloitaibi, A., Ibrahim, O. M., and Salamah, F. H. (2024). Energy and exergy analysis of three major recirculating multi-stage flashing desalination plants in Kuwait. J. Eng. Res. 123 (2), 938–948. doi:10.1016/j.jer.2024.01.019
Altaee, A., and Hilal, N. (2015). High recovery rate NF–FO–RO hybrid system for inland brackish water treatment. Desalination 363, 19–25. doi:10.1016/j.desal.2014.12.017
Amarasinghe, U. A., and Smakhtin, V. (2014). Water productivity and water footprint: misguided concepts or useful tools in water management and policy? Water Int. 39 (7), 1000–1017. doi:10.1080/02508060.2015.986631
Amini, M., Jahanshahi, M., and Rahimpour, A. (2013). Synthesis of novel thin film nanocomposite (TFN) forward osmosis membranes using functionalized multi-walled carbon nanotubes. J. Membr. Sci. 435, 233–241. doi:10.1016/j.memsci.2013.01.041
ANSYS Inc (2009). ANSYS FLUENT 12.0/12.1 documentation, ANSYS FLUENT 12.0 user's guide: cell zone and boundary conditions, Canonsburg, PA: ANSYS Inc. Available online at: https://www.afs.enea.it/project/neptunius/docs/fluent/html/ug/main_pre.htm (Accessed 2 May 2025).
Arjmandi, M., Peyravi, M., Altaee, A., Arjmandi, A., Chenar, M. P., Jahanshahi, M., et al. (2020). A state-of-the-art protocol to minimize the internal concentration polarization in forward osmosis membranes. Desalination 480, 114355. doi:10.1016/j.desal.2020.114355
AZOMaterials (2003). Supplier data – polybenzimidazole (PBI) (goodfellow). Available online at: https://www.azom.com/article.aspx?ArticleID=1866 (Accessed July 1, 2025).
Biesheuvel, P. M., Porada, S., Elimelech, M., and Dykstra, J. E. (2022). Tutorial review of reverse osmosis and electrodialysis. J. Membr. Sci. 647, 120221. doi:10.1016/j.memsci.2021.120221
Cath, T. Y., Childress, A. E., and Elimelech, M. (2006). Forward osmosis: principles, applications, and recent developments. J. Membr. Sci. 281 (1–2), 70–87. doi:10.1016/j.memsci.2006.05.048
Chung, T. S., Zhang, S., Wang, K. Y., Su, J., and Ling, M. M. (2012). Forward osmosis processes: yesterday, today, and tomorrow. Desalination 287, 78–81. doi:10.1016/j.desal.2010.12.019
Curto, D., Franzitta, V., and Guercio, A. (2021). A review of the water desalination technologies. Appl. Sci. 11 2, 670. doi:10.3390/app11020670
Daer, S., Akther, N., Wei, Q., Shon, H. K., and Hasan, S. W. (2020). Influence of silica nanoparticles on the desalination performance of forward osmosis polybenzimidazole membranes. Desalination 491, 114441. doi:10.1016/j.desal.2020.114441
Darabi, R. R., Jahanshahi, M., and Peyravi, M. (2018). A support assisted by photocatalytic Fe3O4/ZnO nanocomposite for thin-film forward osmosis membrane. Chem. Eng. Res. Des. 133, 11–25. doi:10.1016/j.cherd.2018.02.029
Datsyuk, V., Svitlana, T., and Stephanie, R. (2013). Formation of graphitic rods in carbon/carbon composites reinforced with carbon nanotubes. Carbon 52, 617–620. doi:10.1016/j.carbon.2012.10.010
Ding, J., Sarrigani, G. V., Khan, H. J., Yang, H., Sohimi, N. A., Zaman, NZIS, et al. (2020). Designing hydrogel-modified cellulose triacetate membranes with high flux and solute selectivity for forward osmosis. Industrial & Eng. Chem. Res. 59 (47), 20845–20853. doi:10.1021/acs.iecr.0c03977
El-Ghzizel, S., Zeggar, H., Elmidaoui, A., and Taky, M. (2024). Nanofiltration powered by renewable energy for softening of slightly brackish-nitrated groundwater: sustainability study. J. Water Process Eng. 60, 105223. doi:10.1016/j.jwpe.2024.105223
Elsayed, M. L., Mesalhy, O., Mohammed, H. R., and Chow, L. C. (2019). Transient and thermo-economic analysis of MED-MVC desalination system. Energy 167, 283–296. doi:10.1016/j.energy.2018.10.145
Emadzadeh, D., Lau, W. J., Matsuura, T., Ismail, A. F., and Rahbari-Sisakht, M. (2014). Synthesis and characterization of thin film nanocomposite forward osmosis membrane with hydrophilic nanocomposite support to reduce internal concentration polarization. J. Membr. Sci. 449, 74–85. doi:10.1016/j.memsci.2013.08.014
Famiglietti, J. S. (2014). The global groundwater crisis. Nat. Clim. Change 4 (11), 945–948. doi:10.1038/nclimate2425
Febriasari, A., Huriya, A. A. H., Suhartini, M., and Kartohardjono, S. (2021). Polysulfone–polyvinyl pyrrolidone blend polymer composite membranes for batik industrial wastewater treatment. Membranes 11 (1), 66–83. doi:10.3390/membranes11010066
Ghanbari, M., Emadzadeh, D., Lau, W. J., Riazi, H., Almasi, D., and Ismail, A. F. (2016). Minimizing structural parameter of thin film composite forward osmosis membranes using polysulfone/halloysite nanotubes as membrane substrates. Desalination 377, 152–162. doi:10.1016/j.desal.2015.09.019
Gleick, P. H. (2014). Water, drought, climate change, and conflict in Syria. Weather, Clim. Soc. 6 (3), 331–340. doi:10.1175/WCAS-D-13-00059.1
Grover, V. I. (2006). Water: global common and global problems. 1st ed. Boca Raton, FL: Science Publishers, 16–235. doi:10.1201/b11005
Gruber, M. F., Johnson, C. J., Tang, C. Y., Jensen, M. H., Yde, L., and Hélix-Nielsen, C. (2011). Computational fluid dynamics simulations of flow and concentration polarization in forward osmosis membrane systems. J. Membr. Sci. 1–2 (379), 488–495. doi:10.1016/j.memsci.2011.06.022
Hawari, A. H., Hafiz, M. A., Yasir, A. T., Alfahel, R., and Altaee, A. (2020). Evaluation of ultrafiltration and multimedia filtration as pretreatment process for forward osmosis. Desalination Water Treat. 196, 84–92. doi:10.5004/dwt.2020.25941
Jain, H., and Garg, M. C. (2021). Fabrication of polymeric nanocomposite forward osmosis membranes for water desalination – a review. Environ. Technol. & Innovation 23, 101561–27. doi:10.1016/j.eti.2021.101561
Jang, J., Park, I., Chee, S.-S., Song, J.-H., Kang, Y., Lee, C., et al. (2019). Graphene oxide nanocomposite membrane cooperatively cross-linked by monomer and polymer overcoming the trade-off between flux and rejection in forward osmosis. J. Membr. Sci. 598, 117684. doi:10.1016/j.memsci.2019.117684
Johnson, D. J., Suwaileh, W. A., Mohammed, A. W., and Hilal, N. (2017). Osmotic's potential: an overview of draw solutes for forward osmosis. Desalination 434, 100–120. doi:10.1016/j.desal.2017.09.017
Kahrizi, M., Lin, J., Ji, G., Kong, L., Song, C., Dumée, L. F., et al. (2020). Relating forward water and reverse salt fluxes to membrane porosity and tortuosity in forward osmosis: CFD modelling. Sep. Purif. Technol. 24, 116727. doi:10.1016/j.seppur.2020.116727
Kamel, A. H., Alsalhy, Q. F., Ibrahim, S. S., Faneer, K. A., Hashemifard, S. A., Jangizehi, A., et al. (2023). Novel sodium and potassium carbon quantum dots as forward osmosis draw solutes: synthesis, characterization and performance testing. Desalination 567, 116956. doi:10.1016/j.desal.2023.116956
Kariman, H., Shafieian, A., and Khiadani, M. (2023). Small scale desalination technologies: a comprehensive review. Desalination 567, 116985. doi:10.1016/j.desal.2023.116985
Kern (2025). Polysulfone (PSU). Available online at: https://www.kern.de/de/technical-datasheet/polysulfone-psu?n=2401_2 (Accessed July 1, 2025).
Khanzada, N. K., Khan, J. S., and Davies, P. A. (2017). Performance evaluation of reverse osmosis (RO) pre-treatment technologies for in-land brackish water treatment. Desalination 406, 44–50. doi:10.1016/j.desal.2016.06.030
Koutahzadeh, N., Esfahani, M. R., and Arce, P. E. (2016). Sequential use of UV/H2O2—(PSF/TiO2/MWCNT) mixed matrix membranes for dye removal in water purification: membrane permeation, fouling, rejection, and decolorization. Environ. Eng. Sci. 33 (6), 430–440. doi:10.1089/ees.2016.0023
Krishnan, J. N., Venkatachalam, K. R., Ghosh, O., Jhaveri, K., Palakodeti, A., and Nair, N. (2022). Review of thin film nanocomposite membranes and their applications in desalination. Front. Chem. 10, 781372. doi:10.3389/fchem.2022.781372
Kye, H., Kim, J., Ju, S., Lee, J., Lim, C., and Yoon, Y. (2023). Microplastics in water systems: a review of their impacts on the environment and their potential hazards. Heliyon 9 (3), e14359. doi:10.1016/j.heliyon.2023.e14359
Li, S., Li, Y., Shao, Y., and Wang, H. (2022). Emerging two-dimensional materials constructed nanofluidic fiber: properties, preparation and applications. Adv. Fiber Mater. 4, 129–144. doi:10.1007/s42765-021-00111-w
Liang, Y. Y., and Fletcher, D. F. (2023). Computational fluid dynamics simulation of forward osmosis (FO) membrane systems: methodology, state of art, challenges and opportunities. Desalination 549, 116359. doi:10.1016/j.desal.2022.116359
MatWeb (2025). PBI performance products. Available online at: https://www.matweb.com/search/datasheet_print.aspx?matguid=71aa916323654c6e9b450c6da27a5554 (Accessed July 1, 2025).
McCutcheon, J. R., and Elimelech, M. (2006). Influence of concentrative and dilutive internal concentration polarization on flux behavior in forward osmosis. J. Membr. Sci. 284 (1–2), 237–247. doi:10.1016/j.memsci.2006.07.049
McCutcheon, J. R., and Elimelech, M. (2007). Modeling water flux in forward osmosis: implications for improved membrane design. AIChE J. 53 (7), 1736–1744. doi:10.1002/aic.11197
McGinnis, R. L., and Elimelech, M. (2007). Energy requirements of ammonia–carbon dioxide forward osmosis desalination. Desalination 207 (1–3), 370–382. doi:10.1016/j.desal.2006.08.012
Mistry, K. H., Antar, M. A., and Lienhard, V. J. H. (2012). An improved model for multiple effect distillation. Desalination Water Treat. 51 (4–6), 807–821. doi:10.1080/19443994.2012.703383
Morales-Torres, S., Esteves, C. M., Figueiredo, J. L., and Silva, A. M. (2016). Thin-film composite forward osmosis membranes based on polysulfone supports blended with nanostructured carbon materials. J. Membr. Sci. 520, 326–336. doi:10.1016/j.memsci.2016.07.009
Mu, L., Chen, L., Lin, L., Park, Y. H., Wang, H., Xu, P., et al. (2021). An overview of solar still enhancement approaches for increased freshwater production rates from a thermal process perspective. Renew. Sustain. Energy Rev. 150, 111458. doi:10.1016/j.rser.2021.111458
NETZSCH (2025). PSU: polysulfone. Available online at: https://analyzing-testing.netzsch.com/en/polymers-netzsch-com/high-temperature-resistant-thermoplastics/psu-polysulfone (Accessed July 1, 2025).
Nithiarasu, P., Seetharamu, K. N., and Sundararajan, T. (1996). Double diffusive natural convection in an enclosure filled with fluid saturated porous medium: a generalized non-darcy approach. Numer. Heat Transf. Part A Appl. An Int. J. Comput. Methodol. 30 (4), 413–426. doi:10.1080/10407789608913848
Nithiarasu, P., Seetharamu, K. N., and Sundararajan, T. (1997). Natural convective heat transfer in a fluid saturated variable porosity medium. Int. J. Heat Mass Transf. 40 (16), 3955–3967. doi:10.1016/S0017-9310(97)00008-2
Nithiarasu, P., Seetharamu, K. N., and Sundararajan, T. (2002). Finite element modelling of flow, heat and mass transfer in fluid saturated porous media. Archives Comput. Methods Eng. 9 (1), 3–42. doi:10.1007/BF02736231
North American Salt Company (2025). MgCl2 magnesium chloride technical manual. Available online at: https://freezgard.com/sites/default/files/mgcl2_technical_manual.pdf (Accessed July 1, 2025).
Orfi, J., Sherif, R., and AlFaleh, M. (2025). Conventional and emerging desalination technologies: review and comparative study from a sustainability perspective. Water 17 (2), 279. doi:10.3390/w17020279
Park, J., and Jeong, Y. G. (2015). Investigation of microstructure and electric heating behavior of hybrid polymer composite films based on thermally stable polybenzimidazole and multiwalled carbon nanotube. Polymer 59, 102–109. doi:10.1016/j.polymer.2015.01.003
Park, M. J., Phuntsho, S., He, T., Nisola, G. M., Tijing, L. D., Li, X.-M., et al. (2015). Graphene oxide incorporated polysulfone substrate for the fabrication of flat-sheet thin-film composite forward osmosis membranes. J. Membr. Sci. 493, 496–507. doi:10.1016/j.memsci.2015.06.053
Parveen, F., and Hankins, N. (2018). Comparative performance of nanofiltration and forward osmosis membranes in a lab-scale forward osmosis membrane bioreactor. J. Water Process Eng. 28, 1–9. doi:10.1016/j.jwpe.2018.12.003
Porowski, A. (2019). “Mineral and thermal waters,” in Environmental geology, encyclopedia of sustainability science and technology series. Editor J. LaMoreaux (New York, NY: Springer). doi:10.1007/978-1-4939-8787-0_978
Qadir, M., Wichelns, D., Raschid-Sally, L., McCornick, P. G., Drechsel, P., Bahri, A., et al. (2010). The challenges of wastewater irrigation in developing countries. Agric. Water Manag. 97 (4), 561–568. doi:10.1016/j.agwat.2008.11.004
Rashed, A. O., Esawi, A. M., and Ramadan, A. R. (2020). Novel polysulfone/carbon nanotube-polyamide thin film nanocomposite membranes with improved water flux for forward osmosis desalination. ACS omega 5 (24), 14427–14436. doi:10.1021/acsomega.0c00973
Ren, J., Chowdhury, M. R., Xia, L., Ma, C., Bollas, G. M., and McCutcheon, J. R. (2020). A computational fluid dynamics model to predict performance of hollow fiber membrane modules in forward osmosis. J. Membr. Sci. 603, 117973. doi:10.1016/j.memsci.2020.117973
Sahebi, S., Kahrizi, M., Fadaie, N., Hadadpour, S., Ramavandi, B., and Gonzales, R. R. (2021). Developing a thin film composite membrane with hydrophilic sulfonated substrate on nonwoven backing fabric support for forward osmosis, Membranes, 11 (813), 813–820. doi:10.3390/membranes11110813
Sahebi, S., Phuntsho, S., Woo, Y. C., Park, M. J., Tijing, L. D., Hong, S., et al. (2016). Effect of sulphonated polyethersulfone substrate for thin film composite forward osmosis membrane. Desalination 389, 129–136. doi:10.1016/j.desal.2015.11.028
Salih, M. H., and Al-Alawy, A. F. (2022). MgCl2 and MgSO4 as draw agents in forward osmosis process for east Baghdad oilfield produced water treatment. Desalination Water Treat. 256, 80–88. doi:10.5004/dwt.2022.28408
Sewilam, H., and Al, B. G. (2023). Hybrid BWRO/FO system for high recovery in-land brackish water desalination: techno-economic assessment. Sustain. Water Resour. Manag. 9 (136), 136. doi:10.1007/s40899-023-00912-4
Shabani, Z., Kahrizi, M., Mohammadi, T., Kasiri, N., and Sahebi, S. (2021). A novel thin film composite forward osmosis membrane using bio-inspired polydopamine coated polyvinyl chloride substrate: experimental and computational fluid dynamics modelling. Process Saf. Environ. Prot. 47, 756–771. doi:10.1016/j.psep.2021.01.004
Shabib, A., Tatan, B., Elbaz, Y., Hassan, A. A., Hamouda, M. A., and Maraqa, M. A. (2025). Advancements in reverse osmosis desalination: technology, environment, economy, and bibliometric insights. Desalination 598, 118413. doi:10.1016/j.desal.2024.118413
Shah, A. A., Cho, Y. H., Choi, H., Nam, S.-E., Kim, J. F., Kim, Y., et al. (2019). Facile integration of halloysite nanotubes with bioadhesive as highly permeable interlayer in forward osmosis membranes. J. Industrial Eng. Chem. 73, 276–285. doi:10.1016/j.jiec.2019.01.039
Shahzamanian, B., Varga, S., Soares, J., Palmero-Marrero, A. I., and Oliveira, A. C. (2024). Theoretical performance assessment of a multi-effect distillation system integrated with thermal vapour compression unit running on solar energy. Int. J. Low-Carbon Technol. 19, 908–921. doi:10.1093/ijlct/ctae010
Shamet, O., and Antar, M. (2023). Mechanical vapor compression desalination technology – a review. Renew. Sustain. Energy Rev. 187, 113757. doi:10.1016/j.rser.2023.113757
Sirinupong, T., Youravong, W., Tirawat, D., Lau, W. J., Lai, G. S., and Ismail, A. F. (2017). Synthesis and characterization of thin film composite membranes made of PSF-TiO2/GO nanocomposite substrate for forward osmosis applications. Arabian J. Chem. 11 (7), 1144–1153. doi:10.1016/j.arabjc.2017.05.006
Solonchenko, K., Kirichenko, A., and Kirichenko, K. (2023). Stability of ion exchange membranes in electrodialysis. Membranes 13 (1), 52. doi:10.3390/membranes13010052
Sulaiman, R. R. R., Walvekar, R., Wong, W. Y., Khalid, M., and Pang, M. M. (2022). Proton conductivity enhancement at high temperature on polybenzimidazole membrane electrolyte with acid-functionalized graphene oxide fillers. Membranes 344 (12), 344–23. doi:10.3390/membranes12030344
Suryani, C. C.-M., Liu, Y.-L., and Lee, Y. M. (2011). Polybenzimidazole membranes modified with polyelectrolyte-functionalized multiwalled carbon nanotubes for proton exchange membrane fuel cells. J. Mater. Chem. 21 (20), 7480–7486. doi:10.1039/C1JM10439J
Suwaileh, W. A., Johnson, D. J., Sarp, S., and Hilal, N. (2018). Advances in forward osmosis membranes: altering the sub-layer structure via recent fabrication and chemical modification approaches. Desalination 436, 176–201. doi:10.1016/j.desal.2018.01.035
Tayeh, Y. A. (2024). A comprehensive review of reverse osmosis desalination: technology, water sources, membrane processes, fouling, and cleaning. Desalination Water Treat. 320, 100882. doi:10.1016/j.dwt.2024.100882
Toh, K. Y., Liang, Y. Y., Lau, W. J., and Weihs, G. A. F. (2020). A review of CFD modelling and performance metrics for osmotic membrane processes. Membranes 10 (285), 285–30. doi:10.3390/membranes10100285
ToolBox, E. (2025a). Seawater properties. Available online at: https://www.engineeringtoolbox.com/sea-water-properties-d_840.html (Accessed July 1, 2025).
ToolBox, E. (2025b). Inorganic compounds in water – melting and boiling temperature, density and solubility. Available online at: https://www.engineeringtoolbox.com/inorganic-salt-melting-boiling-point-water-solubility-density-liquid-d_1984.html (Accessed July 1, 2025).
Venkatesh, S. S., Pandiyarajan, V., Sundararajan, T., Velraj, R., and Mohan, D. R. (2024). Experimental investigation and comparison of PBI/MWCNT and PSF/MWCNT membranes for recovering water from RO reject of brackish water by FO. Heliyon 10 (7), e28455. doi:10.1016/j.heliyon.2024.e28455
Wang, K. Y., Weber, M., and Chung, T. S. (2022). Polybenzimidazoles (PBIs) and state-of-the-art PBI hollow fiber membranes for water, organic solvent and gas separations: a review. J. Mater. Chem. A 10, 8687–8718. doi:10.1039/D2TA00422D
Wang, S., Luo, M., Sun, Y., Wang, C., and Song, X. (2024). Experimental data and modeling of viscosity in the quinary system NaCl + KCl + CaCl2 + MgCl2 + H2O. J. Solut. Chem. 53, 1656–1673. doi:10.1007/s10953-024-01400-9
Wang, W.-Y., Shi, J.-Y., Wang, J.-L., Li, Y.-L., Gao, N.-N., Liu, Z.-X., et al. (2015). Preparation and characterization of PEG-gMWCNTs/PSf nano-hybrid membranes with hydrophilicity and antifouling properties. R. Soc. Chem. 5, 84746–84753. doi:10.1039/C5RA16077D
Yan, M., Shao, M., Li, J., Jiang, N., Hu, Y., Zeng, W., et al. (2023). Antifouling forward osmosis membranes by ε-polylysine mediated molecular grafting for printing and dyeing wastewater: preparation, characterization, and performance. J. Membr. Sci. 668, 121288. doi:10.1016/j.memsci.2022.121288
Zhao, S., Zou, L., and Mulcahy, D. (2012b). Brackish water desalination by a hybrid forward osmosis–nanofiltration system using divalent draw solute. Desalination 284, 175–181. doi:10.1016/j.desal.2011.08.053
Zhao, S., Zou, L., Tang, C. Y., and Mulcahy, D. (2012a). Recent developments in forward osmosis: opportunities and challenges. J. Membr. Sci. 396, 1–21. doi:10.1016/j.memsci.2011.12.023
Nomenclature
Symbols
π–π Pi bonding interactions
C2 Inertial resistance factor
Abbreviations
AL–FS Active layer facing the feed solution
CFD Computational fluid dynamics
CP Concentration polarisation
DI Deionised
DSC Differential scanning calorimetry
DMAc n-dimethylacetamide
DMF n, n-dimethylformamide
DS Draw solution
EDS Electrodialysis
ECP External concentration polarisation
FO Forward osmosis
FS Feed solution
ICP Internal concentration polarisation
IP Interfacial polymerisation
MED Multi-effect distillation
MSF Multi-stage flash distillation
MWCNT Multi-walled carbon nanotubes
NF Nanofiltration
MPD m-phenylenediamine
PBI Polybenzimidazole
PI Phase inversion
PSF Polysulfone
PVP Polyvinylpyrrolidone
RO Reverse osmosis
SEM Scanning electron microscope
SSD Solar still distillation
TEM Transmission electron microscope
TFC Thin-film composite membranes
TFN Thin-film nanocomposite membranes
TGA Thermogravimetric analysis
TMC Trimesoyl chloride
UF Ultrafiltration
VC Vapour compression
WF Water flux
XRD X-ray diffraction
Keywords: desalination, water treatment, nanoparticles, TFC, TFN
Citation: Venkatesh SS, Pandiyarajan V, Velraj R and Sundararajan T (2025) CFD analysis of PBI and PSF membranes with MWCNT for water recovery from brackish water RO reject by FO and validation with experimental results. Front. Energy Res. 13:1636293. doi: 10.3389/fenrg.2025.1636293
Received: 28 May 2025; Accepted: 15 July 2025;
Published: 30 July 2025.
Edited by:
Pinar Mert Cuce, Recep Tayyip Erdoğan University, TürkiyeReviewed by:
Samrendra Singh Thakur, Dr HariSingh Gour University, IndiaHarun Sen, Dokuz Eylul Universitesi, Türkiye
Copyright © 2025 Venkatesh, Pandiyarajan, Velraj and Sundararajan. This is an open-access article distributed under the terms of the Creative Commons Attribution License (CC BY). The use, distribution or reproduction in other forums is permitted, provided the original author(s) and the copyright owner(s) are credited and that the original publication in this journal is cited, in accordance with accepted academic practice. No use, distribution or reproduction is permitted which does not comply with these terms.
*Correspondence: S. S. Venkatesh, YXJ1bmExNTcyQGdtYWlsLmNvbQ==