 Xuan Liu
 Xinhua Liang2
 Zhongfu Tan
- 1Economic and Technology Research Institute, State Grid Jibei Electric Power Co. Ltd., Beijing, China
- 2State Grid Zhangjiakou Power Supply Company, Zhangjiakou, China
- 3School of Economics and Management, North China Electric Power University, Beijing, China
Under energy structure transformation and multi-energy complementary development, there is an urgent need to explore more efficient, clean and low-carbon integrated energy utilization. The micro-energy grid can realize the synergistic and complementary operation of electricity, thermal and cooling multi-energy systems through energy conversion and storage devices, thereby mitigating the intermittency of renewable generation and spatiotemporal imbalances in energy supply-demand. This paper develops a robust optimization model for micro-energy grids that accounts for demand response and carbon green certificate market participation. The study initially establishes demand response and carbon green certificate trading models to systematically evaluate their economic impacts on both microgrid and external energy systems. Subsequently, a deterministic operational optimization model is established for the micro-energy grid, aiming at net profit maximization. Finally, the study establishes a robust coefficient-based uncertainty set for WT and PV output fluctuations, facilitating the derivation of a robust optimization model for micro-energy grid. Case studies verify the model’s capability in addressing uncertainty-related operational challenges, maintaining reliable and economical operation of energy systems with enhanced robustness and economy.
1 Introduction
Depleting finite non-renewable fossil energy and their consequent ecological consequences, including environmental contamination and climate disruption, are related to the national economy and people’s livelihoods, and have become the challenges that the power and energy industries need to deal with urgently (Chen et al., 2021; Jiang et al., 2020). The development of micro-energy grids coupled with electricity, thermal and cooling is a crucial pathway for addressing energy demand while achieving decarbonization objectives, particularly in realizing the “dual carbon” targets of peak emissions and neutrality (Zhang et al., 2021b).
To maximize demand-side flexibility potential, facilitate energy system decarbonization, and alleviate clean energy output intermittency and the contradiction between spatial and temporal mismatch of energy supply and demand, scholars have carried out in-depth research on the relevant mechanisms and strategies. In unlocking the demand-side flexibility potential in regulation, literature (Fayiz et al., 2023) constructed a time-sharing pricing-induced demand response model and analyzed its effects on community microgrid scheduling optimization; literature (Kong et al., 2023) developed a neural intelligence-based real-time pricing mechanism for demand-side management, which realizes flexible and efficient real-time pricing; literature (Zhang et al., 2024) considered time-sharing price-based demand response (PBDR) for electricity and thermal, which further enhances wind power utilization in multi-energy systems; literature (An et al., 2023) constructed a price-based electricity load and a thermal load response model incorporating thermal inertia and ambiguity, respectively, corresponding to the differences in their respective energy transmission characteristics. The advancement of micro-energy grid technology has led to increasingly interconnected characteristics among diverse energy sources and loads. Literature (Zhang et al., 2021a; Zhang et al., 2023; Yang et al., 2021) had constructed integrated demand response models covering electricity, thermal, and natural gas energy factors. However, existing literature has not thoroughly explored the multi-energy coupling mechanisms, without fully considering the complementary and substitutable characteristics among multiple loads.
Furthermore, to effectively reduce carbon and develop low-carbon electricity, it is necessary to systematically incorporate carbon emission constraints in the optimization of micro-energy grid operation. Scholars have conducted in-depth studies on carbon green certificate trading. Literature (Jiang et al., 2025) introduced carbon trading into multi-phase energy system planning to optimize both economic efficiency and environmental performance of energy utilization; literature (Zhu et al., 2024) introduced a carbon constraint mechanism and established a time-scale coordinated scheduling model to achieve low-carbon optimization in multi-energy systems; literature (Xiqin et al., 2024) predicted the green certificate trading price using the Bayesian fuzzy learning method, establishing theoretical foundations for the synergistic operation of micro-energy grids in green certificate trading and short-term spot market; literature (Guo et al., 2025) considered virtual power plants to participate in both carbon trading and green certificate markets to enhance low-carbon system dispatch optimization.; literature (Wang et al., 2025) investigated a multi-park hybrid energy system with carbon green certificate trading model, examining dynamic pricing strategies and optimal scheduling challenges for system operation. The findings demonstrate that introducing carbon trading and green certificate trading mechanisms into the optimization scheduling model can effectively reduce carbon emissions and comprehensive costs, while their implementation pathways differ significantly. Moreover, current research is based on deterministic scenarios without accounting for uncertainties, which may lead to deviations in optimization outcomes.
In terms of clean energy output uncertainty, scholars have mainly studied stochastic optimization method (Dong et al., 2021) and robust optimization method (Dong et al., 2021). Robust optimization methods typically employ a set-based representation to describe the distribution range of uncertain parameters. Compared to stochastic optimization methods, they eliminate the need to acquire probability distributions of uncertain parameters and avoid the high-dimensional problems introduced by numerous scenarios. Consequently, robust optimization is garnering increasing attention in the optimal operation of micro-energy grid.
In summary, this paper proposes a robust optimization model for micro-energy grids that accounts for demand response and carbon green certificate trading. Firstly, the demand response and carbon green certificate market trading models of micro-energy grids are constructed to analyze their impacts on micro-energy grids and external system benefits; secondly, a deterministic micro-energy grid operation optimization framework is developed for microgrid energy management, with the primary objective of net economic benefit maximization; thirdly, a robust coefficient-driven uncertainty characterization is developed for wind and solar power output, enabling the formulation of a robust optimization framework for microgrid energy management; finally, a case study simulation of a micro-energy system in a province in Northern China was conducted to validate the economic efficiency, low-carbon performance, and effectiveness of the proposed model.
2 Micro-energy grid
This paper constructs a microgrid architecture consisting of power generation modules, standby energy units and energy conversion components. The power generation module comprises three components: wind turbines (WT), photovoltaic turbines (PV) and electric storage equipment (ES). The standby energy unit incorporates combined cooling, heating and power units (CCHP), which contain gas turbines (GT), waste heat recovery boiler (HR), absorption chillers (AC) and heat exchanger units (HE), which provide backup capacity for intermittent renewable generation from wind and solar sources. The energy conversion unit consists of electric chillers (EC) and electric boilers (EB). In addition, an external system is configured as an external standby for microgrid, guaranteeing uninterrupted energy supply for internal consumers and maintaining grid operational stability. In this paper, it is assumed that the units of microgrid prioritize cooling, thermal and power demand fulfillment for end-users within the system. If the internal units cannot meet the demand, the external grid provides compensatory power supply. The microgrid only purchases natural gas for CCHP from external energy supply system. Figure 1 illustrates the structure of the proposed micro-energy network.
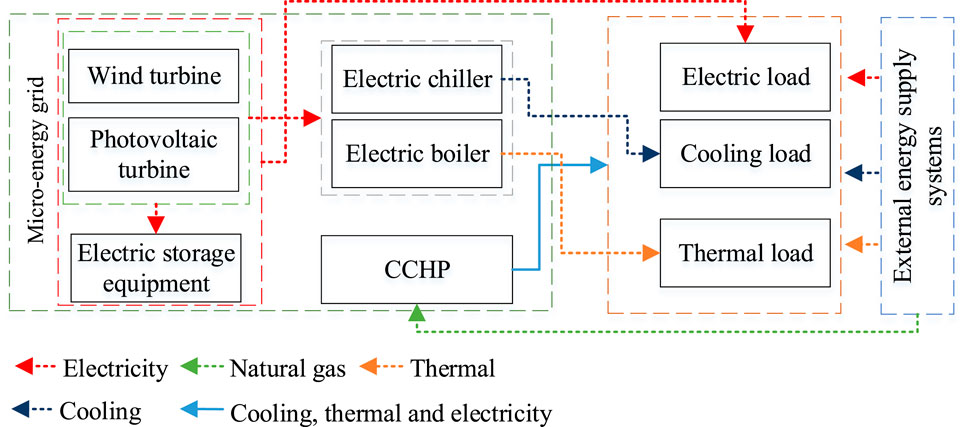
Figure 1. Micro-energy grid structure.
This study establishes a microgrid architecture comprising power generation modules, backup energy units, and energy conversion components.
3 Demand response and carbon green certificate trading model
3.1 Analysis of the relationship between micro-energy grids and demand response, carbon green certificate trading
To encourage users to engage in microgrid optimized dispatch, a comprehensive price-driven demand response mechanism is implemented. Users are affected by changes in energy prices and adjust their energy demand independently, thus affecting system-level supply-demand balance, and the results of unit scheduling. At the same time, carbon trading and green certificate mechanisms promote clean power generation while imposing economic penalties on high-carbon units, thereby influencing both microgrid operations and external system revenue. Figure 2 shows the combined effects of demand response and carbon green certificate trading on both microgrid and external systems.
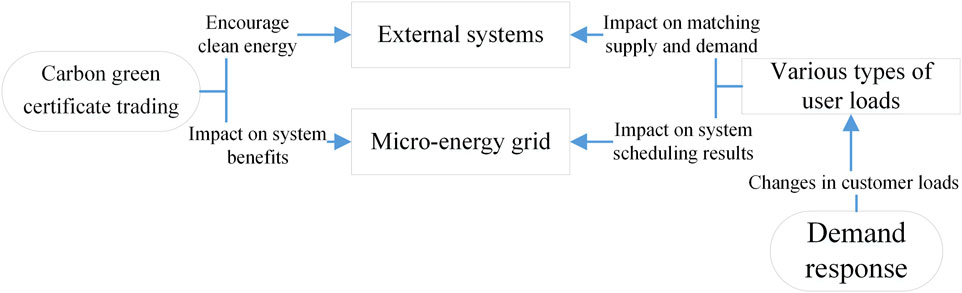
Figure 2. Demand response and carbon green certificate trading systemic impacts.
3.2 PBDR model
PBDR is an extension of power-side PBDR, which guides customers to actively change their load demand through price changes. It is constructed using the elasticity matrix, as shown in Equations 1, 2 (Zhang et al., 2019; Zhang et al., 2024):
where,
where,
3.3 Carbon green certificate trading model
Constructing a mandatory rewards and penalties model in conjunction with carbon and green certificate trading to assess systemic effects of mandatory carbon green certificate trading.
3.3.1 Green certificate trading
Renewable and clean energy plants can obtain tradable green certificates as credentials for cleaner electricity production, which can be sold on the energy market, while fossil-fueled plants must purchase the corresponding certificates (Jiang et al., 2025). The model is as shown in Equation 3.
where,
3.3.2 Carbon trading market
The carbon emission trading mechanism operates under a national cap-and-trade system, where entities exceeding allocated free allowances must procure additional permits through carbon market transactions (Zhou, 2009). On the contrary, they can be sold in the market (Li et al., 2025), the trading model is as shown in Equations 4, 5.
where,
4 Micro-energy grid optimization model
4.1 Modeling of micro-energy grid units
4.1.1 Power generation modules
4.1.1.1 WT output model
WT output variability originates from stochastic wind speed variations, which are commonly modeled through Weibull distribution functions to quantify their probabilistic characteristics, as shown in Equation 6 (Ju et al., 2024):
where,
where,
4.1.1.2 PV output model
PV output variability stems from solar radiation fluctuations, which has some uncertainty and is usually available to fit solar radiation using Beta distribution, as shown in Equations 8, 9 (Ju et al., 2024):
where,
where,
4.1.1.3 ES
where, from Equation 10,
4.1.2 Standby energy units
The standby energy unit comprises CCHP units, where HR utilizes turbine exhaust gases to drive AC or HE for cooling and thermal load provision (Fukang et al., 2021), as shown in the model is as shown in Equation 11.
where,
4.1.3 Energy conversion units
4.1.3.1 EC
where, from Equation 12,
4.1.3.2 EB
where, from Equation 13,
4.2 Deterministic microgrid optimization model
4.2.1 Objective function
The micro-energy grid seeks to maximize net income with the following (Geng et al., 2020; Wang et al., 2023):
where,
In this case, the microgrid’s revenue streams comprise earnings from supplying cooling, thermal, and electrical energy to end-users., as modeled below:
where,
The costs of the microgrid include unit O&M costs, deviation penalty costs, and external gas purchase costs, which are modeled as follows:
where,
where,
where, subject to WT and PV output variability,
where,
4.2.2 Constraints
4.2.2.1 Supply-demand balance constraints
where,
4.2.2.2 Generation unit output constraints
A. WT and PV output constraints
where,
B. ES unit constraints
where,
C. CCHP unit constraint (Sun et al., 2020)
where,
D. HR unit constraint
where,
E. HE unit constraint
where,
F. Vapor type AC constraint
where,
4.3 Robust optimization-based optimization model for micro-energy grid
WT and PV output have a certain degree of randomness and volatility, robust optimization is one of the common methods to study the uncertainty optimization problem, which can inhibit the impact of uncertainty on the operation optimization results to different degrees by adjusting the robust coefficient (Ju et al., 2024). Therefore, in this section, a robust optimization model is developed considering WT and PV output uncertainties. WT and PV output uncertainty sets are shown in Equation 34.
where,
Integrate the formula Equations 14–33, the robust optimization model (Yang et al., 2020) is as shown in Equation 35.
5 Solution algorithm
The proposed optimization model incorporates both continuous, 0–1, and binary decision variables, which are mixed integer quadratically constrained programming problems. In this paper, linearization is used to transform all nonlinear components in the optimization model into linear equations. The optimization problem is transformed into a mixed-integer linear programming model and is subsequently solved using CPLEX within the MATLAB environment. In this case, quadratic linearization is handled as shown in Figure 3.
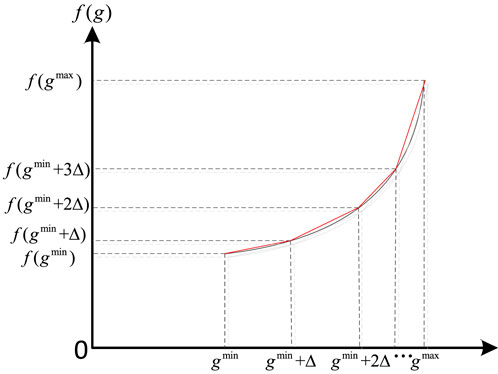
Figure 3. Linearization of quadratic functions.
Based on Figure 3, for
where,
6 Calculus analysis
6.1 Multi-scenario setting
Firstly, the stochastic nature of clean energy production constitutes a fundamental uncertainty source that substantially affects system dispatch outcomes and economic benefits. Secondly, the energy consumption side customer loads are somewhat transferable by demand response pricing mechanisms, consequently altering supply-demand equilibrium conditions and ultimately influencing both system scheduling results and system revenue. Finally, the implementation of carbon green certificate trading will also have some impact on system benefits. Therefore, this paper considers the above three scenarios comprehensively and sets up multiple scenarios to carry out quantitative optimization research. The scenario settings are shown in Table 1.
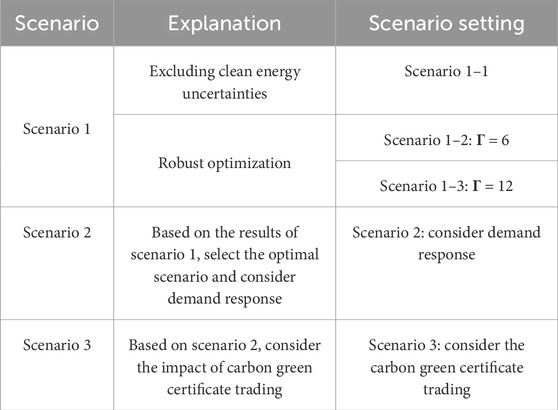
Table 1. Scenario setting.
6.2 Basic data
This study investigates a provincial scale microgrid system located in northern China as a case study. The microgrid is equipped with 70 MW of WT, 20 MW of PV, 10 MW of ES, 10 MW of GT, 20 MW of HR, 15 MW of AC, 25 MW of HE, 15 MW of EC and 20 MW of EB. The technical parameters for all components are derived from literature (Zhou et al., 2019; Wang et al., 2017; Xu et al., 2017).
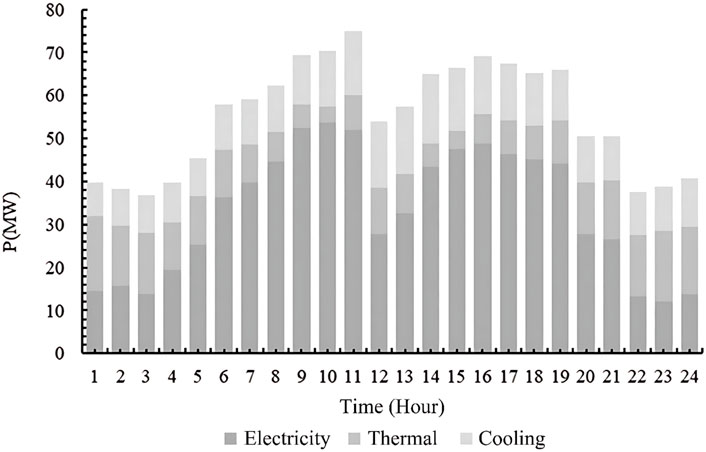
Figure 4. Typical daily micro-energy grid customer cooling, thermal and electricity loads.
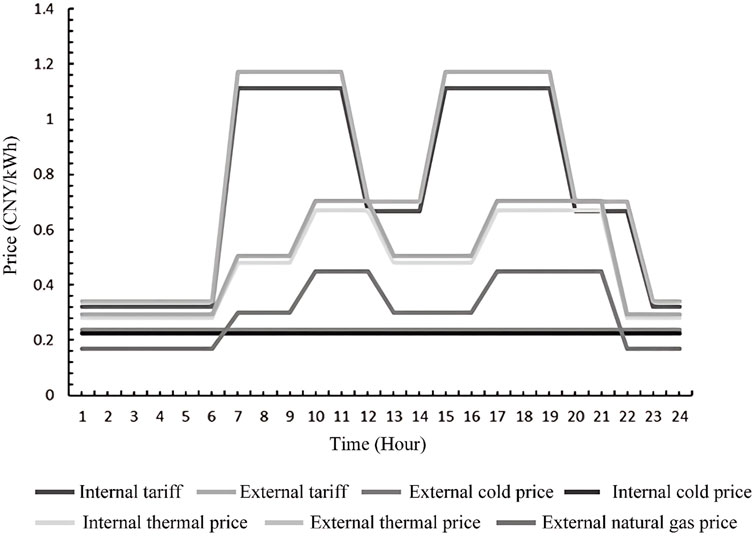
Figure 5. Prices for the sale of energy for cooling, thermal, electricity and gas.
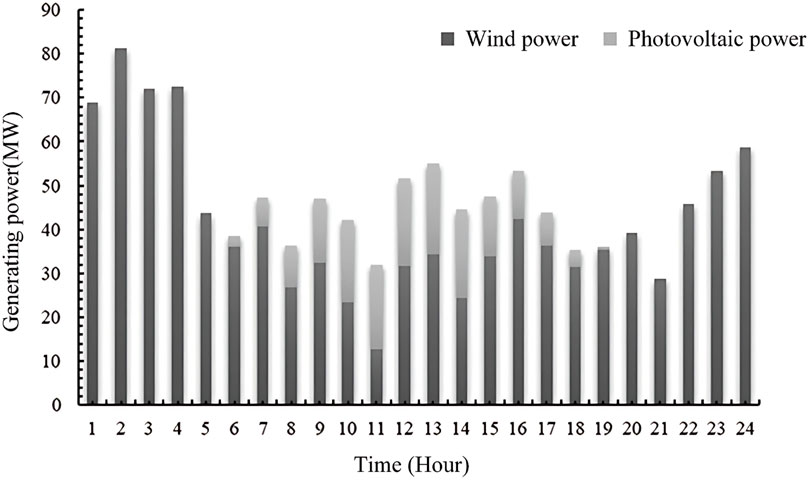
Figure 6. Clean energy forecast output.
6.3 Results
6.3.1 Comparison of deterministic and uncertainty model optimization results
Without considering the clean energy uncertainty, WT and PV generation profiles are predicted subject to technical maximum constraints. Based on this, the optimal scheduling is performed to get deterministic optimization results, as shown in Figures 7a–c. Considering the clean energy uncertainty, the output deviation of wind and photovoltaic power is maintained at 0.05, yielding uncertainty optimization results as shown in Figures 7d–i. Table 2 presents the optimization outcomes derived from both deterministic and stochastic modeling approaches.
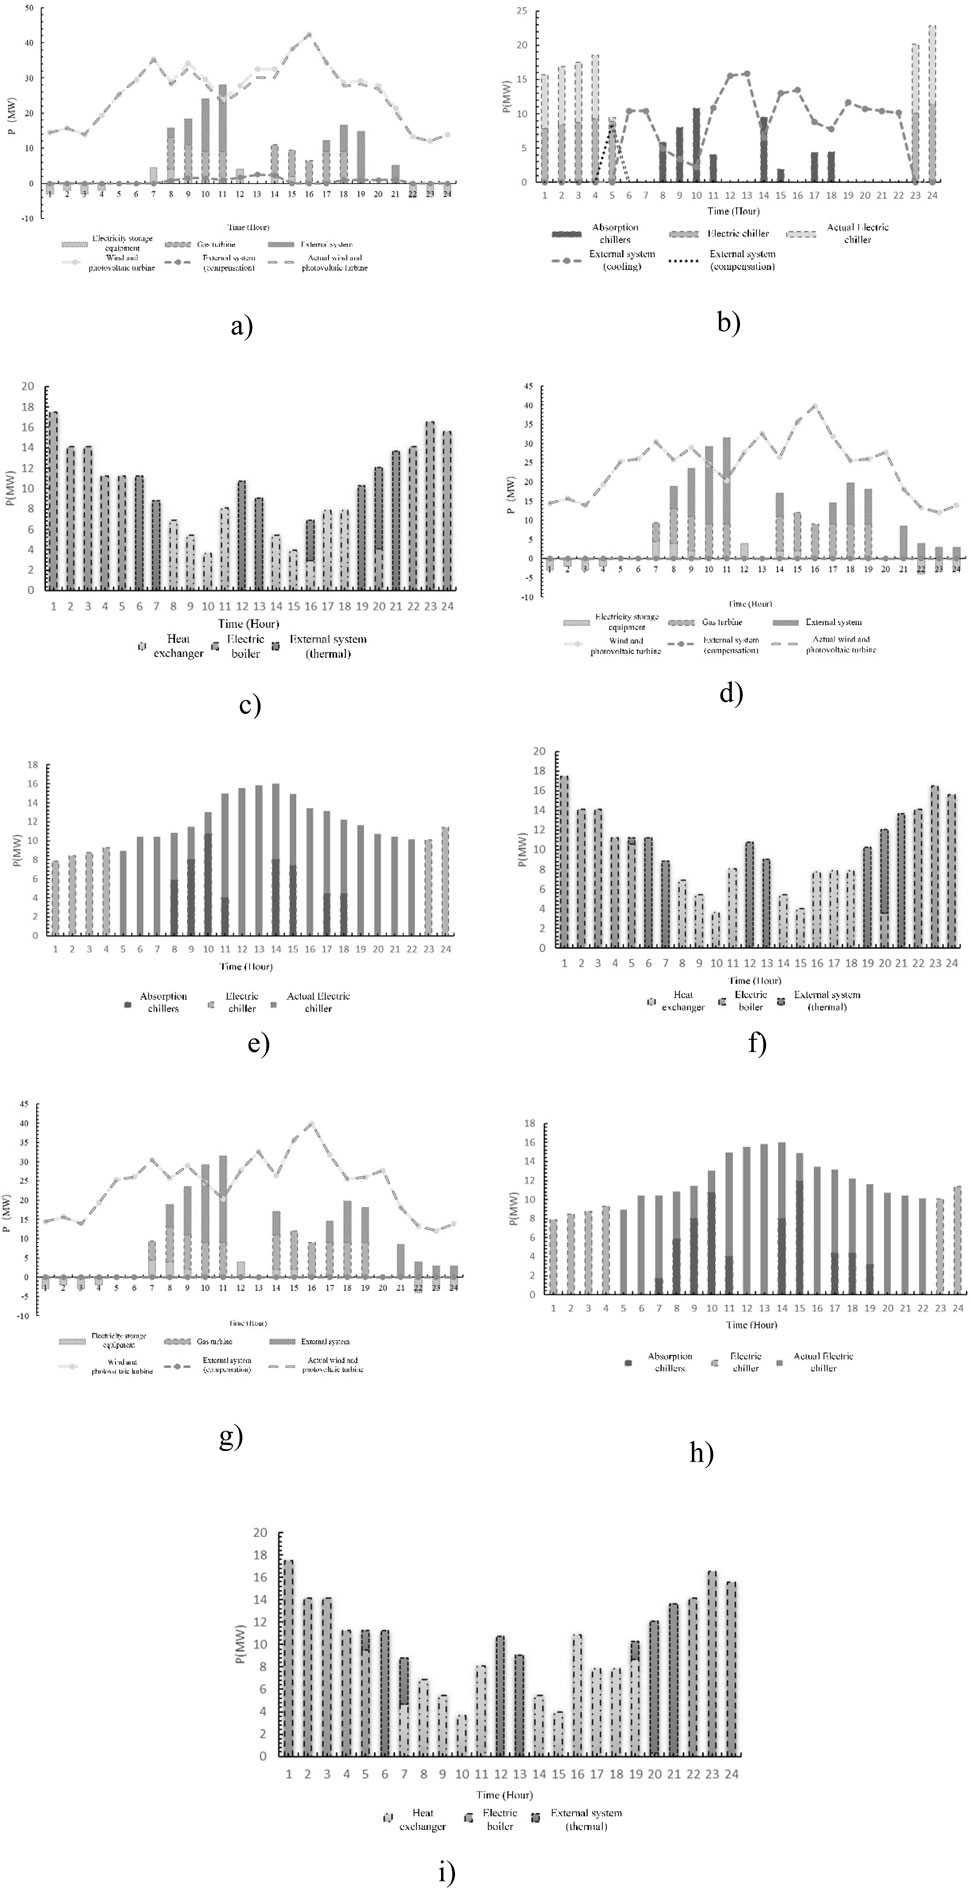
Figure 7. Optimized scheduling results of units under different scenarios. (a) Scenario 1–1 Power Supply Component (b) Scenario 1–1 Cooling Component (c) Scenario 1–1 Thermal Component (d) Scenario 1–2 Power Supply Component (e) Scenario 1–2 Cooling Component (f) Scenario 1–2 Thermal Component (g) Scenario 1–3 Power Supply Component (h) Scenario 1–3 Cooling Component (i) Scenario 1-3 Thermal Component.
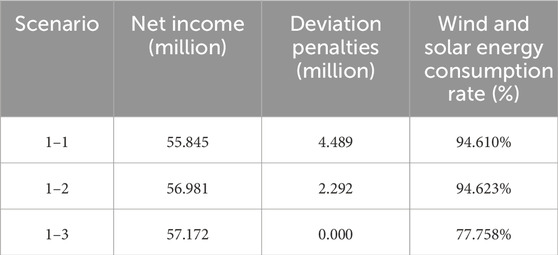
Table 2. Benefits under different scenarios.
Synthesis combines Figure 7 and Table 2, from heating and cooling perspective: On the one hand, the CCHP realizes the graded utilization of energy through the HR, and synergistically meets the demand of cooling and thermal loads. On the other hand, EC and EB absorbed the surplus abandoned energy from clean energy sources to meet the cooling and thermal load demand. However, for Scenario 1-1, given the stochastic of clean power, the EC creates a supply deviation from 5:00–6:00, which needs to be supplemented by an external system. From the power supply perspective: On the one hand, ES meets part of the electricity load demand by storing it during the trough and releasing it during the peak. The GT of the internal standby energy units, in conjunction with the clean energy supply units, generates electricity, directly reducing the amount of energy supplied by the external energy system. On the other hand, comparative analysis demonstrates that incorporating renewable generation uncertainty into robust optimization leads to three distinct effects when increasing robustness coefficients: 1) renewable energy output curtailment; 2) progressive attenuation of output fluctuations; 3) decrease in bias imbalance penalties. Scenario 1–3 has 54.603 MW and 15.053 MW less wind power supply compared to Scenarios 1-1 and 1-2, respectively. As a result, the proposed optimization strategy generates improved net income at the expense of higher energy discarded.
In summary, the robust coefficient exhibits an inverse relationship with clean energy accommodation capacity, and system avoids the clean energy risk by reducing the clean energy output, but inevitably increasing energy discarded. Therefore, it is necessary to combine multiple factors to set up a robust system to achieve optimal scheduling. In addition, combining with Table 2, the analysis reveals that Scenario 1-3 achieves optimal net income compared to other scenarios, which is the optimal objective function, but the amount of discarded energy is higher under this scenario, and there is a mismatch between supply and demand.
6.3.2 Demand response comparison results analysis
6.3.2.1 Comprehensive demand response analysis
By incorporating the demand elasticity matrices for cooling, thermal, and electricity loads, the model derives time-sharing pricing structures and corresponding load variations in the microgrid system. Figure 8 shows the price of energy sold for the system after demand response is implemented. Figure 9 shows the load variation for cooling, thermal, and electricity services following demand response implementation.
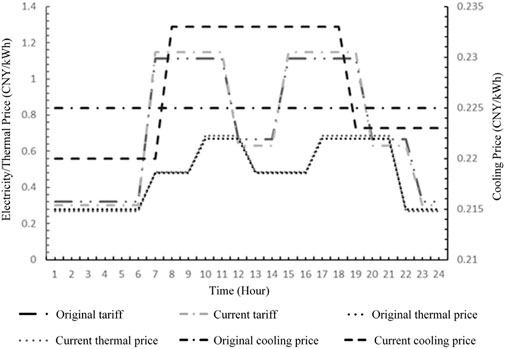
Figure 8. Demand response post implementation system energy price.
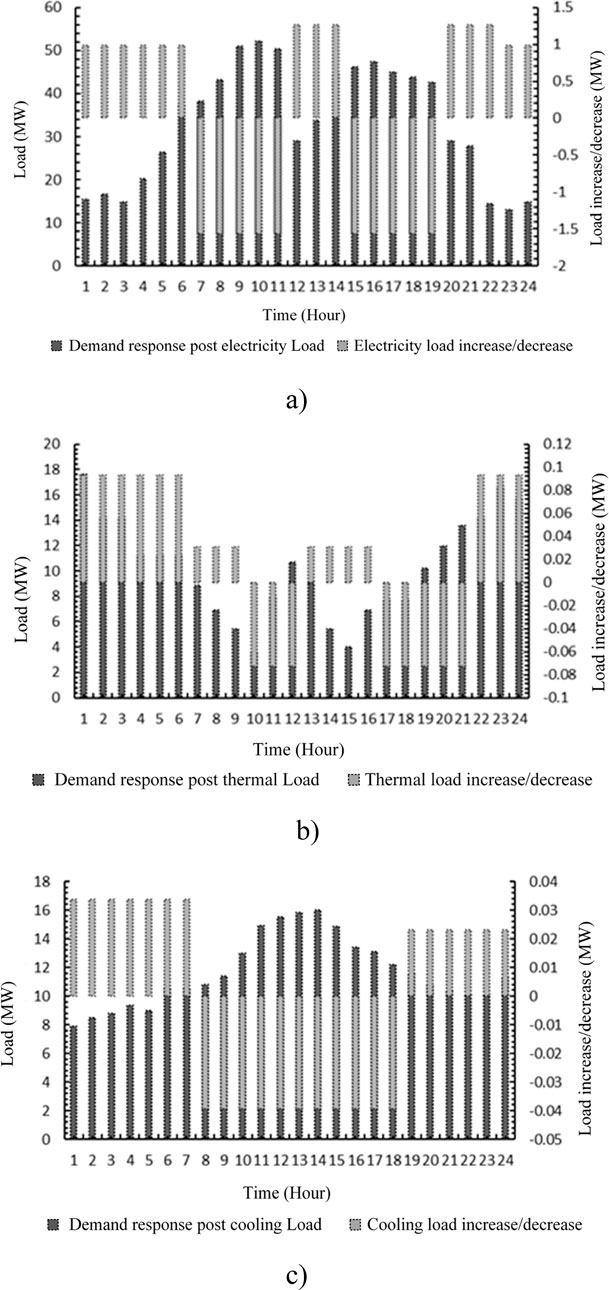
Figure 9. Demand response post implementation load requirements. (a) Electricity load demand after demand response implementation (b) Thermal load demand after demand response implementation (c) Cooling load demand after demand response implementation.
6.3.2.2 Demand response analysis of peak-valley energy price
In conjunction with Figures 8, 9, this section focuses on the optimized dispatch results and system benefits of the units after demand response implementation. Figure 10 and Table 3 show the unit scheduling results and system benefits after demand response implementation, respectively.
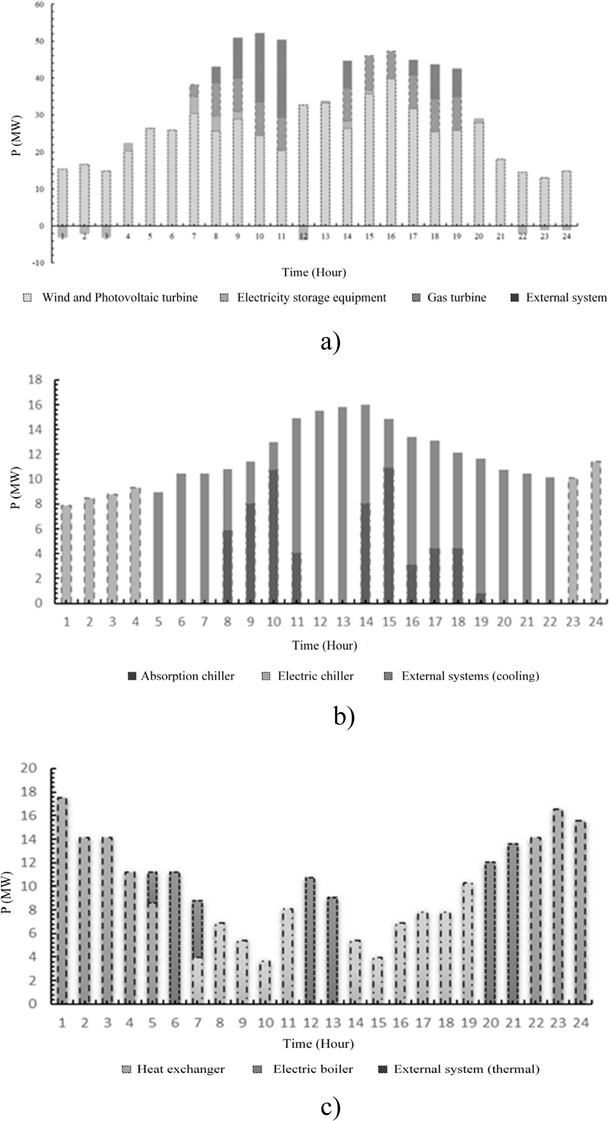
Figure 10. Optimized scheduling results for units after demand response implementation. (a) Composition of electricity supply after demand response implementation (b) Composition of cooling supply after demand response implementation (c) Composition of thermal supply after demand response implementation.

Table 3. System benefits after demand response implementation.
In conjunction with Figure 10a, from the power supply point of view: Comparing Scenario 1-3, due to the demand response implementation, customer electricity loads increased during peak WT and PV output. The clean energy unit boosts the energy supply of about 14.115 MW and reduces the amount of energy supplied by the external system. From thermal and cooling perspective: Comparing scenario 1-3, on the one hand, micro-energy grid system is constrained by the revenue maximization objective function, and due to higher electricity price, more clean energy is used to satisfy the demand of customer electricity loads, crowding out part of the electricity that can be converted to meet the cooling and thermal demand through EC and EB; on the other hand, the load-shifting behavior induces three operational modifications: 1) enhanced renewable energy utilization for electrical demand; 2) reduced gas turbine output in the CCHP system; 3) diminished energy cascade potential. As a result, the internal units experience reduced capacity for meeting cooling and thermal demands and an increase in the amount of external thermal and cooling by 4.272 MW and 1.845 MW, respectively. However, cross-referencing with Figure 2 reveals, compared to Scenario 1-3, the net system benefits and user costs have increased by ¥0.718 million and decreased by about ¥16.22 million, respectively, which has certain economic advantages. And the WT and PV energy consumption rate has increased by about 2.17% due to the increased match between supply and demand, which has certain environmental advantages.
6.3.2.3 Analysis of comparative results of carbon green certificate trading
In view of scenario 2’s baseline optimization outcomes, this subsection evaluates how carbon-green certificate trading influences system revenues, with quantitative results presented in Table 4.
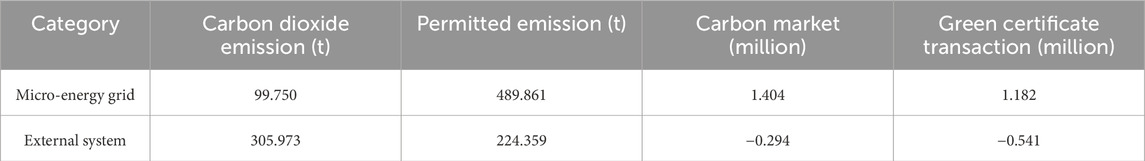
Table 4. Carbon green certificate trading on system benefits results.
Table 4 demonstrates that the microgrid’s energy portfolio predominantly comprises WT, PV and natural gas resources, with a high degree of cleanliness and low carbon emissions. Thus, the carbon green certificate trading significantly enhances microgrid profitability, generating combined revenues of ¥14.04 million from carbon trading and ¥11.82 million from green certificate sales. In contrast, the external grid relies primarily on carbon-intensive conventional generation. Engagement in carbon green certificate markets necessitates the procurement of carbon credits and green certificates. Therefore, the implementation of carbon green certificate trading requires an operational strategy that considers clean energy variability, maximizing renewable energy utilization, minimizing conventional power generation and minimizing carbon green certificate expenditure.
6.3.2.4 On the main significance of the developed tools in real-life cases
The robust optimization model for micro-energy grids accounting for demand response and carbon-green certificate market transactions, proposed in this paper, can provide decision support for the efficient and low-carbon operation of practical micro-energy grid systems. Firstly, the established demand response and carbon/green certificate market trading models provide a data foundation for quantitatively analyzing the economic and environmental benefits of market incentive policies and formulating operational strategies. Secondly, the proposed operational strategy based on robust optimization (considering the uncertainty set of wind and PV power output) can not only effectively coordinate the synergistic operation of electricity, thermal, and cooling multi-energy systems, mitigating the volatility of clean energy and spatiotemporal mismatches, but also significantly enhance the system’s risk resilience against uncertain factors such as wind/PV forecast errors. Finally, the model can provide decision-making basis for the safe, economical, and low-carbon operation of micro-energy grids under diverse resource and market conditions. With the deepening of carbon and green certificate trading market mechanisms, this model can provide ongoing support for promoting regional clean and low-carbon energy utilization.
7 Conclusion
This study develops an enhanced microgrid optimization framework that integrates PBDR and clean energy generation uncertainty, formulating both conventional micro-energy grid optimization models and robust optimization models for comparative scenario analysis. The principal findings of this study demonstrate that.
(1) Robust optimization can reduce the risk associated with clean energy uncertainty by adjusting the robustness coefficient. By utilizing robust coefficients to regulate clean energy uncertainty, the system can avoid the risks associated with uncertainty and reduce the amount of clean energy supply. And the reduction increases as the robustness factor increases. Although it reduces the cost of deviation penalties, it is prone to increased energy abandonment. Therefore, when choosing the robustness coefficient, the decision maker must synthesize many factors, use the robustness coefficient as a variable factor, and use the sensitivity analysis method to choose a reasonable control coefficient.
(2) Demand response on the electricity side can be effectively extended to the heating and cooling sectors, providing an effective approach to improving supply-demand matching under multi-energy coupling. Influenced by changes in electricity, heating, and cooling prices, users adjust their energy consumption behavior, which not only increases the clean energy consumption rate by approximately 2.17%, contributing to the achievement of carbon neutrality goals, but also brings notable economic benefits—raising system revenues by 7,180 CNY and reducing user costs by 16,220 CNY.
(3) Driven by carbon and green certificate trading mechanisms, the development of clean energy systems has become imperative. This can generate approximately 14,040 CNY in carbon trading revenue and 11,820 CNY in green certificate trading revenue for the micro-energy grid. Considering the carbon trading market, based on rationalizing and reducing the amount of energy supplied by conventional units, it is also necessary to further carry out cleaner reforms of conventional units and continue to develop carbon capture technology, etc., to enhance emission reduction and competitiveness in the carbon trading market. Considering green certificate trading, through fully assessing clean energy output riskiness, the amount of clean energy supply should be rationalized and enhanced to increase the green certificate revenue of the clean energy system.
This study develops a robust optimization model for micro-energy grid accounting for demand response and carbon-green certificate market transactions, aiming to enhance economic dispatch and low-carbon operations. However, several limitations remain. First, the model does not account for electricity/heat network power flow constraints and transmission losses, which may affect dispatch accuracy and economic assessments. Second, uncertainty is addressed using robustness coefficients, without fully leveraging probabilistic distribution information. Third, the modeling of green certificate and carbon markets is simplified, failing to capture the dynamic effects of evolving policy mechanisms. Future work will focus on integrating electricity/heat network flow models to improve physical realism, exploring data-driven uncertainty modeling approaches, and advancing the representation of coupled market mechanisms to enhance model applicability and policy relevance.
Data availability statement
The original contributions presented in the study are included in the article/supplementary material, further inquiries can be directed to the corresponding author.
Author contributions
XuL: Data curation, Writing – review and editing, Formal analysis, Methodology, Writing – original draft, Conceptualization. XiL: Methodology, Writing – review and editing, Conceptualization, Validation, Formal analysis. LA: Validation, Writing – review and editing, Supervision, Visualization. ZT: Writing – original draft.
Funding
The author(s) declare that financial support was received for the research and/or publication of this article. We gratefully acknowledge the support provided by the Economic and Technology Research Institute of State Grid Jibei Electric Power Company, SGJBJY00JJJS2400022. The funder was not involved in the study design, collection, analysis, interpretation of data, the writing of this article, or the decision to submit it for publication.
Conflict of interest
Authors XL and LA were employed by State Grid Jibei Electric Power Co. Ltd. Author XL was employed by State Grid Zhangjiakou Power Supply Company.
The remaining author declares that the research was conducted in the absence of any commercial or financial relationships that could be construed as a potential conflict of interest.
Generative AI statement
The author(s) declare that no Generative AI was used in the creation of this manuscript.
Publisher’s note
All claims expressed in this article are solely those of the authors and do not necessarily represent those of their affiliated organizations, or those of the publisher, the editors and the reviewers. Any product that may be evaluated in this article, or claim that may be made by its manufacturer, is not guaranteed or endorsed by the publisher.
References
An, Y., Su, R., Zheng, S., and Yang, R. (2023). Low carbon economic optimization of integrated energy system considering carbon trading and source-load side resources. Acta Energiae Solaris Sin. 44 (11), 547–555. doi:10.19912/j.0254-0096.tynxb.2022-1156
Chen, L., Ke, L. I., Chen, S., Wang, X., and Tang, L. (2021). Industrial activity, energy structure, and environmental pollution in China. Energy Econ. 104, 105633. doi:10.1016/j.eneco.2021.105633
Deng, T., Lou, S., Tian, X., Wu, Y., and Li, N. (2019). Optimal dispatch of wind power systems considering demand response and deep peak shaving of thermal power. Automation Electr. Power Syst. 43 (15), 34–41. doi:10.7500/AEPS20180602005
Dong, W., Pengyuan, Z., Yidan, R., Yixuan, Y., and Ran, M. (2021). Robust optimization algorithm for island microgrid under uncertainty environment. Mod. Electr. Power, 1–10. doi:10.19725/j.cnki.1007-2322.2020.0344
Fayiz, A. H, Mouloud, D. I, and Sun, Y. (2023). A dynamic Peer-to-Peer electricity market model for a community microgrid with price-based demand response. IEEE Trans. Smart Grid 14 (5), 3976–3991. doi:10.1109/tsg.2023.3246083
Fukang, R. E. N., Ziqing, W. E. I., and Zhai, X. (2021). Multi-objective optimization and evaluation of hybrid CCHP systems for different building types. Energy 215, 119096. doi:10.1016/j.energy.2020.119096
Geng, S., Niu, D., Guo, X., Chen, M., and Tan, C. (2020). Micro-energy grid multi-objective evolutionary game considering multi-energy flexible load dispatching. Electr. Power Constr. 41 (11), 101–115. doi:10.12204/j.issn.1000-7229.2020.11.011
Guo, X., Wang, L., and Ren, D. (2025). Optimal scheduling model for virtual power plant combining carbon trading and green certificate trading. Energy 318, 318134750–134750. doi:10.1016/j.energy.2025.134750
Jiang, P., Selenge, K., Adila, A.G, and Dong, H. (2020). Cost-effective approaches for reducing carbon and air pollution emissions in the power industry in China. J. Environ. Manag. 264 (C), 110452. doi:10.1016/j.jenvman.2020.110452
Jiang, X., Bao, Z., Yu, M., Guo, C., Guo, Y., Wang, J., et al. (2025). Robust multi-stage planning of park-level integrated energy system considering source-load uncertainties. Electr. Power Constr. 46 (04), 99–112. doi:10.12204/j.issn.1000-7229.2025.04.009
Ju, L., Bai, X., Li, G., Gan, W., Qi, X., Ye, F., et al. (2024). Two-stage robust transaction optimization model and benefit allocation strategy for new energy power stations with shared energy storage considering green certificate and virtual energy storage mode. Appl. Energy 362, 122996. doi:10.1016/j.apenergy.2024.122996
Kong, X., Lu, W., Wu, J., Wang, C., Zhao, X., Hu, W., et al. (2023). Real-time pricing method for VPP demand response based on PER-DDPG algorithm. Energy 271, 127036. doi:10.1016/j.energy.2023.127036
Li, L., Yuan, Z., and Li, J. (2025). Three-stage stochastic robust day-ahead optimization of hydrogen-containing integrated energy system considering source-load multiple uncertainties. Power Syst. Technol. 1–14. doi:10.13335/j.1000-3673.pst.2025.0327
Nan, Z., and Beibei, W. (2019). Optimal configuration of distributed power generation in distribution network considering multiple types of demand response resources. China Electr. Power (11), 51–59. doi:10.11930/j.issn.1004-9649.201805112
Sun, Q., Xie, D., Nie, Q., Zhang, L., Chen, Q., Chen, J., et al. (2020). Research on economic optimal dispatching of park integrated energy system containing electricity, heating, cooling and gas load. China Electr. Power 053 (004), 79–88. doi:10.11930/j.issn.1004-9649.201912038
Wang, C., Xu, X., Yuan, X., and Wei, S. (2023). Optimization operation of multi-agent mixed game in community comprehensive energy system considering source-load uncertainty. Mod. Electr. Power. 1007-2322, 0292. doi:10.19725/j.cnki.1007-2322.2023.0292
Wang, G., Li, P., Jiao, Y., He, N., Zhang, W., Tan, Z., et al. (2017). Multi-objective stochastic dispatching optimization model of virtual power plant taking into account wind and wind uncertainty. China Electr. Power 50 (05), 107–113. doi:10.11930/j.issn.1004-9649.2017.05.107.07
Wang, Y., Zhou, H., Jiang, S., Zhang, Y., and Li, Y. (2025). Bi-level game optimization model of multi-park integrated energy system based on electricity and carbon coupling. Renew. Energy Resour. 43 (03), 388–399. doi:10.3969/j.issn.1671-5292.2025.03.014
Xiqin, L. I., Zhang, Z., Yang, J., Yang, X., Zhang, Y., Li, W., et al. (2024). Multi-objective operation optimization of park microgrid based on green power trading price prediction in China. Energies 18 (1), 46. doi:10.3390/en18010046
Xu, H., Jiao, Y., Pu, L., He, N., Wang, Y., Tan, Z., et al. (2017). Stochastic scheduling optimization model of wind-solar-fired-storage integrated virtual power plant considering uncertainty and demand response. Power Syst. Technol. 41 (11), 3590–3597. doi:10.13335/j.1000-3673.pst.2016.3379
Yang, S., Tan, Z., Liu, Z., Lin, H., Ju, L., Zhou, F., et al. (2020). A multi-objective stochastic optimization model for electricity retailers with energy storage system considering uncertainty and demand response. J. Clean. Prod. 277, 124017. doi:10.1016/j.jclepro.2020.124017
Yang, S., Sun, L., Chen, L., and Liu, J. (2021). Coordination and optimal dispatching of distribution network system with combined cooling, heating and power microgrid in consideration of time-of-use electricity prices. Power. Auto. Equip., 1–9. doi:10.16081/j.epae.202102008
Zhang, C., Zeng, Y., and Kuang, Y. (2024). Integrated energy system scheduling considering demand response and flexible operation of carbon capture power plant. Smart Power 52 (09), 88–95. doi:10.3969/j.issn.1673-7598.2024.09.012
Zhang, N., Wang, H., Song, K., Cheng, M., Zhang, M., and Ye, P. (2023). Dynamic optimal control of integrated energy system based on multi-energy demand response. Electr. Meas. Instrum 60 (2), 16–24. doi:10.19753/j.issn1001-1390.2023.02.003
Zhang, T., Guo, Y., Li, Y., Yu, Y., and Zhang, J. (2021a). Optimal dispatch of regional integrated energy system taking into account the electrical and thermal integrated demand response. Power Syst. Prot. Control 49 (01), 52–61. doi:10.19783/j.cnki.pspc.200167
Zhang, Y., Dai, H., Wu, X., Chen, R., and Zhang, N. (2021b). Development trend and key issues of China's integrated energy service. China Electr. Power 54 (02), 1–10. doi:10.11930/j.issn.1004-9649.202012040
Zhang, Z., Yu, T., Wang, D., Pan, Z., and Zhang, X. (2019). Solving time-of-use electricity price of commercial buildings containing electric heat based on integrated learning. Proc. Chin. Soc. Electr. Eng. 39 (01), 112–125+326. doi:10.13334/j.0258-8013.pcsee.181584
Zhou, H. (2009). The development and enlightenment of the world carbon trading market. China Soft Sci. (12), 39–48. doi:10.3969/j.issn.1002-9753.2009.12.006
Zhou, K., Shuyu, W. E. I., and Yang, S. (2019). Time-of-use pricing model based on power supply chain for user-side microgrid. Appl. Energy 248, 35–43. doi:10.1016/j.apenergy.2019.04.076
Keywords: demand response, green certificate trading, carbon trading, micro-energy grid, robust optimization
Citation: Liu X, Liang X, An L and Tan Z (2025) Robust optimization model for micro-energy grid accounting for demand response and carbon-green certificate market transactions. Front. Energy Res. 13:1636892. doi: 10.3389/fenrg.2025.1636892
Received: 28 May 2025; Accepted: 24 July 2025;
Published: 27 August 2025.
Edited by:
Zhijian HU, Laboratoire d’analyse et d’architecture Des Systèmes (LAAS), FranceReviewed by:
Rafael Augusto Rodríguez, Unidades Tecnológicas de Santander, ColombiaHanjiang Dong, South China University of Technology, China
Copyright © 2025 Liu, Liang, An and Tan. This is an open-access article distributed under the terms of the Creative Commons Attribution License (CC BY). The use, distribution or reproduction in other forums is permitted, provided the original author(s) and the copyright owner(s) are credited and that the original publication in this journal is cited, in accordance with accepted academic practice. No use, distribution or reproduction is permitted which does not comply with these terms.
*Correspondence: Xuan Liu, MTgxMzcxMTQyODNAMTYzLmNvbQ==