 Runzhi Mu1Hongchun Shu2,3,4,5Yuming Zhang1Xiongbiao Wan1
 Shunji Luo2,3,4,5*Zichao Zhou1Guangxue Wang2,3,4,5Shunguang Lei2,3,4,5
- 1Yunnan Electric Power Test and Research Institute (Group) Co., Ltd., Kunming, China
- 2Faculty of Electric Power Engineering, Kunming University of Science and Technology, Kunming University of Science and Technology, Kunming, China
- 3State Key Laboratory Collaborative Innovation Center for Smart Grid Fault Detection, Protection and Control Jointly, Kunming University of Science and Technology, Kunming, China
- 4Yunnan Provincial Key Laboratory of Green Energy, Kunming, China
- 5Digital Electric Power Measurement and Protection Control, Kunming University of Science and Technology, Kunming, China
Introduction: Frequency oscillations induced by stochastic disturbances pose significant challenges to grid-connected photovoltaic (PV) systems. This study proposes an adaptive optimization strategy for photovoltaic-energy storage systems (PV-ESS) based on a GA-BP neural network to address this issue.
Methods: First, the working principles and characteristics of virtual synchronous generator (VSG) technology are elaborated. Second, the power control point positioning under deloading operation of PV systems and the virtual inertia control of energy storage systems are analyzed. Subsequently, a GA-BP neural network is introduced and applied to the adaptive parameter design of the PV-ESS system, enabling real-time dynamic adjustment of the moment of inertia J, damping coefficient D, and virtual inertia coefficient K, thereby enhancing the dynamic response performance of active power.
Results: The experimental results demonstrate that under active power command mutation scenarios, compared with fixed-parameter control strategies, the proposed strategy reduces the frequency nadir deviation by 14.81%, overshoot by 62.5%, and steady-state recovery time by 44.44%.
Discussion: The adaptive parameter adjustment mechanism effectively mitigates frequency oscillations, offering a robust solution for grid stability in PV scenarios.
1 Introduction
To address climate change and accelerate the green and low-carbon transition of energy systems, countries worldwide are vigorously expanding their renewable energy infrastructure. Renewable energy generation is typically integrated into power grids through power electronic devices, which inherently lack the capability to provide damping and inertial support to the grid, posing significant challenges to grid stability (Zhang et al., 2022). As the proportion of grid-connected PV systems increases, frequency-related issues in power systems have become increasingly prominent (Kurm and Agarwal, 2021; Pei et al., 2020; Chai et al., 2021). Current approaches to enable PV power plants with primary frequency regulation and inertial support capabilities include active power reserve and energy storage integration. By combining energy storage with PV systems to form PV-ESS integrated systems and adopting VSG control strategies, effective grid frequency support can be achieved during load disturbances (Nguyen et al., 2019; Shenghu et al., 2024; Chen et al., 2024).
In recent years, research on photovoltaic frequency regulation technologies has grown substantially, with the primary objective of empowering PV power plants to participate in grid frequency regulation through advanced control strategies, thereby ensuring the secure and stable operation of modern power systems. Peng et al. (2025) incorporate PV systems into conventional power system models, deriving time-domain analytical solutions for frequency dynamics, which provides a more accurate and comprehensive literature for analyzing frequency characteristics in PV-integrated grids. Zhao et al. (2024) propose an enhanced voltage-controlled, deloaded PV virtual synchronous generator frequency support method with adaptive reserve ratios, significantly improving the efficacy of PV systems in grid frequency regulation. Zhang et al. (2024) introduce a consensus-based frequency regulation strategy for PV plants utilizing the average consensus algorithm, enabling coordinated frequency control among multiple PV stations under localized communication constraints. Zhong et al. (2022) develop a hybrid control strategy integrating a deloading operation with virtual synchronous machine (VSM) control. Sun et al. (2022) incorporate generator droop characteristics into deloaded power control frameworks, endowing PV plants with active frequency oscillation suppression capabilities. Zhong et al. (2019) propose a control strategy for PV cluster participation in primary frequency regulation, which accounts for the derating factor and multiple parameters to enhance system operation stability.
The critical role of energy storage in frequency regulation lies in its ability to rapidly absorb or release energy through storage systems, compensating for grid power deficits and mitigating instantaneous imbalances between load fluctuations and generation. Ren (2024) propose embedding fast frequency regulation devices between the grid and energy storage stations to achieve rapid coordinated power dispatch. Qian et al. (2024) proposes using a flywheel energy storage system to assist in endowing pumping and power generation conditions with the same frequency regulation capability. Dang et al. (2025) develop a dual-layer power optimization framework for multi-storage plants that balances system economics with state-of-charge equilibrium, minimizing frequency regulation costs. He et al. (2024) propose a frequency-decoupled composite control strategy based on real-time battery status monitoring, improving the frequency regulation performance of energy storage batteries. Zhao et al. (2020) propose a control strategy for optimizing the dead zone of power grid energy storage frequency regulation, which enhances system stability.
The PV-ESS compensates for the volatility of the PV output by controlling the energy storage in concert with the PV power plant, using the fast power response capability of the energy storage and providing virtual inertia support and frequency regulation services for the grid. Tiecheng et al. (2023) propose the use of a supercapacitor to assist PV units for frequency regulation, which effectively enhances the frequency stability of high-occupancy PV systems. Yongxi and Jiangrong (2023) proposed an improved VSG control strategy for the problems of fixed inertial link parameters and difficult real-time adjustment in the traditional virtual synchronous machine control strategy. Jia et al. (2022) combine the variable power tracking technology with a supercapacitor to form a new coordinated control strategy for PV energy storage. Zhang et al. (2023) propose that the PV energy storage system and synchronous generator be considered to be connected through a virtual shaft system, so that the PV energy storage system can simulate the dynamic characteristics of the synchronous generator’s shaft system and provide a new method for the friendly grid connection of the PV-ESS. Ur Rehman et al. (2021) propose a method to grid-connect PV and energy storage via VSG and provide inertial support. Hongchun et al. (2025) propose a cooperative control strategy for PV-hybrid battery energy storage systems to improve the system frequency response characteristics.
Because the virtual inertia and virtual damping coefficient are the core parameters in the VSG control technique, adjusting the VSG control parameters to improve the system dynamics and response performance has become the focus of today’s research. Jianhui et al. (2019) proposed an adaptive adjustment of virtual inertia VSG control strategy, which can effectively suppress the fluctuation of system active power. Ren et al. (2021) combined virtual impedance control with adaptive control to improve the frequency response characteristics of the system. Lu et al. (2024) derived the initial value of adaptive virtual inertia control based on an improved particle swarm algorithm, which improves the stability of the VSG grid-connected system. Fu et al. (2024) proposed the introduction of a virtual governor model, so that the primary frequency regulation under the action of delay and damping control is relatively independent, thus facilitating the completion of the control parameter design separately and effectively solving the problem of the traditional VSG control in the primary frequency regulation and damping is difficult to take into account. Ren et al. (2020) used the output angular frequency feedback control to regulate the dynamic damping of the VSG grid-connected system, which improves the performance of the system frequency regulation.
None of the above studies have deeply explored the dynamic control of parameters of the combined PV-ESS. Therefore, this article proposes an adaptive optimized strategy for the parameters of the combined photovoltaic and storage system based on GA-BP. First, the control principles of VSG active and reactive loops are introduced, and GA-BP is used for dynamic optimization of J and D in the active loop. Second, the load shedding control adopted for PV is analyzed to determine the PV load shedding control operating point. Subsequently, the ESS is introduced to use virtual inertia control. The virtual inertia control coefficients are also used in a GA-BP optimized strategy, and their dynamic changes follow the change rule of the S-type function. Finally, the effectiveness and superiority of the described adaptive optimized strategy in suppressing the frequency fluctuation of a high percentage of PV grid-connected are verified through an RT-LAB simulation as well as a hardware experimental comparison test.
2 System modeling and dynamic characterization
2.1 System architecture
Figure 1 shows the control framework of the combined PV-ESS. The system integrates PV-ESS to improve energy utilization and system stability. The control block diagram shows how stable operation and efficient energy management of the power system can be achieved through the synergy of the ESS, PV modules, GA-BP, and VSG control. The modules are interconnected through control signals and power flows to ensure the stability and reliability of the system working under different operating conditions.
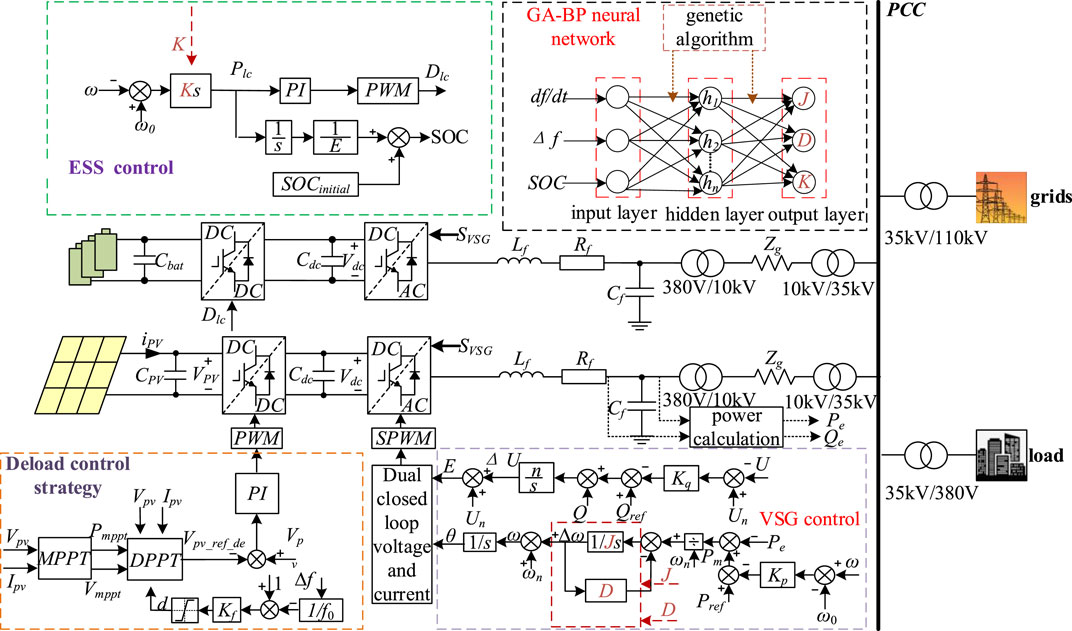
Figure 1. Control framework of the combined PV-ESS.
2.2 Grid-side converter control
VSG technology is one of the key technologies for new power systems with a high percentage of renewable energy access. Compared with traditional droop control, VSG control simulates the behavior of traditional synchronous generators by modeling the electromagnetic dynamic characteristics and mechanical inertial response of synchronous generators, introducing damping and rotational inertia characteristics to provide short-term frequency stability for the grid, and effectively improving the transient stability of the high-percentage new energy grid.
VSG technology is implemented through the following parts:
1) Active-frequency control
Figure 2 shows the block diagram of VSG active power-frequency control. The characteristic expression of the active power-frequency control loop is as follows:
In Equation 1, Pm is the virtual mechanical power, Pref is the VSG literature active power, Kp is the active power droop coefficient, ω is the actual operating angular velocity, and ωn is the rated angular velocity.
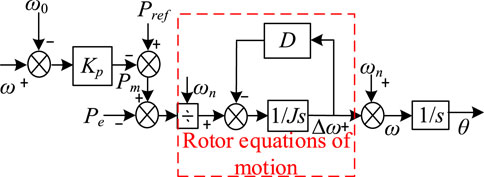
Figure 2. VSG active-frequency control.
The complete mathematical model of a synchronous generator requires comprehensive consideration of multiple interacting factors, including stator-rotor electromagnetic coupling, mechanical inertia, and damping effects. Its essence lies in a high-order nonlinear differential equation system. However, a simpler second-order model is typically adopted in the field of power electronic converter control to reduce controller design complexity and enable intuitive analysis of frequency-power dynamic responses. Its core expressions are
In Equation 2, J is the equivalent rotational inertia, and D is the damping coefficient.
When a random perturbation occurs in the PV-ESS, it is difficult to achieve the ideal adjustment effect with fixed coefficients of J and D because the virtual inertia J and virtual damping coefficient D in the VSG control are not linearly related to the frequency. In this article, the J and D parameters of VSG are efficiently and dynamically adjusted in the complex and variable power system through GA-BP combined with global optimization and dynamic learning, which greatly improves the system frequency stability and dynamic response speed.
2) Reactive power-voltage control
Figure 3 shows the block diagram of the VSG reactive power-voltage control. In the VSG control system, the synchronous generator changes its internal electromotive force by dynamically adjusting the excitation current, so as to accurately control the reactive power output, realize the balance between supply and demand of reactive power, and keep the power system voltage at the rated level. In the reactive-voltage control loop, reactive-voltage regulation is realized by changing the virtual excitation current, and the reactive power deviation obtained after reactive-voltage sag control:
In Equation 3, where Kq is the reactive power-voltage sag factor, Un is the rated system voltage, and U is the inverter output voltage.
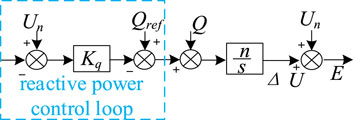
Figure 3. VSG reactive power-voltage control.
In order to realize the difference-free regulation of the output reactive power, an integral link is introduced into the reactive power control loop to modify the sag control loop, and the output voltage of the converter port is
In Equation 4, where ΔU is the voltage deviation, n is the integration coefficient, Qn is the rated reactive power of the system, and Q is the output reactive power of the inverter.
2.3 Machine-side converter control
2.3.1 PV deloading control
Generally, the PV power generation system operates in the maximum power mode to obtain the maximum power conversion efficiency, so when the power supply is suddenly withdrawn, the load is suddenly increased or subjected to random perturbations. The lack of spare power to make up for the power difference will lead to fluctuations in the frequency of the system, affecting the stability of the power grid system. PV deloading control technology adjusts the operating state of the PV cells so that they do not operate at the maximum power output point but instead reserve a portion of the power for grid frequency regulation. Although this will result in part of the solar energy not being fully utilized, thus reducing the energy conversion efficiency, it can effectively provide the active power support required for frequency regulation within the normal fluctuation range of the grid frequency.
As shown in Figure 4, by controlling the working voltage of the PV system to not be at the voltage at the maximum power tracking point, the PV panels do not work in the maximum power tracking mode but leave some reserve power. Point a in the figure is the working point of the PV power generation system when the active output is maximum. When the working point of the PV system is at b and c in the figure, then it represents that the PV retains a certain amount of reserve power, the corresponding expression is shown in Equation 5:
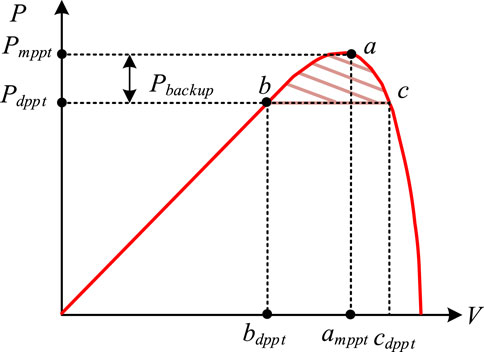
Figure 4. P-V curve of PV system output.
When the photovoltaic power generation system operates in the power–voltage curve area on both sides of the maximum power point, although the reserve power can be reserved through load shedding control, it should be noted that the operating points on both sides are not necessarily stable operating points. Based on the principle of conservation of energy, the output power of the PV array consists of the active power output from the inverter and the variation of DC bus capacitor energy storage, and the power balance relationship is Equation 6:
where Ppv is the PV array output power, Pinv is the PV inverter output active, and Pc is only the PV DC side capacitive power, which can be expressed as
In Equation 7, where Vdc is the capacitive voltage on the dc side of the PV, and C is the dc capacitance.
Applying small increments to the PV system voltage, the increment of the PV array output power can be obtained as
In Equation 8, where V0 is the voltage at steady state of the PV.
Linearizing ΔPpv for increments with small perturbations can obtain the Equation 9:
Expanding the PV array power Ppv with Taylor’s expansion, at the steady-state voltage V0, and neglecting the higher-order terms, yields the PV increased power
In Equation 10, where ΔVdc is the amount of disturbance voltage.
The Laplace transform of the couplings (9) and (10) is obtained Equations 11, 12:
The condition for nonzero solutions is given by Equation 13:
The characteristic roots are given by Equation 14:
When dPpv/dVpv is greater than 0, the working point of the PV power generation system is on the left side of point a. At this time, the characteristic root is greater than 0, and the system is in a positive feedback state. At this time, if Vpv voltage increases slightly due to a disturbance, the PV power Ppv increases with it. According to Equation 6, if the inverter is not adjusted in time, the excess power will be absorbed by the capacitor, resulting in capacitor charging and further voltage increase, which will form a positive feedback loop of “voltage increase-power increase-voltage increase again” and may lead to voltage runaway.
When dPpv/dVpv is less than 0, the working point of the PV power system is on the right side of point a. At this time, the characteristic root is greater than 0, and the system is in a positive feedback state. If the voltage Vpv increases slightly, the PV power Ppv decreases. At this time, the power shortage must be compensated by the capacitor discharge, resulting in a voltage drop, which will form a negative feedback loop of “voltage rise - power reduction - and then voltage drop,” and the system will return to the steady state.
Therefore, the sufficient condition for the stable operation of the PV power system is that its characteristic root is negative, which in turn leads to the stable operation condition of the PV power system as Equation 15:
Therefore, point c is the stable operation working point where the PV power system can be deloading controlled. From the PV characteristic curve of PV, by controlling the inverter voltage to adjust the output power, theoretically up to 80%–90% of the active power of the PV power plant can be left as a backup to provide power support to the grid in an emergency. PV load shedding control is shown in Figure 5.
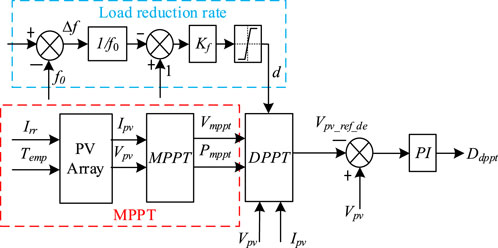
Figure 5. PV curtailment control.
When analyzing the frequency regulation capability of the PV system to cope with load disturbances, it is necessary to establish the dynamic coupling relationship between its frequency regulation output, grid frequency deviation, and the maximum active output of the PV. To this end, the load shedding rate of the PV power system can be defined as the proportion of the actual operating power reserved relative to the maximum power, which is expressed as Equation 16:
where Kf is the rated load deloading rate, and f0 is the rated frequency of the grid, 0.7 < d < 1.
The active power output from the PV under load deloading control is
In Equation 17, when the power system frequency drops, Δf<0, the PV power system releases the reserved reserve power by increasing the load shedding rate d, thus increasing the active output and helping the grid to realize rapid frequency recovery.
When the power system frequency rises, Δf>0, the PV system increases the reserve power by reducing the load shedding rate d, thus reducing the active output and absorbing the excess power from the grid, and suppressing the further rise of frequency.
2.3.2 Dynamic virtual inertia control for ESS
When a PV-ESS system is subjected to random power perturbations, it is necessary to maintain power balance through the coordination of internal energy units. Due to the intermittent and fluctuating characteristics of PV power, this time, the ESS also must undertake the task of frequency regulation, through the rapid power response to restore the system frequency to the rated range. However, the regulation ability of energy storage and its charge state SOC has a coupling relationship; if the state of SOC is ignored in the control, it may lead to the energy storage battery entering a deep charging and discharging state. This not only accelerates the capacity degradation of the energy storage battery but also may lead to an early exit from operation due to triggering the overcharge/overdischarge protection mechanism, which in turn exacerbates the system frequency instability. In order to better utilize the frequency fast response regulation capability of the energy storage, as well as to protect the battery from overcharging and overdischarging, this article proposes to realize the output adaptive virtual inertia control coefficients based on the state of the SOC as the input and the GA-BP. The adaptive control strategy can effectively maintain the SOC in the healthy working interval of 20%–80%, avoid overcharging and overdischarging of the energy storage, guarantee the safe operation of the energy storage equipment, and improve the frequency regulation capability of the energy storage system. Figure 6 shows the block diagram of the virtual inertia control for ESS.
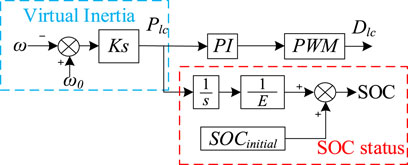
Figure 6. ESS-based virtual inertia control.
The active power supplied by the storage battery through virtual inertia control when the system frequency changes is
In Equation 18, where ∆Plc is the charging and discharging power of the ESS; K is the dynamic virtual inertia coefficient.
In Equation 19, where k1 is the frequency regulation factor when the ESS is discharged; k2 is the frequency regulation factor when the ESS is charged.
Among them, Figure 1 shows that taking the SOC state as the input of GA-BP and the dynamic virtual inertia coefficient K as the output, we can dynamically adjust the power output of the energy storage system according to the state of the SOC of the energy storage system and better serve the system for frequency regulation.
In order to make the energy storage system have a better frequency regulation effect and not cause damage to the storage battery, when the SOC of the energy storage is close to SOCmin, k2 is set as the maximum value, and k1 decreases with the decrease of the SOC. When the SOC of energy storage is close to SOCmax, k1 is set as the maximum value, and k2 decreases with the increase of SOC. Therefore, in this article, the dynamic virtual inertia coefficient K output from GA-BP is characterized by the change of S-type function (sigmoid function), and the specific relational equations are given by Equations 20, 21:
where Kmax is the maximum value of the dynamic virtual inertia coefficient; n is a constant for adjusting the nonlinear characteristics of the function.
The specific SOC formula can be expressed as Equation 22:
where SOC(t) is the value of SOC at moment t; SOCinitial is the initial SOC value; E is the energy capacity of the energy storage system.
The SOC of the energy storage system generally has upper and lower limits, and the allowable range of SOC can be expressed as Equation 23
where SOCmin denotes the lowest charge state allowed for the energy storage battery, and SOCmax denotes the highest charge state allowed for the energy storage battery.
As shown in Figure 7, the SOC above SOCmax or below SOCmin is a forbidden zone. The energy storage system is not allowed to work in this area so as not to affect the service life of the storage battery. In the optical storage system, the charging and discharging power limit of the energy storage system is often linked with the SOC. When the SOC is close to the lower limit of SOCmin, the discharge power is limited to avoid deep discharge; when the SOC is close to the upper limit of SOCmax, the charging power is limited to prevent overcharging.
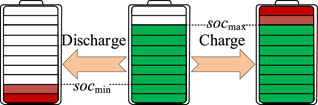
Figure 7. SOC dynamic variation curve.
3 Adaptive control strategy for optical storage based on GA-BP
GA has a strong global search ability that can avoid the defect of traditional optimization methods falling into local optimal solutions. In this article, GA and BP neural networks are deeply integrated to construct a GA-BP neural network optimization algorithm model, and through the synergistic cooperation of the two, a hybrid algorithm with better performance is obtained to optimize the parameters of the optical storage system. On the one hand, the BP is used to adjust the parameters of the PV-ESS dynamically according to the error of the desired signal and the actual signal; on the other hand, the GA is used to optimize the weight and bias of the BP globally, which significantly improves the efficiency of parameter search. The weights and biases of the BP are optimized globally with the help of GA, which significantly improves the parameter optimization efficiency. In this model, the GA dynamically optimizes the initial weights and bias parameters of the BP to break through the limitations of the traditional random initialization on the performance of the network so that the model has a faster convergence speed and a stronger generalization ability. The following are the specific steps of the algorithm implementation:
(1) The dynamic model of PV-ESS is formulated in Equation 24
where
(2) Design the BP neural network controller as Equation 25
where W = {wij, Wij}; B = {bj, Bj}; wij is the hidden layer input weight; Wij is the hidden layer output weight; bj is the hidden layer input bias; Bj is the hidden layer output bias.
(3) Define the multi-objective loss function as Equation 26
The following is a specific explanation of each part of the multi-objective loss function as A:
In Equation 27, where yref(t) is the literature output; y(t) is the actual output. This equation calculates the difference between the literature output yref(t) and the actual output y(t).
In Equation 28, where λ1 is the weighting factor. This equation is used to prevent overfitting and make the model more generalized by increasing the penalty term of the weights.
In Equation 29, where λ2 is the weighting factor of the control energy consumption term. This equation reduces the energy consumption of the system by minimizing the control input.
In Equation 30, where λ3 is the weighting factor of the battery aging term. This equation is used to reduce the number and magnitude of charging and discharging of the battery, thus prolonging the lifetime of the battery.
(3) Chromosome code length:
(4) The chromosome code length is defined by Equation 31:
(5) The fitness function is defined by Equation 32:
where β is the aging penalty factor.
(6) The genetic selection operation is defined by Equation 33:
For each individual k in the population, calculate its selection probability:
where N is the population size.
(7) The crossover operation is defined by Equations 34, 35:
Cross-segmentation is used for the selected parents (P1, P2) for the neural network hidden layer weights wij part:
Bias the bj part to the neural network:
where
(8) The mutation operation is defined by Equations 36–38:
For each locus xi, mutate with probability pm:
where xi′ is the gene value after the mutation. xi is the original gene value.
Calculate the intensity of variation
where
Projective corrections are applied to the mutated parameters:
(9) The BP neural network design is formally expressed in Equations 39–43:
Step 1. Import the input variables. The ith neuron in the input layer is Xi;
Step 2. Calculate the input value
The activation function of the hidden layer uses the sigmoid function:
Step 3. Calculate the input and output quantities of the output layer. The input
The output of neuron i in the output layer,
where the activation function of the output layer is also chosen to use the sigmoid function.
The above GA-BP is applied to the optimization process of the VSG control parameters J and D of the optical storage system, as well as the virtual inertia coefficient K of the energy storage dynamics. The flowchart of the GA-BP shown in Figure 8 is obtained. First, the GA is used to find the optimal weights and bias values in the BP; then the optimal weights and bias values are inputted into the BP; then the BP dynamically outputs the control parameters such as K, J, and D according to the inputs as well as the optimal weights and bias values, and the parameters are returned to Equations 2, 18 after the adaptive adjustments to realize the adaptive closed-loop control of K, J, and D. Closed-loop control can be realized by returning the adaptively adjusted parameters to Equations 2, 18.
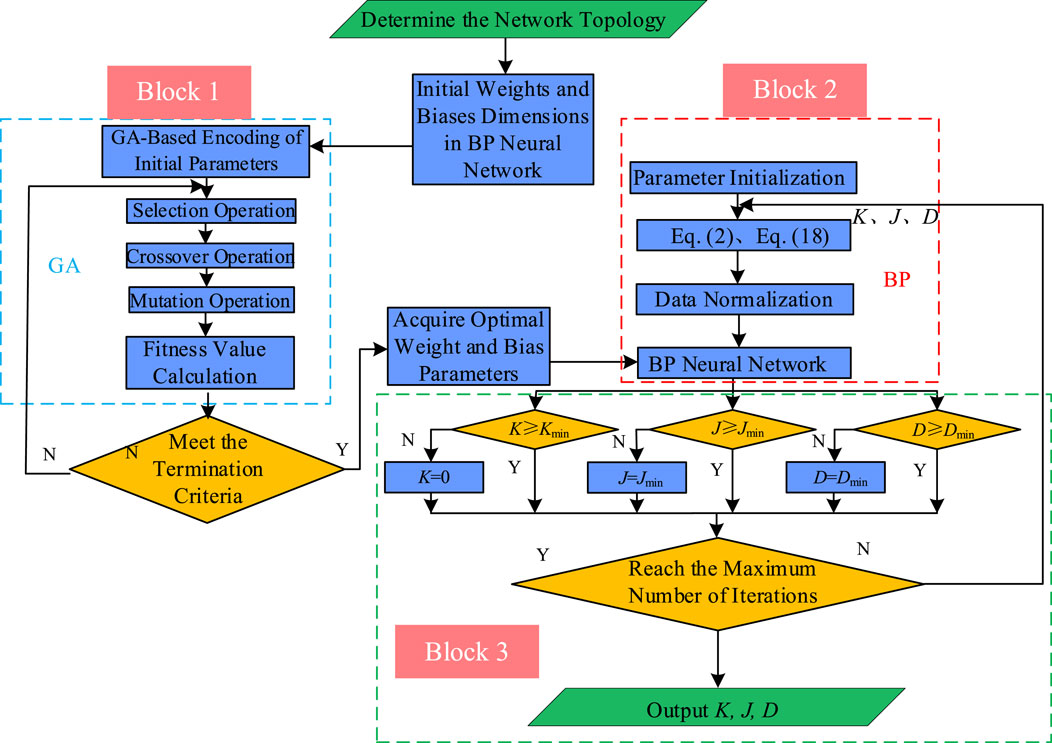
Figure 8. Parameter optimization process based on GA-BP.
4 Calculation design
In this study, a digital twin model of an optical storage, multi-source cooperative control system is constructed based on the RT-LAB platform, and the proposed cooperative control strategy is verified through comparative simulation. As shown in Figure 9, the real-time simulation system adopts a heterogeneous computing architecture, integrating multi-core CPUs, field-programmable gate array (FPGA) hardware acceleration units, and development hosts, in which the CPU cluster undertakes the numerical solving tasks of the electromagnetic transient model of the new energy station cluster and the dynamic model of the three-machine, nine-node system and realizes multi-protocol communication, such as CAN and IEC61850. The FPGA module performs the microsecond-level step execution of the power electronics converter. The FPGA module performs accurate power electronic converter modeling and SFP + fiber optic communication protocol processing in microsecond steps and realizes nanosecond data interaction with the main computing unit via PCIe Gen4 ×16 bus, constructing a deterministic simulation environment with a fixed step size of 50 ms for the whole system.
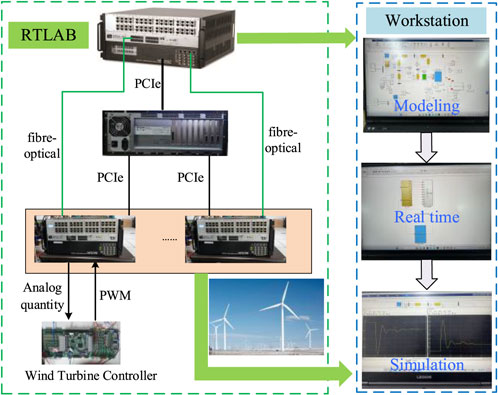
Figure 9. RTLAB platform.
The installed capacity of the PV array is 4 MW. The parameters of the PV array are set according to the model of SunPower SPR-200-WHT-U, and 20 strings and 20 parallels are set as a group; there are a total of 50 groups under the standard ambient temperature and irradiance conditions. The output power of this PV array is maximally 4 MW. PV strings are connected to the converter through a convergence box and then connected to the DC bus after boosting. The DC side voltage is 600 V, and the AC side voltage is 380 V. After two boosts, the PV string is connected to the 35-kV main grid. The installed capacity of the energy storage system is 1 MW, and the rated load shedding rate of PV is Kf = 0.9. The parameter of the energy storage system is SOCinitial = 0.8. The simulation results are based on the standardized value, and the power literature value is 5 MW.
4.1 Comparison of frequency regulation
Figure 10 displays the frequency response curves of photovoltaics, energy storage, and the joint participation of photovoltaics and energy storage in frequency regulation. The case is at t = 5 s, load surge ΔPW = 0.1 p.u.
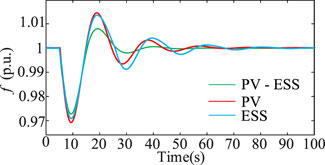
Figure 10. PV-ESS frequency response curve.
From Table 1, it can be seen that PV-ESS joint participation in the frequency lowest point of change is 0.027 p.u., the highest point of frequency overshooting amount is 0.008 p.u., and the steady-state recovery time is 45 s. Meanwhile, the PV frequency lowest point of change is 0.03 p.u., the highest point of frequency overshooting amount is 0.015 p.u., the steady-state recovery time is 70 s, the lowest point of change in the E frequency 0.029 p.u., the highest point of frequency overshooting amount is 0.014 p.u., and the steady-state recovery time is 75 s. The ESS frequency’s lowest point of change amount is 0.027 p.u. The frequency of the highest point of overshooting is 0.014 p.u., and a steady-state recovery time of 75 s can be obtained. The PV-ESS joint participation in the frequency regulation effect is better.
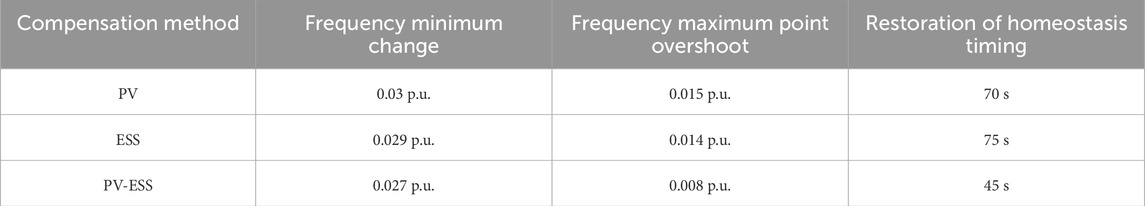
Table 1. Comparison of PV, ESS, and PV-ESS.
4.2 Comparison of J and D
Figure 11 demonstrates the fixed J, D and dynamic J, D frequency response curves under VSG control. The test case is a load surge at time t = 5 s, and ΔPW = 0.1 p.u. Only PV is involved in adjusting the frequency in this case.
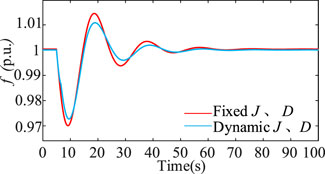
Figure 11. Frequency response curves of fixed vs. dynamic J and D.
In the case of fixed J and D control, the frequency nadir is approximately 0.970 p.u., the variation is 0.030 p.u., the overshoot is approximately 0.015 p.u., and the steady-state recovery time is 70 s. In the case of dynamic J and D control, the frequency nadir is approximately 0.971 p.u., the variation is 0.029 p.u., and the overshoot is approximately 0.012 p.u. The steady-state recovery time is 60 s.
From Table 2, it can be concluded that the frequency minimum change is reduced by 3.33%, the overshoot is reduced by 20%, and the steady-state recovery time is reduced by 14.3% under dynamic J and D control compared to under fixed J and D control.
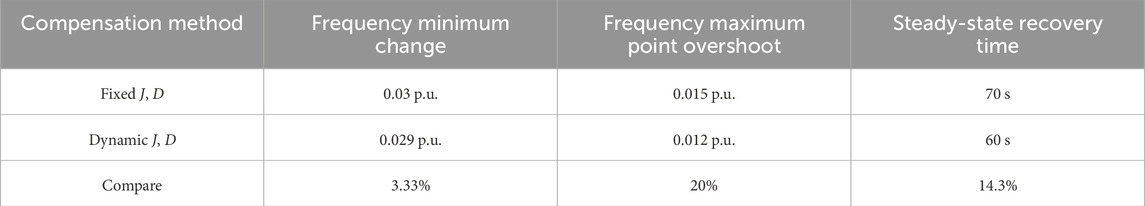
Table 2. Comparison of fixed J, D, and dynamic J, D.
4.3 Comparison of K for ESS
Figure 12 demonstrates the energy storage fixed K and dynamic K frequency response curves. The test case is a load surge ΔPW = 0.1 p.u. at time t = 5 s. In this case, only ESS is involved in frequency regulation.
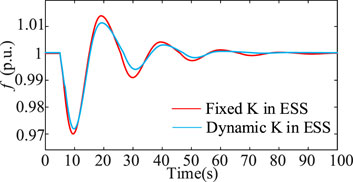
Figure 12. Frequency response curves of fixed K vs. dynamic K.
In the case of fixed K control, the frequency nadir is approximately 0.971 p.u., the variation is 0.029 p.u., the overshoot is approximately 0.014 p.u., and the steady-state recovery time is 75 s. In the case of dynamic K control, the frequency nadir is approximately 0.972 p.u., the variation is 0.028 p.u., the overshoot is approximately 0.011 p.u., and the steady-state recovery time is 60 s.
From Table 3, it can be concluded that the frequency minimum change is reduced by 3.45%, the overshoot is reduced by 21.43%, and the steady-state recovery time is reduced by 20% under dynamic K control compared to under fixed K control.
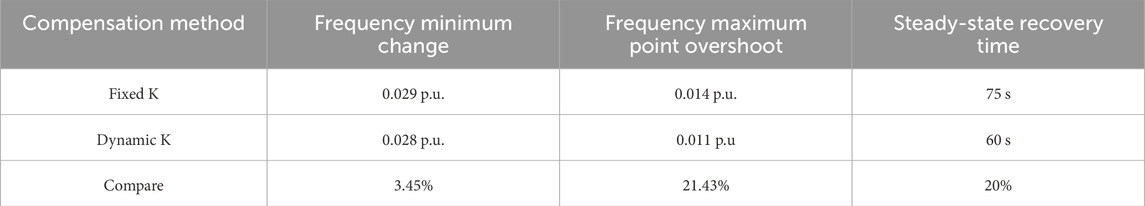
Table 3. Fixed K vs. dynamic K.
4.4 Comparison of K, J, and D
Figure 13 demonstrates the frequency response curves of PV-ESS with fixed K, J, and D parameters versus dynamically adjusted K, J, and D parameters. The test case involves a sudden load increase of ΔPW = 0.1 p.u. at t = 5 s, with both PV-ESS participating in frequency regulation in this case.
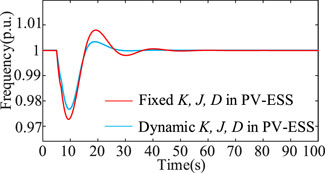
Figure 13. Frequency response curves of fixed vs. dynamic K, J, and D in PV-ES.
In the case of fixed K, J, and D control, the frequency nadir is approximately 0.973 p.u., the variation is 0.027 p.u., the overshoot is approximately 0.008 p.u., and the steady-state recovery time is 45 s. In the case of dynamic K, J, and D control, the frequency nadir is approximately 0.977 p.u., the variation is 0.023 p.u., the overshoot is approximately 0.003 p.u., and the steady-state recovery time is 25 s.
From Table 4, it can be concluded that the amount of frequency nadir change is reduced by 14.81%, the amount of overshooting is reduced by 62.5%, and the steady-state recovery time is reduced by 44.44% under dynamic K, J, and D control compared to under fixed K, J, and D control.
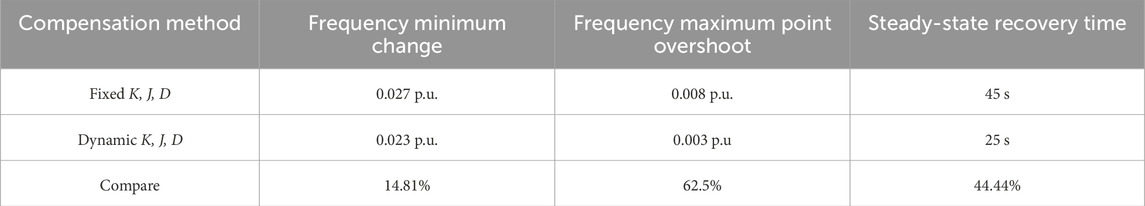
Table 4. Fixed K, J, D vs. dynamic K, J, D.
Figure 14 shows the case of optimizing the frequency regulation of PV-ESS parameters using BP and GA-BP. The case is a sudden increase in load ΔPW = 0.1 p.u. at time t = 5 s.
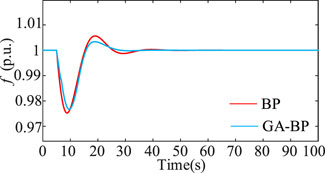
Figure 14. Frequency response curves of BP vs. GA-BP.
Under the BP optimization, the frequency nadir is approximately 0.975 p.u., the variation is 0.025 p.u., the overshoot is approximately 0.006 p.u., and the steady-state recovery time is 40 s. Under the GA-BP optimization, the frequency nadir is approximately 0.977 p.u., the variation is 0.023 p.u., the overshoot is approximately 0.003 p.u., and the steady-state recovery time is 25 s.
From Table 5, it can be concluded that GA-BP is optimized over BP. The amount of frequency nadir variation is reduced by 8%, overshooting is reduced by 50%, and the steady-state recovery time is reduced by 37.5%.
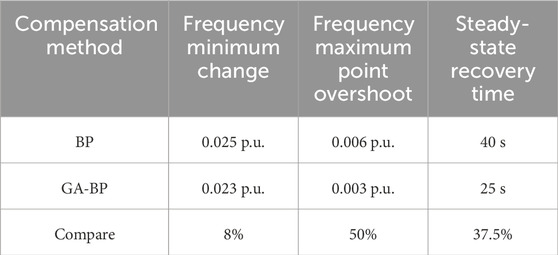
Table 5. Comparison between BP and GA-BP.
5 Conclusion
This article proposes a GA-BP-based adaptive parameter adjustment method to dynamically optimize the virtual inertia J, damping coefficient D, and droop coefficient K in real time. A GA-BP driven adaptive optimization strategy for PV-ESS is developed to suppress frequency oscillations, shorten regulation time, and enhance system stability. The main conclusions are as follows:
(1) Compared to fixed-parameter control strategies for K, J, and D, the proposed GA-BP-based parameter adaptive dynamic adjustment strategy significantly improves frequency stability and dynamic response performance. The frequency nadir deviation is reduced by 14.81%, the overshoot amplitude is suppressed by 62.5%, and the steady-state recovery time is shortened by 44.44%, demonstrating the effectiveness of the proposed strategy in enhancing transient stability and mitigating power oscillations.
(2) In contrast to conventional BP-based adaptive adjustment of K, J, and D, the GA-BP collaborative control strategy, which integrates the global optimization capability of genetic algorithms, further enhances the dynamic characteristics of frequency regulation. The frequency nadir deviation is decreased by 8%, the overshoot amplitude is reduced by 50%, and the steady-state recovery time is accelerated by 37.5%, highlighting the superior convergence efficiency and robustness of the GA-BP neural network in parameter coordination and optimization.
(3) While the proposed GA-BP-based dynamic optimization method for PV-ESS frequency regulation parameters demonstrates advantages in improving coordinated frequency control, its application scope and generalizability remain limited. The study does not validate the adaptability of the method in wind turbine frequency regulation systems. Due to inherent differences in dynamic response characteristics between wind turbines and PV-ESS, the parameter optimization efficacy of the current strategy may be constrained in wind power scenarios. Furthermore, multi-energy coordinated frequency regulation mechanisms and robustness under extreme disturbances have not been thoroughly explored, necessitating further validation and framework development in future research.
Data availability statement
The original contributions presented in the study are included in the article/supplementary material; further inquiries can be directed to the corresponding author.
Author contributions
RM: writing – review and editing and conceptualization. HS: writing – review and editing, funding acquisition, and conceptualization. YZ: investigation and writing – review and editing. XW: methodology, writing – review and editing, and data curation. SL: writing – original draft. ZZ: visualization, validation, and writing – review and editing. GW: writing – review and editing. SL: funding acquisition, supervision, and writing – review and editing.
Funding
The author(s) declare that financial support was received for the research and/or publication of this article. This work was supported in part by the National Natural Science Foundation of China (52037003), the Major Science and Technology Projects in Yunnan Province (202402AG050006), and Yunnan Fundamental Research Projects (202401BE070001-014).
Conflict of interest
Authors RM, YZ, XW, and ZZ were employed by Yunnan Electric Power Test and Research Institute (Group) Co., Ltd.
The remaining authors declare that the research was conducted in the absence of any commercial or financial relationships that could be construed as a potential conflict of interest.
Generative AI statement
The author(s) declare that no Generative AI was used in the creation of this manuscript.
Publisher’s note
All claims expressed in this article are solely those of the authors and do not necessarily represent those of their affiliated organizations, or those of the publisher, the editors and the reviewers. Any product that may be evaluated in this article, or claim that may be made by its manufacturer, is not guaranteed or endorsed by the publisher.
References
Chai, H., Zhang, X., and Mingxian, L. (2021). Mechanism for photovoltaic generation system suppressing power system oscillations. Power Syst. Technol. 45 (05), 1809–1818. doi:10.13335/j.1000-3673.pst.2020.0090
Chen, J., Chen, J., and Wang, W. (2024). Control strategy for a virtual synchronous generator using a multi-parameter cooperative adaptive method. Power Syst. Prot. Control 52 (23), 74–85. doi:10.19783/j.cnki.pspc.240379
Dang, S., Sun, L., and Wang, S. (2025). Optimization strategy of frequency modulation double-layer power for multiple energy storage power plants taking into account system economics and load state balance. Energy Storage Sci. Technol. 14 (03), 1247–1257. doi:10.19799/j.cnki.2095-4239.2024.1004
Fu, Y., Zhang, B., and Zhang, X. (2024). Multi-objective coordinated control of frequency support and power oscillation for energy storage under virtual synchronous coupling. Electr. Power Autom. Equip. 44 (09), 1–9+23. doi:10.16081/j.epae.202310001
He, L., Guo, L., and Tan, Z. (2024). Improved dead zone setting of a frequency regulation strategy for energy storage with high penetration of RESs. Power Syst. Prot. Control 52 (18), 65–75. doi:10.19783/j.cnki.pspc.231540
Hongchun, S., He, Y., Wang, G., Zhang, H., Shi, B., and Luo, S. (2025). Research on water hammer effect and cooperative frequency regulation technology of PV-hbess compensated hydroturbine. IEEE Trans. Sustain. Energy 16 (2), 919–932. doi:10.1109/TSTE.2024.3487865
Jia, J., Xiangwu, Y., and Tiecheng, L. (2022). A fast frequency regulation strategy for energy storage assisted photovoltaic units based on improved RoCoF measurement method. Trans. China Electrotech. Soc. 37 (S1), 93–105. doi:10.19595/j.cnki.1000-6753.tces.210610
Jianhui, M., Yi, W., Peng, J., Xu, L., and Yin, J. (2019). Flexible virtual synchronous generator control for distributed generator with adaptive inertia. Electr. Power Components Syst. 47 (1-2), 128–140. doi:10.1080/15325008.2018.1563958
Kurm, S., and Agarwal, V. (2021). Interfacing standalone loads with renewable energy source and hybrid energy storage system using a dual active bridge based multiport converter. IEEE J. Emerg. Sel. Top. Power Electron. 10 (4), 4738–4748. doi:10.1109/JESTPE.2021.3118462
Lu, S., Zhu, Y., and Chen, T. (2024). Adaptive control strategy of damped inertia based on improved particle swarm algorithm. Proc. CSU-EPSA 36 (04), 68–75. doi:10.19635/j.cnki.csu-epsa.001287
Nguyen, H. T., Yang, G., Nielsen, A. H., and Jensen, P. H. (2019). Combination of synchronous condenser and synthetic inertia for frequency stability enhancement in low-inertia systems. IEEE Trans. Sustain. Energy 10 (3), 997–1005. doi:10.1109/TSTE.2018.2856938
Pei, J., Jun, Y., Ruikuo, L., Zeng, D., Sun, P., Zhang, H., et al. (2020). Characteristic analysis and risk assessment for voltage-frequency coupled transient instability of large-scale grid-connected renewable energy plants during LVRT. IEEE Trans. Industrial Electron. 67 (7), 5515–5530. doi:10.1109/TIE.2019.2931256
Peng, S., Wang, Y., and Wang, X. (2025). Analysis of frequency dynamic characteristics of power system considering the role of photovoltaic frequency regulation. Electr. Power Autom. Equip. 45 (05), 110–117+184. doi:10.16081/j.epae.202503033
Qian, T., Liang, S., and Peng, G. (2024). Simulation study on primary frequency regulation of pumped storage unit assisted by flywheel energy storage. Acta Energiae Solaris Sin. 45 (11), 619–626. doi:10.19912/j.0254-0096.tynxb.2023-1071
Ren, H. (2024). Research on coordinated control technology of energy storage based on fast frequency and voltage regulation. Process Autom. Instrum. 45 (12), 39–43. doi:10.16086/j.cnki.issn1000-0380.2023090018
Ren, H., Qi, C., and Zhang, L. (2020). Parameter adaptive strategy for virtual synchronous generator control. Control Theory and Appl. 37 (12), 2571–2580. doi:10.7641/CTA.2020.90123
Ren, M., Tong, L., Shi, K., Xu, P., and Sun, Y. (2021). Coordinated control strategy of virtual synchronous generator based on adaptive moment of inertia and virtual impedance. IEEE J. Emerg. Sel. Top. Circuits Syst. 11 (1), 99–110. doi:10.1109/JETCAS.2021.3051320
Shenghu, Li, Junwei, G., and Weijian, X. (2024). Small disturbance stability constrained optimal power flow algorithm of photovoltaic grid-connected power systems with virtual synchronous generator. Acta Energiae Solaris Sin. 45 (12), 146–153. doi:10.19912/j.0254-0096.tynxb.2023-1331
Sun, R., Gao, B., and Hu, Z. (2022). Economic optimization design method of primary frequency regulation parameters of cluster photovoltaic power stations. Acta Energiae Solaris Sin. 43 (04), 204–212. doi:10.19912/j.0254-0096.tynxb.2020-0831
Tiecheng, L., Peng, Y., and Hu, X. (2023). Research on storage-assisted frequency regulation control strategy in photovoltaic high occupancy system. J. Sol. Energy 44 (08), 282–291. doi:10.19912/j.0254-0096.tynxb.2022-0580
Ur Rehman, H., Yan, X., Abdelbaky, M. A., Ullah Jan, M., and Iqbal, S. (2021). An advanced virtual synchronous generator control technique for frequency regulation of grid-connected PV system. Int. J. Electr. Power Energy Syst. 125, 106440. doi:10.1016/j.ijepes.2020.106440
Yongxi, Z., and Jiangrong, Y. (2023). Coordinated control strategy for photovoltaic hybrid energy storage based on improved virtual synchronous machine. Water Resour. Power 41 (08), 219–222+218. doi:10.20040/j.cnki.1000-7709.2023.20221357
Zhang, X., Wang, Z., and Fu, Y. (2023). Virtual shafting coupling and synchronous control for photovoltaic energy storage system. High. Volt. Eng. 49 (01), 342–352. doi:10.13336/j.1003-6520.hve.20211165
Zhang, Y., Guo, M., and Kou, P. (2024). Cooperative frequency regulation control strategy for multiple PV plants based on average consistent algorithm. Control Eng. China 31 (11), 2104–2111. doi:10.14107/j.cnki.kzgc.20230541
Zhang, Y., Sun, X., and Fu, W. (2022). Parameter coordinated fuzzy adaptive VSG control strategy. Electron. Meas. Technol. 45 (21), 1–7. doi:10.19651/j.cnki.emt.2209740
Zhao, B., Tang, Y., and Xu, H. (2024). Optimal setting of power and frequency parameters for voltage-type distributed photovoltaic-virtual synchronous generator based on transient search optimization. Automation Electr. Power Syst. 48 (20), 25–35. doi:10.7500/AEPS20240227009
Zhao, T., Parisio, A., and Milanović, J. V. (2020). Distributed control of battery energy storage systems for improved frequency regulation. IEEE Trans. Power Syst. 35 (5), 3729–3738. doi:10.1109/TPWRS.2020.2974026
Zhong, C., Huayi, L., Yang, Z., Lv, Y., Chen, J., and Li, Y. (2022). Virtual synchronous generator of PV generation without energy storage for frequency support in autonomous microgrid. Int. J. Electr. Power Energy Syst. 134, 107343. doi:10.1016/j.ijepes.2021.107343
Keywords: coordinated PV-ESS control, frequency regulation, GA-BP neural network, deloading control, dynamic parameters
Citation: Mu R, Shu H, Zhang Y, Wan X, Luo S, Zhou Z, Wang G and Lei S (2025) Frequency coordinated control and parameter optimization for photovoltaic–energy storage systems based on a GA-BP hybrid algorithm. Front. Energy Res. 13:1640949. doi: 10.3389/fenrg.2025.1640949
Received: 04 June 2025; Accepted: 30 June 2025;
Published: 04 August 2025.
Edited by:
Xiangyu Zhang, North China Electric Power University, ChinaCopyright © 2025 Mu, Shu, Zhang, Wan, Luo, Zhou, Wang and Lei. This is an open-access article distributed under the terms of the Creative Commons Attribution License (CC BY). The use, distribution or reproduction in other forums is permitted, provided the original author(s) and the copyright owner(s) are credited and that the original publication in this journal is cited, in accordance with accepted academic practice. No use, distribution or reproduction is permitted which does not comply with these terms.
*Correspondence: Shunji Luo, bHVvc2h1bmppQHN0dS5rdXN0LmVkdS5jbg==