 Jing dong Xie
 Yuqi Yang1*
- 1College of Electrical Engineering, Shanghai University of Electric Power, Shanghai, China
- 2College of Mathematics and Physics, Shanghai University of Electric Power, Shanghai, China
- 3College of Economics and Management, Shanghai University of Electric Power, Shanghai, China
- 4Shanghai University of Electric Power, Shanghai, China
The integration of high-penetration distributed renewable energy sources into new power systems introduces significant challenges, particularly frequent reverse power flows that threaten substation security. To address this issue, this paper proposes a novel safety assessment method based on a system dynamics (SD) framework. This approach uniquely emphasizes the critical roles of electrical interconnections among substation equipment and the fluctuations in distributed power output. The methodology involves analyzing operational characteristics to establish equipment correlations, developing a comprehensive fault probability function for each equipment by integrating multi-dimensional monitoring data and fault propagation factors, and constructing a system dynamics model using an adjacency matrix to represent operational relationships. The effectiveness of the proposed method is validated through a case study on a regional substation. Results demonstrate its capability to dynamically and accurately evaluate both equipment-level and system-wide safety status under reverse power flow conditions, providing a robust tool for enhancing the security and resilience of modern power systems.
1 Introduction
Under the “Dual Carbon” strategic goals, the traditional power system is rapidly transitioning towards a new type of power system characterized by a high penetration of renewable energy sources and power electronic devices. Within this context, substations, serving as critical hubs of the power grid, are experiencing increasingly complex operating environments. They face new challenges such as uncertain power flow directions and bidirectional fault propagation, which impose higher demands on safety assessment methodologies (Yan, 2025).
Current research addresses these challenges primarily from two perspectives. Regarding power system security assessment with high renewable integration, numerous studies have focused on the distribution network or system level. For instance, (Du et al., 2022), employed a Markov model to analyze overload risks in distribution networks with high photovoltaic penetration. Ge et al. (2020) and Lin et al. (2021) established probabilistic assessment frameworks and long term load security assessment models, respectively, based on distributed PV Beta probability models and time varying load characteristics. Recently, Yu et al. (2024) proposed a risk assessment index for reverse overload in distribution networks using a combination of entropy weight and analytic hierarchy process, demonstrating attention to new problems in the new power system. However, these methods predominantly concentrate on load security analysis at the system level and often lack granular analysis within the substation, particularly overlooking the mutual influences between key internal equipment. Furthermore, Zhang et al. (2021) took a more comprehensive approach by integrating equipment’s own state, environmental factors, and power supply connectivity for substation safety assessment, yet their work did not account for the critical impact of bidirectional power flow inherent in new power systems.
At the equipment level within substations, data driven assessment methods have become mainstream with the proliferation of monitoring technologies. Early research assessed substation reliability by establishing time varying equipment failure rate models (Mitchurechart and Chaitusaney, 2013; Duan et al., 2011). To accurately evaluate the status of individual equipment, scholars have developed a variety of assessment methods. Early research primarily focused on intelligent evaluation techniques based on uncertainty theory, such as multi-modal data fusion (Yang, et al., 2025), the integration of fuzzy cloud models with D-S evidence theory (Huang, et al., 2025), and variable-weight grey cloud models (Du and Sun, 2020). Subsequent work (Wei, et al., 2023; Wang, et al., 2023) further emphasized the importance of integrating multi-source data for the health assessment of primary equipment, reflecting a trend toward data-driven approaches and information integration in the field. In recent years, deep learning techniques, including support vector machines (Fang, et al., 2020) and long short-term memory networks (Dai, et al., 2018), have been increasingly adopted, promoting the transition of equipment state assessment toward intelligentization. The research frontier of substation safety assessment is gradually shifting from single-equipment evaluation to multi-equipment coordination and multi-source data fusion. However, existing methods remain predominantly concentrated on system-level topological analysis or in-depth characterization of individual equipment, leaving the comprehensive safety assessment problem—which involves dynamic inter-equipment correlations and coupled operational states—insufficiently addressed.
Existing methods still suffer from two main shortcomings: Firstly, they fail to dynamically couple the key characteristic of uncertainty in power flow direction—driven by renewable energy fluctuations in the new power system—with the electrical connection relationships of equipment within the substation. Secondly, there is a lack of an assessment framework capable of quantifying the risk propagation effects arising from functional coupling between equipment at an integrated, system wide level. Table 1 presents a comparison between the proposed method and prior studies.
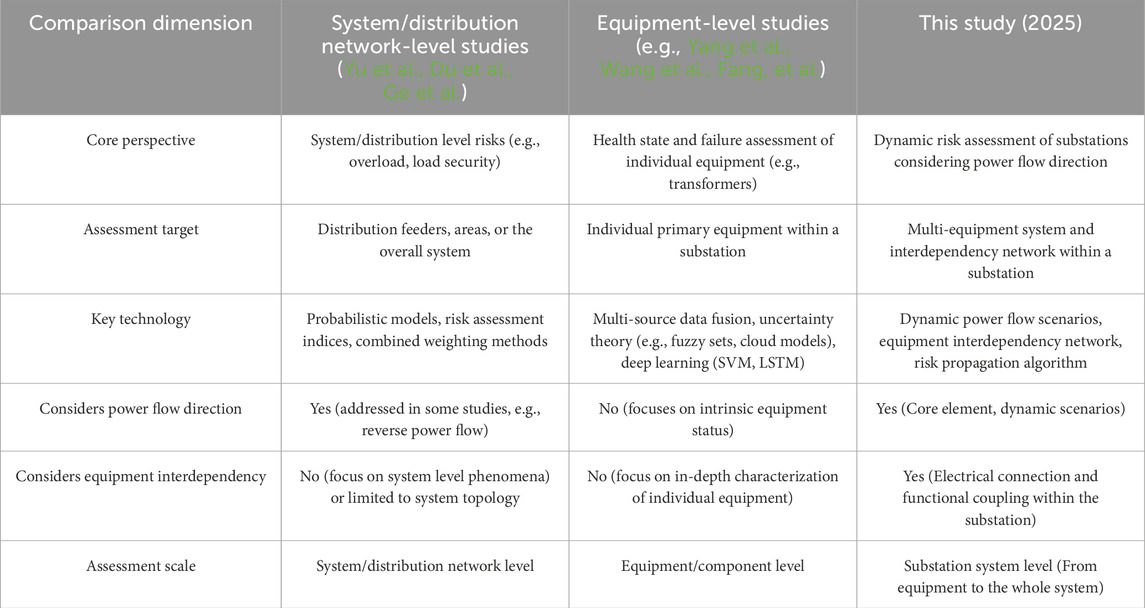
Table 1. Comparative analysis of the proposed method and prior studies.
To address these research gaps, this study proposes a dynamic security risk assessment method for substations that accounts for both power flow direction and equipment interdependencies. System Dynamics (SD) is effective in analyzing nonlinear causal relationships among multiple factors (Liu, et al., 2022; Peng, et al., 2023). Therefore, this paper introduces the SD method to solve the aforementioned problems. The structure of this paper is organized as follows: Section 2 presents the construction process of equipment interconnection relationships. Section 3 details the development of a security assessment model for substation equipment. Section 4 describes the formulation of a system level security assessment model for the substation system. Section 5 validates the effectiveness of the proposed method through a case study. Finally, Section 6 concludes the paper and discusses potential directions for future research.
The core innovations of the proposed method are: ① the introduction of bidirectional power flow operating scenarios to accurately reflect system characteristics under high renewable energy penetration; ② the construction of an intra substation equipment association network model to quantify the risk conduction impact of key equipment (e.g., transformers, circuit breakers) failures on other equipment via electrical connections; and ③ the combination of dynamic power flow scenarios with the equipment association network to realize dynamic assessment of the overall substation risk.
2 Analysis of substation equipment connectivity under high penetration of distributed renewable energy
The high penetration of distributed renewable energy introduces uncertainty in the current direction of the substation equipment. Therefore it is necessary to determine both the power supply connectivity status of equipment and the direction of the current flow to accurately identify the operational topology of the substation.
2.1 Equipment power connectivity
In contrast to the substation operation in traditional power system, the integration of distributed photovoltaic (PV) necessitates that equipment operation status considers not only consider the power supply connectivity of the equipment but also the direction of the power flow. This dual consideration enables a more precise determination of both equipment connectivity within the substation and the prevailing power flow directions.
The power supply connectivity status of device
Here,
The direction of current flow in device
2.2 Equipment connection status
Based on both equipment power connectivity and current direction, the study by Yang et al. (2021) proposed an analytical method to sequentially enumerate the failures of primary side substation equipment. They determined the extent of failure propagation based on the topology diagram of the electrical connections and the switching devices configuration. Given the low probability of simultaneous failures in multiple devices, only single device faults are considered in this analysis. If a device failure is isolated and does not affect others, the failure probabilities of remaining equipment remain unchanged. However, If equipment failure or other causes result in a power outage that affects the operation of downstream equipment, it is necessary to determine the affected equipment based on the substation topology relationship diagram and increase the probability of failure of the affected equipment.
As an illustrative example, consider a 110 kV substation whose main equipment wiring diagram is shown in Figure 1.
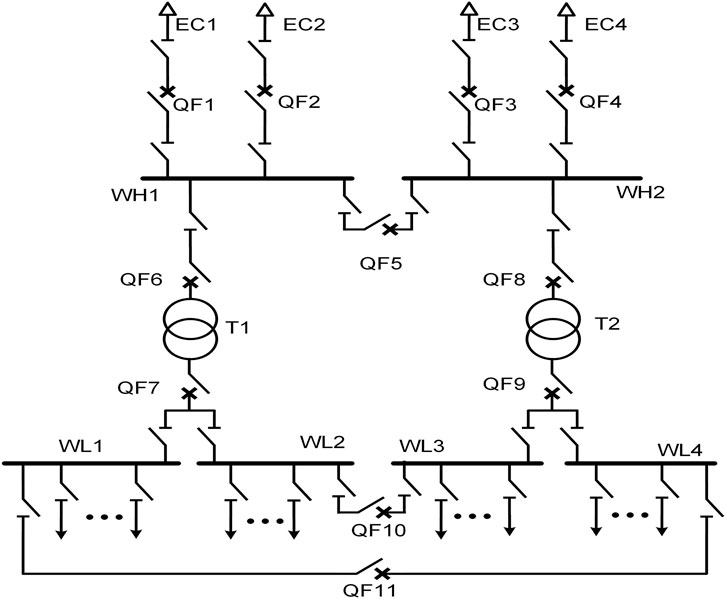
Figure 1. Primary equipment wiring diagram of a 110 kV substation.
The four major equipment types: transformers, busbars, cables, and circuit breakers, are abstracted as nodes. And the adjacency matrix (Hu, 2021) of the substation’s main wiring is constructed based on the connectivity relationships within the substation under different operating conditions, thereby capturing the influence of each equipment’s failure on others.
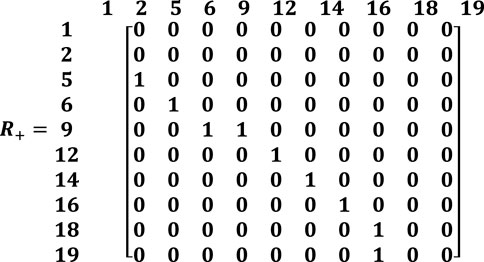
The adjacency matrix changes in real time with the operating state of the substation and substation equipment, defined as R in follow Equation 3. R is an upper triangular matrix when the current flowing is the positive direction, and R is a lower triangular matrix when the current is sent in the reverse direction.
The element
The core function of a substation is voltage transformation, and the prerequisite for voltage transformation is to ensure that the path between the incoming cables and the load outgoing cables remains connected. However, these points are usually not directly linked (i.e.,
The reachability matrix
In Equation 6,
Thus, the reachability matrix allows for determination of the electrical connection between the incoming cable and the load point, confirming whether the substation’s primary electrical path remains intact under varying conditions.
3 Construction of failure probability function for substation equipment
To perform a multidimensional safety assessment of substations, safety assessment indicators are established based on multidimensional substation monitoring data. Furthermore, failure probability functions for individual equipment are constructed using multidimensional monitoring indicators. The overall process for single equipment safety assessment is illustrated in Figure 2.
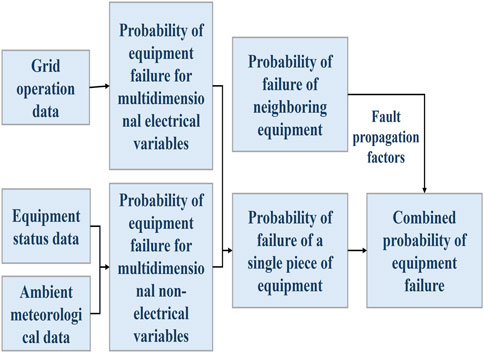
Figure 2. Equipment safety assessment flowchart.
Multidimensional monitoring indicators, including grid operation parameters, equipment status data, and ambient meteorological information, are selected to characterize equipment status. The electrical variable dimension of the equipment failure probability function is constructed based on electrical operational indicators; while the non-electrical variable dimension of the equipment failure probability function is established using equipment condition and ambient meteorological data. Furthermore, the influence of failures in adjacent equipment is incorporated to develop a comprehensive failure probability function for individual equipment. This integrated model enables real-time risk assessment and supports proactive protection of equipment safety.
3.1 Construction of probability functions for single device failures
The primary current-carrying equipment in substations mainly includes cable lines, transformers, busbars, circuit breakers, and other related components. Accordingly, this study focuses on the safety status assessment of transformers, cable lines, and circuit breakers. From the perspective of both internal and external influencing factors, electrical variables and non electrical variables representing the operational status of power system and equipment are key indicators of potential failures. These factors are interdependent, and anomalies in any of them warrant close attention (Xie and Xu, 2024). To capture this complexity, a series model is developed for individual equipment, integrating multi dimensional electrical and non-electrical variables into a unified failure probability function. Additionally, the model incorporates fault propagation probability between adjacent devices, resulting in a comprehensive estimation of overall equipment failure probability.
3.1.1 Transformer failure probability function
Failure records over a 5 year period from a province under jurisdiction indicate that the primary causes of oil immersed transformer failures include user related factors (59.2%), inherent equipment aging (20.5%), and external foreign object interference (11.0%), among others (Wang H. et al., 2020). Root cause analysis reveals that transformer failures predominantly stem from overload conditions and internal aging. Taking these factors into account, the failure probability function of the
Here,
3.1.1.1 Construction of equipment failure probability function based on multidimensional electrical variables
The first step involves calculating the equipment load factor
Where
According to relevant power transformer loading standards00 (National Standardization Administration, 2022; National Standardization Administration, 2024), a transformer is considered to be operating normally when the load factor is less than or equal to 80%. The transformer load factor between 80% and 100% indicates a heavy load condition, while the load factor exceeding 100% reflects an overload condition. Specifically, when the overload is 10%, the transformer can operate continuously for up to 180 min; at 20% overload, the permissible continuous operation time decreases to 150 min (Yu et al., 2024). These standards imply that both the magnitude and duration of overload significantly impact the severity of operational stress on the transformer. The higher the transformer load factor and the longer the cumulative over limit time, the more serious the heavy overload problem is.
To quantitatively describe the severity of a heavy load condition, the area under the curve of the load factor exceeding the rated limit over time is considered. The integral of the transformer load ratio exceeding the limit and the cumulative exceeding the limit time is synthesized to describe the severity of heavy overload of the transformer in two dimensions, denoted as
Where
When the PV increases causing reverse power flow, the transformer load factor may increase and even exceed the limit. However, Equation 9 alone fails to accurately characterize the overload condition when the trend reverses.
To address this, formulated analogously to the forward overload index, a reverse heavy load severity index
The relationship between the risk consequence and the overload severity is often nonlinear. The risk consequence typically exhibits exponential growth with increasing severity. To reflect this characteristic, a transformer heavy overload severity index is introduced using a utility function with risk preference characteristics, as suggested in (Kang and Kim, 2006). This function, denoted as
In addition to overload severity, voltage fluctuations on the high voltage (HV) side of the transformer also impact equipment reliability. The voltage safety assessment index
Here,
According to the heavy overload severity index of the transformer and the variation of the operating voltage, the modified exponential function is used to react to the cumulative damage effect, and the probability function of equipment failure considering the multidimensional electrical variables is given in the following (Equation 13).
Where
3.1.1.2 Construction of equipment failure probability function based on multidimensional non electrical variables
In addition to electrical variables, non electrical factors particularly environmental conditions—also play a significant role in equipment safety assessment. Different types of extreme weather events impact power equipment through distinct mechanisms. For example, under prolonged high temperature conditions prevalent in southern China, excessive transformer hot spot temperatures can significantly shorten insulation life and accelerate equipment aging. Therefore, this section focuses on modeling the failure probability function of transformers under temperature stress.
The hot spot temperature of a transformer is a key indicator of insulation deterioration. However, due to measurement difficulties, it is often estimated indirectly using the more accessible top oil temperature. According to the IEC 60076 7 standard and methodologies adopted by (Yang et al., 2019), the transformer hot spot temperature
Where,
According to the Arrhenius thermal aging model (Ma et al., 2025), the expected operating life
Where
Employing the Weibull distribution (Liu et al., 2025), the non electrical failure rate
Where
3.1.2 Probability functions for cable line and busbar failures
To account for both cable line overloading and inherent aging mechanisms, the fault probability function
Where
3.1.2.1 Construction of equipment failure probability function based on multidimensional electrical variables
Cable line failure likelihood increases with current overloads, where the relationship between failure severity and its consequences is typically nonlinear. Specifically, more severe overloads tend to result in exponentially greater risks. To reflect this characteristic, a risk preferred utility based function is used to define the current related failure rate
Where:
In scenarios involving reverse power flow, a negative current indicates reversed direction. In such cases, the current failure rate is calculated as Equation 20:
In addition to current stress, voltage deviations also contribute to failure risk. The voltage related failure rate
In the formula,
Taking the cumulative damage caused by prolonged electrical stress into account, the total electrical dimension failure probability is modeled using a modified exponential function as shown in Equation 22:
Here,
3.1.2.2 Construction of equipment failure probability function based on multidimensional non electrical variables
According to the Arrhenius model, the operational lifetime of a cable line is temperature dependent and can be expressed as formula 23:
Where
Based on the Weibull distribution, the non electrical failure rate
Where:
3.1.3 Circuit breaker failure probability function
Considering both the operational state of electrical dimensions and non electrical dimensions of the circuit breaker, the circuit breaker failure probability function
Where
3.1.3.1 Construction of equipment failure probability function based on multidimensional electrical variables
Firstly, the current induced fault rate
Here,
When the current flows in the reverse direction, the current fault rate
Unlike most other types of equipment, the failure probability of circuit breaker is also affected by the number of mechanical operations. And the operation based failure rate is given in the following equation 29.
where
Combining the current and mechanical operations, the failure probability in the electrical dimension of the circuit breaker is given by the following (Equation 30).
where
3.1.3.2 Construction of equipment failure probability function based on multidimensional non-electrical variables
The performance of SF6 gas insulated circuit breakers is highly sensitive to gas pressure. Abnormally high pressure reduces will reduce the insulation and arc quenching performance, accelerating equipment aging. While excessively low pressure similarly degrades the dielectric strength and lead to the risk of failure will also increase. Based on the Weibull model (Wang Y. et al., 2020), the failure rate of
where
The Arrhenius model is used to construct the effect of temperature on circuit breaker faults, which is calculated as follows (Equation 32).
By combining pressure and temperature effects, the failure rate as well as the probability of failure for the non-electrical dimension of circuit breaker equipment can be obtained as Equations 33, 34,
3.2 Integrated failure probability of equipment considering fault propagation
Taking the topological connectivity of substation equipment and the direction of the tidal current into account, the safety status of device is influenced by the operational states of the equipment in the direction of the source of the tidal current. The fault propagation influence matrix W is constructed, where each element
Taking the probability of failure of the equipment’s own electrical non electrical dimensions as well as the equipment’s direct interactions into account, the combined failure probability
Where
4 Safety assessment of substation systems under high penetration of distributed renewable energy
4.1 Substation safety condition assessment framework
The safety condition of the substation system is affected by a multitude of factors. In this study, critical primary transmission substation equipment, along with their key influencing variables are selected as the core indicators for safety assessment. The specific process of substation system security status assessment is illustrated in Figure 3.
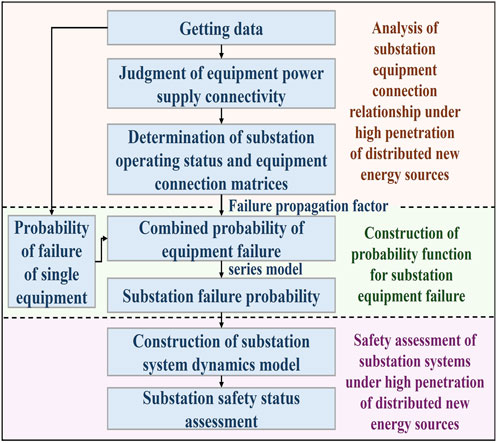
Figure 3. Flowchart of substation system safety status assessment methodology.
The progress begins by analyzing real time substation monitoring data to determine the direction of power flow and the supply status of each device, thereby identifying the substation’s operating state. Based on this, the internal connection topology of the equipment under current operating conditions is analyzed to construct the equipment connectivity matrix. Then, by integrating the connectivity relationships and intrinsic multidimensional variables of individual devices, the failure probability functions of single equipment are established. These are further aggregated using a series system model to derive the overall failure probability of the substation system, which quantitatively reflects substation’s safety status and enables classification into safety levels. Finally, a substation system dynamics model is developed to evaluate the safety status of the substation under varying operational and environmental conditions.
The substation system safety status assessment model proposed in this paper focuses on the operational status of substation equipment, and intuitively reacts to the safety condition of both individual devices and substation system by real-time multidimensional monitoring data and relationship of equipment. This method not only enables the integrated evaluation of device level and multi-device joint safety status but also facilitates real-time reflection of the overall substation safety level. In doing so, it effectively addresses the challenge of information occlusion caused by the complexity of multidimensional data sources within substations.
4.2 Construction of failure probability functions for substation systems based on cascade characteristics
Substation system can be characterized as the multi component series system, where the failure of a single component may propagate and compromise the operational safety of the entire system. Therefore, the failure probability of the substation is modeled using a series system approach. As shown in Figure 4, the system is divided into several interconnected subunits, and the safe operation of the overall system requires all individual subunits to function properly (Xie et al., 2024).
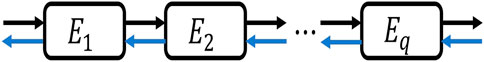
Figure 4. Schematic diagram of the series system model.
Due to the integration of distributed photovoltaic (PV) sources, power flow directions within the substation become uncertain. As illustrated in Figure 4, the forward power flow is represented by black arrows, while the reverse flow is indicated by blue arrows. Based on the connectivity and energization status of substation components, the failure probabilities of individual devices along each possible power path are evaluated. The comprehensive failure probability of the substation under a given operating condition is then calculated using the series system model. According to this model, an increase in the number of series connected components leads to a higher overall system failure probability.
Where
In accordance with expert knowledge and industry standards, the safety status of a substation is classified into four categories: Normal, Attention, Abnormal, and Severe. The classification criteria are defined as follow Table 2.
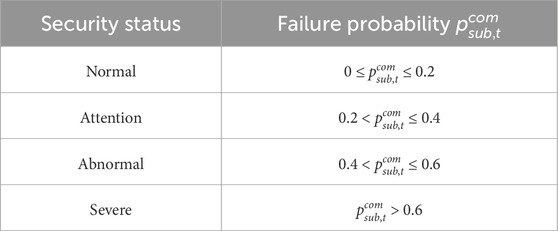
Table 2. Substation safety status classification.
4.3 Construction of substation system dynamics model
Given its suitability for analyzing complex, nonlinear, and large scale systems, System Dynamics (SD) is employed in this study to evaluate the dynamic safety status of substations. Originally proposed by Professor J. W. Forrester, SD is an interdisciplinary methodology that integrates various interacting subsystems into a unified model, enabling the analysis of how internal feedback and interactions influence overall system behavior (Wang, 2009).
The establishment of a system dynamics model begins with the decomposition of the research objective into multiple independent elements, followed by the identification of causal relationships among these components (Li et al., 2015; Wang et al., 2011).
Based on this process, the modeling process begins with the construction of a system dynamics flow diagram for the substation, which outlines the relationships between safety indicators, equipment status, and system level safety. Next, the fault probability relationship derived in previous sections are mathematically formalized as system dynamics equations. These equations are implemented within the Vensim software environment to construct the complete System Dynamic safety assessment model for the substation. Due to the extensive scale of the full system model, only the subsystem the System Dynamics model diagrams corresponding to transformers (Figure 5A), cable lines (Figure 5B), circuit breakers (Figure 5C), and the overall substation system (Figure 5D) are presented for clarity. Due to the extensive scale of the full system model, only the subsystem the System Dynamics model diagrams corresponding to transformers, cable lines, circuit breakers, and the overall substation system are presented for clarity.
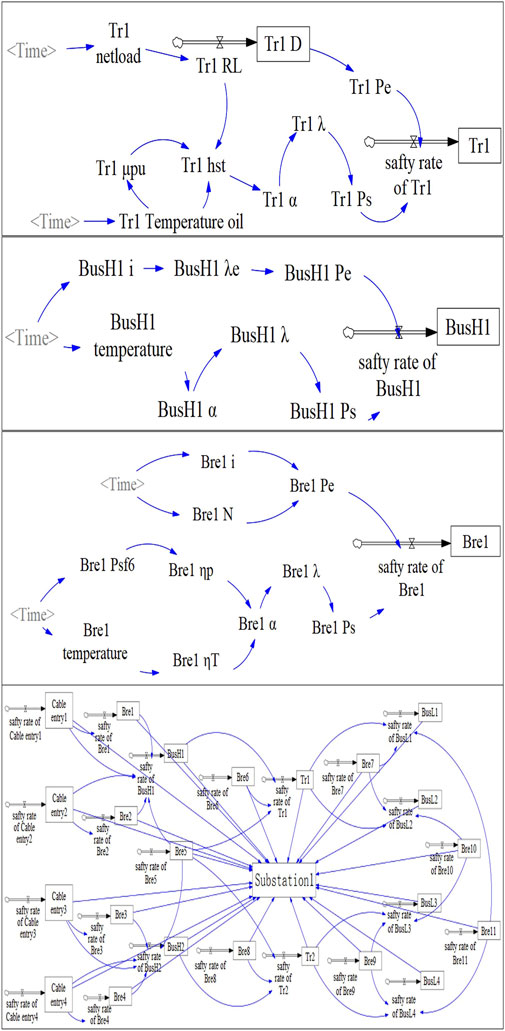
Figure 5. System dynamics modeling of substation equipment and systems.
5 Calculus analysis
5.1 Parameters determination
The proposed methodology is based on the following assumptions regarding the substation system:
5.1.1 Data completeness
Real-time monitoring data (e.g., current, voltage, temperature, dissolved gas analysis) for critical equipment (e.g., main transformers, circuit breakers, disconnectors) are assumed to be fully and accurately available via the data bus without missing or anomalous values.
5.1.2 Communication reliability
The communication channels between the substation monitoring system and the assessment center are assumed to be ideally reliable, ensuring real-time synchronization of multi-source data with no transmission delays or packet loss.
5.1.3 Deterministic topological connectivity
The electrical topology of the substation (e.g., double-bus, breaker-and-a-half) is assumed to be deterministic and known during each assessment interval, with fixed electrical connections between equipment.
5.1.4 Ideal protection system operation
Protective relays and automation devices are assumed to operate ideally according to their designated logic and time settings, ensuring accurate and rapid isolation of faulty components. Cascading risks arising from secondary system failures (e.g., protection refusal or maloperation) are not considered in this study.
5.1.5 Simplified external grid boundary conditions
The substation is treated as a relatively independent assessment entity. The external transmission and distribution grids are assumed to remain stable during the assessment period, with their interaction represented solely by the magnitude and direction of power flow at the transformer terminals.
To validate the proposed method under these assumptions, a case study is conducted on a substation located in a region of China characterized by frequent bidirectional power flow variations due to high penetration of distributed photovoltaic (PV) generation. The substation is configured with two 110 kV buses, four 10 kV buses, two 80 MVA oil immersed transformers, and multiple switchgear units. Among the two transformers, only the load side of transformer T1 is connected to distributed photovoltaic (PV) generation. For simplification, this study assumes identical operational characteristics for busbar and transformers of the same voltage level, and all switchgear devices are treated homogeneously. The parameters of the key equipment are detailed as follows.
The average service life of the transformer is 30 years (approximately 262,800 h). Its maximum allowable load ratio is set to 0.8. The ratio of load loss to no load loss under rated current is 5:1. The temperature rise of the winding temperature for the top oil temperature at rated power is 20 °C. The shape parameter of transformer is taken as 2.0.
According to the IEC 60502 2 standard, the rated load current of the cable line is 800A, with the protection overcurrent setting of 1200A. The material aging constant is
The rated current of the110 kV circuit breaker is 2000A. The current stress coefficient is 4. The number of mechanical lifetimes operations is 20,000. The shape parameter of its failure probability model is set to 2. And the activation energy for the temperature accelerated aging model is assumed to be 0.8ev.
To determine the fault influence weights used in Equations 13, 22, 30, a hybrid approach combining the entropy weight method and the ordinal priority approach (OPA) is employed. This integrated method balances subjective expert judgment with objective data driven analysis. Detailed derivation of the methodology can be found in the referenced literature (Xie et al., 2021) and will not be repeated here. The final fault influence weight factors derived using this approach are summarized in Table 3.
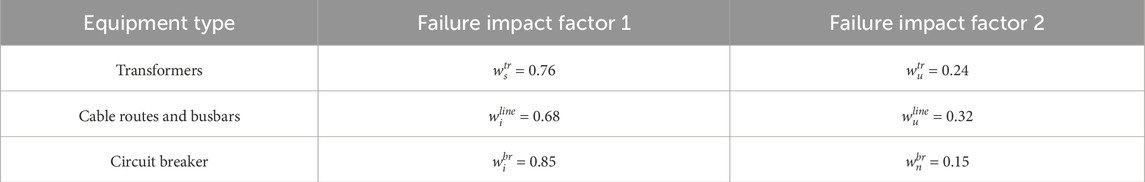
Table 3. Table of values of fault influence factors.
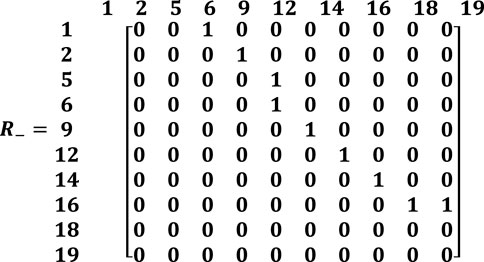
During normal operation of the substation, the node topology of the equipment in the station is shown in Figure 6. Based on the sequential node numbering from smallest to largest, the corresponding adjacency matrix and the fault propagation probability matrix are constructed.
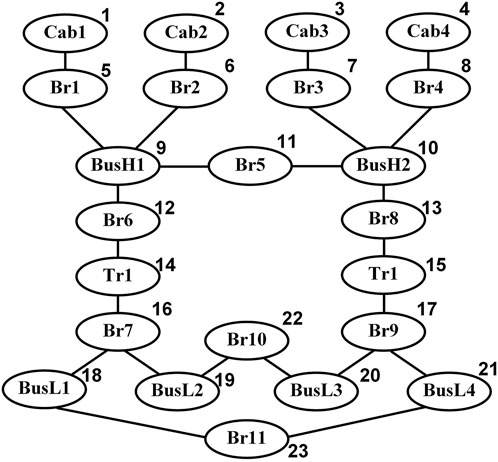
Figure 6. Substation node diagram.
In this study, faults in adjacent equipment are assumed to have a stronger mutual influence, thus, the weight of fault propagation between neighboring equipment are assigned higher values. According to the value of the reachable matrix, the value of the fault propagation probability matrix is derived, as expressed by the following Equation 37.
Based on the aforementioned parameter configuration, the proposed method was implemented and evaluated on a computer with the following specifications. Windows 10 Operating System; Intel Core i7-8565U CPU @ 1.8 GHz; and 8 GB RAM. All algorithms were developed using Python 3.10 with scientific computing libraries such as NumPy and Pandas, alongside Vensim PLE x64 for system dynamics modeling.
A 24-h operational cycle was simulated for the case study, with a time step of 15 min, resulting in a total of 96 evaluation time points. The simulation incorporated intra-day load variations and power flow fluctuations caused by distributed photovoltaic generation to assess the dynamic security state. The total computational time for the complete simulation was approximately 1.8 s, corresponding to an average of about 0.02 s per time point. The specific computational results are presented as follows. These computation times demonstrate that the proposed system dynamics-based assessment method achieves second level overall assessment and millisecond level real-time evaluation on a standard personal computing platform. The computational time is significantly shorter than the data sampling interval, ensuring the system can consistently complete assessments using the latest data. This performance fulfills the requirements for real-time evaluation and provides a solid foundation for the online and quasi-real-time application of the method.
5.2 Analysis of substation safety status under normal power flow conditions
For the forward tidal current case, the substation equipment connectivity is analyzed to obtain the corresponding adjacency matrix
In this study, the real-time monitoring data were obtained from a 110 kV substation accessing distributed PV generation in China. The data corresponds to a cloudy day, during which the different loads composition connected to transformer T1 is illustrated in Figure 7. Specifically, residential electricity consumption accounts for about 35%, administration, education, healthcare loads accounts for approximately 20%, industrial loads accounts for about 30%, commercial usage comprises the remaining 15%. Due to the reduced solar irradiance under cloud cover, the PV output was relatively low and did not result in any reverse power flow through 110 kV substation.
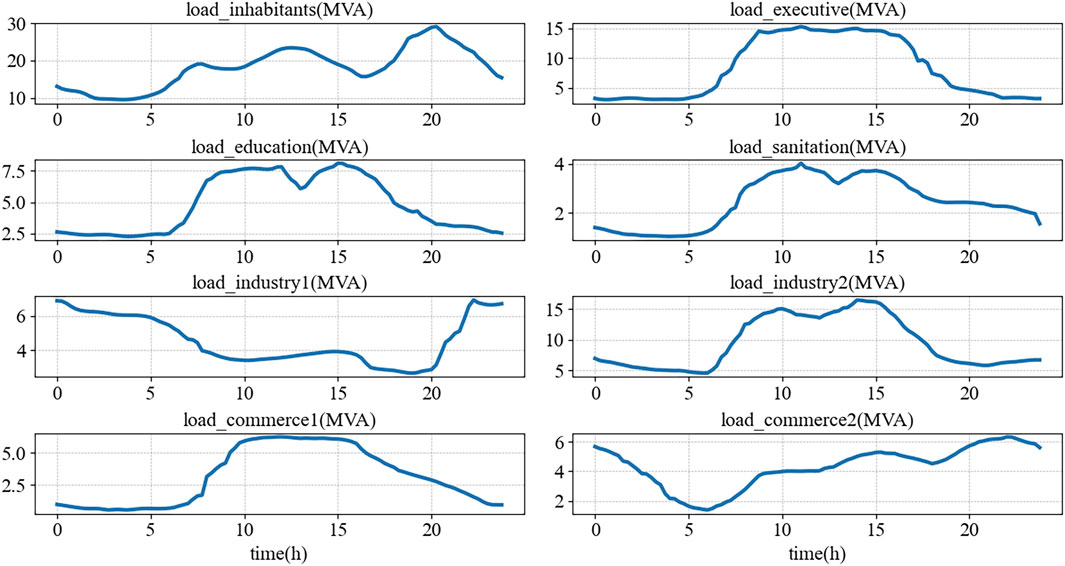
Figure 7. Graph of variation of different loads.
Taking transformer T1 as an example, the net load curve exhibits a typical “duck curve” (Denholm et al., 2015). The monitoring data sampled at 15 min intervals as described above are input into the system dynamics model. Based on the direction of the power flow and the associated fault propagation probabilities, the failure probability of individual equipment and the substation system are computed, as shown in Figure 8.
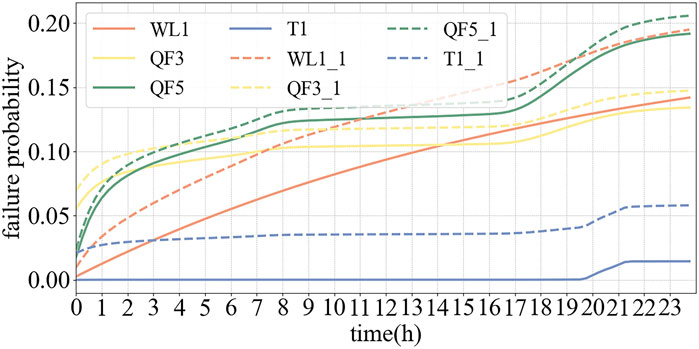
Figure 8. Probability of failure graph for equipment.
In Figures 8, 9, the dotted lines represent the aggregated failure probability of a single device and the substation, considering the correlation between different devices. It is observed that the comprehensive failure probability accounting for the failures propagation among interconnected components is notably higher than the failure probability calculated for single equipment in isolation.
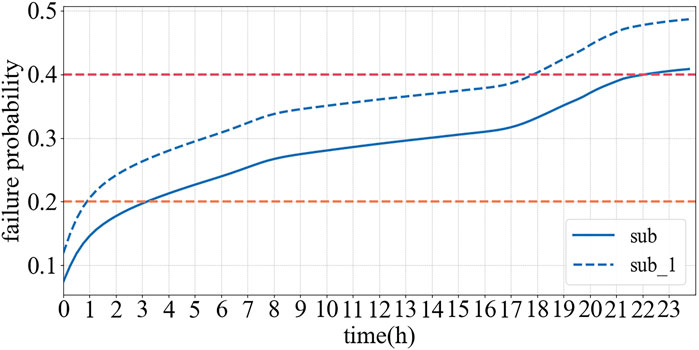
Figure 9. Probability of failure graph for substation.
5.3 Analysis of substation safety status under power flow reversal
On clear sunny days, sufficient photovoltaic output combined with low midday load can result in reverse power flow within the 110 kV substation. Under such conditions, the substation equipment connectivity is reanalyzed to derive the reverse adjacency matrix
Monitoring data from a 110 kV substation accessing to distributed photovoltaic in China, recorded on a day characterized by power flow reversal, are shown in Figure 10.
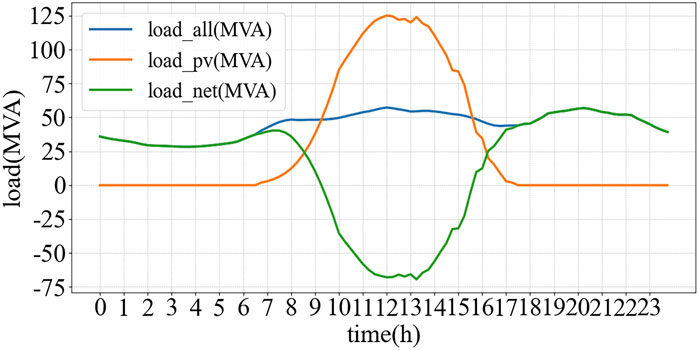
Figure 10. Graph of T1 real-time monitoring data.
The failure probability of transformer1 is presented in Figure 11. In the right figure, T1_P represents the transformer failure probability derived using the methodology of this paper, while T1_P1 corresponds to the methodology where reverse overloading is not considered. The left figure illustrates the failure probability of the electrical dimension as well as non electrical dimension. It is evident that the failure probability of the electrical dimension due to reverse overloading cannot be adequately judged using only a single forward threshold. The methodology proposed in this study enables effectively estimation of the failure probability induced by reverse overloading conditions.
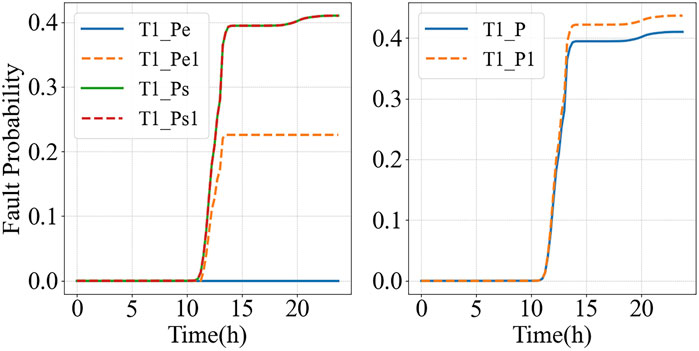
Figure 11. Comparison of T1 failure probability.
The 24 h fault probabilities of the substation and individual current carrying components under reverse power flow conditions are depicted in Figure 12. The dashed line indicates the fault probability considering the fault propagation factor among interconnected devices.
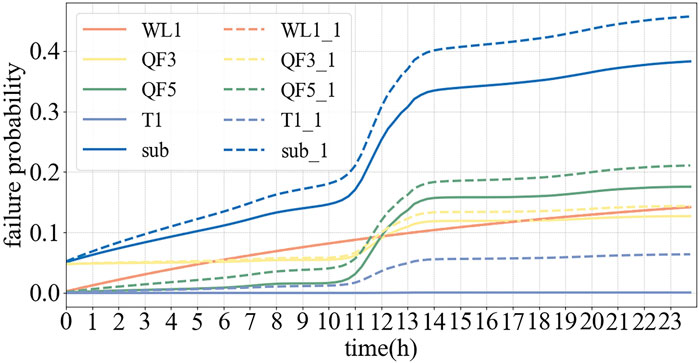
Figure 12. Probability of failure for equipment.
As shown in Figures 12, 13, the failure probability of different devices increases gradually along the direction of the current path. Furthermore, when inter device failure correlations are accounted for, the overall failure probability is significantly higher than the values computed for each device in isolation. This indicates that the proposed model can more effectively capture the compounded impact of fault propagation, thus providing enhanced sensitivity in detecting system vulnerabilities.
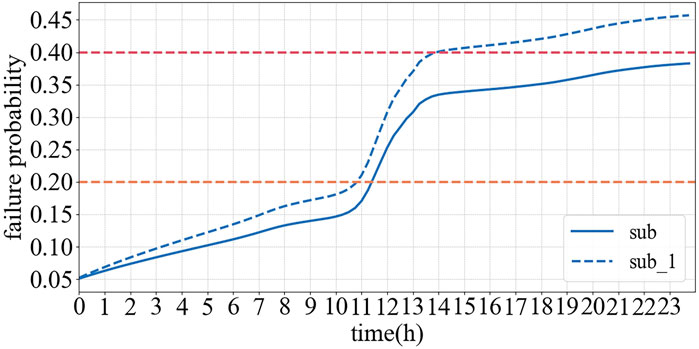
Figure 13. Probability of failure for substation systems.
6 Conclusion and future work
6.1 Summary of findings
In this study, a System Dynamics approach is utilized to evaluate the safety status of the substation system. The grid operational characteristics, the non electrical factors of the equipment and the coupling effects between different equipment are considered. A regional substation is selected as a case study to validate the proposed methodology. The results demonstrate the following:
The impact of distributed renewable energy integration on the current direction within the substation is fully taken into account. Thus, the neighbor matrix is constructed to characterize the interconnection of equipment. The proposed method can effectively support safety status assessment in substation system with high penetration of distributed energy resources.
The method addresses the limitations of traditional approaches that assume mutual independence among equipment condition indicators. It enables real-time safety evaluation by integrating multi factor coupling effects of equipment itself and others. This allows the transition from independent assessments of equipment health status and grid operational status to a comprehensive evaluation framework. Electrical and non-electrical failure propagation between devices can also be captures by this framework.
Leveraging System Dynamics as a carrier, the proposed approach extends equipment assessments to substation system safety evaluations. It significantly enhances the real-time and effectiveness of substation safety status monitoring through multi departmental data sharing.
6.2 Limitations of the study
The validation based on a single case study presents certain limitations, primarily manifested in the following aspects:
6.2.1 Specificity of substation topology
The case substation employs a specific main electrical configuration (e.g., single-bus arrangement). Different configurations (such as double-bus, breaker-and-a-half, or bridge schemes) directly alter the complexity of the equipment interconnection network and risk propagation paths. While the method proves effective for simpler layouts, its direct applicability to highly complex hub substations requires further validation. For ultra-high voltage (UHV) substations with greater equipment count and more intricate electrical connections, the scale and complexity of the resulting adjacency matrices and system dynamics equations may grow significantly, potentially challenging computational efficiency and model stability.
6.2.2 Limited representativeness of operational characteristics and renewable penetration
The load profiles, types of distributed energy resources (e.g., PV, wind), installed capacity, and penetration levels in the case study region are location-specific. The intensity and frequency of bidirectional power flow variations differ substantially between, for instance, a substation serving primarily commercial/industrial loads with moderate PV penetration and one serving agricultural loads with very high wind penetration. The range of power flow fluctuations validated in the case study may not encompass all extreme operating scenarios. The method’s effectiveness under more severe and frequent power flow reversals needs testing in more diversified operational environments.
6.2.3 Limitations regarding equipment types and aging states
The equipment models, service years, and aging status within the case substation are specific. The parameters and models for equipment aging likely rely heavily on the failure history data of the primary equipment (e.g., transformers of specific models) at this particular site. The general applicability of the method depends on the accuracy of its equipment aging sub-models. Applying the method to substations with vastly different equipment portfolios (e.g., predominantly GIS, SF6 circuit breakers) or different average equipment ages might necessitate model adjustments and could potentially reduce assessment accuracy.
6.3 Directions for future research
Based on the present work, several promising directions for future research can be identified:
Model Enhancement and Physics Data Integration. While the current model integrates multi dimensional factors including grid operation, equipment aging, and interdependencies, future work could further incorporate microscopic physical failure models of equipment (e.g., the thermal aging model of transformer insulation paper) with data driven approaches. Introducing machine learning techniques to adaptively calibrate key parameters within the System Dynamics model would facilitate the development of a hybrid “physics data” driven model. This integration would enhance predictive accuracy and adaptability while preserving the model’s interpretability.
Expansion of Assessment Scale and System Resilience Analysis. This study primarily focuses on risk assessment within a single substation. Future research could expand the assessment boundary to encompass coordinated distribution network source load systems. By constructing a regional “critical infrastructure interdependence network,” it would be possible to simulate cascading failure scenarios where substation risks propagate through transmission and distribution lines. This approach would enable evaluating the vulnerabilities and critical nodes of substations from a system wide perspective, providing decision support for enhancing grid resilience.
Development of Digital Twins and Proactive Safety Defense. Leveraging the dynamic simulation capability of the model established in this study, it can serve as the core computational model embedded within a substation digital twin platform. This would enable rolling prediction and early warning of security status. Building upon this, developing proactive defense strategies based on model predictions (e.g., optimizing power flow, switching reactive power compensation devices) would shift the paradigm from “passive assessment” to “active defense.” Furthermore, exploring its potential for participating in ancillary service markets under electricity market environments could unlock opportunities for coordinating security and economic objectives.
Data availability statement
The data analyzed in this study includes critical operational parameters, equipment topology, and fault records from a substation in a specific region of China. This data constitutes sensitive critical infrastructure information, the details of which may involve trade secrets and system security. Therefore, in accordance with the data security policies of the collaborating institutions, this data is not suitable for public distribution. To facilitate academic validation and collaboration, we are committed to providing support while safeguarding sensitive information. For this purpose, researchers with a legitimate need for access to the dataset may submit a request to the corresponding author (email: eXkxMjI2NTE3NTkxQDE2My5jb20=). Upon approval, we will provide relevant data that has been anonymized or aggregated, depending on the specific circumstances.
Author contributions
JX: Project administration, Methodology, Writing – review and editing, Funding acquisition, Resources. YY: Formal Analysis, Supervision, Data curation, Methodology, Writing – original draft, Writing – review and editing, Software, Investigation. HD: Writing – review and editing, Supervision, Conceptualization, Methodology. HJ: Writing – review and editing. CH: Writing – review and editing. LY: Writing – review and editing.
Funding
The author(s) declare that financial support was received for the research and/or publication of this article. This research was supported by grants from the National Natural Science Foundation of China (51507099).
Acknowledgments
This work was financially supported by the National Natural Science Foundation of China (No. 51507099). We appreciate the Energy and Power Science and Innovation Center of Shanghai University of Electric Power for providing the computing resources and technical support.
Conflict of interest
The authors declare that the research was conducted in the absence of any commercial or financial relationships that could be construed as a potential conflict of interest.
Generative AI statement
The author(s) declare that no Generative AI was used in the creation of this manuscript.
Any alternative text (alt text) provided alongside figures in this article has been generated by Frontiers with the support of artificial intelligence and reasonable efforts have been made to ensure accuracy, including review by the authors wherever possible. If you identify any issues, please contact us.
Publisher’s note
All claims expressed in this article are solely those of the authors and do not necessarily represent those of their affiliated organizations, or those of the publisher, the editors and the reviewers. Any product that may be evaluated in this article, or claim that may be made by its manufacturer, is not guaranteed or endorsed by the publisher.
References
Dai, J., Song, H., Sheng, G., Jiang, X., Wang, J., and Chen, Y. (2018). Prediction method for power transformer running state based on LSTM network. High. Volt. Eng. 44 (04), 1099–1106. doi:10.13336/j.1003-6520.hve.20180329008
Denholm, P., O’Connell, M., and Jorgenson, J. (2015). Overgeneration from solar energy in California: a field guide to the duck chart. Environ. Sci. Eng. 2015. doi:10.2172/1226167
Du, J., and Sun, M. (2020). Hierarchical assessment method of transformer condition based on weight-varying grey cloud model. Trans. China Electrotech. Soc. 35 (20), 4306–4316. doi:10.19595/j.cnki.1000-6753.tces.190827
Du, X., Zhao, J., Liu, K., and Zhan, H. (2022). Digital twin early warning method study for overload risk of distribution network with a high proportion of photovoltaic access. Power Syst. Prot. Control 50 (09), 136–144. doi:10.19783/j.cnki.pspc.211422
Duan, D., Wu, X., and Deng, H. (2011). Reliability evaluation in substations considering operating conditions and failure modes. IEEE Trans. Power Deliv. 27 (1), 309–316. doi:10.1109/TPWRD.2011.2173807
Fang, T., Qian, Y., Guo, C., Song, C., Wang, Z., Luo, J., et al. (2020). Research on transformer fault diagnosis based on a beetle antennae search optimized support vector machine. Power Syst. Prot. Control 48 (20), 90–96. doi:10.19783/j.cnki.pspc.191534
Ge, W., Cai, Y., Li, J., and Cao, C. (2020). Three-phase state estimation of distribution network based on multi-branch current hybrid measurement. Power Syst. Prot. Control 48 (09), 1–10. doi:10.19783/j.cnki.pspc.190707
Hu, Y. (2021). Study on fault propagation of chemical material network based on cascading failure theory of complex network [D]. Qingdao: Qingdao University of Science and Technology. doi:10.27264/d.cnki.gqdhc.2021.000694
Huang, J., Wang, S., Huang, B., Wang, J., Cai, W., Liu, M., et al. (2025). “Research on operation state evaluation strategy of oil-immersed power transformer based on membership function of cloud model,” in 2025 IEEE International Conference on Power and Integrated Energy Systems. (ICPIES) (Haikou, China), 52–57. doi:10.1109/ICPIES65420.2025.11070216
Kang, B., and Kim, T. (2006). Option-implied risk preferences: an extension to wider classes of utility functions. J. Financial Mark. 9 (2), 180–198. doi:10.1016/j.finmar.2005.12.004
Li, J., Han, L., and Wang, D. (2015). Optimization of smart grid demonstration project construction management mode based on system dynamics. Proj. Manag. Technol. 13 (12), 93–97.
Lin, C., Zhang, Y., Shao, Z., Liu, Y., and Feng, D. (2021). Comprehensive evaluation of power quality on long-time scale based on fuzzy DEA. High. Volt. Eng. 47 (05), 1751–1761. doi:10.13336/j.1003-6520.hve.20200514
Liu, Z., Jing, Z., Sun, Q., Yu, Y., You, P., and Li, C. (2022). Analysis on generation capacity adequacy mechanism based on system dynamics. Automation Electr. Power Syst. 46 (14), 109–118.
Liu, W., Liu, J., Wan, H., Wang, Y., Zhang, S., Feng, W., et al. (2025). Full-scenario risk assessment of new power system planning scheme for multiple types of extreme weather. Automation Electr. Power Syst. 49 (04), 65–78.
Ma, D., Zhou, Y., and Dong, H. (2025). Operating life evaluation of rubber sealing rings based on modified arrhenius model. J. Nav. Univ. Eng. 37 (03), 14–19.
Mitchurechart, C., and Chaitusaney, S. (2013). “Reliability evaluation of electrical substations under various failure modes,” in 2013 10th International Conference on Electrical Engineering/Electronics, Computer, Telecommunications and Information Technology (IEEE), 1–6. doi:10.1109/ECTICON.2013.6559621
National Standardization Administration (2022). Power transformers part 12: loading guide for dry-type power transformers: gb/T 1094.11-2022 [S]. Beijing: STANDARDS PRESS OF CHINA.
National Standardization Administration (2024). Power transformers part 7: guidelines for loading of oil immersed power transformers: GB1094.7-2024 [S]. Beijing: STANDARDS PRESS OF CHINA.
Peng, S., Yang, S., and Yuan, T. (2023). System dynamics of the evolutionary development of coupled wind-hydrogen-coal system for wind-coal enriched areas. High. Volt. Eng. 49 (08), 3478–3489. doi:10.13336/j.1003-6520.hve.20230451
Wang, F., Gu, J., Zhang, Y., Chu, L., and Shi, W. (2011). Assessment of distribution grid planning based on system dynamics theory. J. Electr. Power Sci. Technol. 26 (2), 77–83.
Wang, H., Hao, L., Huang, M., Zhang, S., Ji, Y., Chen, Q., et al. (2020). Failure probability model of distribution network equipment based on historical fault information. Electr. Power Autom. Equip. 40 (03), 76–84. doi:10.16081/j.epae.202003011
Wang, Y., Ling, H., Cheng, H., Yin, J., Xie, Y., and Cai, H. (2020). Reliability evaluation of electricity meters based on weibull distribution. Electr. Meas. and Instrum. 57 (18), 141–145+152. doi:10.19753/j.issn1001-1390.2020.18.023
Wang, S., Ren, M., Cao, P., Ji, Y., Sheng, G., and Luo, L. (2023). Correlation analysis method of condition monitoring data based on random matrix theory. High. Volt. Appar. 59 (11), 155–161+171. doi:10.13296/j.1001-1609.hva.2023.11.018
Wei, X., Li, H., Wang, C., Zhang, T., and Che, S. (2023). Research on health status assessment and risk prediction of primary equipment in substation. Electr. Eng. 2023 (08), 181–184+189. doi:10.19768/j.cnki.dgjs.2023.08.048
Xie, J., and Xu, J. (2024). Construction method of system dynamics model for superconducting cable system and its application in safety state dynamic evaluation [J/OL]. South. Power Syst. Technol. 1–9. Available online at: http://kns.cnki.net/kcms/detail/44.1643.TK.20240620.1538.002.html (Accessed on May 27, 2025).
Xie, J., Lu, C., Lu, S., Sun, B., Huang, X., and Sun, X. (2021). Electricity market risk evaluation based on order relation-entropy weight method. Electr. Power 54 (06), 71–78.
Xie, J., Shi, Q., Guan, B., Li, R., and Deng, H. (2024). Dynamics safety evaluation method for digitally intelligent cable systems considering coupling effects. J. Electr. Power Sci. Technol. 39 (06), 101–112+173. doi:10.19781/j.issn.1673-9140.2024.06.011
Yan, Y. (2025). Research on pre-control of substation safety hazards based on knowledge graph [D]. Jinlin, China: Northeast Electric Power University.
Yang, Y., Zhu, Y., Qian, T., Tang, Q., Wang, Y., Chen, X., et al. (2019). Time-varying failure model of multi-factor driven distribution transformer and its application. Smart Grid 9 (6), 253–262. doi:10.12677/sg.2019.96028
Yang, H., Zhang, K., and Tang, A. (2021). Risk assessment of main electrical connection in substation with regional grid safety constraints. Ieee Access 10, 27750–27758. doi:10.1109/access.2022.3157750
Yang, L., Zhang, L., Wang, H., and Wang, L. (2025). “Research on dynamic evaluation model of health state of distribution transformer based on multimodal data fusion [C],” in 2025 4th International Conference on Green Energy and Power Systems (ICGEPS) (Hangzhou, China), 111–115. doi:10.1109/ICGEPS65133.2025.11034559
Yu, Y., Wang, C., Li, Y., Liu, J., Guo, Y., and Cao, Y. (2024). Multi-level reverse heavy overload risk assessment for distribution system with high percentage of photovoltaic access. High. Volt. Eng. 50 (10), 4540–4549. doi:10.13336/j.1003-6520.hve.20230527
Keywords: new power system, fault probability, adjacency matrix, distributed power supply, system dynamics mode
Citation: Xie Jd, Yang Y, Deng H, Jiang H, Hong C and Yan L (2025) A safety assessment method for substation system dynamics adapted to high penetration of distributed renewable energy sources with backward flow delivery. Front. Energy Res. 13:1645357. doi: 10.3389/fenrg.2025.1645357
Received: 11 June 2025; Accepted: 09 October 2025;
Published: 04 November 2025.
Edited by:
Illia Diahovchenko, Sumy State University, UkraineReviewed by:
Mohsen Kia, American College Dublin, IrelandRóbert Štefko, Technical University of Košice, Slovakia
Copyright © 2025 Xie, Yang, Deng, Jiang, Hong and Yan. This is an open-access article distributed under the terms of the Creative Commons Attribution License (CC BY). The use, distribution or reproduction in other forums is permitted, provided the original author(s) and the copyright owner(s) are credited and that the original publication in this journal is cited, in accordance with accepted academic practice. No use, distribution or reproduction is permitted which does not comply with these terms.
*Correspondence: Yuqi Yang, eXkxMjI2NTE3NTkxQDE2My5jb20=