 Seraphim Belko
 Renaldo Springer
 Long Le
 Olga A. Marina
- Energy Processes and Materials Division, Pacific Northwest National Laboratory, Richland, WA, United States
Presented is a simple, step-by-step methodology describing how to start, precondition, terminate testing, and disassemble single, small-sized planar electrode-supported solid oxide electrolysis cells (SOECs). Careful control of the gas environment in the initial and final stages of solid oxide cell testing is essential for establishing baseline performance, ensuring controlled, reproducible electrochemical performance, and preserving cell chemical and structural integrity for post-mortem analyses.
1 Introduction
The growing global emphasis on efficient advanced water-splitting technologies underscores the need for consistent and meaningful benchmarks when comparing cell performance metrics such as current density, area-specific resistance, and durability. Often, discrepancies in the SOEC operating protocols in the high-temperature electrolysis (HTE) community make it difficult to guarantee consistency and comparable results. This became critical when testing multiple identical cells in the same laboratory at the same time, while slightly varying operating conditions to compare the performance and degradation trends to those of a baseline cell (Marina et al., 2010). Few procedures for testing SOECs have been reported to effectively synchronize the global advancement of high-temperature electrolysis (Shen et al., 2022; Chou et al., 2022). The focus was primarily on choosing the operating conditions and techniques for accelerated stress testing (AST) to better understand degradation phenomena and device lifetime (Konigshofer et al., 2021; Konigshofer et al., 2022; Subotic et al., 2020). Fortunately, the development of solid oxide fuel cells (SOFC) has been extensively reported, and start-up and cool-down procedures are readily available (Veldhuizen et al., 2023; Halinen et al., 2014; Eichhorn Colombo and Kharton, 2021). By applying similar principles and safe practices of hydrogen handling, SOEC test startup and termination protocols were developed at PNNL to support a high-throughput (>70 cells) SOEC test capability to warrant good reproducibility of the results and preserve cells for post-test analyses.
2 Protocol scope
2.1 Scope and applicability
The described protocol is specific to small, 1.5 cm2, single planar cells consisting of a rare-earth-stabilized zirconia, for example, yttria-stabilized zirconia (YSZ) electrolyte, Ni-based cermet hydrogen electrode (e.g., Ni-YSZ), and oxide-based oxygen electrode (e.g., lanthanum strontium cobalt ferrite perovskite) in a variety of operating conditions. Not included are cell fabrication, other steam delivery methods, electrochemical measurement techniques, and post-test analysis techniques. The step-by-step procedure is used for testing planar SOEC with water bubbler for steam generation. Popular steam delivery systems include water bubblers, syringe pumps, and vaporizers that supply water to a flash unit. All these steam generators are well suited for laboratory applications and are safer than the combustion method (Zhang et al., 2022; Lang et al., 2019; Kim-Lohsoontorn and Bae, 2011). By regulating the flow of hydrogen and the temperature of the water bubbler, the steam content in the feed stream is quickly and precisely controlled. Certain variations may be necessary to accommodate different electrolyte materials, cell designs (electrolyte- and electrode-supported), and steam generation methods (Eichhorn Colombo and Kharton, 2021).
2.2 Summary of methods
The protocol is designed for the simple and reproducible operation of planar button SOECs under diverse testing conditions using a water bubbler for steam generation. The electrodes of the prefabricated SOEC are electrically connected to an external potentiostat/galvanostat, followed by firing and curing the glass seal (Priest et al., 2023). After bringing the cell to an operating temperature and reducing the NiO to metal Ni in the hydrogen electrode, the temperature of the water bubbler is increased stepwise until the desired steam content at the Ni electrode is reached. Once the SOEC testing has been completed, the cell is returned to the open-circuit voltage (OCV), the water bubbler is cooled to room temperature (RT), the fuel gas is switched to a non-flammable mixture of hydrogen and inert gas (e.g., 4% H2/96% N2) and the furnace is cooled to RT. After removing the cell from the test rig, it could be subjected to post-test analyses.
2.3 Health and safety warning
Users should be trained to safely handle and use hydrogen and high-pressure gas systems, high-temperature furnaces, and electrical systems (AIChE–Center for Hydrogen Safety, 2025; H2Tools, 2025). Hydrogen gas is flammable in the presence of oxygen, with a flammability limit between 4.0 and 75.0 vol% in air at 1 atm (Kim-Lohsoontorn and Bae, 2011). Combustion of hydrogen at elevated temperatures results in unexpected and sometimes violent flames (>2000oC) or explosions. Per National Fire Protection Association (NFPA) standards, flammable gas concentrations should be <25% of the lower flammability limit (<1 vol% H2 in air at 1 atm) as a design objective for safe operation. Fume hood flux should be considered when handling hydrogen, if it is sufficient to remove hydrogen in case of unplanned hydrogen release to prevent accidents. For example, if one SOEC is being tested with a H2 flow rate of 100 sccm, the minimum fume hood flow rate should be at least 10 lpm. Metal tubing and metal connections are required for feeding hydrogen gas. They must be leak-checked before the start of the test. Polymer-based tubing should not be used for hydrogen delivery for reasons that it fails more often and is not 100% gas impermeable. Good practice is to have a hydrogen sensor mounted in the lab area/fume hood for the safety of those occupying the area. Research institute, fire marshal, and other regulatory body guidelines must always be followed.
2.4 Equipment and supplies
In this method, the used equipment includes a prefabricated SOEC, a high temperature furnace, a thermocouple, a high temperature sealing material (sealing glass, cement composite, or mica-based compressive seal), an alumina or zirconia cell holder, a temperature controller, a potentiostat/galvanostat, mass flow controllers, hydrogen detection system, solenoid valves, stainless steel Swagelok fittings, and a stainless-steel gas delivery system for hydrogen and nitrogen.
A schematic of the alumina tube test rig and gas delivery system used in this protocol is pictured in Figure 1 (Shen et al., 2022; Chou et al., 2022) (Shen and Lu, 2018; Wu et al., 2017; Pomfert et al., 2008). G18 sealing glass is used to wet and bond the cell to the alumina tube, while both electrodes are connected electrically to the potentiostat/galvanostat. Variations to the cell structure or sealing material may require a modification to this procedure. To disassemble the test rig and cell, wrenches, cutters, and an electric rotary tool with ceramic grinding bits are needed.
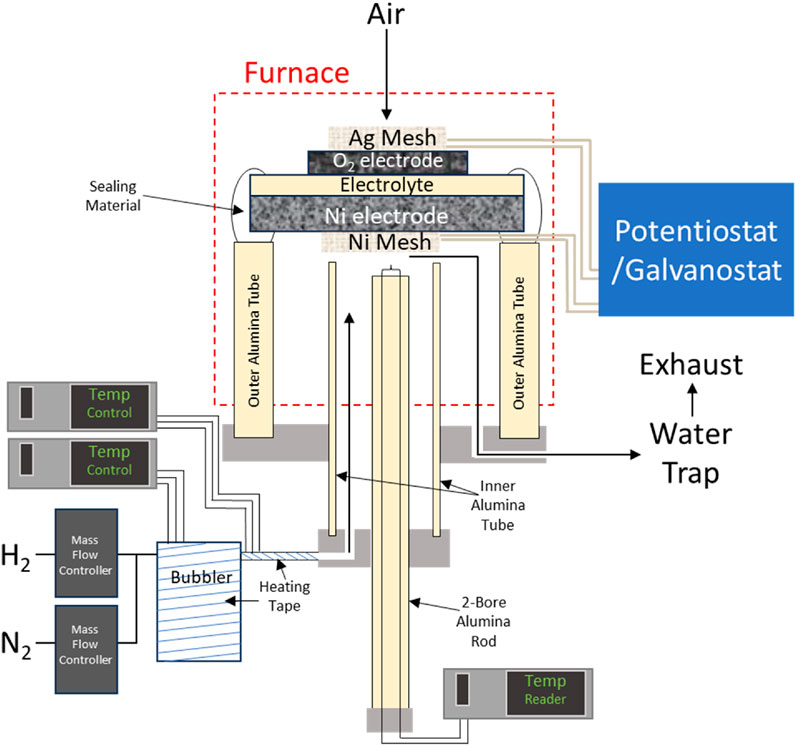
Figure 1. Schematic of button cell sealed test rig in furnace, with electrically connected potentiostat/galvanostat.
Temperature controllers, thermocouples, the potentiostat/galvanostat, and mass flow controllers should be regularly evaluated and calibrated according to the manufacturer’s guidelines for accurate readings. The assembly consists of an inner rod containing a thermocouple, an inner tube that carries hydrogen and steam, and an outer tube to separate the atmosphere from the reducing environment at the SOEC cathode.
3 Step-by-step procedure
3.1 Preconditioning and startup
1. Inspect the cell holding fixture (e.g., ceramic tube as in Figure 1) for any damage, especially along the tube edge that will be in contact with the cell. If necessary, polish the surface of the alumina tube with an electric rotary tool equipped ceramic grinding bits. Replace any broken alumina tubes.
2. Inspect the prefabricated cell for potential manufacturing defects, such as cracks and fractures, delaminated layers, unevenly printed barrier and electrode layers, delaminated current collecting meshes, etc. An example of a prefabricated button SOEC is given in Figure 2.
3. Prepare the sealing material using either glass paste or ceramic cement and apply it to the rim of the alumina tube.
4. Using tweezers, place the cell on alumina tube with the perimeter of the cell contacting the sealing material, oxygen electrode facing up.
5) Apply compression to the oxygen electrode to keep the cell in place while adding glass sealing paste over the edge of the cell to fill in gaps and secure current leads coming from the hydrogen electrode, when located outside the tube. Proper hermetic sealing of the edge of the cell to the alumina tube is critical to prevent mixing hydrogen and air resulting in overheating of the cell, therefore reporting the performance at an unknown significantly higher temperature than intended.
6. If the prefabricated cell comes without a current collector on the oxygen electrode, attach a noble metal current collector (Ag mesh size 0.272 mm, spot welded to Pt wire (0.01″ dia./30 gauge)) to the electrode using an electron-conducting paste such as lanthanum strontium cobaltite, ferrite, or manganite, or Au. Use of Ag is not recommended in long-term experiments due to its migration.
7. Affix the cell to the test rig with spring loaded ceramic air diffuser, if testing in the open to the furnace environment configuration, Figure 3, or another alumina or zirconia tube, when the oxygen electrode testing requires a controlled oxygen partial pressure, pO2, environment or the use of variable sweeping gases.
8. Spot weld the current and voltage leads from the cell to the conductive wires coming from the potentiostat/galvanostat running up the side of the alumina tube. Add any additional sealing material to the edge of the cell to cover gaps or holes created by the current leads. It is important to use wires with an appropriate thickness (≥0.02in); otherwise, current leads may fail when running a test under a high current (>1 A/cm2) or for an extended period (>1,000 h). Use an appropriate power setting when spotwelding otherwise the generated heat can burn wires or not provide a robust enough electrical contact.
9. Position the current collecting leads to both electrodes parallel to each other and in the same direction. Staggered arrangement of the current and voltage leads from the cell to the potentiostat/galvanostat will eliminate emf interference (e.g., current–voltage–current–voltage), eliminating high-frequency inductance contribution in the electrochemical impedance spectra (EIS).
10. Secure the test fixture into the electric furnace before attaching hydrogen, nitrogen, air, and exhaust lines to the test rig. Connect the current and voltage leads from the test fixture to the potentiostat/galvanostat with connectors. Position the thermocouple as close to the cell as possible to monitor any temperature changes during the experiment.
11. Depending on the sealant material, seal hermeticity could be obtained at different temperatures. If ceramic seals are used, follow the manufacturer’s recommendation to cure. If a glass or glass-ceramic seal is used, follow the manufacturer’s recommended heating profile to crystallize the glass before introducing flammable gases. For the G18 glass seals applicable for <850 °C experiments, the thermal treatment is as follows: from room temperature to 850 °C, heat at 1 oC/min, hold at 850 °C for 1 h, then reduce furnace temperature at 3 oC/min to 800 oC and hold for 4 h. If testing at a temperature below 800 oC, reduce the temperature further at a rate of 3 oC/min.
12. Before NiO reduction, start monitoring and recording cells’ OCV. When both electrodes are in the same gas environment, i.e., the pO2, the OCV should be close to 0 V. Start feeding air (or other sweeping gases, e.g., oxygen, as needed) to the oxygen electrode. Start feeding inert gas, nitrogen, argon, or helium at 100sccm to the hydrogen electrode to purge air out for 5–10 min.
13. Add 5sccm of hydrogen to the feed and leave overnight to begin the reduction of the hydrogen electrode.
14. The next day, replace inert gas stepwise with hydrogen until the gas flow to the fuel electrode is 100% hydrogen or ∼97%, if hydrogen is fed through a water bubbler. Increase the concentration of hydrogen (100scmm total flow) to 10%, 25%, 50%, 75% and finally 100%, holding at each step for 1 h. The OCV will continuously increase to >1.1 V at 750 oC and fluctuate by ∼1%. Depending on the surface area of the fuel electrode, the time necessary to reduce the cathode varies. If OCV is low or fluctuates, this could indicate a pinhole or a fracture, or a seal issue allowing mixing hydrogen and air. If the OCV is below the theoretical value by more than 20 mV, Table 1, the cell is likely leaking, and the performance could not be recorded and reported accurately. A leak could be confirmed by changing the hydrogen or air flow rate by increasing or decreasing it by 50%–100%. If the OCV changes >20 mV within second of doubling the flow rate, a leak is detected, and the test would need to be terminated.
15. Stepwise, increase the steam content to the hydrogen electrode by incrementally increasing the temperature (5–10 °C) of the bubbler until steam content reaches 50%, holding for ½ hour at each step or until OCV stabilizes. Steam content should be raised slowly to avoid a sudden increase in pO2 at the hydrogen electrode. Monitor the OCV to confirm the accurate steam amount, Table 1.
16. Record an initial current-voltage (I-V) characteristics at 750 oC and 50%H2O/50%H2 by ramping current (e.g., 0.01 A/s) until the desired voltage (preferably, close to the thermoneutral voltage, ∼1.3 V) and back to the OCV. Note the current recorded at the thermoneutral voltage.
17. Collect initial EIS in the applicable frequency range, for example, from 100 kHz to 0.1 Hz with an amplitude of 20 mV. EIS measurements should be taken at OCV and under a current or voltage bias, e.g., 1 Amp or 1.3 Volt. Some variations to the frequency range and amplitude are possible depending on the cell configuration and equipment used. These initial measurements at 750 oC and 50%H2O/50%H2 will serve as a baseline comparison for all cells tested in the laboratory.
18. If the cell is to be tested under conditions different than 750 oC and 50%H2O/50%H2, then a second set of initial I-V and EIS measurements need to be taken. Change the temperature of the furnace and water bubbler as desired to reach testing conditions, then repeat I-V and EIS (OCV, 1.3 V and 1A) measurements.
19. Begin cell testing, as needed. It could include durability testing in galvanostatic or potentiostatic mode (by applying a fixed current or voltage, respectively, and recording voltage or current response in time), cell performance testing using variable steam concentration on the hydrogen electrode or oxygen content at the oxygen electrode, under thermal/voltage cycling conditions, and other.
20) Collect EIS periodically to monitor the area-specific resistance (ASR) losses in time.
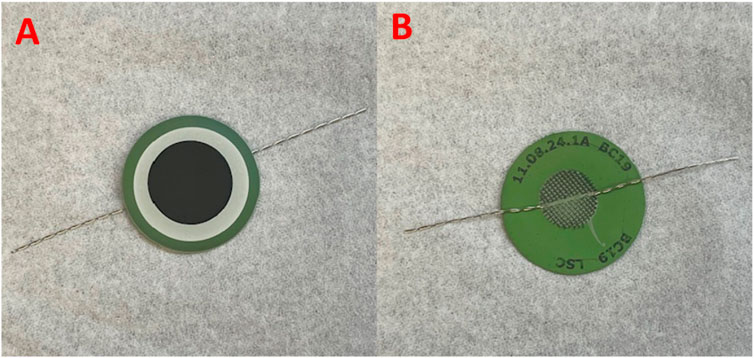
Figure 2. Button SOEC: oxygen electrode (A) and hydrogen electrode (B).
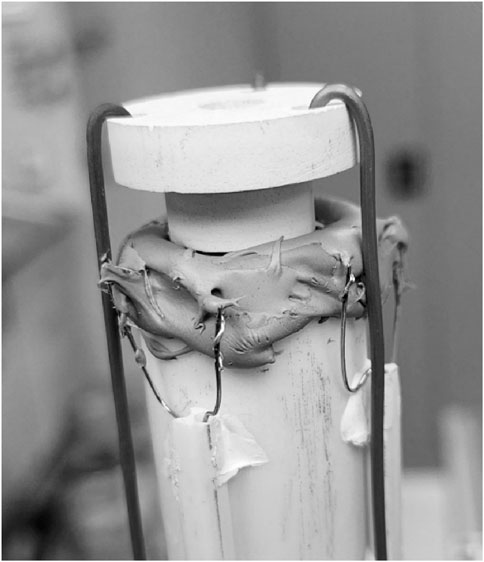
Figure 3. Assembled button cell, electrically connected to current leads and sealed to alumina test fixture. A ceramic air diffuser on the top is held with 3 spring-loaded metal wires.
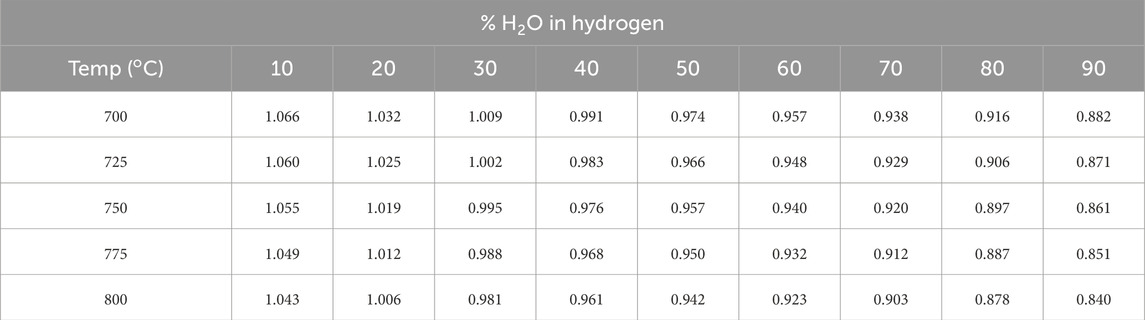
Table 1. Theoretical OCV (in Volts) calculated using the Nernst equation for humidified hydrogen versus air at 1 atm.
3.2 Test termination and disassembly
Once the current test of a SOEC is deemed to be complete or the performance is too low to warrant further testing, the test could be terminated.
1. All electrochemical measurements should be stopped, and the cell should be returned to OCV.
2. Cool the bubbler to RT, the OCV will rise as steam content decreases, Table 1.
3. Switch the gas from wet H2 to dry forming gas or other non-flammable H2 mix in inert gas (e.g., 5%H2 in N2). This will preserve the Ni electrode in its metallic form for postmortem analysis. Stop any sweeping gases to the oxygen electrode.
4. Cool the furnace to RT at 3 oC/min. As the system cools to 300–400 oC, the seals and possibly the cell might fracture or break if there is a mismatch in the thermal expansion coefficient (TEC) of the cell support, sealing material, and ceramic supporting (e.g., alumina) tube of the test rig. If there is a known mismatch in TEC, it is imperative to cool the cell in non-flammable hydrogen-containing gas before cooling the furnace down, as pure hydrogen could violently combust with oxygen in the atmosphere, creating a dangerous explosion.
5. Once the temperature controller reads RT, turn the hydrogen-containing gas off.
6. Disconnect the voltage/current leads, all the gas lines from the test rig. Carefully remove the test fixture from the furnace.
7. Secure the ceramic test fixture to a support stand with a rubber gripped clamp.
8. Remove the spring-loaded ceramic air diffuser.
9. Using cutters, cut all current/voltage leads at the cell and sealant.
10. Carefully grind away the glass sealant from the supporting tube using a rotary tool with sanding bit. Being careful to stay away from the face of the oxygen electrode, the cell should separate from the test rig once enough peripheral sealant is removed.
11. Collect the cell and submit for post-test analyses as needed. If multiple analyses are required, the cell could be broken into several pieces. It could be useful to save a part of the cell in a container, in case future analysis is required.
12. Label containers with the cell fragments stating test and/or cell ID#, fabrication lot, etc., with a few descriptive words about the test/cell.
4 Results
A round robin test was performed using this button cell testing methodology by three national labs, Pacific Northwest National Laboratory (PNNL), Lawrence Berkley National Laboratory (LBNL), and Idaho National Laboratory (INL) using nominally identical electrode-supported cells from the same batch fabricated by PNNL. Each laboratory tested 5 or 6 cells following the startup protocol described above. The recorded average initial OCV is shown in Figure 4. A theoretical value of 0.957 was calculated from the Nernst equation and is shown as dashed line. In general, there was a very small, ≤3 mV, deviation from the calculated OCV in 6 cells tested at PNNL, indicating good seals in all experiments. In 5 cells tested at INL, the OCV was consistently lower, 9–21 mV, than the OCVtheoretical but with a small deviation within the set, 6 mV, indicating good repeatability. There was more scatter in the OCV values measured in cells tested at LBNL. Lower OCV values indicate either lower steam content in the feed gas, higher operating temperature, or potential seal leaking. All labs used thermocouples to monitor cell temperatures that were periodically checked. Sealing and steam delivery methods were, however, different. PNNL and INL used glass seals and LBNL used ceramic cement as a sealing material. Generally, either material should work well and provide hermetic seals. PNNL used the hydrogen combustion method to generate steam inside the test fixtures which usually allows to obtain a very accurate and uniform H2O delivery to the hydrogen electrode. LBNL and INL used water bubblers, also a very reliable method of steam generation that however requires a precise control of the bubbler temperature as well as ensuring that all the gas delivery pipes are well isolated from the ambient environment and heated to at least 110 °C to avoid potential steam condensation in cold spots along the pipes leading to the furnace/cell. The lower steam content in the feed gas would result in higher OCV values, like at LBNL: either the bubbler temperature was slightly lower than intended or the steam was partially condensed in the pipes. If the bubbler temperature is slightly higher, the steam content would also be higher, or if the seals were not hermetic, thus resulting in lower OCV, as at INL. Overall, the OCV of cells tested at LBNL had the highest standard deviation and the widest confidence interval, while cells tested at PNNL had the lowest standard deviation and tightest confidence interval.
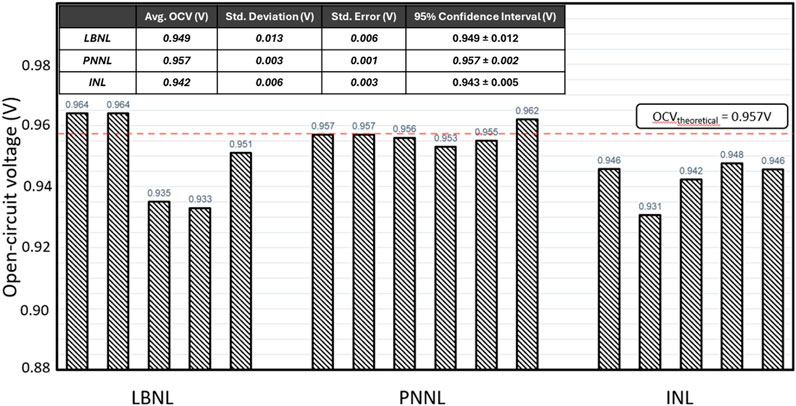
Figure 4. Open-circuit voltages measured from 16 cells at three national laboratories at 750 °C in 50%H2O/50%H2 vs. air.
The measured EIS collected at 750 oC at OCV in 50%H2O/50%H2 at the hydrogen electrode and air at the oxygen electrode are summarized in Figure 5. Differences in measured cell resistances between the labs can be arising from all the factors described above — cell temperature, steam content consistency, and seal leaking. In addition, different oxygen electrode contacts were used in three labs: Ag, lanthanum strontium cobalt oxide (LSC) and platinum contact layers were used at PNNL, INL, and LBNL, respectively. Cells tested at PNNL showed the lowest average ohmic resistance, standard deviation and tightest confidence interval due to the silver contact having a higher electronic conductivity than platinum and LSC. Differences in polarization resistances between the labs can be attributed to the coverage level and porosity of the contact pastes. Cells tested at PNNL and INL had very similar standard deviation and confidence intervals. The use of Pt paste by LBNL dramatically raised the average polarization resistance, the standard deviation and the confidence interval. Total cell resistance was 0.44 ± 0.15 Ω cm2 between all cells independent of which lab performed the experiment, highlighting a relatively high reproducibility when the standard startup protocol is followed.
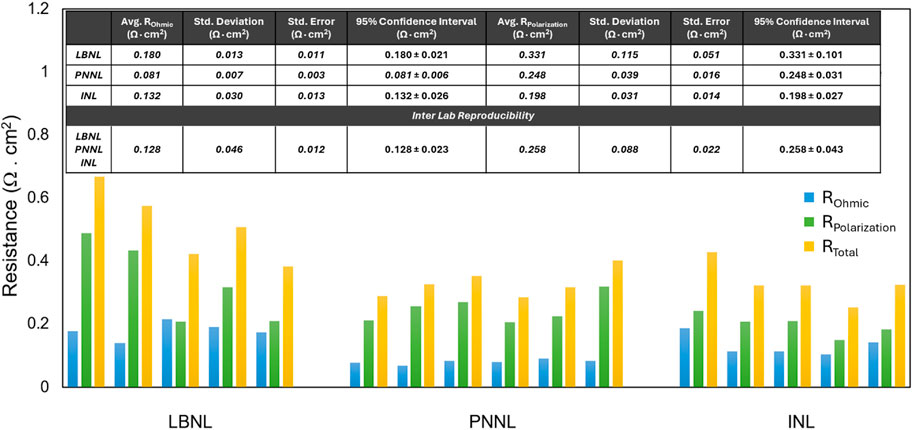
Figure 5. Ohmic, polarization and full cell resistances collected from 16 cells at three labs at 750 °C at OCV in 50%H2O/50%H2 vs. air.
5 Quality control and quality assurance
Regular checks of electrochemical equipment (potentiostats and frequency response analyzers), thermocouples, and gas flow controllers should take place to ensure correct readings and testing conditions. Electrochemical equipment must be calibrated periodically, according to the manufacturer’s suggestions. Mass flow controllers should be sent to the manufacturer annually to be calibrated. Maintaining an intended steam/hydrogen ratio during the test is critical, directly affecting cells’ OCV and polarization behavior. Calculating the correct bubbler temperature can be done by multiplying the atmospheric pressure by the percentage of desired steam content in the fuel gas, then referencing a saturated steam table to find the approapriate temperature for the water bubbler.
The seal between the cell and test rig is equally important to SOEC functionality and performance. Table 1 provides the theoretical OCV corresponding to test temperature and steam content in hydrogen, for reference. By comparing the measured OCV to the theoretical voltage, which can be calculated using the Nernst equation, one could surmise the effectiveness of the sealing. A tolerance of 10 mV is acceptable; otherwise, a compromised seal or faulty temperature controller on the bubbler will result in incorrect overpotentials and/or noisy data. An example of measured OCV over time from a standard button SOEC during preconditioning and startup is pictured in Figure 6, recorded during the reduction and stepwise increase of bubbler temperature.
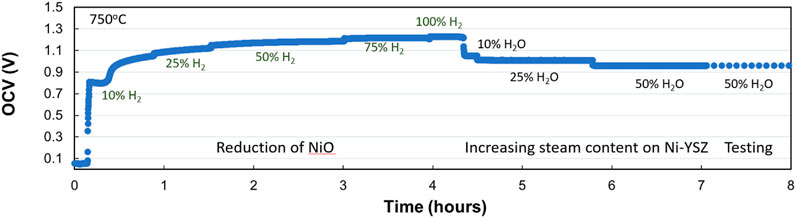
Figure 6. Example of measured Open-circuit voltage (OCV) vs. air during NiO reduction in standard solid oxide cells at 750 oC.
Maintaining a reducing atmosphere during cell cool down is also imperative to obtaining useful microstructural and chemical information from SEM/EDS images taken of the Ni/YSZ electrode. During cell cooling, cell fracturing occurs due to the mismatching TEC between the alumina holder and the electrode-supported SOEC. Cooling the cell in dry inert gas instead of dry non-flammable gas is possible, if the seals will remain intact due to a good TEC match. Cooling in wet inert gas is not recommended as this may lead to partial or full oxidation of Ni at high temperatures.
Data availability statement
The original contributions presented in the study are included in the article/supplementary material, further inquiries can be directed to the corresponding authors.
Author contributions
SB: Writing – original draft, Investigation, Formal analysis. RS: Investigation, Writing – review and editing. LL: Investigation, Formal analysis, Writing – review and editing. CC: Methodology, Investigation, Writing – review and editing. OM: Conceptualization, Resources, Supervision, Funding acquisition, Project administration, Writing – review and editing.
Funding
The author(s) declare that no financial support was received for the research and/or publication of this article.
Acknowledgments
The authors would like to acknowledge financial support from the US Department of Energy Office of Energy Efficiency & Renewable Energy, Hydrogen and Fuel Cell Technology Office under Contract Nos. 33324 and 37440. WBS 2.3.0.708 and WBS 12.1.0.519. The collaborative work between the US national laboratories was conducted within the H2NEW Consortium (Contract No. 37440), and the data discussions provided by the labs are highly appreciated.
Conflict of interest
The authors declare that the research was conducted in the absence of any commercial or financial relationships that could be construed as a potential conflict of interest.
Generative AI statement
The author(s) declare that no Generative AI was used in the creation of this manuscript.
Any alternative text (alt text) provided alongside figures in this article has been generated by Frontiers with the support of artificial intelligence and reasonable efforts have been made to ensure accuracy, including review by the authors wherever possible. If you identify any issues, please contact us.
Publisher’s note
All claims expressed in this article are solely those of the authors and do not necessarily represent those of their affiliated organizations, or those of the publisher, the editors and the reviewers. Any product that may be evaluated in this article, or claim that may be made by its manufacturer, is not guaranteed or endorsed by the publisher.
References
AIChE – Center for Hydrogen Safety (2025). ELA210 hydrogen laboratory safety. Available online at: https://www.aiche.org/ili/academy/courses/ela210/hydrogen-laboratory-safety.
Chou, Y.-S., Hardy, J., and Marina, O. A. (2022). Leak test for solid oxide fuel cells and solid oxide electrolysis cells. Front. Energy Res. 10, 945788. doi:10.3389/fenrg.2022.945788
Eichhorn Colombo, K. W., and Kharton, V. V. (2021). Start-up of a solid oxide fuel cell system with a view to materials science-related aspects, control and thermo-mechanical stresses. Crystals 11 (7), 732–21. doi:10.3390/cryst11070732
H2Tools. (2025). H2Tools. Available online at: https://h2tools.org/.
Halinen, M., Thomann, O., and Kiviaho, J. (2014). Experimental study of SOFC system heat-up without safety gases. Int. Journal Hydrogen Energy 39 (1), 552–561. doi:10.1016/j.ijhydene.2013.10.043
Kim-Lohsoontorn, P., and Bae, J. (2011). Electrochemical performance of solid oxide electrolysis cell electrodes under high-temperature coelectrolysis of steam and carbon dioxide. J. Power Sources 196, 7161–7168. doi:10.1016/j.jpowsour.2010.09.018
Konigshofer, B., Pongratz, G., Nusev, G., Boskoski, P., Hober, M., Juricic, D., et al. (2021). Development of test protocols for solid oxide electrolysis cells operated under accelerated degradation conditions. J. Power Sources 497, 229875–16. doi:10.1016/j.jpowsour.2021.229875
Konigshofer, B., Hober, M., Nusev, G., Boskoski, P., Hochenauer, C., and Subotic, V. (2022). Accelerated degradation for solid oxide electrolyzers: analysis and prediction of performance for varying operating environments. J. Power Sources 523, 1–14. doi:10.1016/j.jpowsour.2022.230982
Lang, M., Bohn, C., Couturier, K., Sun, X., McPhail, S. J., Malkow, T., et al. (2019). Electrochemical quality assurance of solid oxide electrolyser (SOEC) stacks. J. Electrochem. Soc. 166 (15), F1180–F1189. doi:10.1149/2.0041915jes
Marina, O. A., Coyle, C. A., Thomsen, E. C., Edwards, D. J., Coffey, G. W., and Pederson, L. R. (2010). Degradation mechanisms of SOFC anodes in coal gas containing phosphorus. Solid State Ionics 181, 430–440. doi:10.1016/j.ssi.2010.01.018
Pomfert, M. B., Marda, J., Jackson, G. S., Eichhorn, B. W., Dean, A. M., and Walker, R. A. (2008). Hydrocarbon fuels in solid oxide fuel cells: in situ Raman studies of graphite formation and oxidation. J. Phys. Chem. C 112 (13), 5232–5240. doi:10.1021/jp711312p
Priest, C. M., Gomez, J. Y., Kane, N. J., Hartvigsen, J. L., Wang, L., Ding, D., et al. (2023). Challenges in practical button cell testing for hydrogen production from high temperature electrolysis of water. Front. Energy Res. 11, 1278203. doi:10.3389/fenrg.2023.1278203
Shen, F., and Lu, K. (2018). Comparison of different perovskite cathodes in solid oxide fuel cells. Fuel Cells 18 (4), 457–465. doi:10.1002/fuce.201800044
Shen, F., Welander, M. M., and Tucker, M. C. (2022). Metal-supported solid oxide electrolysis cell test standard operating procedure. Front. Energy Res. 10, 817981. doi:10.3389/fenrg.2022.817981
Subotic, V., Menzler, N. H., Lawlor, V., Fang, Q., Pofahl, S., Harter, P., et al. (2020). On the origin of degradation in fuel cells and its fact identification by applying unconventional online-monitoring tools. Appl. Energy 227, 1–10. doi:10.1016/j.apenergy.2020.115603
Veldhuizen, B. V., Biert, L. V., Aravind, P. V., and Visser, K. (2023). Solid oxide fuel cell for marine applications. Int. J. Energy Res., 1–31. doi:10.1155/2023/5163448
Wu, W., Ding, D., and He, T. (2017). Development of high performance intermediate temperature proton-conducting solid oxide electrolysis cells. ECS Trans. 80, 167–173. doi:10.1149/08009.0167ecst
Keywords: solid oxide cell, high temperature electrolyzer, benchmarking, preconditioning, sealing, disassembly
Citation: Belko S, Springer R, Le L, Coyle CA and Marina OA (2025) Standard operating procedure for starting and disassembling single solid oxide cells for testing in electrolysis mode. Front. Energy Res. 13:1651910. doi: 10.3389/fenrg.2025.1651910
Received: 24 June 2025; Accepted: 22 September 2025;
Published: 08 October 2025.
Edited by:
Aniruddha Pramod Kulkarni, Cavendish Renewable Technology, AustraliaReviewed by:
Zhen Wu, Xi’an Jiaotong University, ChinaAbhishek Arya, Cavendish Renewable Technology, Australia
Copyright © 2025 Belko, Springer, Le, Coyle and Marina. This is an open-access article distributed under the terms of the Creative Commons Attribution License (CC BY). The use, distribution or reproduction in other forums is permitted, provided the original author(s) and the copyright owner(s) are credited and that the original publication in this journal is cited, in accordance with accepted academic practice. No use, distribution or reproduction is permitted which does not comply with these terms.
*Correspondence: Seraphim Belko, c2VyYXBoaW0uYmVsa29AcG5ubC5nb3Y=; Olga A. Marina, b2xnYS5tYXJpbmFAcG5ubC5nb3Y=