 Md. Ripon Ali1
 Md. Feroz Ali
 Diganto Biswas
 Md. Jakir Hossen
- 1Department of Electrical and Electronic Engineering, Pabna University of Science and Technology, Pabna, Bangladesh
- 2Department of Electrical and Electrical Engineering, Feni University, Feni, Bangladesh
- 3School of Information and Communication Technology, Griffith University, Brisbane, QLD, Australia
- 4Center for Advanced Analytics (CAA), COE for Artificial Intelligence, Faculty of Engineering & Technology (FET), Multimedia University, Melaka, Malaysia
Reliable electricity access remains a critical challenge for rural Bangladesh. This study develops and optimizes a hybrid microgrid model for Bahirmadi village, integrating solar PV, wind turbines, a biogas generator, battery storage, and grid support using HOMER Pro software. A rural community load profile was constructed through a bottom-up device-usage approach, while renewable resources were derived from satellite datasets. The optimization identified a PV–wind–biogas–battery–grid hybrid configuration as the most cost-effective solution, with a net present cost (NPC) of USD 189,744 and a levelized cost of energy (COE) of USD 0.0212/kWh. The system achieves more than 80% renewable penetration while ensuring reliable supply. Sensitivity analysis demonstrated that PV capital cost and grid sellback price exert the strongest influence on system economics, whereas wind and biogas cost variations showed smaller impacts. These findings highlight the technical and economic feasibility of hybrid renewable microgrids for rural electrification in Bangladesh. Future work should incorporate field-validated meteorological records and measured rural demand data to further improve robustness and support community-specific implementation.
1 Introduction
Within the context of emerging economies, the connection between area development and per capita energy consumption has made the development of the energy sector a priority. Energy is critical to economic development, particularly for emerging nations, and is essential for aggregate productivity (Allouhi, 2024; Ali et al., 2021). Bangladesh has witnessed a dramatic rise in the demand for energy in the past decade with rapid population growth and economic development. However, it is an uphill task for Bangladesh with its populous mainland of 168.25 million people to surmount the energy crisis (Das et al., 2021; Hasan et al., 2024).
Bangladesh is a South Asian nation and is the world’s eighth most populous nation with a population density of 1301 per km2 (Hamadani et al., 2020; Mojumder et al., 2024). Despite tremendous growth in electricity access with 100% access to electricity now for the entire population, low voltage supplies and regular load shedding continue to be a problem and are impacting productivity and economic growth. Poor power, load shedding, and low voltage supply also inhibit productivity, decrease exports, and slow economic growth (Abdullah-Al-Mahbub and Islam, 2023). Therefore, resolving the nation’s energy crisis is crucial to satisfying the country’s long-term energy requirements. Now Bangladesh possesses a generating capacity of 30,277 MW (Mojumder et al., 2024) with the goal of producing 31,000 MW by 2030 and 60,000 MW by 2041 throughout the country against demand goals of 27,400 MW and 51,000 MW respectively under the revised Power System Master Plan (PSMP) of 2016 (Kadir et al., 2023). Renewable energy systems have become an economic solution to mitigate electricity shortages, particularly in isolated rural areas (Yu and Geoffron, 2020). Nevertheless, most aid-financed photovoltaic (PV) systems in off-grid areas are plagued by neglect because of insufficient funding for maintenance (Pandyaswargo et al., 2022; Adenle, 2020). Bangladesh is at a critical point of crisis in the matter of its energy resources due to the rapid urbanization of the country and growing energy demands (Bagdadee and Zhang, 2025). Furthermore, the dense population and low-lying delta nature of the country make it challenging to meet its needs in an environmentally friendly manner that is compatible with the problem of global warming (Islam et al., 2021). The rapid expansion of the renewable energy sources is crucial in order to achieve the net-zero carbon goals, with the role of renewables being anticipated at 60% of the electricity generated by 2030 and 90% by 2050 (Akash et al., 2024), (Bouckaert, 2021). Figure 1 is for Bangladesh’s energy composition in 2025 with an installed capacity of 31,261 MW. Gas remains the dominant component at 39.62%, then coal (22.96%) and HFO (18.83%). The significant fact is that renewable energy contributes only 1,562.84 MW, only 5% of the installed capacity (Electricity Generation Mix, 2021). This low percentage is a sign of Bangladesh’s infancy in harnessing sustainable energy. While its tremendous prospect in solar and wind power, the country is still reliant on fossil fuels. However, the contribution of renewable energy to the national grid reflects greater investment and policy focus (Avwioroko, 2023; Deng and Guo, 2017). Progress in this area must be enhanced in the pursuit of energy security, climate resilience, and carbon emissions mitigation. Strategic growth of renewables would significantly transform Bangladesh’s energy future (Joarder et al., 2024; Hussain et al., 2024).
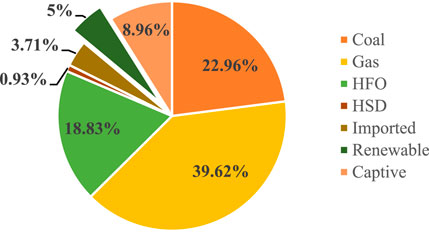
Figure 1. Bangladesh’s installed power generation capacity by energy source (2025).
Bangladesh has experienced a steady increase in electricity demand over the last decade, with electricity generation more than doubling and access to electricity rising from 47% in 2009 to 94% in 2019, primarily driven by the household sector (Sieed et al., 2020; Taheruzzaman and Janik, 2016; Hasan and Mohammad, 2019). Around 16% of the global population lacks access to electricity, significantly impacting productivity and sustainable development (Mohn, 2020). In Bangladesh, where 64.96% live in rural areas, many experience substandard electricity quality, hindering economic growth and exacerbating climate vulnerability (Fyza and Sarkar, 2020). Fossil fuel reservoirs are depleting daily, and the world will run out of fossil fuels in the coming years, highlighting the urgency of addressing the fossil fuel crisis alongside rising costs and scarcity (Hosseini, 2022; Wood, 2020). In a bid to provide security in terms of energy, nations are moving primarily onto RE energy sources to meet their power demands (Zafar et al., 2018). As of December 2021, global RE generation capacity was 3146 GW, according to REN21 (Abdullah-Al-Mahbub and Islam, 2023). Figure 2 indicates Bangladesh’s capacity for renewable in 2025 to be 1,562.76 MW. Solar energy leads the way with 1,268.77 MW, of which 377.15 MW is off-grid and 891.62 MW is on-grid, reflecting extensive use across the nation. Wind power adds 62.9 MW, while hydropower adds 230 MW, all being on-grid. Biogas and biomass electricity are minimal at 0.69 MW and 0.4 MW, respectively (RE Generati on Mix, 2025). Dominance of solar highlights its strategic importance, whereas restricted progress of other sources suggests untapped possibility (Abdullah-Al-Mahbub et al., 2022). Diversification of clean technologies is essential to design a more diversified, sustainable, and resilient energy future of Bangladesh (Safi et al., 2023).
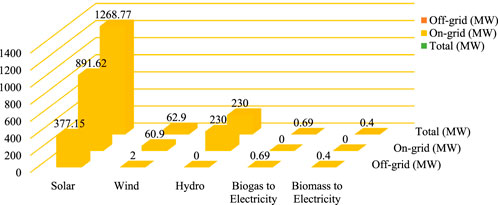
Figure 2. Technology-Wise distribution of renewable energy capacity in Bangladesh, 2025.
76% of the people in Bangladesh reside in rural areas, with access to electricity greatly enhanced under the Rural Electrification Program from only 250 villages in 1971 to 39,684 villages, raising the standards of living and poverty rates (Barkat, 2005). Power outages, particularly those lasting longer than 8 h, are increasing, most notably during the hot summer months of June, July, and August, showing the vulnerability of the electrical system to climate-change-fueled weather events (Pahwa, 2016), (Singh, 2024). As it increases in numbers and increasing energy needs, the conventional energy system that relies heavily on non-renewable resources is increasingly found wanting (Piyal et al., 2023; Ali et al., 2024). The availability of RES like solar and wind relies mainly on seasonal fluctuations in solar irradiance and wind speeds. One solution to the problem is to import HRES, which are developed to blend multiple sources of energy to minimize the effect of these fluctuations (Jaiswal et al., 2022; Ali et al., 2025a). Integrating RE sources with accessible battery capacity is vital to address the problem of stochastic power generation and over-reliance on the national grid. Solar and wind are abundant in quantity and cause no environmental cost (Ayua and Emetere, 2024; Baidya et al., 2025). A hybrid RES-based power system is the optimal option for rural electrification where extension of the utility grid is not possible (Krishan and Suhag, 2019).
Several studies have evaluated hybrid renewable energy systems (HRES) integrating PV, wind, biomass, and battery technologies to ensure reliable and sustainable power generation across diverse geographies. These investigations vary in system configurations, optimization techniques, and economic-environmental objectives, providing a broad comparative basis for assessing feasibility and performance. Alshammari et al. (2018) analyzed various standalone hybrid configurations to electrify remote pastoral regions in Saudi Arabia with a peak load of 18.67 kW. Their study found the PV/biomass system to be the most economically viable, yielding a TNPC of $138,521.40 and a LCOE of $0.099/kWh. In contrast (Alshammari and Asumadu, 2020) extended their analysis to standalone systems using harmony search and particle swarm optimization algorithms. They proposed a wind–biomass–PV–battery model for island electrification, achieving a higher COE of $0.254/kWh, though it emphasized the trade-offs of standalone systems without grid support. Jacques Molu et al. (2023) analyzed an off-grid hybrid renewable energy system for Cameroon’s Manoka Island, with solar, wind, biogas, and hydrogen storage. The system energized 334 residential loads with a 1082.9 kW daily consumption and 183.99 kW peak demand. Optimized cost was $0.1981/kWh, with an IRR of 9.09% and payback period of 8.76 years. Nevertheless, no grid integration analysis was conducted.
In Gaza (Al-Najjar et al., 2022) evaluated a grid-tied PV–biogas–battery hybrid system that achieved a 64.3% renewable energy share with a COE of $0.438/kWh. Despite not incorporating socioeconomic or environmental assessments, the study highlighted the viability of hybridization in constrained grid environments. More advanced multi-source integrations were explored by Sadeghi et al. (2024) in Semnan, Iran, where a hybrid PV–wind–biomass–battery system achieved a COE of $0.201/kWh and an impressive 97% CO2 emission reduction. Shah Irshad et al. (2024) further improved system efficiency through pyrolysis-based biomass utilization, achieving an exceptionally low COE of $0.027/kWh and a 92% renewable fraction. These studies underscore the value of incorporating advanced biomass technologies for cost and emission optimization.
In Egypt (Abdelsattar et al., 2024) modeled a grid-connected hybrid system in Hurghada, attaining 85% renewable penetration and an LCOE of $0.07/kWh, although initial investment remained significant. Similarly, a study on Marmara University’s campus in Istanbul by Aykut and Terzi (2020) investigated four grid-connected PV–wind–biomass scenarios using HOMER software. The optimal configuration, featuring 1500 kW wind and 1000 kW biomass capacity, yielded an NPC of $5.62 million and COE of $0.067/kWh—demonstrating effective campus-scale integration of renewables. Another university-focused study (Sera et al., 2024) examined a PV–wind–genset–grid configuration and reported an LCOE of $0.0172/kWh with a 94.8% renewable energy fraction. This represents one of the most cost-effective and high-penetration systems, emphasizing the potential of hybrid systems in institutional or urban applications. Kasaeian et al. (2019) designed a grid-connected PV/diesel/biogas system, analyzing it under varying economic conditions. The hybrid system reduced emissions and diesel dependency. Limitations included biogas feedstock availability. The study highlighted hybrid systems' role in sustainable energy solutions.
Collectively, these studies illustrate the diversity in HRES design based on geographic, economic, and load-specific constraints. Standalone systems, though beneficial for remote areas, often incur higher costs due to battery reliance, whereas grid-connected models in urban or semi-urban contexts leverage external supply to reduce both COE and renewable intermittency impacts. Furthermore, the incorporation of advanced biomass conversion methods, such as pyrolysis, significantly enhances system efficiency and sustainability, suggesting a clear research direction for future energy planning.
Despite many studies on hybrid renewable energy systems, several gaps remain. Most previous works in Bangladesh have emphasized solar–diesel or PV–wind combinations with limited focus on biomass resources, and very few have integrated biogas into techno-economic optimization for rural electrification. In addition, many studies consider purely off-grid systems and do not account for grid interactions, reliability challenges, and emissions trade-offs. Furthermore, case-specific investigations for rural regions such as Kushtia are scarce, even though resource availability and community demand profiles differ significantly across the country.
To address these gaps, this research develops and analyzes a grid-connected hybrid PV–wind–biogas–battery system tailored to a rural community in Kushtia, Bangladesh. The novelty of this work lies in three aspects: (i) incorporation of locally available biogas resources into the hybrid mix alongside solar and wind, (ii) evaluation of grid-connected operation with reliability considerations and sensitivity analysis of tariffs and grid outages, and (iii) demonstration of significant cost and emissions reductions (LCOE of 0.0212 $/kWh and nearly 79% CO2 reduction) through an optimized configuration. By highlighting these contributions, the study advances knowledge on sustainable rural electrification and provides a replicable framework for other developing regions with similar resource conditions.
2 Materials and methods
In this study, a general techno-economic optimization framework was adopted to design the hybrid renewable energy system. The main objective was to minimize the NPC and LCOE while ensuring reliable electricity supply for the target community. The decision variables were the installed capacities of photovoltaic panels, wind turbines, a biogas generator, and a battery energy storage system. The optimization process was constrained by the requirement of demand–supply balance at each time step, zero unmet load, and maximization of renewable energy penetration within economic feasibility. System performance was evaluated using NPC, LCOE, renewable fraction, annual energy balance, and CO2 emission reduction. After formulating this general framework, the implementation was carried out in HOMER Pro, which performed the hourly simulations and optimization based on the resource, load, and cost inputs.
2.1 HOMER Pro software
HOMER Pro is hybrid renewable energy system simulation and optimization software, version 3.14.2 to be precise. Drawing on a user base established through decades of working with distributed power systems, it is among the most popular pieces of software available on the market for the optimization, design, and analysis of microgrids and renewable energy systems worldwide (Mahmu et al., 2022). The National Renewable Energy Laboratory developed a simulation package in the form of HOMER to assist the respective stakeholders in selecting the most appropriate energy mix for renewable microgrids (HOMER, 2022). HOMER models, analyzes technical feasibility, and optimizes architectures of complex hybrid power systems. HOMER models, analyzes technical feasibility, and designs complex hybrid power systems. It predicts life-cycle cost, performance, and distributed generation for remote sites, which makes microgrid design problems simpler (Solving Problems with HOMER, 2024). HOMER Pro simulates a wide range of renewable and non-renewable energy systems and features advanced applications like battery backup and hydrogen systems (Douiri, 2019). Its calculation module optimizes the system configuration based on technical and economic criteria like NPC and COE. HOMER Pro is a sophisticated simulation tool with consideration like resource availability, load demand, and operational constraints; It simulates system configurations to determine the most economic and optimal solution for the hybrid renewable energy system (Hossain et al., 2019). Figure 3 shows HOMER Pro architecture which allows the customer to select the optimal hybrid renewable energy system considering budget and technological benefits (Sultana et al., 2021; Razmjoo et al., 2019). The system simulates through the input parameters: load, resources, components, and optimization criteria. HOMER Pro is a comprehensive financial and environmental analysis tool that calculates payback periods, capital expenditures, and operating expenses, providing information on a project’s financial viability and evaluating carbon emissions.
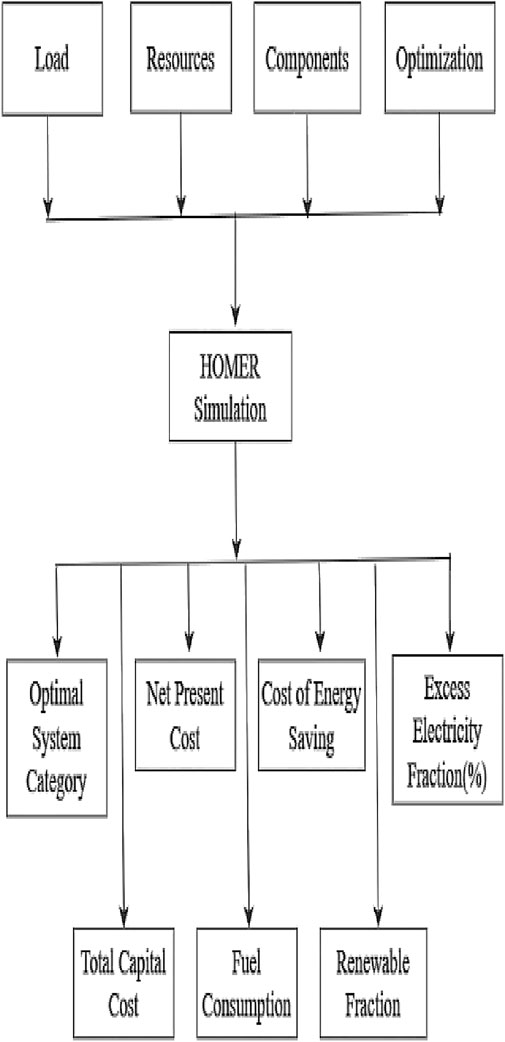
Figure 3. Architecture of HOMER Pro software.
The work flow in HOMER Pro is shown in Figure 4 design data set and system configuration input, first performance testing with base-line simulation (Ali et al., 2024). System performance with variations sensitivity analysis, identification of critical variables, least cost, maximum reliability, and minimum emissions optimization, along with feasibility.
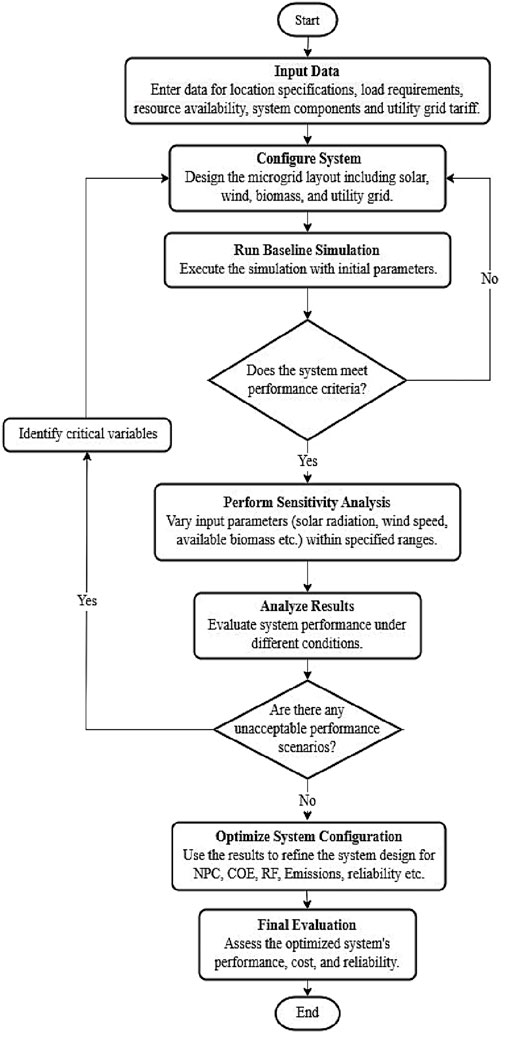
Figure 4. Methodology flowchart of the proposed work.
HOMER Pro minimizes battery storage too, trading energy reliability for expense, and models life-cycle expenses and environmental effects in a manner that microgrids are economical, sustainable, and future-proof for energy requirements (Alyahya et al., 2025; Zou et al., 2024; Imanloozadeh et al., 2024).
HRES integrates all the various renewable energy sources, including WT, solar PV, BioGen, BESS, and grid power, in the pursuit of constant energy supply with increased efficiency (Amer et al., 2013). Figure 5 shows HRES schematic diagram which represents a hybrid renewable energy system for electricity supply at a high school and village. It is integrated with solar PV, wind turbines, a biogas generator, and the grid, while BESS assures reliability. This system increases energy access and reduces outages, adding to the sustainability of energy within the region. It has lower maintenance requirements, hence increasing energy reliability and integration with other renewable sources within urban settings characterized by turbulent winds (Mohammed et al., 2021; Balduzzi et al., 2020).
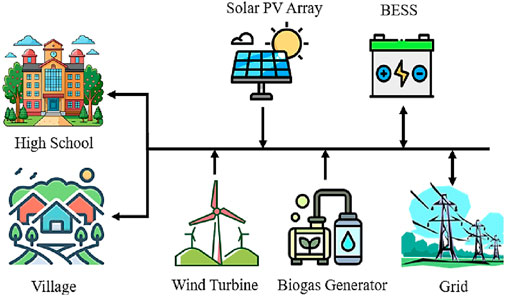
Figure 5. HRES schematic diagram of the proposed microgrid.
This hybrid energy system consists of an AC and DC power source for supplying residential loads and a high school which is shown in Figure 6. The AC sources are BioGen, WT, and the grid, while solar PV and BESS act as DC sources. A converter is used to do AC-DC conversion with maximum possible effectiveness. This installation delivers 1114.5 kWh/day to the houses and 33.52 kWh/day to the school, which provides reliable access to energy while reducing dependency on the conventional grid.
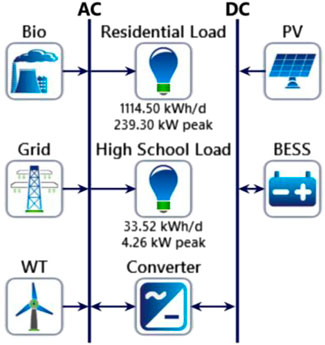
Figure 6. HOMER Pro simulation schematic for the proposed microgrid.
2.2 Site location
Research location is Bahirmadi, a rural village in the Daulatpur Upazila of Bangladesh’s Kushtia district (24.0603° N, 88.8093° E). The region is predominantly residential and educational in nature with intensive agricultural activity and development prospect. But frequent and unannounced grid power outages adversely affect the life of the people and impede the study process at the adjacent high school. These disruptions hamper students' learning performance and capability to utilize computer-based learning materials. In an attempt to address such a challenge, the study looks into alternative, modern, and greener power sources suitable for application in such rural areas. The aim is to enhance the stability of power supply to households and learning institutions as well. Figure 7 is a diagram showing a map of the geographic location of the research area—within Bangladesh, Kushtia district, and specifically Bahirmadi village. By resolving the current energy crisis, this research hopes to improve educational access, aid in attaining sustainability goals, and advance socio-economic development for the residents as well as the Bahirmadi school system.
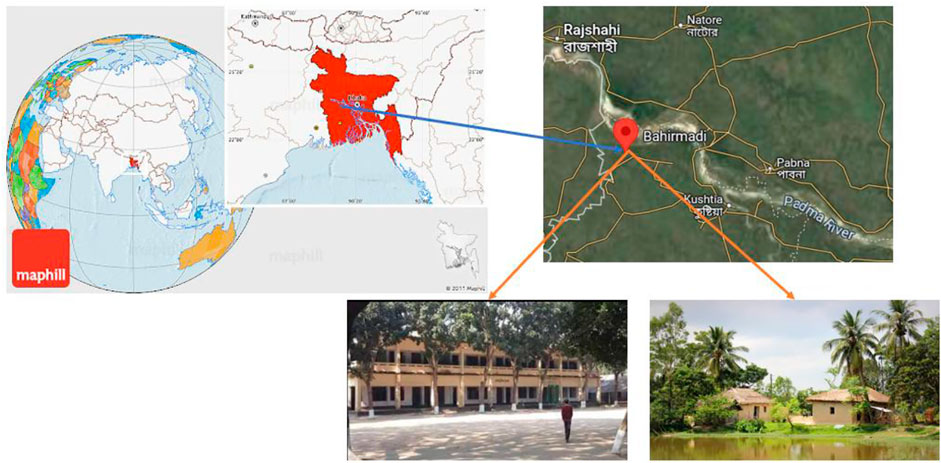
Figure 7. Geographic positioning of the study area.
2.3 Demand profile
Table 1 displays Bahirmadi village’s load profile in Kushtia District, including residential and local high school energy needs. The overall per-day energy demand for every house is estimated at 11.271 kWh. For 100 residences, total residential energy load amounts to approximately 1114.5 kWh/day. The load for the local high school, which is dominated by lighting, ceiling fans, desktop computers, and a water pump, is approximated at 33.52 kWh/day. Ceiling fans and refrigerators account for most of the energy use in homes, whereas the high school demands a lot of power for lighting and computer learning facilities. This detailed load calculation is required for proper energy distribution planning and interconnecting renewable energy systems to offer a constant and sustainable power supply to Bahirmadi area.
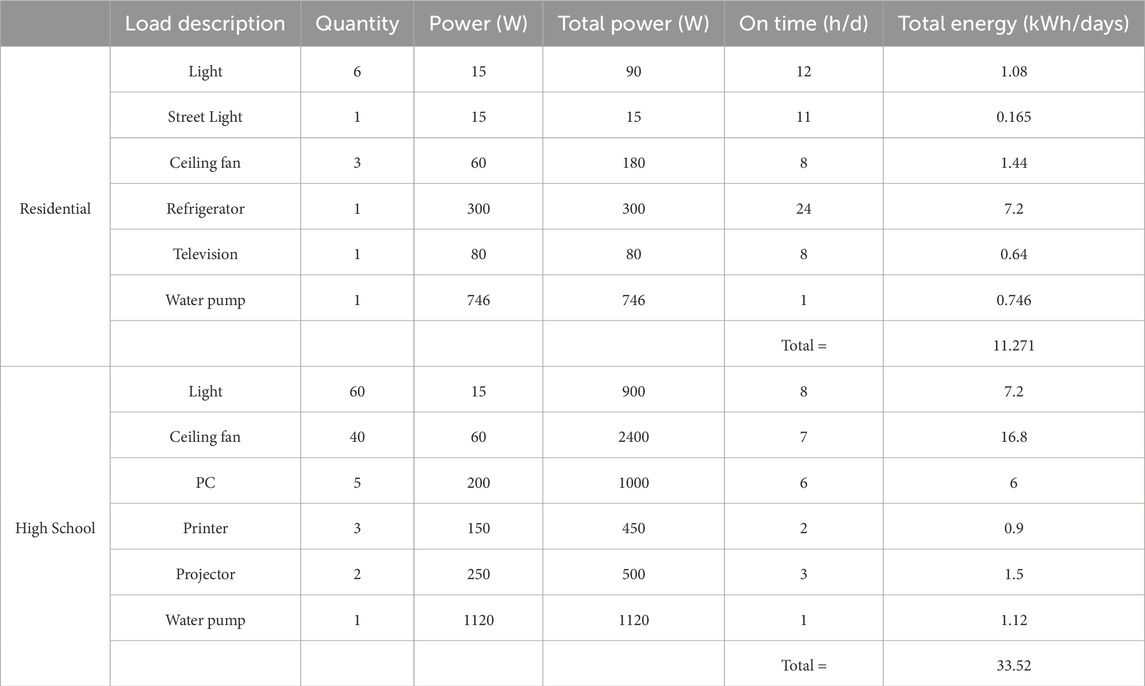
Table 1. Load profile of residential and high school.
The rural demand profile was generated using a bottom-up device-usage model calibrated with published surveys. While this approach approximates rural demand, measured load data would provide higher accuracy and is recommended for future studies.
2.3.1 Residential load
The pattern of residential electricity demand for Bahirmadi village is illustrated in Figure 8 under the variations of daily, seasonal, and yearly. The daily profile shows peak usage between 17:00 and 20:00 h with maximum consumption, driven by lighting, ceiling fan usage, and refrigerator use during the evening. The seasonal profile shows consistent energy consumption throughout the year with slightly higher peaks during the hot summer months (May–August), most likely with higher cooling loads. The daily hourly consumption patterns are plotted annually in a heatmap of 365 days and reveal persistent diurnal patterns with increased intensity at night and zero load during late nights. This thorough analysis of demand covering the cluster of 100 households representing a total daily demand of ∼1114.5 kWh is essential for hybrid renewable energy system optimization and design aimed at minimizing grid unreliability and maximizing energy availability in rural household settings.
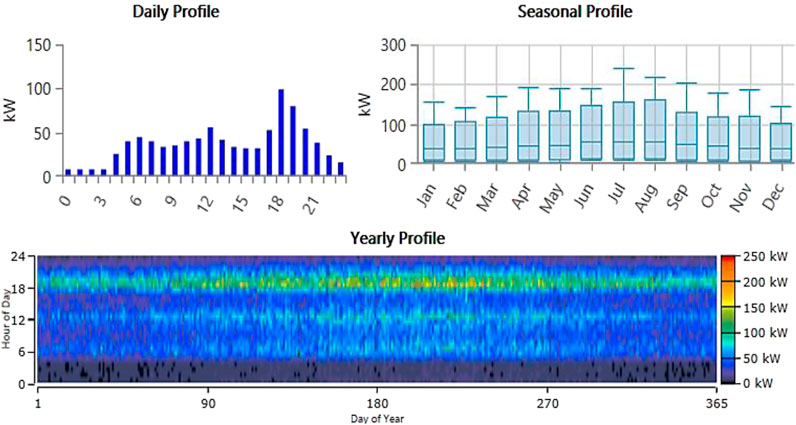
Figure 8. Daily, Seasonal and Yearly load profile for residential load.
2.3.2 Commercial load
Figure 9 shows the daily, seasonal, and yearly load profile of a high school in Bahirmadi village, Kushtia District, having a peak load of 4.26 kW. In the daily profile, energy consumption rises in the morning to a peak from 12:00 to 15:00 and gradually decreases after school hours. The seasonal profile has showed fluctuations across months, with the highest demand observed in August and July. The yearly profile heatmap visualizes the hourly variation over the year, showing quite consistent daytime consumptions. The total daily energy demand of 33.52 kWh suggests that power management strategies, including renewable integration, might help in making energy use in schools more efficient and sustainable.
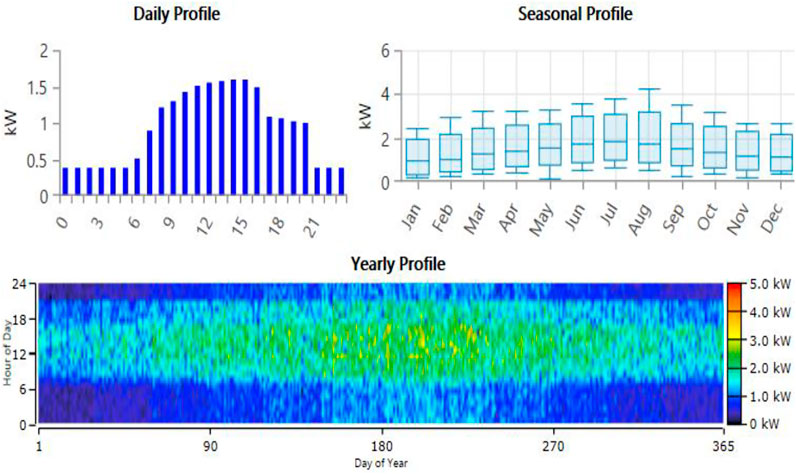
Figure 9. Daily, Seasonal and Yearly load profile for high school. These base profiles were scaled to represent 100 households plus one school, giving ∼1,148 kWh/day (≈419 MWh/yr). This represents a realistic community-scale cluster, not just a single household.
2.4 Renewable resource analysis
In general, the data required for the simulation of HOMER are renewable energy resources, namely, solar radiation, clearness index, temperature, and wind speed at a particular location. Data on solar irradiation of the selected site was downloaded from the internet from the database of NASA Surface Meteorology and Solar Energy (NASA POWER, 2024). Simulation is done with different renewable resources. Data of these resources were collected from different sources. HOMER Pro uses NASA’s long-term averaged climate data, normally over a 22-year period-the default being between 1983 and 2005-which is then averaged out for the site in question regarding temperature, wind speed, and solar radiation (Eckman and Stackhouse, 2012).
2.4.1 Solar Irradiation and Clearness Index
This Figure 10 depicts the monthly fluctuation of clearness index and daily solar radiation at Bahirmadi village, Daulatpur Upazila, Kushtia District. The clearness index ranges between 0.398 in July and 0.659 in February, indicating significant variation of atmospheric clarity under changing seasonal weather patterns. Similarly, daily solar radiation ranges between 6.33 kWh/m2/day in April and 4.03 kWh/m2/day in September. Higher radiation levels from February to May reflect favorable solar energy generation conditions for the period. Combining the clearness index and radiation examination is necessary for enhancing photovoltaic system efficiency and sustainable solar energy planning in rural Bangladesh. In respect to this variability, solar energy systems should consider this, therefore having supplemental sources of energy from either wind or biogas whenever the radiation is low (POWER, 2025).
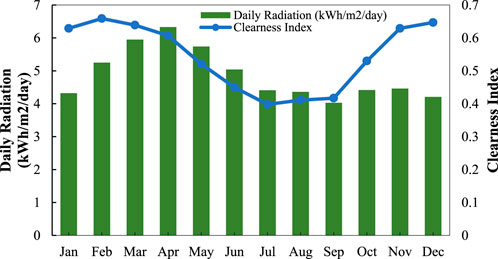
Figure 10. Solar Irradiation and Clearness Index for the site.
2.4.2 Temperature
Figure 11 represents Bahirmadi village, Daulatpur Upazila, Kushtia District monthly average temperature profile. The temperature ranges from a low of 17.66 °C in January to a high of 32.52 °C in May. There is an increasing trend from January to May and a gradual descent towards December. This temperature trend signifies typical climatic conditions in the region with high summer temperatures affecting cooling load and system performance. Understanding this temperature variation is critical for the design of effective renewable energy systems and thermal load calculations. This data helps in climate assessment and energy planning. Higher temperature linearly impacts the efficiency of the PV module as it increases the internal resistance of the photovoltaic panels (Dubey et al., 2013).
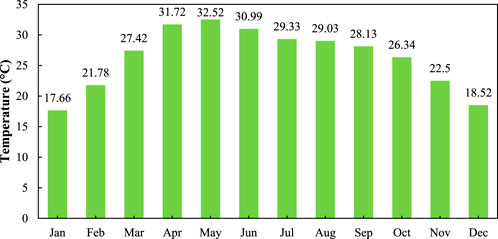
Figure 11. Monthly temperature variation for the site.
2.4.3 Biomass Resource
Figure 12 shows monthly biomass availability at Bahirmadi village, Upazila Daulatpur, Kushtia District, with a uniformly distributed supply of 9 tonnes/day for each month of the year. The biogas generator was assumed to operate on cow dung, poultry manure, and rice straw residues, which are abundantly available in Bahirmadi and widely used in rural Bangladesh for biogas production. This uniform availability is characteristic of a dependable and consistent biomass resource, possibly derived from farm waste and organic rubbish. Such consistency is critical in planning and implementing biomass-derived hybrid energy systems, offering a steady fuel supply for power production and ensuring greater reliability in renewable energy supply.
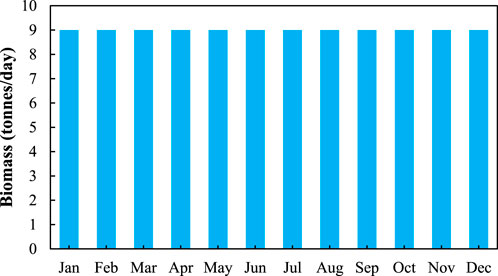
Figure 12. Sustainable Biomass Availability Per Month for the site.
2.4.4 Wind speed
This Figure 13 illustrates monthly average wind speed variation in Bahirmadi village, Daulatpur Upazila, Kushtia District. Wind speeds range from the lowest of 3.41 m/s during October to the highest of 5.53 m/s during June. Higher wind speeds are seen between April and August, aligning with the pre-monsoon and monsoon periods, which are optimal for wind power generation. Seasonal possibility of integrating wind power is evident in the data, particularly during mid-year months. Identification of wind speed patterns is crucial in assessing turbine efficiency and optimal hybrid renewable system design for rural electrification sustainability in the area. In fact, this information is significant for assessing wind energy potential, wind turbine placement, and renewable system design. The output of a WT is also related directly to the wind speed itself; higher wind speeds generate more electricity, and vice versa (Wind power, 2025).
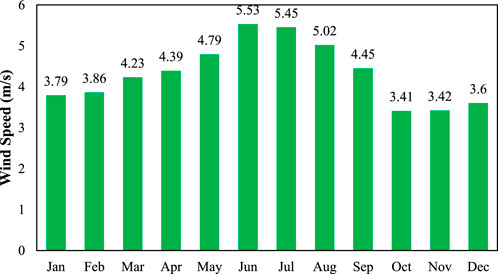
Figure 13. Seasonal Wind Speed Fluctuations for the site.
Since site-specific ground-validated meteorological and detailed rural load data were not publicly available, satellite-based datasets and a bottom-up device-usage load estimation were used. This approach is a standard practice when field measurements are unavailable.
2.5 Modeling the components
One of the most important steps to be carried out before judgment on sizing and performance of a hybrid energy system under given conditions is modeling of its components. The subsequent section describes the mathematical modeling of the recommended components of HRES.
2.5.1 Solar PV system
PV cells work by transforming sun energy into electrical power using semiconductor devices, with silicon-based material being utilized as the primary material in the cells (Redouane et al., 2025). The actual PV power output can be formulated in terms of rated capacity, derating factors, solar radiation, and temperature effects, as formulated in Equation 1 (Kumar et al., 2025; Qasim et al., 2025). In addition, the cell temperature in Equation 1 can be calculated based on ambient conditions, as in Equation 2 (Barakat et al., 2022; Eteiba et al., 2018). Cell temperature significantly affects efficiency; higher temperatures generally reduce power output (Nguyen et al., 2024; Hossein Jahangir et al., 2022).
Where,
2.5.2 WT model
HOMER employs a robust platform for modeling wind power production by integrating environmental, physical, and technical factors in order to achieve accurate power output prediction. The procedure begins with the inputting of wind resource data, typically time series at hourly or sub-hourly resolution. A significant initial step is scaling reference wind speed data to the WT hub height, for which two advanced methods are offered by HOMER: the power law method, widely used for general applications and expressed in Equation 3 (Barakat et al., 2024; Güven and Mahmoud Samy, 2022), and the logarithmic law method, preferred for complex terrains where higher precision is required and planned in Equation 4 (Sera et al., 2024). Actual conditions usually vary because of air density variations, which HOMER adjusts for through a density adjustment calculation, described in Equations 5, 6 (El-Maaroufi et al., 2024; Bilal et al., 2025). Besides, HOMER simulates system losses by a multiplicative sequence of efficiency factors, as described in Equation 7.
2.5.3 Biogas system
Biomass, which includes agricultural waste wood, livestock and human waste, is an abundant and undoubtedly old source of energy. Biogas is a admixture that consists of carbon dioxide (CO2) and methane (CH4) (Kaldellis, 2010). A 50 kW generator set is for backup, if power from solar resources and grid is not provide to fulfil the demands. Livestock manure is used to generate biogas for electricity. The total annual manure from nearby villages can be estimated (Rehan, 2024). An assessment was conducted to determine the potential for producing biomass energy and electricity using the available manure by Equations 8–10 (Shahzad et al., 2017; Efficiency, 2012; Ranjan Pradhan et al., 2019).
where M is the amount of manure produced in 1 year (tons), Ni is the total number of animals, mi is manure produced by a single animal, n is the number of specific group of animals,
Vb is the biogas volume per year (m3) from livestock manure, KDmi is dry contents in manure, KOmi is organic contents in dry material, Bi is specific biogas output (m3/tons),
while P is the biomass energy generation (kW), Ke is the coefficient of plant efficiency usually 0.4, Tc is yearly operation hours of plant. The biomass electricity generation can be estimated by using following Equation 11.
2.5.4 Converter
The installation of the power conversion equipment in HOMER’s model framework becomes extremely important while planning IHRES systems with both AC and DC components (Mokhtara et al., 2021). This conversion stage provides the capability for AC-DC or DC-AC transformation of electricity to ensure optimized power flow regulation for IHRES. Because there is bound to be some loss of energy, the power input and output to the converter are connected through its rate of conversion efficiency, less than 100%, as illustrated in Equation 12 (Güve et al., 2022; Ba-swaimi et al., 2025).
2.5.5 Battery Storage
The battery energy storage system is the most significant component of the hybrid generation system of all the components. The SOC of the battery will differ between any two time instants t and t − 1 based on whether the battery can be done using the Equation 13 below (Azahra et al., 2020). The calculation of the SOC of the battery can be done using the Equation 13 below (Xia et al., 2021):
Where,
In this microgrid, zinc-bromine flow batteries are chosen, having a very long cycle life, scalability, and suitability for medium-scale energy storage applications, hence EnerStore 50 Agile Flow Battery (Chen et al., 2024).
2.5.6 Utility grid integration
During electricity shortages, the grid supplies the required energy. HOMER calculates the cumulative yearly energy charge using the following Equation 14 (Mojumder et al., 2024).
HOMER utilizes the following Equation 15 to determine the total annual grid demand charge (listed after December):
2.6 Economic modelling
Economic modelling in HOMER plays a crucial role in the evaluation of the financial viability and cost-effectiveness of different configurations of energy generation systems. With the assessment of the cost and benefit effects of different system configurations, economic modelling assists stakeholders in making informed investment choices on clean and sustainable energy options (Ezekwem et al., 2024).
2.6.1 NPC
NPC is a financial tool to measure the cost-effectiveness of a project or investment in its lifespan. It accounts for the present value of money by discounting future cash flows to their present amount. NPC is the total cost of a project, such as initial investment, operational costs, and any future revenue or savings, in present value terms. The total NPC can be determined by applying Formula 16 given below (Aziz et al., 2020):
where
where N is the number of years and i is calculated using Equation 18 (Twaha et al., 2012):
where,
2.6.2 LCOE
LCOE is found by dividing the total costs of the project (capital expenditures, operating expenditures, and fuel expenditures) by the total electricity generated during the project’s life. It is the average cost per unit of electricity produced and can be employed to equate various energy sources or technologies. It can be employed to identify the cost competitiveness and economic viability of alternative generation of energy. The formula of LCOE is presented in Equation 19 (Ezekwem and Muthusamy, 2023):
Where,
2.6.3 IRR
The Internal Rate of Return (IRR): Another significant parameter to employ in assessing the financial viability of a system is the IRR. The IRR is the expected return on investment as a percentage. To calculate the IRR, the NPC will need to be reduced to zero at a given discount rate. The IRR can be calculated using Equation 20 (Jawad et al., 2023).
The parameters being considered are in line with the values contained in the NPC formula. The higher the IRR, the higher is the return after subtracting the costs of production (Ashraful Islam et al., 2024).
2.6.4 RF
RF is a measurement of the proportion of energy generated from renewable sources over the total energy generated within the system. It is dimensionless and calculated by Equation 21 (Nallolla and Vijayapriya, 2022):
Where,
For the economic analysis, a project lifetime of 25 years, a nominal discount rate of 15%, and an inflation rate of 9% were assumed, consistent with HOMER Pro’s financial model. These values were applied in the calculation of NPC and LCOE.
2.7 Techno-economic specifications
The techno-economic variables give the rated capacities, capital and replacement costs, and annual O&M costs of the major system components, including the PV system, WT, and power converter which is shown in Table 2. Generic 10 kW horizontal-axis wind turbines (HAWTs) was used in the microgrids that offer an inexpensive, scalable, and low-maintenance solution that is more powerful and efficient than vertical-axis turbines, but delivers reliable decentralized energy production (Zahariea et al., 2018; Winslow, 2017). The system includes PV modules rated at 1 kW, a 10 kW WT, a 1 kW converter, a 1 kW BioGen, and a 50 kWh BESS. Capital and replacement costs are detailed for each component, with PV and WT systems having the highest initial investment per kW. The variables are needed to determine system performance, estimate life cycle cost, and conduct financial analysis for ensuring the viability and sustainability of the hybrid renewable energy system.
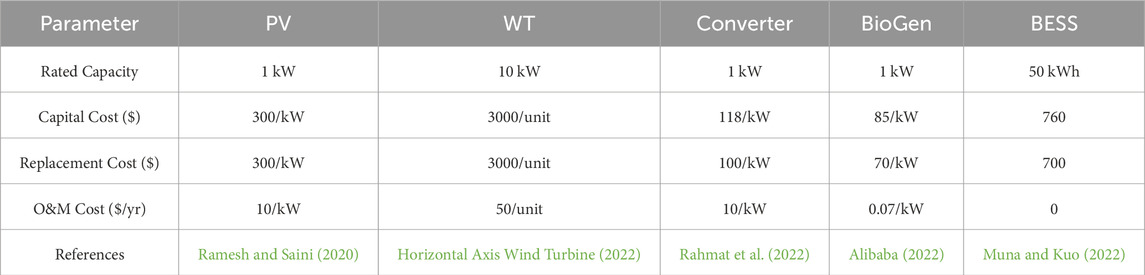
Table 2. Techno-Economical summary of the components.
3 Result and discussion
Among the 2,743 solutions simulated, 2,073 were feasible, while 670 were infeasible due to capacity shortage constraints. Additionally, 629 solutions were excluded for other reasons: 363 lacked a necessary converter, and 186 included an unnecessary converter. Notably, no solutions were omitted due to infeasibility outside of these specific technical constraints. This breakdown highlights the critical importance of proper component selection—particularly converter configuration—and capacity planning in the design of an efficient and effective microgrid system. To support robust decision-making, a 25-year planning horizon was applied using an hourly time-series simulation for various feasible microgrid scenarios. HOMER Pro analyzed nine hybrid energy systems which is shown in Table 3. Optimal configurations combined PV-wind-BioGen with batteries to achieve up to an 86.3% renewable fraction, which minimized CO2 emissions. While PV-wind alone was cost-effective, batteries improved reliability and reduced unmet load. Challenges include intermittency, high initial costs, and the need for strategic planning and policy support.
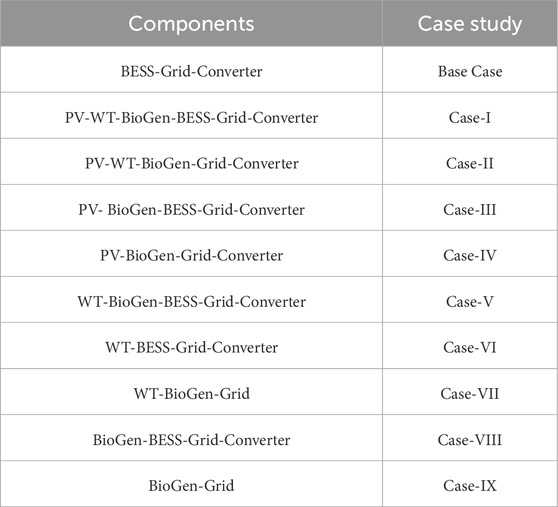
Table 3. Summary of the different case study.
3.1 Techno economic analysis
This study evaluates the feasibility, affordability, and sustainability of energy systems for residential and commercial facilities by integrating grid connectivity, energy storage solutions, and renewable energy sources. The objective is to ensure a reliable power supply, minimize operational costs, and promote environmentally friendly alternatives suited for diverse user demands in both living and business environments.
Figure 14 entitled “Breakdown of Financial Parameters: a) NPC and COE, b) Capital and Operating Costs” presents the economic comparison between all the cases. Plots (a) and (b) show a comparison of the performance of economics for various microgrid alternatives with respect to total cost, energy cost, capital outlay, and yearly operating cost. The base case is the highest with respect to the total cost at $531,778.90 and the energy cost at $0.09461 per kilowatt-hour, with low cost efficiency even though there is very little upfront expenditure. Case I has the minimum total cost of $189,744.20 and energy cost of $0.02116, followed by Case II, $205,719.50 and $0.02194, respectively. The findings reflect the economic benefit of optimally adjusted hybrid systems. Cases III to VIII reflect a steady increase in both parameters, Case IX approaching the base case at $515,582.30 and $0.09142, representing moderate cost improvement. Figure (b) graphs the initial capital cost against annual operating cost. The base case has lowest required capital at $26,076.65 but highest operating expense of $37,716.66 per year, which reflects long-term inefficiency. Case I and Case II also have capital expenditures of $121,419.10 and $122,496.90 but much lower operating expense of $5,095.87 and $6,206.97, respectively. Case III is also acceptable with capital expense of $117,594.00 and cost of $12,285.55 per year, which reflects a good balance. On the contrary, Cases IV, V, and VII exhibit higher annual costs with smaller investment of capital, which may discourage long-term saving. The figures demonstrate that higher initial investment in optimal configurations drastically reduces total and recurring costs, ensuring better economic returns throughout the lifetime of the system. Case I is optimum because it presents a very low NPC with low COE, which further ensures long-term cost efficiency and low operating cost that reduces stress during operations. Initial higher capital becomes insignificant compared to the overall economic benefits throughout its system life cycle.
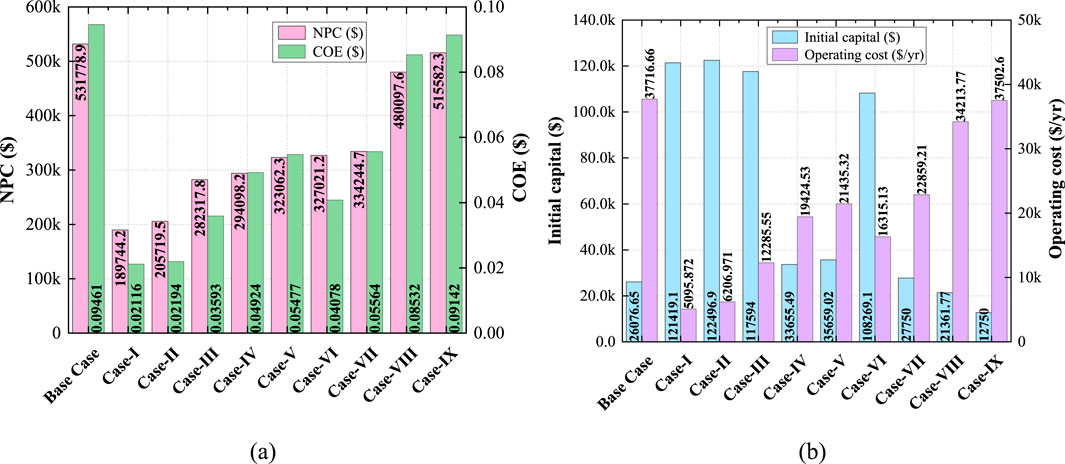
Figure 14. Breakdown of financial parameters: (a) NPC and COE, (b) capital and operating costs.
Figure 15 illustrates annual energy purchased and sold in various microgrid configurations. The base case captures maximum energy purchased (434,319.3 kWh) and minimum energy exported (398.36 kWh), which indicates full grid dependency. Case I and Case II perform best with lesser energy purchases (91,706.55 and 135,102.2 kWh, respectively) and maximum energy exports (249,727.2 and 280,480.1 kWh), signifying high integration of renewables and surplus generation. Cases III to VII perform moderately with varying import-export balances, whereas Cases VIII and IX have minimal export capacities and more dependence upon grid electricity. In conclusion, the figure illustrates how hybrid configurations can reduce grid dependence and enable energy trading, thereby enhancing system autonomy as well as financial performance.
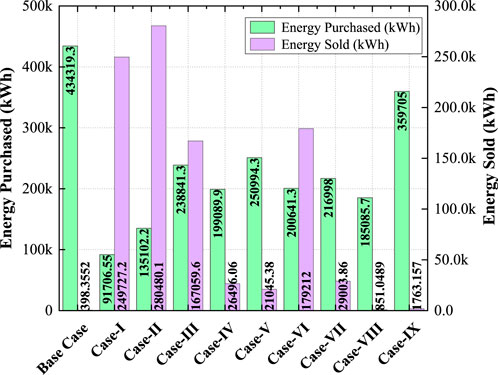
Figure 15. Grid energy Exchange in various microgrid Configurations.
Figure 16 present comparative analysis on a yearly emission basis for different hybrid microgrid configurations for the major pollutants: CO2, CO, SO2, and NOx. In Figure (a), the emission of CO2 is the maximum in the base case with 274,490 kg/yr, reflecting complete dependency on fossil fuel. Case I shows the maximum reduction, bringing CO2 emissions down to 58,001 kg/yr (78.9% reduction), followed by Case II with 85,415 kg/yr. In all cases, CO emissions are minimal, with a slight increase in Case VIII (1.45 kg/yr). Figure (b) shows the same trend for SO2 and NOx emissions, where the base case again has the highest values (1,190 kg/yr and 582 kg/yr, respectively). Case I presents the lowest SO2 and NOx emissions (251 kg/yr and 123 kg/yr), respectively, validating its effectiveness in reducing air pollutants. Emissions increase from Case I to Case IX, parallel to the reduction in renewable integration. All these findings together illustrate the environmental benefit of high-renewable hybrid systems in reducing harmful air pollutants and greenhouse gas emissions and thus enabling the sustainability of energy transition in off-grid or semi-grid applications.
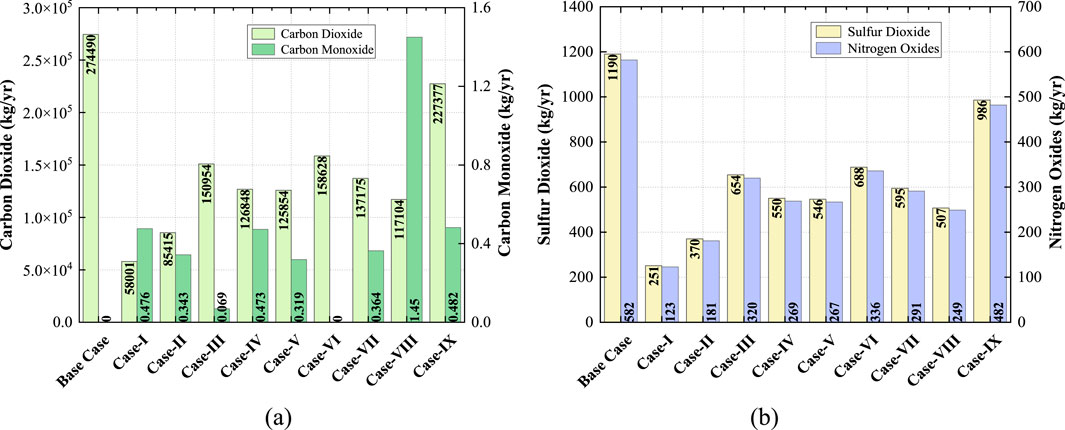
Figure 16. Comparative emission analysis: (a) Carbon-based and (b) Acidic/Nitrogen Oxides emissions.
Figure 17 illustrates the renewable energy fraction for various system configurations, where a drastic improvement is seen from the base case (0%) to optimized hybrid cases. The maximum RF of 86.29% is achieved for Case I, followed by 80.69% for Case II, indicating high integration of renewable resources. Mid-performance is observed in Cases III through VIII, with 42.95%–66.45%, for various mixes of conventional and renewable sources. Case IX presents limited renewable penetration (14.48%), reflecting higher dependence on fossil-based production. Such contrast demonstrates the effectiveness of different arrangements for maximizing the proportion of renewables and reducing consumption of non-renewable resources.
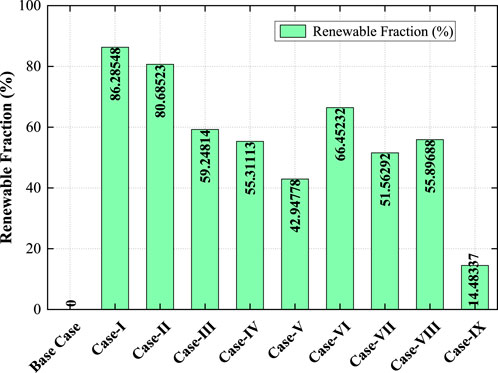
Figure 17. Renewable energy contribution under optimized microgrid scenarios.
3.2 Optimum result
Based on simulation outputs, Case I, with PV, WT, BioGen, BESS, grid, and converter, is the optimal setup. It captures the minimum NPC of $189,744, minimum COE of $0.0212, and maximum RF of 86.3% among all the cases. The initial cost is $121,419, while the operating cost per year is only $5,096, which indicates sound long-term economic viability. The base case with BESS, grid, and converter only has the highest NPC of $531,779, highest COE of $0.0946, and RF of 0% and shows the dependency on non-renewable sources and poorest economic performance. Although other cases, such as Case II and III, give reasonable performance, they have larger NPC and lower RF than Case I. Case IX and VIII with no PV or WT give very small renewable integration and higher energy cost, thus are not so good in sustainable planning.
The accompanying Figure 18 illustrates the cost metrics, component sizes, and renewable fractions of each case. It clearly highlights Case I’s performance with the lowest cost indicators and highest renewable integration, confirming its optimality in the techno-economic analysis. The visual comparison supports that a system combining solar, wind, and biogas with storage and grid backup offers the most effective solution for off-grid or remote microgrid design.
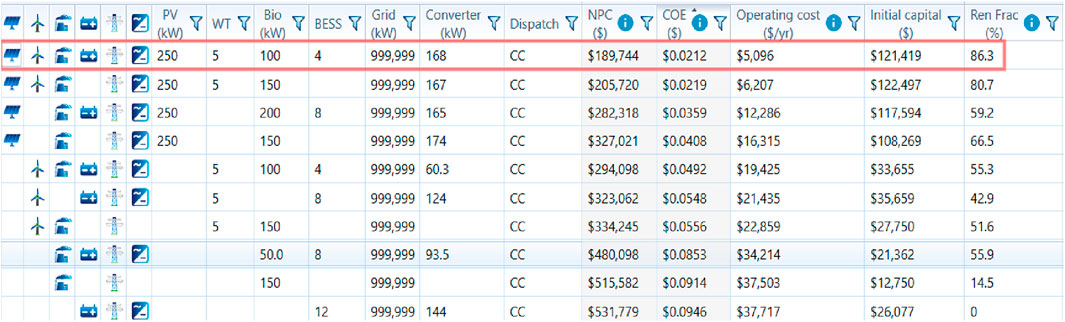
Figure 18. Renewable microgrid architecture optimization in HOMER Pro.
Figure 19 shows the breakdown of costs of each component in the hybrid system by capital, operating, replacement, and salvage. The total capital cost is $121,419, with PV contributing the highest amount at $75,000, followed by the converter ($19,879) and WT ($15,000). The genset has the highest operating cost at $76,680 and grid at negative operating value (–$76,043), which indicates avoided costs. Total operating cost is $60,097. Replacement costs amount to $14,563, mostly in the converter ($7,541) and WT ($5,136). Salvage values reduce total cost by –$6,335, in which WT contributes the most recovery (–$2,947). The battery, even with its small value, has a salvage of –$122.24. This analysis points to PV as the major capital investment and the genset as the largest contributor to regular costs, presenting an unobscured image of long-term economic impacts within the system.
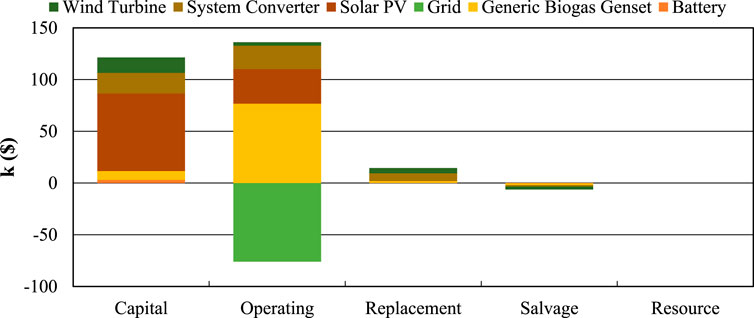
Figure 19. Cost breakdown for system components.
The heatmap Figure 20 graph displays the performance of a 250 kW PV system with a total annual production of 388,441 kWh. Its specific yield is 1,554 kWh/kW, which is indicative of efficiency relative to capacity. The capital cost is $75,000, and the maintenance cost is $2,500 per year. The LCOE is low at $0.0208/kWh, indicating that energy production is economical. A 92.7% PV penetration depicts the highest contribution of the system to the energy mix. The heatmap represents the fluctuation with time and season, highlighting the strong performance and economic viability of the system throughout the year.
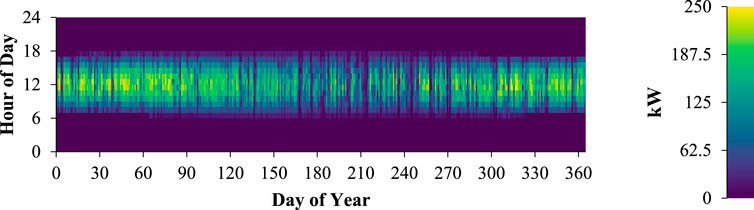
Figure 20. Annual PV electrical output heatmap.
The heatmap Figure 21 presents the performance of a WT system composed of 5 units, each with a rated capacity of 50 kW, and a total of 250 kW. The system produces 199,469 kWh/year at 6,628 h/year operation, illustrating consistent generation. With a capital investment cost of $15,000 and an economic maintenance cost of $250/year, the installation is cost-effective. With a lifespan of 20 years, the WT system offers long-term energy returns. The space-time distribution of energy generation is illustrated by the heatmap, which captures seasonal patterns of wind and consistent performance, upholding the reliability and cost-effectiveness of the WT system during its lifecycle.
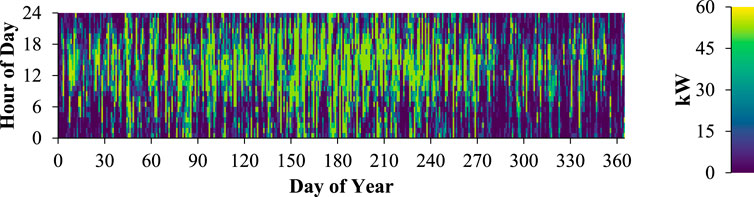
Figure 21. Annual WT electrical output heatmap.
The heatmap Figure 22 indicates the performance of a 100 kW BioGen system powered by biogas. With an annual output of 79,161 kWh and 817 operating hours/year, the system supports concentrated energy supply. It has a capital expenditure of $8,500 and a maintenance expenditure of $5,719/year. It has an operating fuel expenditure of zero and fuel usage of 238 tons/year. The system has a marginal cost of generation of $0/kWh and a fixed cost of $7.35/hour. With a 24.5-year operating lifespan, the heatmap demonstrates seasonally or demand-based generation characteristics, validating the unit’s cost-effectiveness and reliability within renewable hybrid power systems.
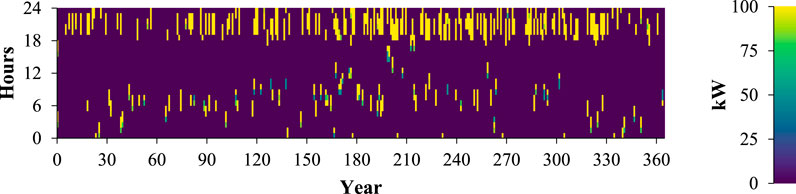
Figure 22. Annual BioGen electrical output heatmap.
The heatmap Figure 23 of the SOC of battery demonstrates its key performance parameters and operating features. The BESS has a rated capacity of 200 kWh with an expected operational life of 30 years, highlighting long-term reliability. It has an annual throughput of 118,180 kWh, which indicates great energy cycling capacity. It experiences losses of 38,966 kWh annually, illustrating efficiency constraints. It possesses capital costs of $3,040, which is the cost of the initial investment. With an autonomy of 3.76 h, the BESS can supply energy independently for a very long time during the time of peak demand or power outages.
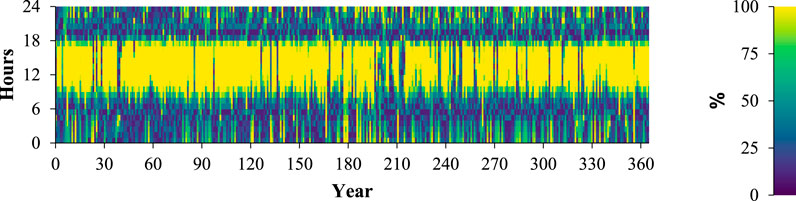
Figure 23. Annual battery SOC (%) heatmap.
The heatmap Figure 24 represents the performance of a 168 kW converter operating 7,054 h/year. It delivers an average output of 44.0 kW, with values ranging from 0 kW to 168 kW, reflecting dynamic load adaptation. The converter processes 405,562 kWh/year of input energy, yielding 385,284 kWh/year as output, with losses totaling 20,278 kWh/year. Its capacity factor stands at 26.1%, indicating moderate utilization relative to its rated capacity. The heatmap captures real-time operational variations, highlighting periods of peak and low activity. This visual analysis showcases the converter’s essential role in balancing energy flow within the system while maintaining efficiency and reliability.
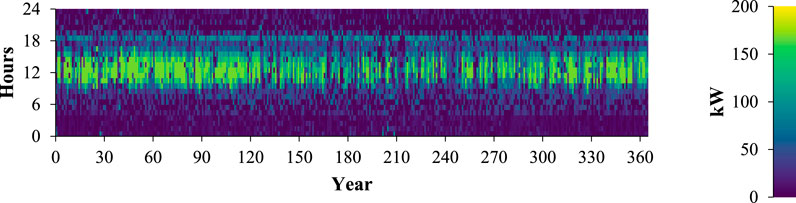
Figure 24. Annual converter electrical output heatmap.
Figure 25 is a comparison of energy purchased and sold to the grid monthly for the period of 1 year. A net of 91,707 kWh was purchased and 249,727 kWh sold, which is a net export of energy. The high energy sold is evident from the months of January to April with a high in March at 27,866 kWh compared to the purchase of 6,756 kWh. Summer months (May to August) witness a regular decline in energy sold, a minimum of which is felt in August (15,938 kWh), while energy purchased increases up to a maximum of 9,308 kWh in August. September to December sees the reverse trend, with sold energy increasing and buying decreasing. The minimum buy is seen in November (5,968 kWh) but has comparatively high sales (19,799 kWh). The consistent energy surplus sold over bought in each month shows strong system performance, most likely as a result of the renewable generation. The analysis confirms the system to be an annual net exporter of electricity.
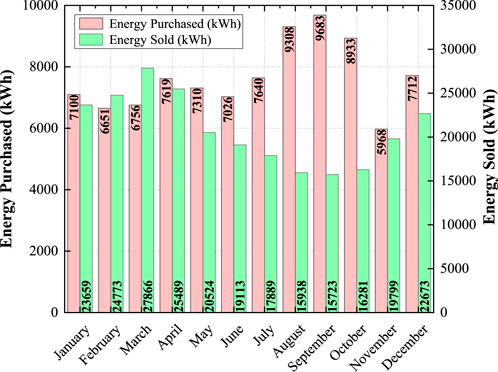
Figure 25. Monthly energy transaction breakdown.
Figure 26 is a graph of the 25-year cumulative cash flow of both the proposed and current systems. The proposed system starts with a much higher cash flow that diminishes over the years, while the current system increases steadily over the years and eventually catches up with the proposed system around year 15. The economic outcome is favorable for the proposed system, with the simple payback of 2.90 years and the NPV of $342,035. The ROI is 30.2%, and the IRR is 34.4%, reflecting high investment efficiency. With a capital expenditure of $95,342 and annualized savings of $32,621, the proposed system shows rapid cost recovery and long-term financial benefits and thus is an extremely feasible alternative relative to the current setup.
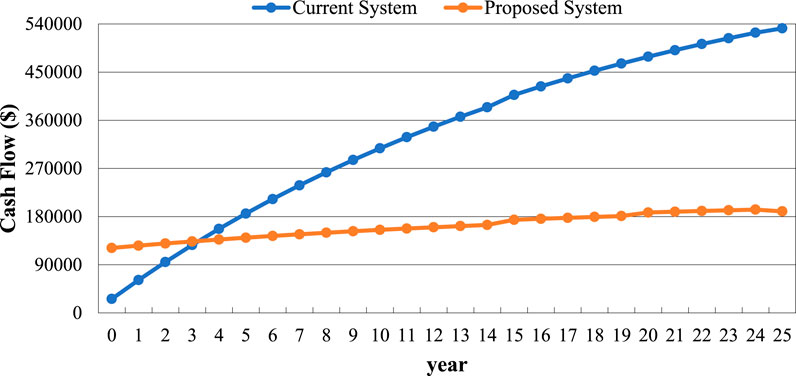
Figure 26. Cumulative cash flow over project lifetime.
Figure 27 shows monthly energy production (MWh) from four sources: WT, PV, Grid, and Bio. PV has the highest contribution overall, peaking at 40.87 MWh in March and bottoming out at 25.13 MWh in July. WT is highest in July (23.64 MWh) and lowest in November (10.48 MWh). Grid supply is relatively stable, ranging from 6.011 MWh (May) to 9.683 MWh (September). Bio varies moderately, with a high in July (10.32 MWh) and a low in December (3.578 MWh). Total monthly production is highest in March (∼69 MWh) and lowest in October (∼58 MWh), with evidence of seasonality in energy production.
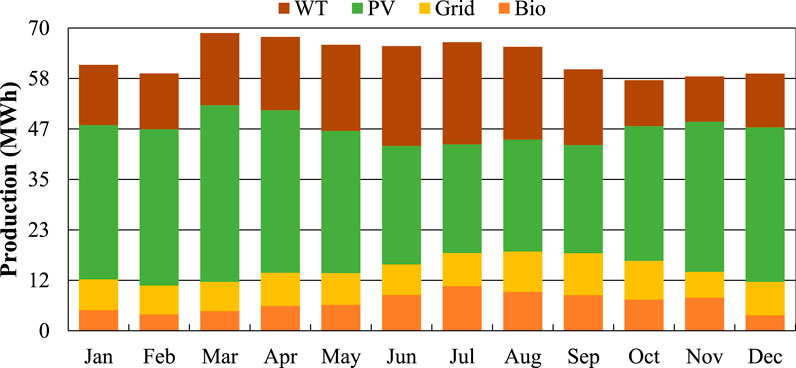
Figure 27. Monthly renewable and grid energy production (MWh).
Figure 28 illustrates the time series of power generation and consumption of the hybrid microgrid system (Case I) over a week in July. The total electrical load served fluctuates from day to day, with peaks exceeding 200 kW, especially on July 3–5. Solar PV generation exhibits clear diurnal patterns, with high output during the day, whereas wind turbine output comes intermittently and complements solar generation during low-solar times. The biogas generator provides firm backup in the early morning and evening when renewables are low. Purchases from the grid are minimal and of short duration only, indicating high self-sufficiency. Battery state of charge fluctuates with renewable availability and load demand, indicating optimal utilization of energy storage during periods of low generation. This dynamic interaction among components highlights the system’s potential for supply-demand balance under complementary resource coordination, justifying the operational effectiveness and energy resilience of the optimized hybrid microgrid.
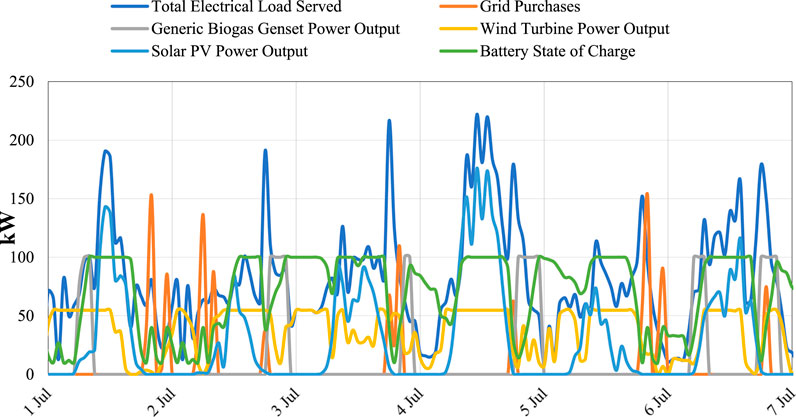
Figure 28. Temporal variation of generation, storage, and load in Case I microgrid.
Hence, Case I presents the optimal configuration for a microgrid, which can show an almost balanced solution on sustainability, cost, and reliability. It shows a very low NPC and COE, with a high RF, while having minimal greenhouse gas emissions and efficient grid interactions. Solar PV, WT, BioGen and BESS integrate to ensure a steady energy supply while well-managing grid transactions and keeping the unmet load low. The economic analysis confirms that the system is highly financially viable, featuring a discounted payback period of just 3.25 years and a simple payback period of 2.90 years. Additionally, the system achieves a strong internal rate of return of 34.4%, indicating a robust return on investment. Overall, Case I stands out as a financially attractive and environmentally sustainable microgrid solution suitable for practical implementation.
3.3 Sensitivity analysis results
Sensitivity analysis is a key method in energy system modeling for analyzing the variation of system performance and decision outcomes with changes in input parameters. It enables researchers and practitioners to identify the most influential drivers of result uncertainty, enhancing the robustness and credibility of model projections. By varying significant inputs systematically over defined ranges, sensitivity analysis portrays dependencies, interactions, and risks under variable or uncertain conditions. Sensitivity analysis assists in better-informed design, planning, and policymaking by indicating the relative importance of environmental, economic, and technical variables in complex energy systems.
Table 4 The table determines significant input-sensitive parameters under three major determinants regulating the performance and viability of hybrid energy systems. The Environmental and Resource Factors include solar radiation (2.93–6.83 kWh/m2/day), temperature (15.80 °C–36.86 °C), wind speed (2.60–6.06 m/s), and available biomass (5.4–12.6 tonnes/day), all of which have key roles in renewable energy production. Economic Parameters such as inflation rate (5.4%–12.6%), nominal discount rate (9%–21%), cost of power ($0.048–$0.112/kWh), and sellback price ($0.024–$0.056/kWh) affect financial viability. Infrastructure and Reliability parameters are hub height (9.6–22.4 m), grid failure frequency (300–700 events/year), mean repair time (0.6–1.4 h), and repair time variability (30–70 min) influencing system operational stability. The ranges provided are amenable to system sensitivity analyses for optimization of the system.
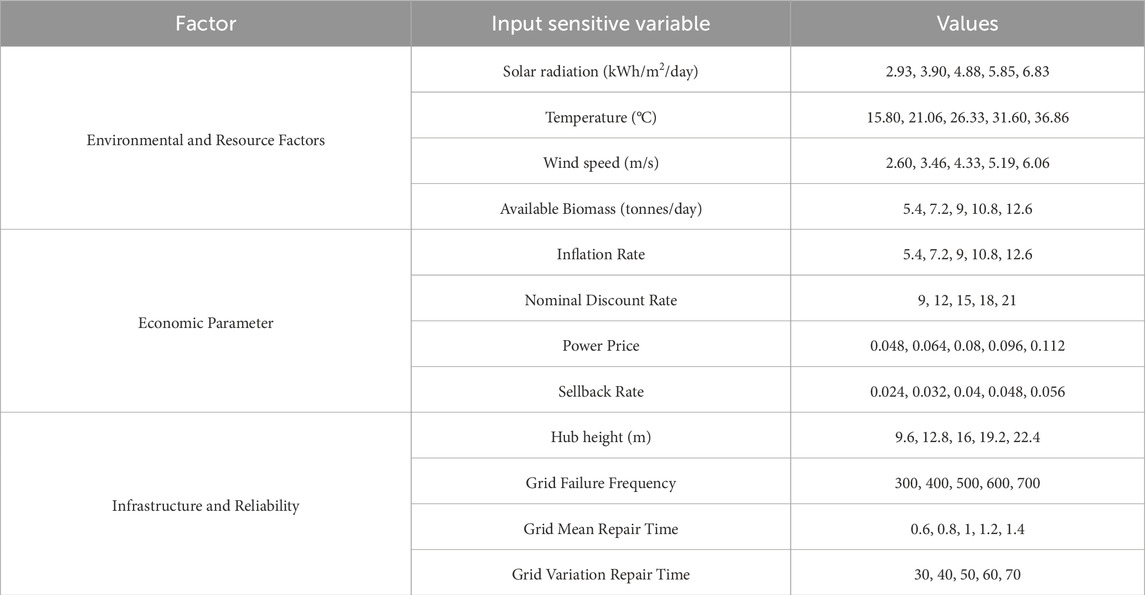
Table 4. List of input sensitive variables with values.
3.3.1 Environmental and Resource Factors sensitivity
Figure 29 illustrates the impact of variation of environmental and resource parameters on system performance parameters: COE, NPC, operating cost, and renewable fraction. COE reduces significantly with solar irradiation and wind speed increases from 60% to 140% of their base values to 0.0359–0.0153 $/kWh and 0.0359–0.0134 $/kWh, respectively, while temperature and biomass availability have a minimal impact. For NPC, solar and wind upgrades reduce the cost to 150,376 $ and 132,290 $ from 256,617 $ and 282,318 $, respectively. Operating costs also display the same trend, reducing from more than 12,000 $/yr for low wind to merely 822 $/yr for high wind, and that for biomass is not identifiable. Renewable portion gets better for augmented solar and wind feed, to 87.38% and 86.74%, respectively, with temperature and biomass being fixed. These results emphasize that solar irradiance and wind speed are the most important variables in terms of system performance and economic viability and thus continue to be of core importance to design and optimization.
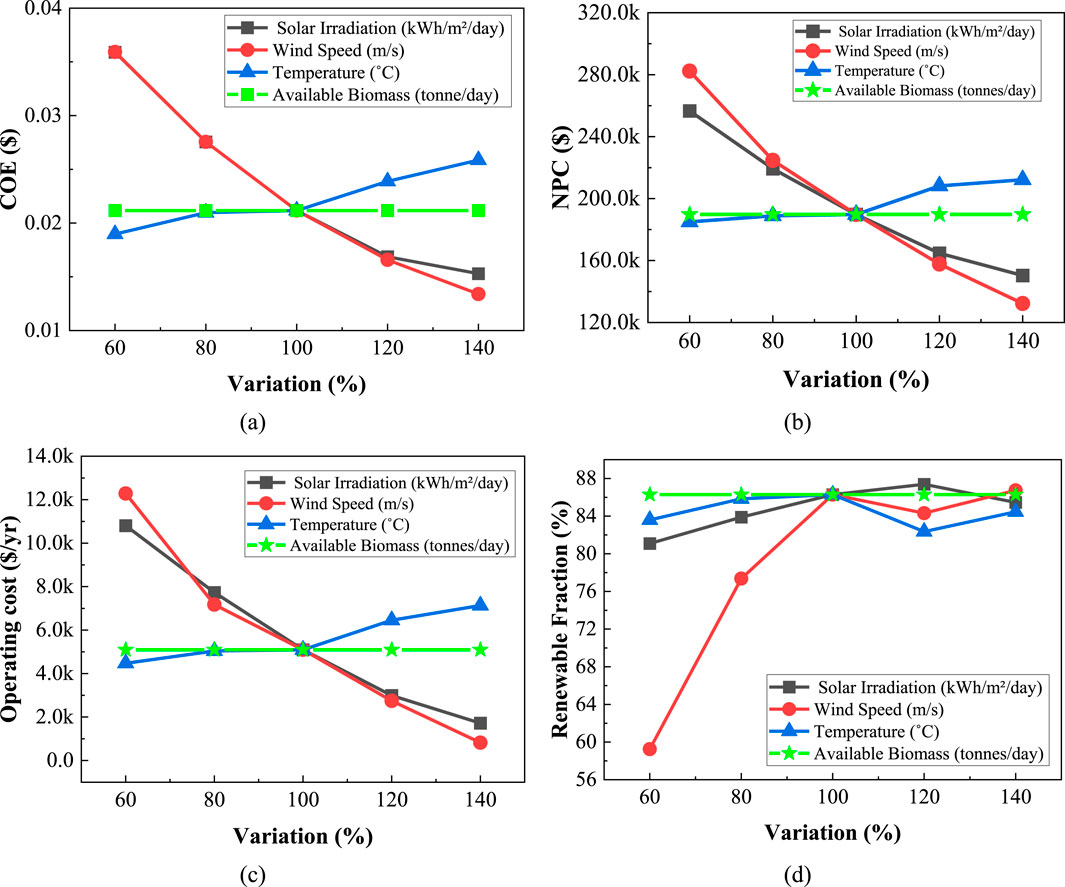
Figure 29. Impact of (a) COE, (b) NPC, (c) Operating Cost, and (d) Renewable Fraction on Environmental and Resource parameter variations.
Table 5 shows an integrated ranking of sensitivity of four prominent input parameters—wind speed, solar irradiation, temperature, and accessible biomass—based on their influence on indicators of system performance: COE, NPC, operation cost, and renewable fraction. Wind speed ranks highest due to its strong impact across all metrics, significantly lowering costs and increasing renewable contribution. Solar irradiation also shows high sensitivity, primarily enhancing PV output and reducing economic metrics. Temperature exhibits low sensitivity, with minimal variation in results. Available biomass shows no impact, indicating it is non-limiting in the current configuration. This analysis supports prioritizing wind and solar inputs in system optimization.
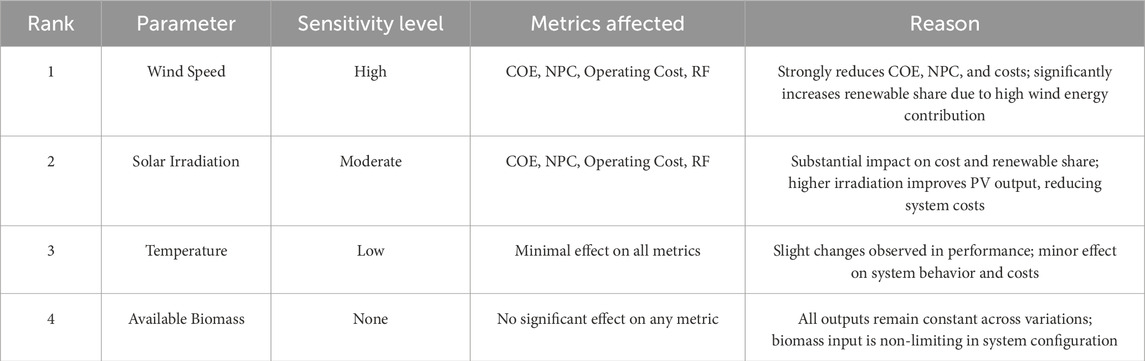
Table 5. Ranked impact of environmental and resource variations on hybrid system metrics.
3.3.2 Economic parameter sensitivity
Figure 30 indicates the sensitivity of COE, NPC, Operating Cost, and Renewable Fraction to ±40% variations in key economic parameters: nominal discount rate, inflation rate, power price, and sellback rate. In (a), COE rises substantially with higher nominal discount rate (+98.5%) but with higher inflation rate (−35.4%) and sellback rate (−28.8%). In (b), NPC is the most sensitive to discount rate, decreasing by 33.9% as it increases, and also increasing by 29% with inflation rate. In (c), operating cost decreases by 43.6% with a higher sellback rate, but increases almost not at all with inflation and power price. In (d), renewable share increases sharply with power price (+10.1%) and increases not much with inflation. But it falls at rising sellback rate (−5.6%) and increases slightly with discount rate. Nominal discount rate and sellback rate generally have a significant effect on system cost, whereas renewable share is affected by power price, while indicating principal levers to maximize hybrid energy system economics.
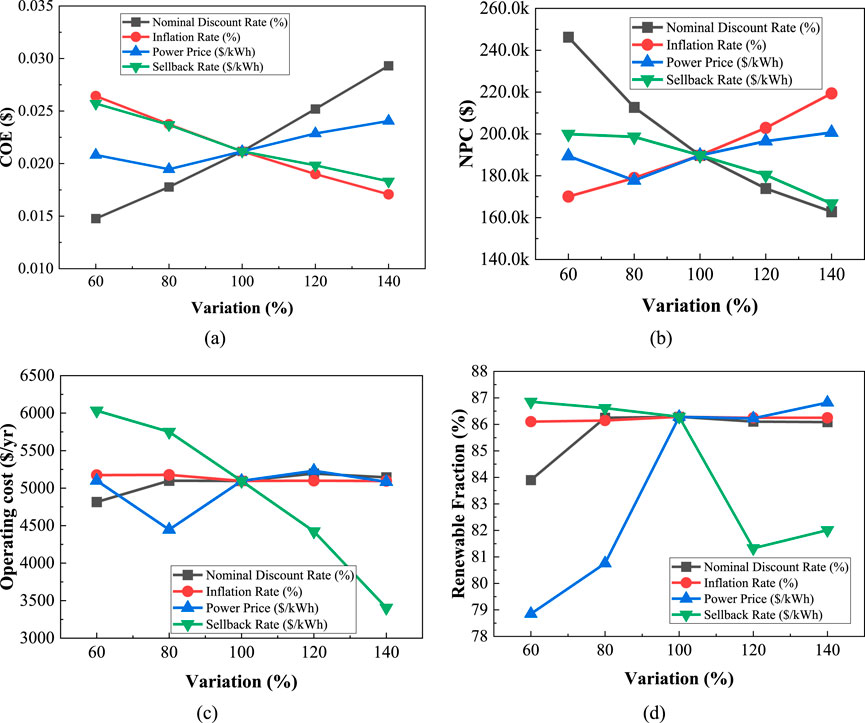
Figure 30. Impact of (a) COE, (b) NPC, (c) Operating Cost and (d) Renewable Fraction on economic parameter variations.
The four economic parameters are ordered based on the impact they have on system performance shown in.
The sensitivity ranking in Table 6 indicates the effect of key economic parameters on system performance. Nominal discount rate is ranked the highest with COE increasing by 98.5%, NPC decreasing by 33.9%, and renewable fraction having a change of 2.8%, indicating high impact on investment cost indicators. Sellback rate is also sensitive to a large extent, reducing operating cost by 43.6%, COE by 28.8%, and NPC by 16.7%, and affecting renewable fraction by 5.6%. Inflation rate indicates medium sensitivity, reducing COE by 35.4% and increasing NPC by 29%. Price of power has moderate impact, changing renewable share by 10.1% and having mild effect on cost parameters.
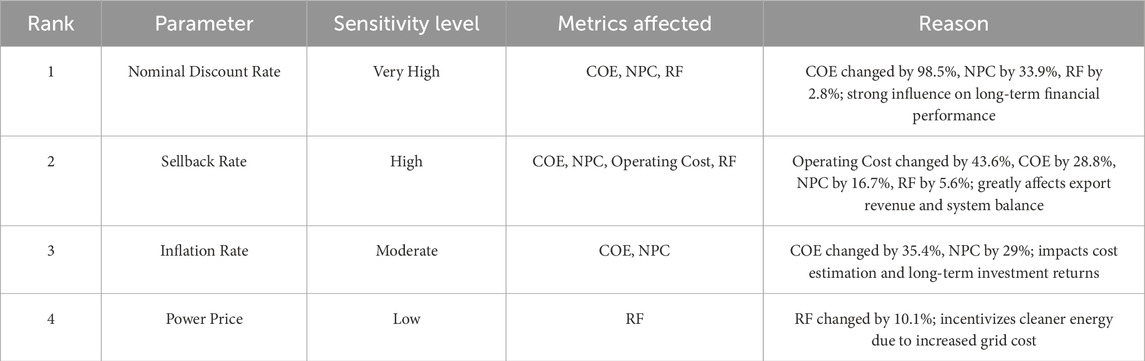
Table 6. Sensitivity ranking of economic parameters based on output variation.
3.3.3 Infrastructure and reliability sensitivity
Figure 31 demonstrates the influence of changes in infrastructure and reliability parameter—hub height, grid failure frequency, grid mean repair time, and grid variation repair time—on COE, NPC, Operating Cost, and Renewable Fraction. In (a), COE falls by 13.9% for increased hub height and by 53.1% for increased grid failure frequency, showing high sensitivity towards outage rates. In (b), NPC shows a steady decline (−11.6%) for increased hub height, while it rises sharply (+46.5%) for increased grid failure frequency, showing cost sensitivity towards reliability. In (c), the operating cost drops significantly (−27.4%) with a higher hub height but increases by 637% with rising failure frequency, indicating severe operating interruptions. In (d), the renewable fraction slightly improves with hub height (+1.5%) but increases by 8.7% with grid failure frequency, possibly because there is greater reliance on local generation. In total, grid failure frequency is the most dominant parameter, with hub height following closely, highlighting the significance of grid operation reliability and wind system design.
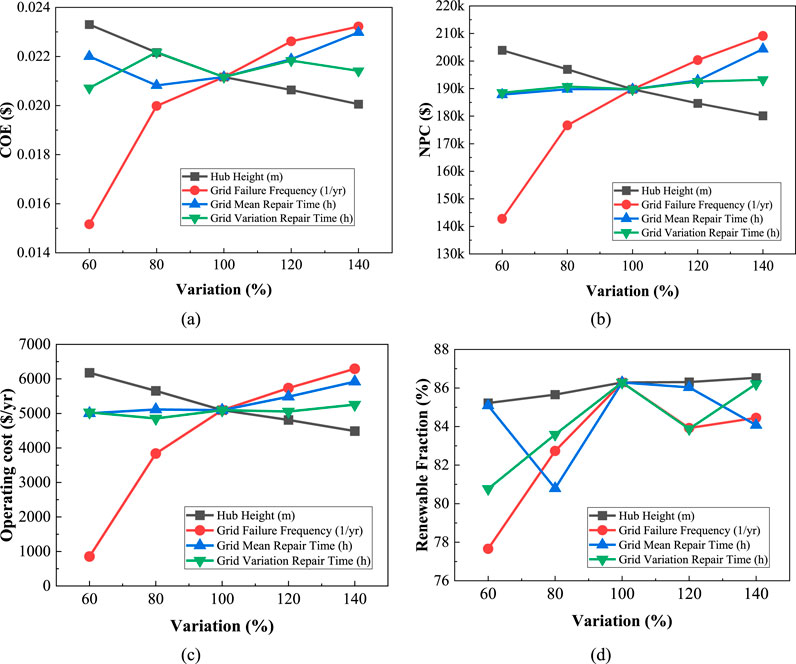
Figure 31. Impact of (a) COE, (b) NPC, (c) Operating Cost and (d) Renewable Fraction on Infrastructure and Reliability parameter variations.
The ranking Table 7 for sensitivity considers how infrastructure and reliability parameters affect the performance of hybrid systems. Grid failure frequency tops the list, having a significant impact on all the parameters: COE ranged from 53.1%, NPC by 46.5%, operating cost by 637%, and renewable fraction by 8.7%. Hub height is also found to be sensitive, recording reductions in COE by 13.9%, NPC by 11.6%, and operating cost by 27.4% while renewable fraction is increased by 1.5%. Grid mean repair time has medium influence, changing COE by 4.4%, NPC by 8.7%, and operating cost by 18.1%. Grid variation repair time shows low influence, changing only renewable fraction by 6.7%.
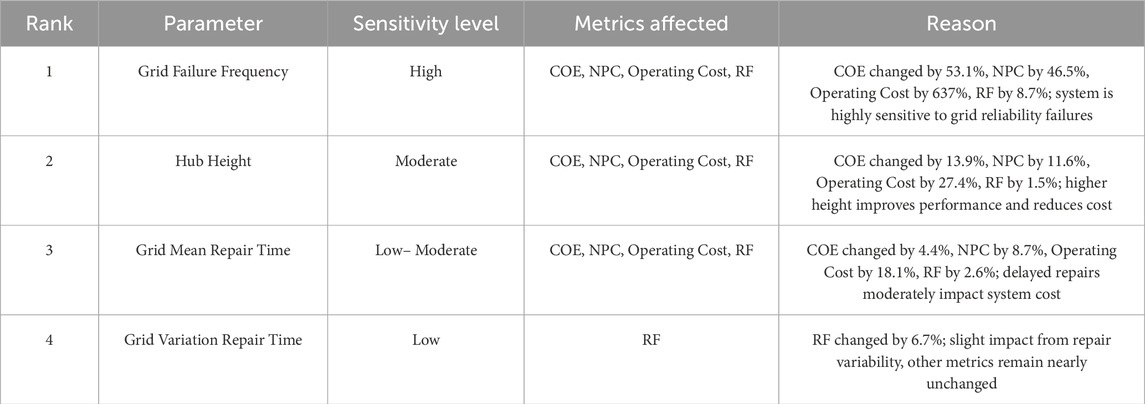
Table 7. Sensitivity ranking of infrastructure and reliability parameters based on output variation.
3.3.4 Economic multiplier evaluation
Table 8 shows the responsiveness of system costs to a ±20% variation in each component’s capital cost, replacement, and O&M cost. Solar PV is the most responsive, as NPC and COE both change by ±11.43%. Converter is the second largest, with NPC changing by −5.18% to +4.78% and COE by −5.53% to +6.13%. Wind turbine cost causes NPC and COE to change by ±2.17% and ±2.16%, respectively. BioGen shows unequal effects: NPC ranges from −0.78% to +2.95%, while COE ranges from −3.61% to +0.08%. BESS affects very minimally with variation of ±0.31% only.
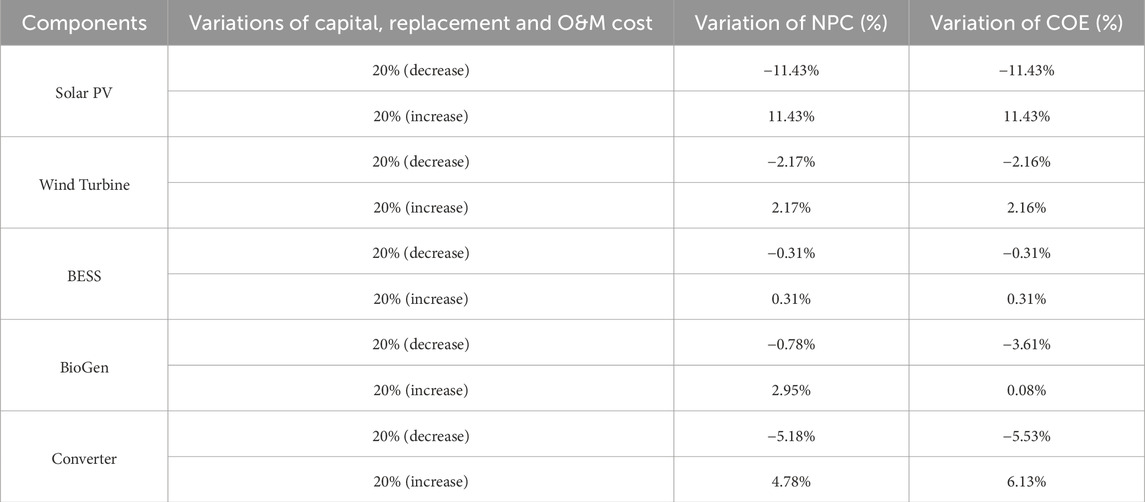
Table 8. Impact of 20% variations in component costs on NPC and COE.
The sensitivity analysis Table 9 examines the effect of ±20% variation in capital, replacement, and O&M costs of major components on NPC and COE. Solar PV is most sensitive with both NPC and COE varying by ±11.43%, which indicates its overarching effect on system economics. Converter is the second, NPC varying between −5.18% and +4.78% and COE between −5.53% and +6.13%. Wind turbine costs induce ±2.17% (NPC) and ±2.16% (COE) variations. BioGen induces asymmetric effects with NPC varying −0.78% to +2.95% and COE between −3.61% and +0.08%. BESS is the least sensitive at ±0.31% for NPC and COE.
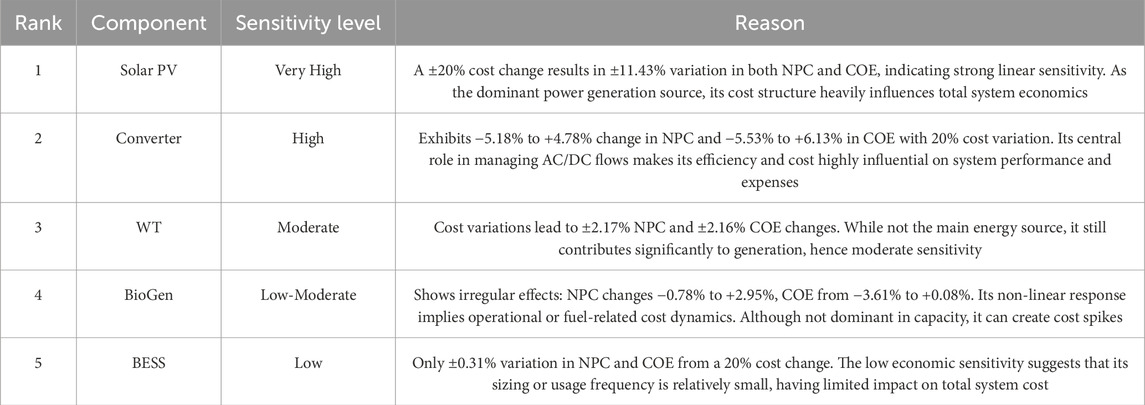
Table 9. Sensitivity ranking of microgrid components based on the impact of cost variations on NPC and COE.
3.4 Evaluating interdependencies among solar, wind, BioGen, storage, and grid parameter
The correlation heatmap Figure 32 illustrates interdependencies among 13 key energy variables. A strong positive correlation (0.98) exists between Solar PV Incident Solar and Solar PV Power Output, indicating effective solar energy conversion. Similarly, Wind Speed and Wind Turbine Power Output show a high correlation (0.96), reflecting efficient wind energy utilization. Total Renewable Power Output is highly correlated with Renewable Penetration (0.98) and Grid Sales (0.85), suggesting that surplus renewable generation contributes significantly to grid exports. Battery State of Charge correlates negatively with Inverter Power Output (−0.74) and positively with Rectifier Power Output (0.78), demonstrating expected charging and discharging behavior. Total Electrical Load Served aligns strongly with Inverter Power Output (0.89), highlighting the inverter’s role in meeting demand. These relationships confirm coherent system dynamics, supporting the reliability of the data and the performance of renewable-integrated microgrid operations.
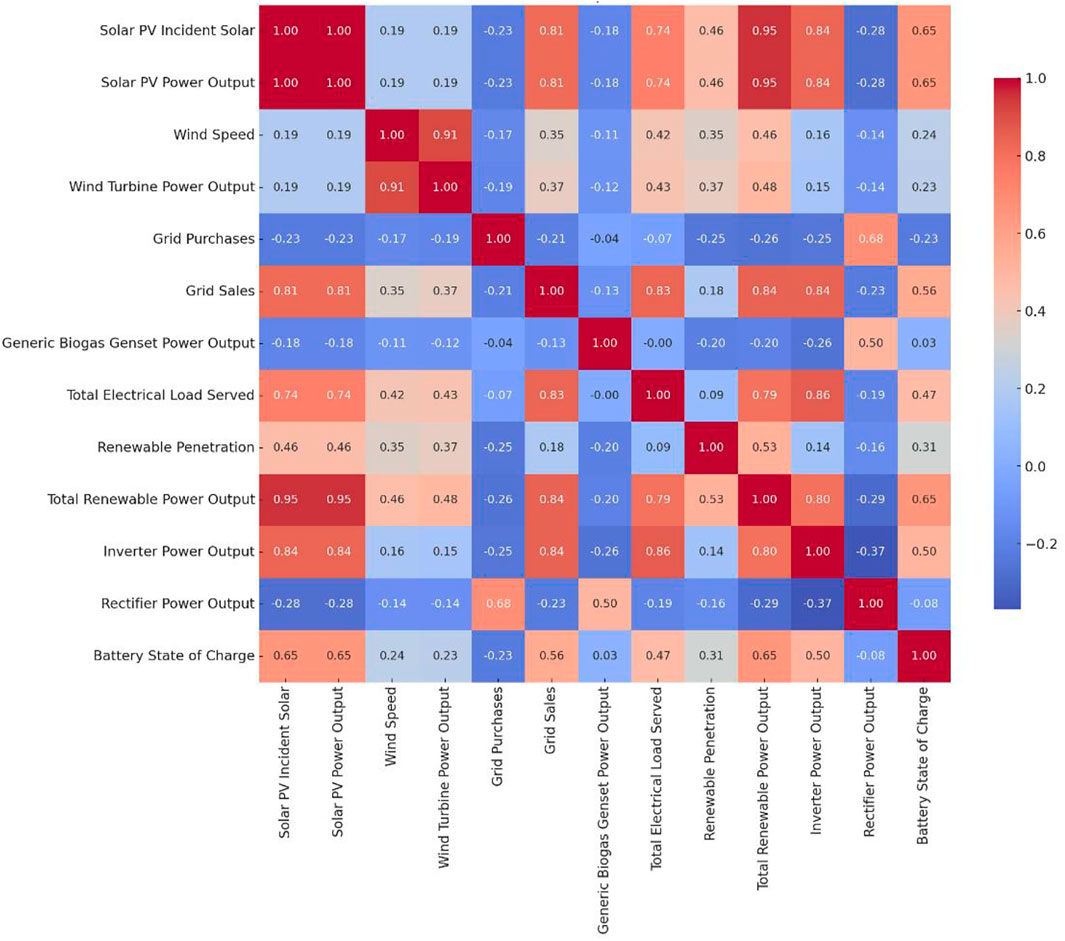
Figure 32. Heatmap of operational and environmental variable correlations in a renewable energy system.
3.5 Comparison with others published work
Table 10 encapsulates the comparative global analysis of various renewable energy systems, structural configurations, geographic distributions, and categorical applications. It highlights the varying levels of renewable integration and economic metrics, reflecting context-specific adaptations to energy needs across rural, urban, and institutional settings. Comparing off-grid and on-grid systems, it places in relief the interplay of challenges and solutions specific to location in influencing the adoption of renewable energy. The variation in RF, NPC, and COE across diverse contexts represents a dynamic balance between technological feasibility, economic viability, and environmental sustainability. In the final analysis, the table shows a multi-dimensional view of renewable energy potential, tailored to the geographically and functionally distinct scenarios.
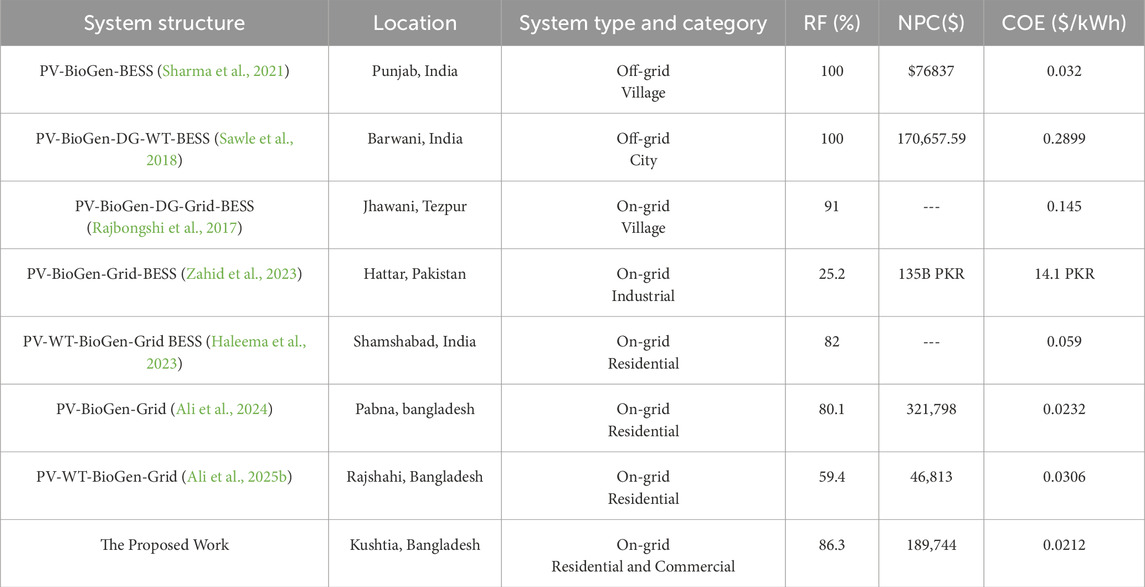
Table 10. Comparison of the proposed work with others published work.
It is acknowledged that the benchmarked studies in Table 10 were conducted under different load assumptions and varying local resource conditions such as solar radiation, wind regime, and biomass feedstock. Therefore, this comparison is not intended as a strict one-to-one equivalence, but rather to highlight relative techno-economic feasibility and design trends. Indicators such as NPC, COE, and renewable fraction provide a common basis for relative comparison, although differences in local context must be considered when interpreting the results. These studies were selected due to their geographical proximity within South Asia, similar rural electrification contexts, and comparable hybrid system architectures, which provide a meaningful benchmark for regional performance. Our results further show that by applying a multi-scenario optimization framework with HOMER Pro, incorporating tariff sensitivity and grid unreliability, the proposed system achieves a higher renewable fraction and lower cost of energy, suggesting that this methodology could yield improved outcomes if applied to comparable systems.
This study introduces a novel approach to rural electrification in Bangladesh through the integrative design and optimization of a hybrid energy system combining photovoltaic, wind, and biogas technologies with battery storage and grid connectivity. Unlike previous works that often consider isolated renewable sources or lack localized resource assessment, this research incorporates real, site-specific solar radiation, wind speed, and biomass availability data for Bahirmadi village. The system is comprehensively analyzed using HOMER Pro through 2,743 simulations, ensuring an exhaustive search for optimal configurations based on cost, reliability, and environmental impact. The proposed PV/Wind/BioGen-BESS-Grid system demonstrates superior performance with a high renewable fraction of 86.3%, significantly reduced CO2 emissions (78.9% lower than the baseline), and a very low levelized cost of electricity at $0.0212/kWh. These outcomes validate the feasibility and scalability of the system as a clean, resilient, and economically viable solution for off-grid or grid-challenged rural regions.
The contribution of this work lies in developing a replicable, data-driven hybrid microgrid optimization framework that supports policy formulation, investment planning, and sustainable development strategies. Although HOMER Pro was used in this study for implementation, the methodological structure—defined by the objective of minimizing NPC and LCOE, the use of decision variables (PV, wind, biogas, storage), and constraints such as demand–supply balance and reliability—can be applied using other optimization platforms or modeling tools. Moreover, the framework is not limited to the specific case of Kushtia; it can be adapted to other rural communities by substituting local resource data, demand profiles, and policy contexts. In this way, the study provides a generalizable approach to bridging the gap between technical feasibility and practical deployment of hybrid renewable energy systems in emerging economies.
Finally, the operational efficiency of the optimized hybrid system was assessed to align with the study objectives. The PV and wind subsystems achieved capacity factors of 17.7% and 9.1% respectively, reflecting the site’s solar and wind availability. The battery system operated with an assumed round-trip efficiency of 90%, completing approximately 590 equivalent full cycles annually. Moreover, the overall renewable fraction of the system reached 86.3%, highlighting efficient utilization of renewable resources while maintaining supply reliability. These indicators confirm that the proposed configuration not only minimizes cost and emissions but also operates with a high level of technical efficiency.
4 Conclusion
This study assessed different hybrid renewable energy configurations to supply electricity for a rural community in Kushtia, Bangladesh. Simulation results showed that the optimum system (250 kW PV, 250 kW wind, 100 kW biogas generator, 200 kWh BESS, and grid connection) achieved the lowest cost of energy at 0.0212 $/kWh, with a net present cost of 189,744 $. The renewable share reached 86.3%, which led to a 78.9% reduction in CO2 emissions compared to the grid-dependent base case. The system also ensured improved reliability with minimal unmet load. These findings demonstrate that a carefully designed PV–wind–biogas hybrid system is both technically feasible and economically attractive for rural electrification in Bangladesh. Beyond this case study, the approach can be extended to other off-grid or weak-grid regions with similar resource availability. Future work will incorporate ground-validated meteorological data and actual measured rural consumption profiles to further improve the accuracy of system design. Next-generation research can focus on more advanced control strategies, such as AI-based load forecasting and real-time energy dispatching. Further, application of metaheuristic algorithms to carry out multi-objective optimization can lead to improved performance in dynamic conditions. Addition of social acceptance studies, effects of grid policy on the model, and model replication in other remote villages will further prove its applicability and allow its use in even more developing nations.
Data availability statement
The raw data supporting the conclusions of this article will be made available by the authors, without undue reservation.
Author contributions
MRA: Conceptualization, Data curation, Formal Analysis, Investigation, Methodology, Software, Validation, Visualization, Writing – original draft, Writing – review and editing. MFA: Conceptualization, Data curation, Formal Analysis, Funding acquisition, Investigation, Methodology, Project administration, Resources, Software, Supervision, Validation, Visualization, Writing – original draft, Writing – review and editing. DB: Conceptualization, Data curation, Formal Analysis, Funding acquisition, Investigation, Methodology, Project administration, Resources, Software, Supervision, Validation, Visualization, Writing – original draft, Writing – review and editing. AA: Conceptualization, Data curation, Formal Analysis, Funding acquisition, Project administration, Supervision, Validation, Writing – review and editing. MH: Conceptualization, Formal Analysis, Funding acquisition, Investigation, Methodology, Project administration, Resources, Supervision, Validation, Writing – review and editing.
Funding
The author(s) declare that no financial support was received for the research and/or publication of this article.
Acknowledgements
The authors gratefully acknowledge Pabna University of Science and Technology, Pabna-6600, Bangladesh, for providing access to the Renewable Energy Laboratory and other facilities that supported the successful completion of this research.
Conflict of interest
The authors declare that the research was conducted in the absence of any commercial or financial relationships that could be construed as a potential conflict of interest.
Generative AI statement
The author(s) declare that no Generative AI was used in the creation of this manuscript.
Any alternative text (alt text) provided alongside figures in this article has been generated by Frontiers with the support of artificial intelligence and reasonable efforts have been made to ensure accuracy, including review by the authors wherever possible. If you identify any issues, please contact us.
Publisher’s note
All claims expressed in this article are solely those of the authors and do not necessarily represent those of their affiliated organizations, or those of the publisher, the editors and the reviewers. Any product that may be evaluated in this article, or claim that may be made by its manufacturer, is not guaranteed or endorsed by the publisher.
References
Abdelsattar, M., Ismeil, M. A., Aly, M. M., and Abu-Elwfa, S. S. (2024). Energy management of microgrid with renewable energy sources: a case study in hurghada Egypt. IEEE Access 12 (January), 19500–19509. doi:10.1109/ACCESS.2024.3356556
Abdullah-Al-Mahbub, M., and Islam, A. R. M. T. (2023). Current status of running renewable energy in Bangladesh and future prospect: a global comparison. Heliyon 9 (3), e14308. doi:10.1016/J.HELIYON.2023.E14308
Abdullah-Al-Mahbub, M., Islam, A. R. M. T., Almohamad, H., Al Dughairi, A. A., Al-Mutiry, M., and Abdo, H. G. (2022). Different forms of solar energy progress: the fast-growing eco-friendly energy source in Bangladesh for a sustainable future. Energies 15 (18), 6790. doi:10.3390/EN15186790
Acakpovi, A., Adjei, P., Nwulu, N., and Asabere, N. Y. (2020). Optimal hybrid renewable energy System: a comparative study of Wind/hydrogen/fuel-cell and wind/battery storage. J. Electr. Comput. Eng. 2020 (1), 1–15. doi:10.1155/2020/1756503
Adenle, A. A. (2020). Assessment of solar energy technologies in Africa-opportunities and challenges in meeting the 2030 agenda and sustainable development goals. Energy Policy 137, 111180. doi:10.1016/J.ENPOL.2019.111180
Akash, F. A., Shovon, S. M., Rahman, W., Rahman, M. A., Chakraborty, P., and Monir, M. U. (2024). Greening the grid: a comprehensive review of renewable energy in Bangladesh. Heliyon 10 (5), e27477. doi:10.1016/J.HELIYON.2024.E27477
Al-Najjar, H., El-Khozondar, H. J., Pfeifer, C., and Al Afif, R. (2022). Hybrid grid-tie electrification analysis of bio-shared renewable energy systems for domestic application. Sustain. Cities Soc. 77, 103538. doi:10.1016/J.SCS.2021.103538
Ali, F., Ahmar, M., Jiang, Y., and AlAhmad, M. (2021). A techno-economic assessment of hybrid energy systems in rural Pakistan. Energy 215, 119103. doi:10.1016/J.ENERGY.2020.119103
Ali, M. F., Hossain, M. A., Julhash, M. M., Ashikuzzaman, M., Alam, M. S., and Sheikh, M. R. I. (2024). A techno-economic analysis of a hybrid microgrid System in a residential area of Bangladesh: optimizing renewable energy. Sustainability 16 (18), 8051. doi:10.3390/SU16188051
Ali, M. F., Halim, M. A., Julhash, M. M., and Ashikuzzaman, M. (2025a). Economic and environmental benefits of grid-connected PV-Biomass systems in a Bangladeshi university: a HOMER pro approach. Int. Trans. Electr. Energy Syst. 2025 (1), 5053853. doi:10.1155/ETEP/5053853
Ali, M. F., Sheikh, M. R. I., Al Mamun, A., and Hossen, M. J. (2025b). Techno-Economic, predictive modeling, and demand response analysis of a renewable energy-based microgrid for residential applications. IEEE Access 13, 53748–53771. doi:10.1109/ACCESS.2025.3552056
Alibaba (2022). Biogas/natural Gas/biomass Generator Methane Generator - Buy Gas Power Generator gas Turbine Generator gas Generator gas Engine Generator silent Gas Generator wood Gas Generator water-cooled Gas Generator Set gas Engine Genset gas Power Station Design gas Power Station/plant gas Power Station/plant with Chp construction of Gas Power Station Product on Alibaba. Available online at: https://www.alibaba.com/product-detail/2000Kw-2500Kva-Biogas-Natural-Gas-Biomass_1601420795944.html?spm=a2700.galleryofferlist.normal_offer.d_title.63d413a074nsZv.
Allouhi, A. (2024). A hybrid PV/wind/battery energy system to assist a run-of-river micro-hydropower for clean electrification and fuelling hydrogen mobility for young population in a rural Moroccan site. J. Clean. Prod. 442, 140852. doi:10.1016/J.JCLEPRO.2024.140852
Alshammari, N., and Asumadu, J. (2020). Optimum unit sizing of hybrid renewable energy system utilizing harmony search, Jaya and particle swarm optimization algorithms. Sustain. Cities Soc. 60, 102255. doi:10.1016/J.SCS.2020.102255
Alshammari, N., Samy, M. M., and Asumadu, J. (2018). “Optimal economic analysis Study for renewable energy systems to electrify remote Region in Kingdom of Saudi Arabia,” in 2018 20th Int. Middle East Power Syst. Conf. MEPCON 2018 - proc, 1040–1045. doi:10.1109/MEPCON.2018.8635287
Alyahya, S., Colleges, O., Zaky, A. A., Yousif, B., and Dawoud, S. M. (2025). “Optimal planning and decision-making for hybrid microgrids: integrating diverse renewable sources with battery systems,” doi:10.21203/RS.3.RS-5790784/V1
Amer, M., Namaane, A., and M’Sirdi, N. K. (2013). Optimization of Hybrid Renewable Energy Systems (HRES) using PSO for cost reduction. Energy Procedia 42, 318–327. doi:10.1016/J.EGYPRO.2013.11.032
Ashraful Islam, M., Naushad Ali, M., Mollick, T., Islam, A., Benitez, I. B., Sidi Habib, S., et al. (2024). Assessing the feasibility and quality performance of a renewable Energy-Based hybrid microgrid for electrification of remote communities. Energy Convers. Manag. X 23, 100674. doi:10.1016/J.ECMX.2024.100674
Avwioroko, A. (2023). The potential, barriers. and strategies to upscale renewable energy adoption in developing countries: nigeria as a case study. Eng. Sci. Tecnol. J. 4 (2), 46–55. doi:10.51594/ESTJ.V4I2.1288
Aykut, E., and Terzi, K. (2020). Techno-economic and environmental analysis of grid connected hybrid wind/photovoltaic/biomass system for Marmara University Goztepe campus. Int. J. Green Energy 17 (15), 1036–1043. doi:10.1080/15435075.2020.1821691
Ayua, T. J., and Emetere, M. E. (2024). Technical and economic simulation of a hybrid renewable energy power system design for industrial application. Sci. Rep. 14 (1), 28739–21. doi:10.1038/s41598-024-77946-x
Azahra, A., Syahindra, K. D., Aryani, D. R., Jufri, F. H., and Ardita, I. M. (2020). Optimized configuration of photovoltaic and battery energy storage system (BESS) in an isolated grid: a case study of Eastern Indonesia. IOP Conf. Ser. Earth Environ. Sci. 599 (1), 012017. doi:10.1088/1755-1315/599/1/012017
Aziz, A. S., Tajuddin, M. F. N., Adzman, M. R., Mohammed, M. F., and Ramli, M. A. M. (2020). Feasibility analysis of grid-connected and islanded operation of a solar PV microgrid system: a case study of Iraq. Energy 191, 116591. doi:10.1016/J.ENERGY.2019.116591
Ba-swaimi, S., Verayiah, R., Ramachandaramurthy, V. K., Alahmad, A. K., and Padmanaban, S. (2025). Optimal configuration and sizing of integrated hybrid renewable energy systems for sustainable power supply in healthcare buildings. Results Eng. 26, 104800. doi:10.1016/J.RINENG.2025.104800
Bagdadee, A. H., and Zhang, L. (2025). Investigate the implementation of smart grid-integrated renewable distributed generation for sustainable energy development in Bangladesh. Energy Rep. 13, 2433–2453. doi:10.1016/J.EGYR.2025.01.083
Baidya, H., Rahman Zisan, M. T., Alif, A. Z., Ahmed, A., Hasan, M., and Chowdhury, N. U. R. (2025). Techno-Economic Comparative analysis of hybrid renewable energy systems optimization considering Off-grid remote area electrification in Bangladesh. Energy Convers. Manag. X 26, 101004. doi:10.1016/J.ECMX.2025.101004
Balduzzi, F., Zini, M., Molina, A. C., Bartoli, G., De Troyer, T., Runacres, M. C., et al. (2020). Understanding the aerodynamic behavior and energy conversion capability of small darrieus vertical axis wind turbines in turbulent flows. Energies 13 (11), 2936. doi:10.3390/EN13112936
Barakat, S., Emam, A., and Samy, M. M. (2022). Investigating grid-connected green power systems’ energy storage solutions in the event of frequent blackouts. Energy Rep. 8, 5177–5191. doi:10.1016/j.egyr.2022.03.201
Barakat, S., Osman, A. I., Tag-Eldin, E., Telba, A. A., Abdel Mageed, H. M., and Samy, M. M. (2024). Achieving green mobility: multi-objective optimization for sustainable electric vehicle charging. Energy Strateg. Rev. 53, 101351. doi:10.1016/J.ESR.2024.101351
Barkat, A. (2005). “Bangladesh rural electrification program: a success story of poverty reduction through electricity,” 331–370. doi:10.1142/9789812701787_0037
Bilal, M., Bokoro, P. N., and Sharma, G. (2025). Hybrid optimization for sustainable design and sizing of standalone microgrids integrating renewable energy, diesel generators, and battery storage with environmental considerations. Results Eng. 25, 103764. doi:10.1016/J.RINENG.2024.103764
Chen, S., Li, S., Ma, L., Ying, Y., Wu, Z., Huang, H., et al. (2024). Asymmetric anion zinc salt derived solid electrolyte interphase enabled long-lifespan aqueous zinc bromine batteries. Angew. Chem. Int. Ed. 63 (11), e202319125. doi:10.1002/ANIE.202319125
Das, B. K., Hasan, M., and Rashid, F. (2021). Optimal sizing of a grid-independent PV/diesel/pump-hydro hybrid system: a case study in Bangladesh. Sustain. Energy Technol. Assessments 44, 100997. doi:10.1016/J.SETA.2021.100997
Deng, Y., and Guo, W. (2017). A review of investment, financing and policies support mechanisms for renewable energy development. Adv. Intell. Syst. Comput. 502, 981–995. doi:10.1007/978-981-10-1837-4_82
Douiri, M. R. (2019). A predictive model for solar photovoltaic power based on computational intelligence technique. Arab. J. Sci. Eng. 44 (8), 6923–6940. doi:10.1007/s13369-019-03725-w
Dubey, S., Sarvaiya, J. N., and Seshadri, B. (2013). Temperature dependent photovoltaic (PV) efficiency and its effect on PV production in the world – a review. Energy Procedia 33, 311–321. doi:10.1016/J.EGYPRO.2013.05.072
Eckman, R. S., and Stackhouse, P. W. (2012). CEOS contributions to informing energy management and policy decision making using space-based Earth observations. Appl. Energy 90 (1), 206–210. doi:10.1016/J.APENERGY.2011.03.001
Efficiency, E. (2012). Renewable energy and energy efficiency proceedings of the international scientific.
El-Maaroufi, A., Daoudi, M., and Ahl Laamara, R. (2024). Techno-economic analysis of a PV/WT/biomass off-grid hybrid power system for rural electrification in northern Morocco using HOMER. Renew. Energy 231, 120904. doi:10.1016/J.RENENE.2024.120904
Electricity Generation Mix (2021). Electricity generation mix | national database of renewable energy. Available online at: https://www.renewableenergy.gov.bd/index.php?id=7 (Accessed May 29, 2025).
Eteiba, M. B., Barakat, S., Samy, M. M., and Wahba, W. I. (2018). Optimization of an off-grid PV/Biomass hybrid system with different battery technologies. Sustain. Cities Soc. 40, 713–727. doi:10.1016/J.SCS.2018.01.012
Ezekwem, C., and Muthusamy, S. (2023). Feasibility study of integrating the renewable energy system for increased electricity access: a case study of choba community in Nigeria. Sci. Afr. 21, e01781. doi:10.1016/J.SCIAF.2023.E01781
Ezekwem, C., Muthusamy, S., and Ezekwem, P. C. (2024). Optimal selection and design of grid-connected hybrid renewable energy system in three selected communities of Rivers state. Sci. Afr. 25, e02305. doi:10.1016/J.SCIAF.2024.E02305
Fyza, N., and Sarkar, M. A. R. (2020). Renewable energy for rural development in Bangladesh. J. Inst. Eng. 15 (3), 122–132. doi:10.3126/JIE.V15I3.32159
Güven, A. F., Yörükeren, N., and Samy, M. M. (2022). Design optimization of a stand-alone green energy system of university campus based on jaya-harmony search and ant colony optimization algorithms approaches. Energy 253, 124089. doi:10.1016/J.ENERGY.2022.124089
Güven, A. F., and Mahmoud Samy, M. (2022). Performance analysis of autonomous green energy system based on multi and hybrid metaheuristic optimization approaches. Energy Convers. Manag. 269, 116058. doi:10.1016/J.ENCONMAN.2022.116058
Haleema, K., Kumari Juluri, S., Pooja Sree, S., Karnekota, P., and Murugaperumal, K. (2023). Sustainable designing of hybrid renewable electrification system for urban residential community load. 2023 4th Int. Conf. Emerg. Technol. INCET, 1–7. doi:10.1109/INCET57972.2023.10170125
Hamadani, J. D., Hasan, M. I., Baldi, A. J., Hossain, S. J., Shiraji, S., Bhuiyan, M. S. A., et al. (2020). Immediate impact of stay-at-home orders to control COVID-19 transmission on socioeconomic conditions, food insecurity, mental health, and intimate partner violence in Bangladeshi women and their families: an interrupted time series. Lancet Glob. heal. 8 (11), e1380–e1389. doi:10.1016/S2214-109X(20)30366-1
Hasan, M. K., and Mohammad, N. (2019). An outlook over electrical energy generation and mixing policies of Bangladesh to achieve sustainable energy targets -Vision 2041. 2nd Int. Conf. Electr. Comput. Commun. Eng. ECCE 2019, 1–5. doi:10.1109/ECACE.2019.8679446
Hasan, M., Dey, P., Janefar, S., Salsabil, N. A., Khan, I. J., Chowdhury, N. U. R., et al. (2024). A critical analysis of wind energy generation potential in different regions of Bangladesh. Energy Rep. 11, 2152–2173. doi:10.1016/J.EGYR.2024.01.061
HOMER (2022). HOMER - hybrid renewable and distributed generation system design software. Available online at: https://homerenergy.com/ (Accessed December 01, 2024).
Horizontal Axis Wind Turbine (2022). Horizontal axis wind turbine 10kw 220V/380V - wind generator 10kw and wind turbine 10kw. Available online at: https://wxnaiermic.en.made-in-china.com/product/uytJoEKlCvhB/China-Horizontal-Axis-Wind-Turbine-10kw-220V-380V.html (Accessed May 31, 2025).
Hossain, M. A., Pota, H. R., Squartini, S., Zaman, F., and Muttaqi, K. M. (2019). Energy management of community microgrids considering degradation cost of battery. J. Energy Storage 22, 257–269. doi:10.1016/J.EST.2018.12.021
Hossein Jahangir, M., Bazdar, E., and Kargarzadeh, A. (2022). Techno-economic and environmental assessment of low carbon hybrid renewable electric systems for urban energy planning: Tehran-Iran. City Environ. Interact. 16, 100085. doi:10.1016/J.CACINT.2022.100085
Hosseini, S. E. (2022). Fossil fuel crisis and global warming. Fundam. Low Emiss. Flameless Combust. Its Appl., 1–11. doi:10.1016/B978-0-323-85244-9.00001-0
Hussain, M. N., Zaman, M. R., Halim, M. A., Ali, M. S., and Khan, M. Y. A. (2024). A comprehensive review of renewable and sustainable energy sources with solar photovoltaic electricity advancement in Bangladesh. Control Syst. Optim. Lett. 2 (1), 1–7. doi:10.59247/CSOL.V2I1.59
Imanloozadeh, A., Nazififard, M., and Hashemi-Dezaki, H. (2024). Optimal technoeconomic reliability-oriented design of islanded multicarrier microgrids with electrical and hydrogen energy storage systems considering emission concerns. Energy Sci. Eng. 12 (6), 2702–2745. doi:10.1002/ESE3.1774
Islam, M. S., Al-Amin, A. Q., and Sarkar, M. S. K. (2021). Energy crisis in Bangladesh: challenges, progress, and prospects for alternative energy resources. Util. Policy 71, 101221. doi:10.1016/J.JUP.2021.101221
Jacques Molu, R. J., Naoussi, S. R. D., Wira, P., Mbasso, W. F., Kenfack, S. T., Das, B. K., et al. (2023). Optimizing technical and economic aspects of off-grid hybrid renewable systems: a case Study of Manoka Island, Cameroon. IEEE Access 11, 130909–130930. doi:10.1109/ACCESS.2023.3332693
Jaiswal, K. K., Chowdhury, C. R., Yadav, D., Verma, R., Dutta, S., Jaiswal, K. S., et al. (2022). Renewable and sustainable clean energy development and impact on social, economic, and environmental health. Energy Nexus 7 (Sep), 100118. doi:10.1016/J.NEXUS.2022.100118
Jawad, A., Hasan, M. S., Faruqui, M. F. I., and Al Masood, N. (2023). Small-scale floating photovoltaic systems in university campus: a pathway to achieving SDG 7 goals in Bangladesh. Energy Convers. Manag. 297, 117722. doi:10.1016/J.ENCONMAN.2023.117722
Joarder, M. S. A., Raihan, A., Salehi, M., Walasek, R., and Zimon, G. (2024). Analysis of the Current development of renewable energy technologies in Bangladesh. Wseas Trans. Environ. Dev. 20, 883–894. doi:10.37394/232015.2024.20.82
Kadir, K. M., Howlader, M. M., Iqbal, M. M., Alam, M. K., Mahmood, M. K. S., and Rahaman, D. A. (2023). Integration of cloud computing: a new transition for Bangladesh power grid empowerment from reliability to grid resiliency. Energy Syst., 1–28. doi:10.1007/s12667-023-00632-w
Kaldellis, J. K. (2010). Optimum hybrid photovoltaic-based solution for remote telecommunication stations. Renew. Energy 35 (10), 2307–2315. doi:10.1016/J.RENENE.2010.03.029
Kasaeian, A., Rahdan, P., Rad, M. A. V., and Yan, W. M. (2019). Optimal design and technical analysis of a grid-connected hybrid photovoltaic/diesel/biogas under different economic conditions: a case study. Energy Convers. Manag. 198, 111810. doi:10.1016/J.ENCONMAN.2019.111810
Krishan, O., and Suhag, S. (2019). Techno-economic analysis of a hybrid renewable energy system for an energy poor rural community. J. Energy Storage 23, 305–319. doi:10.1016/J.EST.2019.04.002
Kumar, P. H., Alluraiah, N. C., Gopi, P., Bajaj, M., P, S. K., Kalyan, C. N. S., et al. (2025). Techno-economic optimization and sensitivity analysis of off-grid hybrid renewable energy systems: a case study for sustainable energy solutions in rural India. Results Eng. 25, 103674. doi:10.1016/J.RINENG.2024.103674
Mahmud, D. M., Ahmed, S. M. M., Hasan, S., and Zeyad, M. (2022). Grid-connected microgrid: design and feasibility analysis for a local community in Bangladesh. Clean. Energy 6 (3), 447–459. doi:10.1093/CE/ZKAC022
Mohammed, G., Ibrahim, A., Mohammed Kangiwa, U., and Benjamin Wisdom, J. (2021). Design and testing of building integrated hybrid vertical axis wind turbine. J. Electr. Electron. Eng. 9 (3), 69. doi:10.11648/J.JEEE.20210903.12
Mohn, K. (2020). The gravity of status quo: a review of IEA’s world energy outlook. Econ. Energy Environ. Policy 9 (1). doi:10.5547/2160-5890.8.2.KMOH
Mojumder, M. F. H., Islam, T., Chowdhury, P., Hasan, M., Takia, N. A., Chowdhury, N. U. R., et al. (2024). Techno-economic and environmental analysis of hybrid energy systems for remote areas: a sustainable case study in Bangladesh. Energy Convers. Manag. X 23 (April), 100664. doi:10.1016/j.ecmx.2024.100664
Mokhtara, C., Negrou, B., Settou, N., Settou, B., and Samy, M. M. (2021). Design optimization of off-grid Hybrid Renewable Energy Systems considering the effects of building energy performance and climate change: case study of Algeria. Energy 219, 119605. doi:10.1016/J.ENERGY.2020.119605
Muna, Y. B., and Kuo, C. C. (2022). Feasibility and techno-economic analysis of electric vehicle charging of PV/Wind/Diesel/Battery hybrid energy System with different battery technology. Energies 15 (12), 4364. doi:10.3390/en15124364
Nallolla, C. A., and Vijayapriya, P. (2022). Optimal design of a hybrid off-grid renewable energy System using techno-economic and sensitivity analysis for a rural remote location. Sustain 14 (22), 15393. doi:10.3390/SU142215393
NASA POWER (2024). “NASA POWER | prediction of worldwide energy resources.” Available online at: https://power.larc.nasa.gov/ (Accessed December 01, 2024).
Nguyen, V. G., Sharma, P., Bora, B. J., Bui, T. M. T., Efremov, C., Tran, M. H., et al. (2024). Techno-economic analysis of a hybrid energy system for electrification using an off-grid solar/biogas/battery system employing HOMER: a case study in Vietnam. Process Saf. Environ. Prot. 191, 1353–1367. doi:10.1016/J.PSEP.2024.09.046
Pahwa, A. (2016). Partnerships to facilitate electricity access for the remote rural communities of sub-Sahara Africa. IEEE PES PowerAfrica Conf. PowerAfrica, 83–87. doi:10.1109/POWERAFRICA.2016.7556576
Pandyaswargo, A. H., Wibowo, A. D., and Onoda, H. (2022). Reusing solar panels to improve access to information and communication in an off-grid village: a financial feasibility assessment. Energy Rep. 8, 857–865. doi:10.1016/J.EGYR.2022.05.141
Piyal, A. P., Ahmed, S., Rahman, K. F., and Mohsin, A. S. M. (2023). “Energy demand forecasting using machine learning perspective Bangladesh,” in 2023 IEEE IAS Glob. Conf. Renew. Energy Hydrog. Technol. GlobConHT 2023. doi:10.1109/GLOBCONHT56829.2023.10087679
POWER (2025). POWER | DAV. Available online at: https://power.larc.nasa.gov/data-access-viewer/ (Accessed December 18, 2024).
Qasim, M. A., Yaqoob, S. J., Bajaj, M., Blazek, V., and Obed, A. A. (2025). Techno-economic optimization of hybrid power systems for sustainable energy in remote communities of Iraq. Results Eng. 25, 104283. doi:10.1016/J.RINENG.2025.104283
Rahmat, M. A. A., Abd Hamid, A. S., Lu, Y., Ishak, M. A. A., Suheel, S. Z., Fazlizan, A., et al. (2022). An analysis of renewable energy technology integration investments in Malaysia using HOMER pro. Sustain 14 (20), 13684. doi:10.3390/su142013684
Rajbongshi, R., Borgohain, D., and Mahapatra, S. (2017). Optimization of PV-biomass-diesel and grid base hybrid energy systems for rural electrification by using HOMER. Energy 126, 461–474. doi:10.1016/J.ENERGY.2017.03.056
Ramesh, M., and Saini, R. P. (2020). Demand Side management based techno-economic performance analysis for a stand-alone hybrid renewable energy system of India. Energy Sources, Part A recover. Util. Environ. Eff. 47, 3359–3387. doi:10.1080/15567036.2020.1851820
Ranjan Pradhan, S., Pragatika Bhuyan, P., Sahoo, S. K., and Satya Prasad, G. R. K. D. (2019). Design of standalone hybrid biomass and PV system of an off-grid house in a remote area. J. Eng. Res. Appl. 3, 433–437.
Razmjoo, A., Shirmohammadi, R., Davarpanah, A., Pourfayaz, F., and Aslani, A. (2019). Stand-alone hybrid energy systems for remote area power generation. Energy Rep. 5, 231–241. doi:10.1016/J.EGYR.2019.01.010
RE Generation Mix (2025). RE generation mix | national database of renewable energy. Available online at: https://www.renewableenergy.gov.bd/index.php?id=4 (Accessed May 29, 2025).
Redouane, A., Saou, R., Belkhier, Y., and Oukaour, A. (2025). Integration of a novel Vernier-DSPM generator in a grid connected hybrid renewable energy system with battery storage. Results Eng. 25, 103814. doi:10.1016/J.RINENG.2024.103814
Rehan, M. A. (2024). Optimization of grid-connected hybrid renewable energy system for the educational institutes in Pakistan. e-Prime - Adv. Electr. Eng. Electron. Energy 10, 100781. doi:10.1016/J.PRIME.2024.100781
Sadeghi, A., Maleki, A., and Haghighat, S. (2024). Techno-economic analysis and optimization of a hybrid solar-wind-biomass-battery framework for the electrification of a remote area: a case study. Energy Convers. Manag. X 24, 100732. doi:10.1016/J.ECMX.2024.100732
Safi, M., Chowdhury, S., and Shahabuddin, G. M. (2023). Resources diversification in bangladesh’s electricity generation: a Study on the role of renewable energy sources. J. Eng. Res. Rep. 25 (3), 26–35. doi:10.9734/JERR/2023/V25I3889
Sawle, Y., Gupta, S. C., and Bohre, A. K. (2018). Review of hybrid renewable energy systems with comparative analysis of off-grid hybrid system. Renew. Sustain. Energy Rev. 81, 2217–2235. doi:10.1016/J.RSER.2017.06.033
Serat, Z., Danishmal, M., and Mohammad Mohammadi, F. (2024). Optimizing hybrid PV/Wind and grid systems for sustainable energy solutions at the university campus: economic, environmental, and sensitivity analysis. Energy Convers. Manag. X 24, 100691. doi:10.1016/J.ECMX.2024.100691
Shah Irshad, A., Naseer Zakir, M., Shah Rashad, S., Elsayed Lotfy, M., Mikhaylov, A., Elkholy, M., et al. (2024). Comparative analyses and optimizations of hybrid biomass and solar energy systems based upon a variety of biomass technologies. Energy Convers. Manag. X 23, 100640. doi:10.1016/J.ECMX.2024.100640
Shahzad, M. K., Zahid, A., Rashid, T., Rehan, M. A., Ali, M., and Ahmad, M. (2017). Techno-economic feasibility analysis of a solar-biomass off grid system for the electrification of remote rural areas in Pakistan using HOMER software. Renew. Energy 106, 264–273. doi:10.1016/j.renene.2017.01.033
Sharma, K. K., Gupta, A., Kumar, R., Chohan, J. S., Sharma, S., Singh, J., et al. (2021). Economic evaluation of a hybrid renewable energy system (HRES) using hybrid optimization model for electric renewable (HOMER) software—a case study of rural India. Int. J. Low-Carbon Technol. 16 (3), 814–821. doi:10.1093/IJLCT/CTAB012
Sieed, J., Komiyama, R., and Fujii, Y. (2020). Long-term projection of hourly electricity demand with sectoral decomposition for developing economies: bangladesh case Study. J. Jpn. Soc. Energy Resour. 41 (4), 136–142. doi:10.24778/JJSER.41.4_136
Singh, R. (2024). “Analyzing spatiotemporal trends and anomalies in power outage data across the United States,” in Proc. - 2024 IEEE Int. Conf. Big Data, BigData 2024, 7417–7421. doi:10.1109/BIGDATA62323.2024.10825495
Solving Problems with HOMER (2024). Solving problems with HOMER. Available online at: https://homerenergy.com/products/pro/docs/3.15/solving_problems_with_homer.html (Accessed December 01, 2024).
Sultana, M., Rahman, M., Das, N., and Ur Rashid, M. M. (2021). Feasibility and techno-economic analysis of an off-grid hybrid energy system: a char area in Bangladesh. Int. Conf. Sci. Contemp. Technol. ICSCT 2021. doi:10.1109/ICSCT53883.2021.9642703
Taheruzzaman, M., and Janik, P. (2016). Electric energy access in Bangladesh. Trans. Environ. Electr. Eng. 1 (2), 6–17. doi:10.22149/TEEE.V1I2.13
Twaha, S., Idris, M. H., Anwari, M., and Khairuddin, A. (2012). Applying grid-connected photovoltaic system as alternative source of electricity to supplement hydro power instead of using diesel in Uganda. Energy 37 (1), 185–194. doi:10.1016/J.ENERGY.2011.11.051
Wind power (2025). Wind power - energy education. Available online at: https://energyeducation.ca/wiki/index.php/Wind_power (Accessed December 04, 2025).
Winslow, A. R. (2017). Urban wind generation: comparing horizontal and vertical axis wind turbines at Clark University in Worcester, Massachusetts. Sustain. Soc. Justice. Available online at: https://commons.clarku.edu/idce_masters_papers/127 (Accessed May 31, 2025).
Wood, G. (2020). Fossil fuels in a carbon-constrained world. Palgrave Handb. Manag. Foss. Fuels Energy Transitions, 3–23. doi:10.1007/978-3-030-28076-5_1
Xia, T., Rezaei, M., Dampage, U., Alharbi, S. A., Nasif, O., Borowski, P. F., et al. (2021). Techno-Economic assessment of a grid-independent hybrid power plant for Co-Supplying a remote micro-community with electricity and hydrogen. Process. 2021 9 (8), 1375. doi:10.3390/PR9081375
Yu, H. J. J., and Geoffron, P. (2020). Solar PV market and policies. Photovolt. Sol. Energy Convers. Technol. Appl. Environ. Impacts, 413–437. doi:10.1016/B978-0-12-819610-6.00013-2
Zafar, U., Ur Rashid, T., Khosa, A. A., Khalil, M. S., and Rahid, M. (2018). An overview of implemented renewable energy policy of Pakistan. Renew. Sustain. Energy Rev. 82, 654–665. doi:10.1016/J.RSER.2017.09.034
Zahariea, D., Husaru, C. M., and Husaru, D. E. (2018). Small-scale 10 kW wind turbine on-grid connected for power supply of two different consumers. IOP Conf. Ser. Mater. Sci. Eng. 444 (8), 082007. doi:10.1088/1757-899X/444/8/082007
Zahid, A., Shahzad, M. K., Jamil, S. R., and Iqbal, N. (2023). Futuristic feasibility analysis and modelling of a solar-biomass on-grid hybrid system for Hattar Industrial estate phase (VII), Pakistan. Clean. Energy Syst. 4, 100053. doi:10.1016/J.CLES.2023.100053
Keywords: hybrid renewable energy system (HRES), microgrid optimization, rural electrification, grid integration, HOMER pro simulation, techno-economic analysis, CO2 emission reduction, Bangladesh energy sector
Citation: Ali MR, Ali MF, Biswas D, Al Mamun A and Hossen MJ (2025) Sustainable energy solutions for rural Bangladesh: an optimized hybrid microgrid model. Front. Energy Res. 13:1652536. doi: 10.3389/fenrg.2025.1652536
Received: 23 June 2025; Accepted: 27 October 2025;
Published: 27 November 2025.
Edited by:
Solomon Giwa, Olabisi Onabanjo University, NigeriaReviewed by:
Teerasak Somsak, Ragamagala University of Technology Lann, ThailandOlabode Olakunle, Achievers University, Nigeria
Copyright © 2025 Ali, Ali, Biswas, Al Mamun and Hossen. This is an open-access article distributed under the terms of the Creative Commons Attribution License (CC BY). The use, distribution or reproduction in other forums is permitted, provided the original author(s) and the copyright owner(s) are credited and that the original publication in this journal is cited, in accordance with accepted academic practice. No use, distribution or reproduction is permitted which does not comply with these terms.
*Correspondence: Md. Jakir Hossen, amFraXIuaG9zc2VuQG1tdS5lZHUubXk=; Md. Feroz Ali, ZmVyb3owNzEwMjFAZ21haWwuY29t