 Diego F. Mendoza
 Juan Carlos Quintero-Díaz
 Signe Kjelstrup
- 1Department of Chemical Engineering, Universidad de Antioquia, Medellín, Colombia
- 2PoreLab, Department of Chemistry, Norwegian University of Science and Technology, NTNU, Trondheim, Norway
Ammonia is one of the most widely produced chemicals worldwide and is increasingly considered a promising hydrogen carrier for energy storage. We propose a novel thermodynamic optimization strategy for tubular ammonia reactors based on second-law analysis and variable reactor geometry. Assuming thermal performance is already maximized through heat exchange, we explore how variations in reactor radius can further minimize entropy generation. Our steady-state mathematical model shows that geometry optimization alone can reduce total entropy production by 57% and pressure drop by 96%, without affecting ammonia yield or catalyst usage. Sensitivity analysis highlights the role of thermal boundary conditions on reactor performance. This study demonstrates that integrating geometric design with entropy minimization principles can significantly enhance the thermodynamic efficiency and sustainability of industrial chemical reactors.
1 Introduction
Ammonia is one of the most important chemicals in industry due to its widespread use in the production of fertilizers, explosives, synthetic fibers, and more recently as a carbon-free energy carrier (Kojima and Yamaguchi, 2022). It is considered an efficient hydrogen carrier, offering a higher hydrogen density per unit volume than liquid hydrogen. This characteristic facilitates its storage and transportation, as ammonia can be stored under moderate pressure and temperature conditions compared to hydrogen (Chai et al., 2021; Meriño et al., 2025).
Ammonia production is energy intensive (30 GJ/ton
One of the main concerns is how to produce more ammonia to meet its increasing demand while diminishing the emissions (IEA, 2021). This requires encompassing policies and technologies to promote near-zero-emission production methods, such as using water instead methane as hydrogen source, generating small-scale decentralized production plants, as well as increasing the energy efficiency of the process (Ghavam et al., 2021; Smith et al., 2020; Amhamed et al., 2022; Ojelade et al., 2023; Erfani et al., 2024).
Second law analysis, based on either exergy or entropy generation, is a well-established methodology for improving energy efficiency in chemical processes, including reactor systems (Kumar and Sharma, 2025; Flórez-Orrego and de Oliveira Junior, 2017b; Penkuhn and Tsatsaronis, 2017; Flórez-Orrego and de Oliveira Junior, 2017a; Johannessen and Kjelstrup, 2004; Bedeaux et al., 1999). In this framework, an efficient process is one that minimizes entropy production, reflecting lower irreversible losses and improved exergy utilization. Despite its potential, second law efficiency is not yet systematically applied in the design and optimization of chemical reactors (Kjelstrup et al., 2010). Nonequilibrium thermodynamics provides a direct theoretical link to this approach through the concept of entropy production. Consequently, the entropy balance of the process becomes a fundamental tool. In light of current concerns regarding energy savings and storage, we are motivated to contribute to a more systematic integration of second law principles. In particular, we emphasize the importance of giving the entropy balance equation a more prominent role in the energy accounting of chemical processes.
In the Haber-Bosch process, exergy losses largely stem from heat exchange within the reactor and during ammonia recovery, accounting for 52%–65% of the total. Meanwhile, pressure drop in the reactor contributes about 5% to the overall entropy production within the reactor (Kirova-Yordanova, 2004). Moreover, the reactor type and its operating pressure profoundly influence the efficiency of the ammonia synthesis loop. This choice directly impacts the exergy destruction linked to both heat integration and the introduction of the feed gas (Penkuhn and Tsatsaronis, 2017).
Optimization of ammonia reactors have focused on finding the best multi-bed adiabatic reactors with intercooling (Flórez-Orrego and de Oliveira Junior, 2017b; Cheema and Krewer, 2019; Farsi et al., 2021) and on finding temperature profiles along the reactors that maximize ammonia conversion by manipulating thermal load (Månson and Andresen, 1986). Works on entropy production analysis in ammonia reactors have also analyzed multi-bed adiabatic reactors with intercooling as well as non-adiabatic reactors. It has been found that the inlet flow rate in multi-bed reactors gives rise to a dramatic increase in the entropy production (Xie et al., 2022). The irreversibilities were associated with chemical reaction and pressure drop, while the nitrogen-hydrogen ratio had a rather small influence on the entropy production.
Nummedal et al. (2003) minimized the entropy production of ammonia reactors with external cooling for different heat transfer coefficients,
The studies conducted by Månson and Andresen (1986), together with those by Nummedal et al. (2003) shall provide this work with a convenient point of reference, a Base Case. Our modelling results shall be compared at similar conditions with these results from the literature. We shall next proceed to assume that all necessary cooling is available at the temperature dictated by the Base Case. This provides us with an ideal reference case, ideal in the sense that the temperature profile is derived from a condition of maximum ammonia produced. This choice is reasonable, given that a study of the effect of heat transfer was done already by Nummedal et al. (2003).
In this contribution we assume that the cooling is available at the temperature dictated by the Base Case. For the influence of the heat transfer in the entropy production in ammonia reactor we refer the reader to the work of Nummedal et al. (2003).
High fidelity mathematical models and advanced manufacturing processes, such as 3D printing, have enabled shape optimization in chemical reactor design (Begall et al., 2023). This tool allows finding geometries that optimize performance criteria while satisfying process and manufacturing constraints (Courtais et al., 2021; Courtais et al., 2023). The simplest shape optimization methods include a set of geometric parameters, such as length, radii and angles, as decision variables in the optimization (Chen et al., 2007). Second Law analysis including shape optimization have been applied to
In this work we find the temperature profile and geometry (length and radius distribution) that minimizes the entropy production of a packed-bed tubular reactor and compare it with the optimal Base Case design of a tubular reactor with constant diameter. In both cases the designs use the same amount of catalyst and obtain a product with the same ammonia composition and flow.
2 Methodology
2.1 Physical-chemical model
The model was derived for a steady-state, packed-bed tubular reactor with variable cross section area and is based on the work of Magnanelli et al. (2019). The main assumptions of the model are: (i) plug flow, (ii) negligible temperature difference between gas bulk and catalyst, and (iii) validity of Ergun’s equation to compute pressure drop.
In a control volume
where
The reaction rate of ammonia formation,
where
The kinetic coefficients, Equations 5 and 6, follow Arrhenius-type kinetic expressions (Nielsen et al., 1964):
where
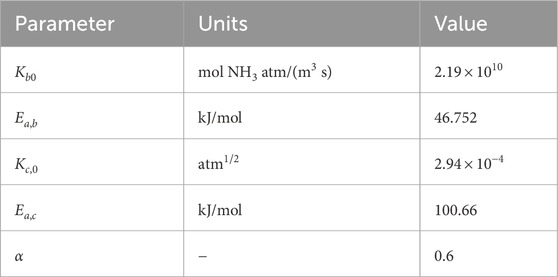
Table 1. Kinetic parameters (Nielsen et al., 1964).
The thermodynamic equilibrium constant,
The fugacity of the species
The fugacity coefficient
where
and
The values of parameters
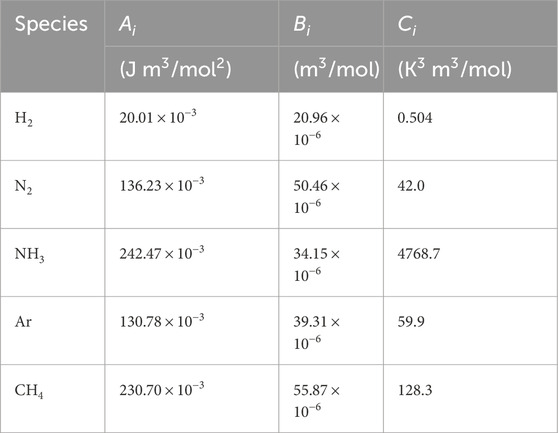
Table 2. Beattie-Bridgman parameters (Månson and Andresen, 1986).
The energy balance for a differential section of the reactor
where
where
The enthalpy of the mixture is calculated using the residual approach:
The ideal gas contribution to enthalpy,
The values for
where
where parameters
The local pressure drop is estimated from Ergun’s equation,
where
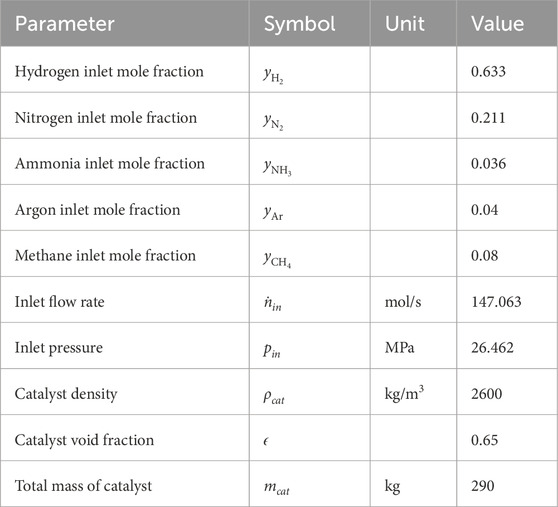
Table 3. Reactor parameters (Nummedal et al., 2003).
The local gas flow velocity,
where
The compressibility factor,
and
where
2.2 Entropy production
The entropy production in the reactor,
The local entropy production per unit length, Equation 27 is obtained using irreversible thermodynamics as the product of fluxes and thermodynamic forces (Kjelstrup et al., 2010),
The first term on the right-hand-side of Equation 27 is the reaction rate,
The thermodynamic reaction force is calculated from Equation 28 (Nummedal et al., 2003):
where
3 Reactor optimization
The objective of control theory, a domain in variational calculus, is to find the function that optimizes a functional, when the optimization is also subject to constraints (Nolasco et al., 2021; Biegler, 2010). Here, we shall use the method twice, first to establish a Base Case reactor, and second to minimize the total entropy production of that reactor. Constraints apply in both cases. The reactor yield is the outcome of an optimization in the Base Case, but a constraint in the second case.
3.1 Base case
As Base Case (BC) we have taken an ideal reactor of 10 m length with a constant radius of 0.1 m. By ideal we mean that the reactor has an optimal temperature profile that maximizes the mole fraction of the ammonia outlet,
s.t.
where Equations 1–22 are equality constraints corresponding to the differential-algebraic system of the reactor model, including its entropy production. The lower and upper bounds for the inlet temperature and for heat flux were set to
3.2 Entropy production minimization
The variables of entropy production minimization problem include the radius change, reactor length, heat flux and gas inlet temperature. The model is reformulated in terms of a dimensionless length,
The differential operator,
Once these changes are introduced in the model, the optimization problem is formulated as according to Equations 34–41:
s.t.
Scaled Equations 1-22
The equality constraints apply to the scaled model equations using dimensionless length
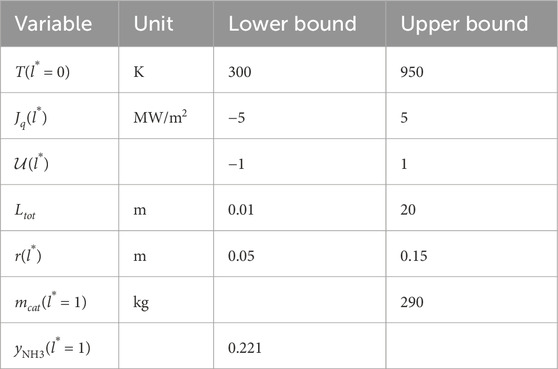
Table 4. Bounds for the minimum entropy production optimization case.
3.3 Model implementation
The model was implemented in the optimization modeling language Pyomo (Bynum et al., 2021). The differential algebraic model was discretized using orthogonal collocation on finite elements using the pyomo. dae extension (Nicholson et al., 2017). In this case the discretization consisted of 200 finite elements with 3 Radau collocations points. The discretized model was solved in the large scale nonlinear optimization solver IPOPT 3.13.2.
4 Results and discussion
4.1 The base case
The Base Case (BC) is a reactor with maximum ammonia produced, given a heat flux and gas inlet temperature. The optimal gas temperature profile shown in Figure 1a implies a high inlet gas temperature (870 K) followed by cooling along the reactor. The main determinant of this behavior is the kinetic expression, Equation 4, which takes into account two antagonistic contributions: on one hand, the term
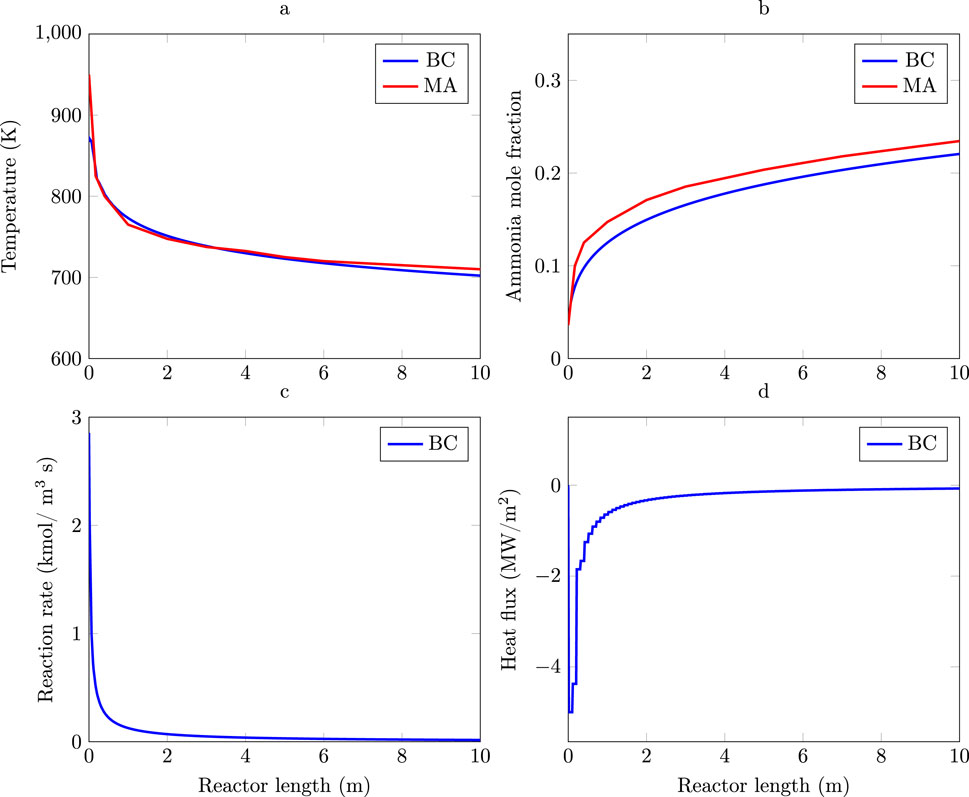
Figure 1. Ammonia production maximization for the Base Case (BC) and the work of Månson and Andresen (Månson and Andresen, 1986) (MA). (a) Temperature profile. (b) Ammonia mole fraction. (c) Reaction rate of ammonia production for BC. (d) Heat flux profile for BC.
The reactor temperature profile (Figure 1a) is high at start (above 800 K) and declines sharply below 800K (Figure 1c). In the high temperature zone, the system is far from chemical equilibrium. The reaction rate experiences a very sharp decrease (Figure 1c). The high temperature zone corresponds to the first 0.5 m of the reactor (5% of the total reactor length) and is the most efficient reaction zone generating 40% of the total ammonia produced in the reactor.
An important point not handled here is catalyst deactivation. In terms of catalyst utilization, the high-temperature zone (up to 0.5 m along the reactor length) produces 0.62 mol/s of ammonia per kilogram of catalyst, compared to 0.048 mol/s per kilogram in the low-temperature zone (beyond 0.5 m along the reactor). However, catalysts exposed to temperatures above 800 K can rapidly deactivate, while below this threshold, catalyst deactivation remains low (Liu, 2014; Chonggen et al., 2011). Under these conditions, 95% of the total catalyst mass contributes to 60% of the total ammonia production.
The optimized reactor produces 22.3 mol of ammonia per second (32.7 metric ton/day) with an effluent composed of 22.01 (mole %) ammonia (Figure 1b). This optimal ammonia mole fraction is close to the 23.45 (mole %) obtained by Månson and Andresen (1986) who optimized an ammonia synthesis reactor with similar inlet composition and pressure, but without taking into account the pressure drop. The main difference between our and their results lies in the higher gas inlet temperature of about 950 K, which leads to a higher ammonia mole fraction profile. Nonetheless, the optimal temperature and ammonia profiles reported by Månson and Andresen (1986) are in good agreement with those obtained in this work (see Figures 1a,b). This makes it now interesting to move one more step, and see if the energy efficiency also can be improved in terms of having a smaller entropy production.
The total cooling load required to carry out the process is 2.14 MW. As much as 67.3% of it (1.44 MW) is transferred in the first 2 m of the reactor (Figure 1d), while the last 2 m represents only 4.6% (0.1 MW) of the total transfer. One reason for this behavior, in addition to the reaction rate and thermodynamic equilibrium considered in the beginning of this section, is that the control of the heat released by the reaction is mainly located in the first part of the reactor.
The total pressure drop for the Base Case was 0.432 MPa (Figure 2a), corresponding to 1.65% of the inlet pressure (26.462 MPa), this pressure drop is constant per reactor length (0.0432 MPa/m) due to slight variations in flow velocity, between 1.8 and 2.4 m/s, (Figure 2b). In practical terms a lower pressure drop has a positive effect on reactor performance since ammonia production is thermodynamically and kinetically favored by high pressures, additionally higher reactor outlet pressures reduce the cooling duty necessary to recover ammonia by condensation before recirculation of unconverted reactants which would reduce econmic cost.
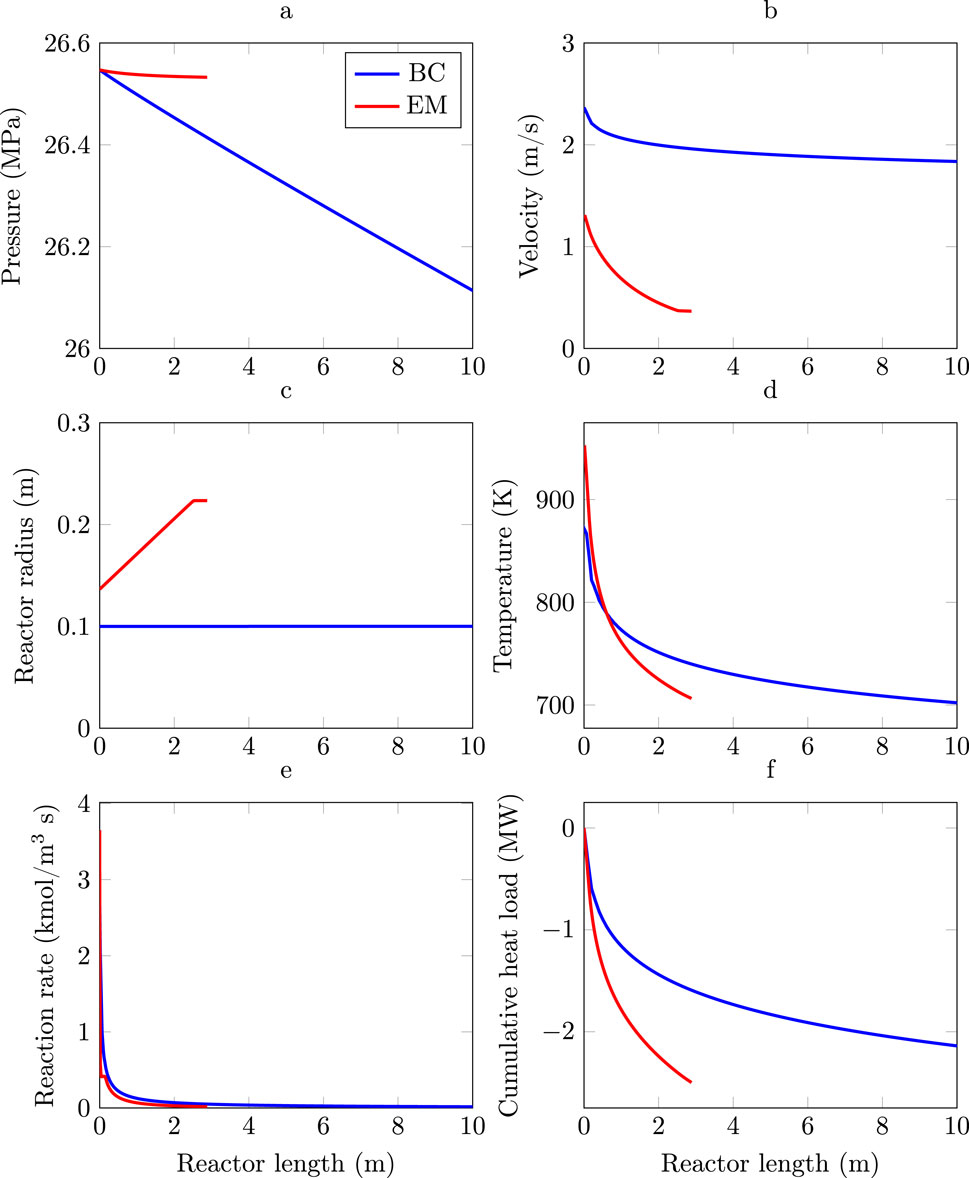
Figure 2. Profiles for the Base Case (blue curves) and the reactor with minimum entropy production (red curves). (a) Pressure. (b) Velocity. (c) Radius. (d) Temperature. (e) Reaction rate. (f) Cumulative heat load.
4.2 Entropy production minimization
Entropy production minimization was carried out keeping the same ammonia production (22.3 mol/s) and composition (22.01% molar) as well as total mass of catalyst (290 kg), using local radius change
The optimal geometry (Figure 2c) results in a reactor with a length of 2.9 m and a radius distribution that increases linearly from 0.14 m in the inlet to 0.22 m in the outlet. The geometry diminishes the pressure drop by 96% with respect to the Base Case. The main reason for this lies in the in gas velocity reduction which has a quadratic contribution to the pressure drop expression as given by Ergun’s equation, Equation 21.
The gas inlet temperature in the reactor with minimum entropy production reactor is, however, 80 K higher than in the Base Case reactor (Figure 2d). Higher inlet temperatures increase the initial reaction rate of the minimum entropy production reactor followed by a steeper decrease than in the Base Case reactor (Figure 2e). Temperature profiles show that the length of hot reaction zone,
The heat load distribution (Figure 2f) in the Base Case and the in the minimum entropy production design follow similar patterns. In both cases the greatest heat load is located in the first part of the reactor. The total cooling load in the reactor with minimum entropy production (2.49 MW) is 16% greater than in the Base Case. The main differences in heat load is from the first 0.5 m to the end of the reactor length. A way of using the cooling heat to increase thermal efficiency in the process is by generating steam (Flórez-Orrego and de Oliveira Junior, 2017b), which could increase the thermal efficiency of the minimum entropy production reactor with respect to the BC reactor.
The entropy production in the Base Case is 0.139 kW/K where 0.102 kW/K, 73% of the total entropy production (Figure 3a), is due to the reaction term in the entropy production equation. The reactor with minimum entropy production, Figure 3b, reduces the total entropy production by 57% with respect to the Base Case. A salient aspect of the thermodynamically optimal reactor is that the contribution of the reaction and pressure terms in the entropy production is 57% and 99% lower with respect to the Base Case, leading to a reactor design where almost all the irreversibility is due to reaction, since this term represents 98% the total entropy production. These are significant changes.
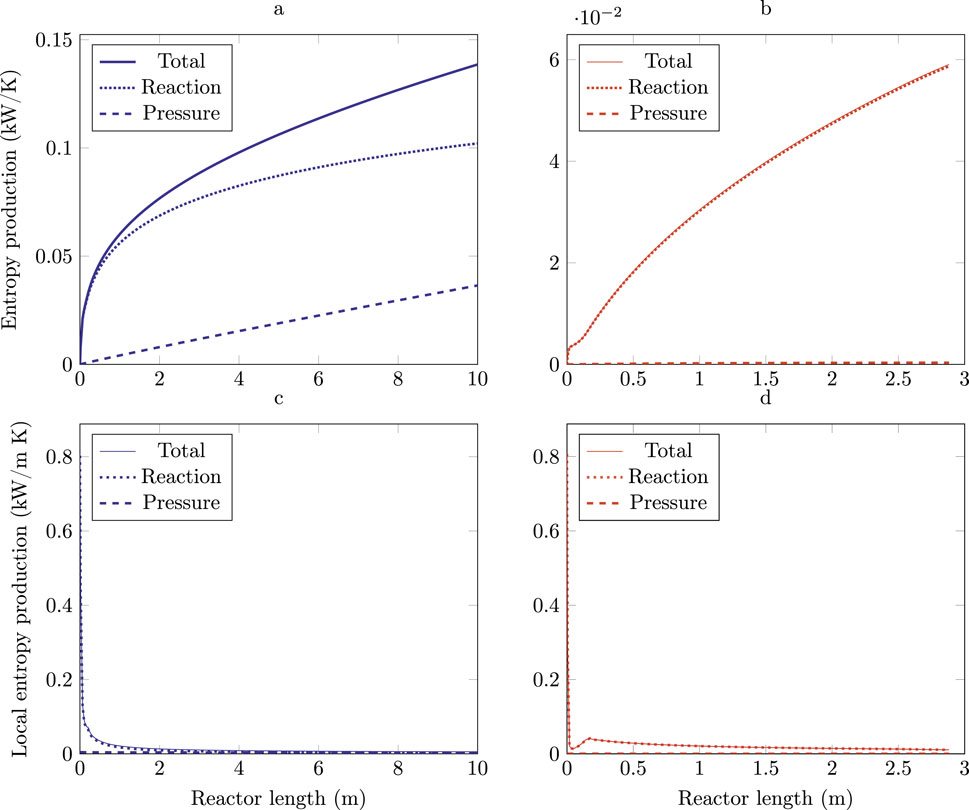
Figure 3. Entropy production profiles for the Base Case (blue lines) and the minimum entropy production reactor (red lines). (a) Cumulative entropy production BC. (b) Cumulative entropy production EM. (c) Local entropy production BC. (d) Local entropy production EM.
It is interesting to note that the local entropy production profiles show that entropy production is more evenly distributed in the EM case (Figure 3d) than in the BC (Figure 3c). The result give some support to the principle of equipartition of entropy production which identifies systems with minimum entropy as those that distribute entropy production evenly throughout the system (Tondeur and Kvaalen, 1987). However, exact equipartition is not expected for constrained optimization.
The heat transfer and geometry controls used in the EM case concerned two key reaction aspects, viz, the reaction temperature and pressure. As previously discussed, the first part of the EM reactor, where most ammonia is produced, has a low pressure drop with respect to the BC. The higher pressure present in the EM thermodynamically favors the production of ammonia. Geometry optimization is key to reduce the compression work required for ammonia condensation once it leaves the reactor, and to increase the reaction performance.
4.3 Heat flux sensitivity analysis
In Section 4.1, it was assumed that the heat flux
The heat flux bounds for the EM case were
From this expression we define variable lower and upper bounds of the
The optimization problem given by Equations 36–38 is solved for each value of
Figure 4a presents a Pareto front illustrating the relationship between the maximum allowable heat flux and the entropy production rate. It is observed that as the heat flux
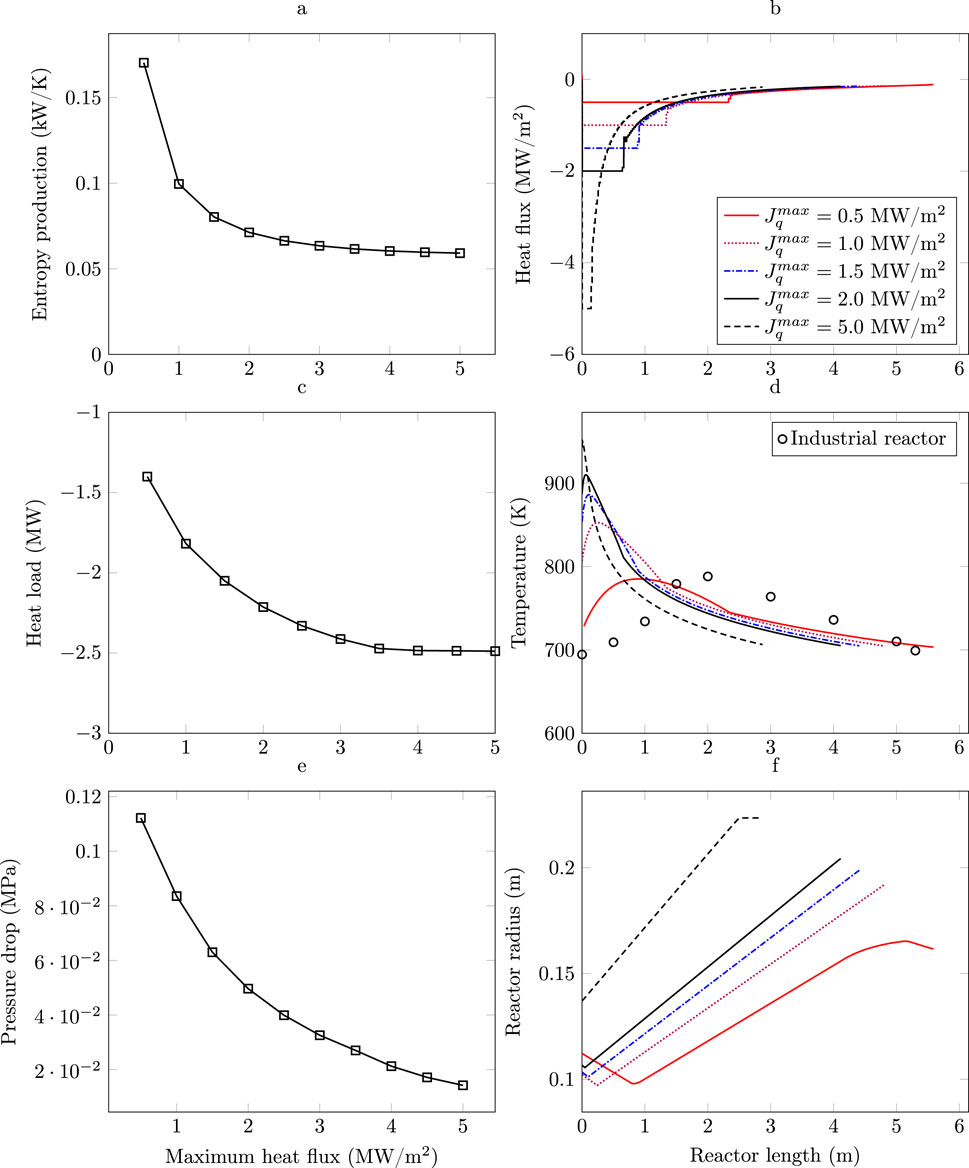
Figure 4. Heat flux sensitivity. (a) Entropy production rate Pareto front. (b) Heat flux profile. (c) Heat load vs. maximum heat flux constraint. (d) Optimal temperature profiles vs. maximum heat flux constraint. (e) Pressure drop vs. heat flux constraint. (f) Radius profile vs. heat flux constraint.
Figure 4b shows the heat flux profiles along the reactor for different values of
As shown in Figure 4d, the gas temperature at the reactor inlet tends to decrease as the maximum allowed heat flux decreases. This occurs because, the optimization procedure aims to prevent an excessive increase in temperature in the initial section of the reactor, where the exothermic ammonia synthesis reaction is faster and releases a significant amount of heat with a lower heat removal capacity. By starting with a lower temperature, the heat generated along the reactor can be better managed under limited cooling capacity. This is consistent with observations showing that, toward the end of the reactor, temperatures tend to rise as the maximum heat flux decreases. The presence of “hot spots” in the temperature profile becomes more evident as the maximum allowed heat flux is reduced. This is because the limited capacity to remove the heat generated by the reaction leads to local accumulations of energy. When the reactor’s cooling capacity is limited, it becomes impossible to maintain the optimal temperatures associated with higher heat flux, which prevents the minimization of entropy production. From a local perspective, to initiate the process at a lower temperature may reduce the entropy produced by the reaction; however, this also significantly lowers the reaction rate at the reactor inlet (Saffari et al., 2021). To achieve the same ammonia conversion under these conditions, the reactor would need to operate at higher temperatures in other zones and may additionally require an increased length to compensate for the reduced thermal efficiency, resulting in greater overall entropy production.
To prevent catalyst deactivation, it is necessary to limit the temperature to 800 K, (Chonggen et al., 2011; Liu, 2014). It is observed that under low heat transfer constraints (
Figure 4e illustrates the relationship between pressure drop across the reactor and the maximum allowable heat flux for different design constraints. It is evident that as the maximum heat flux increases, the pressure drop across the reactor tends to decrease, leading to lower energy losses due to pressure drop and thereby minimizing this source of irreversibility. This reduction in pressure drop is achieved at the expense of an increase in reactor diameter, as shown in Figure 4f. The trend observed in Figure 4f suggests that when higher maximum heat flux per unit area is allowed (i.e., higher
As observed, a tubular reactor with constant radius (Base Case) results in high entropy production (0.14 kW/K), whereas a reactor with a monotonically increasing variable radius, achieving the same ammonia production and operating under the same allowable heat flux (5 MW/
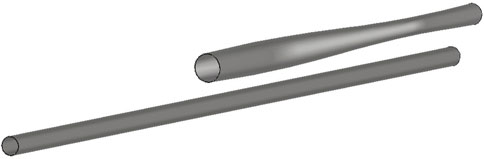
Figure 5. Ammonia reactor. Base Case geometry (
From a mechanical design perspective, variations in radius along the reactor axis, especially if pronounced, would lead to a non-uniform distribution of stresses along the reactor walls due to internal pressure. To withstand these variable stresses and the high operating pressures, high-strength materials would be necessary, along with more sophisticated manufacturing processes, such as additive manufacturing (3D printing), instead of using a simple constant-radius tube. This would require further detailed studies, both at the simulation level and through experimental prototypes.
It is well known in chemical engineering that more reversible conditions can be approached by increasing the contact area for heat exchange. Similar systematic studies on decrease in the entropy production of the chemical reactor with varying geometric variables, has not been done. That geometric variables are important is, however, beyond doubt. This opens up for new important applications of our well-proven engineering mathematical procedures.
5 Conclusions and perspectives
In this work the entropy production minimization of a tubular chemical reactor for ammonia synthesis was carried out employing gas inlet temperature, heat flux and radius variation along the reactor length as control variables. The same amount of catalyst, maximum heat flux, and ammonia production was used in a tubular base case reactor yielding maximum ammonia production.
The results indicate that an optimized reactor design with a variable-radius profile and temperature control via heat flux can achieve a 96% reduction in pressure drop and a 57% decrease in total entropy production with respect to the tubular reactor.
A sensitivity analysis enabled the identification of an optimal design with minimum entropy production, suitable for practical implementation. The optimal design has variable-radius geometry and a temperature profile below 800 K, ensuring catalyst stability. It achieves a 70% reduction in pressure drop compared to the base-case reactor and a maximum heat flux of 0.5 MW/
Future work may focus on evaluating the plug flow assumption through CFD modeling and incorporating the effect of catalytic activity into the model description. Moreover, the implementation of the optimal design and the assessment of heat transfer capabilities represent key engineering challenges, whose resolution could be essential for scaling up and validating the proposed approach in real-world applications.
Data availability statement
The original contributions presented in the study are included in the article/supplementary material, further inquiries can be directed to the corresponding author.
Author contributions
DM: Conceptualization, Data curation, Formal Analysis, Investigation, Methodology, Software, Visualization, Writing – original draft. JQ-D: Formal Analysis, Visualization, Writing – original draft, Writing – review and editing. SK: Conceptualization, Formal Analysis, Methodology, Supervision, Writing – original draft, Writing – review and editing.
Funding
The author(s) declare that financial support was received for the research and/or publication of this article. SK is grateful to the Research Council of Norway for the Center of Excellence Funding Scheme, Grant No 262644, Porelab.
Conflict of interest
The authors declare that the research was conducted in the absence of any commercial or financial relationships that could be construed as a potential conflict of interest.
Generative AI statement
The author(s) declare that no Generative AI was used in the creation of this manuscript.
Publisher’s note
All claims expressed in this article are solely those of the authors and do not necessarily represent those of their affiliated organizations, or those of the publisher, the editors and the reviewers. Any product that may be evaluated in this article, or claim that may be made by its manufacturer, is not guaranteed or endorsed by the publisher.
References
Amhamed, A. I., Shuibul Qarnain, S., Hewlett, S., Sodiq, A., Abdellatif, Y., Isaifan, R. J., et al. (2022). Ammonia production plants—a review. Fuels 3, 408–435. doi:10.3390/fuels3030026
Baddour, R., Brian, P., Logeais, B., and Eymery, J. (1965). Steady-state simulation of an ammonia synthesis converter. Chem. Eng. Sci. 20, 281–292. doi:10.1016/0009-2509(65)85017-5
Bedeaux, D., Standaert, F., Hemmes, K., and Kjelstrup, S. (1999). Optimization of processes by equipartition. J. Non-Equilibrium Thermodyn. 24, 242–259. doi:10.1515/JNETDY.1999.015
Begall, M. J., Schweidtmann, A. M., Mhamdi, A., and Mitsos, A. (2023). Geometry optimization of a continuous millireactor via cfd and bayesian optimization. Comput. and Chem. Eng. 171, 108140. doi:10.1016/j.compchemeng.2023.108140
Biegler, L. (2010). Nonlinear programming: concepts, algorithms, and applications to chemical processes. Philadelphia: Society for Industrial and Applied Mathematics.
Bynum, M. L., Hackebeil, G. A., Hart, W. E., Laird, C. D., Nicholson, B. L., Siirola, J. D., et al. (2021). Pyomo–optimization modeling in python. 67. Springer Science and Business Media.
Chai, W. S., Bao, Y., Jin, P., Tang, G., and Zhou, L. (2021). A review on ammonia, ammonia-hydrogen and ammonia-methane fuels. Renew. Sustain. Energy Rev. 147, 111254. doi:10.1016/j.rser.2021.111254
Cheema, I. I., and Krewer, U. (2019). Optimisation of the autothermal nh3 production process for power-to-ammonia. Processes 8, 38. doi:10.3390/pr8010038
Chen, J., Shapiro, V., Suresh, K., and Tsukanov, I. (2007). Shape optimization with topological changes and parametric control. Int. J. Numer. methods Eng. 71, 313–346. doi:10.1002/nme.1943
Chonggen, P., Ying, L., Huazhang, L., and Liu, H. (2011). Effects of reaction conditions on performance of Ru catalyst and iron catalyst for ammonia synthesis. Chin. J. Chem. Eng. 19, 273–277. doi:10.1016/s1004-9541(11)60165-1
Courtais, A., Latifi, A. M., Lesage, F., and Privat, Y. (2021). Shape optimization of fixed-bed reactors in process engineering. SIAM J. Appl. Math. 81, 1141–1165. doi:10.1137/20m1343841
Courtais, A., Lesage, F., Privat, Y., Pelaingre, C., and Latifi, A. M. (2023). Cfd-based geometrical shape optimization of a packed-bed reactor combining multi-objective and adjoint system methods. Chem. Eng. Sci. 275, 118728. doi:10.1016/j.ces.2023.118728
El-Shafie, M., and Kambara, S. (2023). Recent advances in ammonia synthesis technologies: toward future zero carbon emissions. Int. J. Hydrogen Energy 48, 11237–11273. doi:10.1016/j.ijhydene.2022.09.061
Erfani, N., Baharudin, L., and Watson, M. (2024). Recent advances and intensifications in haber-bosch ammonia synthesis process. Chem. Eng. Processing-Process Intensif. 204, 109962. doi:10.1016/j.cep.2024.109962
Farsi, M., Chabi, N., and Rahimpour, M. (2021). Modeling and optimization of ammonia process: effect of hydrogen unit performance on the ammonia yield. Int. J. Hydrogen Energy 46, 39011–39022. doi:10.1016/j.ijhydene.2021.09.160
Flórez-Orrego, D., and de Oliveira Junior, S. (2017a). Exergy assessment of single and dual pressure industrial ammonia synthesis units. Energy 141, 2540–2558. doi:10.1016/j.energy.2017.06.139
Flórez-Orrego, D., and de Oliveira Junior, S. (2017b). Modeling and optimization of an industrial ammonia synthesis unit: an exergy approach. Energy 137, 234–250. doi:10.1016/j.energy.2017.06.157
Ghavam, S., Vahdati, M., Wilson, I., and Styring, P. (2021). Sustainable ammonia production processes. Front. Energy Res. 9, 580808. doi:10.3389/fenrg.2021.580808
Gillespie, L. J., and Beattie, J. A. (1930). The thermodynamic treatment of chemical equilibria in systems composed of real gases. I. An approximate equation for the mass action function applied to the existing data on the haber equilibrium. Phys. Rev. 36, 743–753. doi:10.1103/PhysRev.36.743
Johannessen, E., and Kjelstrup, S. (2004). Minimum entropy production in plug flow reactors: an optimal control problem solved for so2 oxidation. Energy 29, 2403–2423. doi:10.1016/j.energy.2004.03.033
Kirova-Yordanova, Z. (2004). Exergy analysis of industrial ammonia synthesis. Energy 29, 2373–2384. doi:10.1016/j.energy.2004.03.036
Kizilova, N., Shankar, A., and Kjelstrup, S. (2024). A minimum entropy production approach to optimization of tubular chemical reactors with nature-inspired design. Energies 17, 432. doi:10.3390/en17020432
Kjelstrup, S., Bedeax, D., Johannessen, E., and Gross, J. (2010). Non-equilibrium thermodynamics for engineers. World Scientific.
Kojima, Y., and Yamaguchi, M. (2022). Ammonia as a hydrogen energy carrier. Int. J. Hydrogen Energy 47, 22832–22839. doi:10.1016/j.ijhydene.2022.05.096
Kumar, V. V., and Sharma, R. P. (2025). Entropy generation minimization in nuclear reactor cooling via rough rotating disk: a statistical approach. Multiscale Multidiscip. Model. Exp. Des. 8, 245. doi:10.1007/s41939-025-00846-8
Liu, H. (2014). Ammonia synthesis catalyst 100 years: Practice, enlightenment and challenge. Chin. J. Catal. 35, 1619–1640. doi:10.1016/S1872-2067(14)60118-2
Magnanelli, E., Solberg, S., and Kjelstrup, S. (2019). Nature-inspired geometrical design of a chemical reactor. Chem. Eng. Res. Des. 152, 20–29. doi:10.1016/j.cherd.2019.09.022
Mahapatra, S., and Dasappa, S. (2014). Influence of surface area to volume ratio of fuel particles on gasification process in a fixed bed. Energy Sustain. Dev. 19, 122–129. doi:10.1016/j.esd.2013.12.013
Månson, B., and Andresen, B. (1986). Optimal temperature profile for an ammonia reactor. Ind. Eng. Chem. Process Des. Dev. 25, 59–65. doi:10.1021/i200032a010
Meriño, F., Sauma, E., Manríquez, F., Pereira, A., and Vera, S. (2025). Long-term expansion planning of power systems considering renewable ammonia production under different scenarios for the year 2060. Int. J. Hydrogen Energy 127, 831–844. doi:10.1016/j.ijhydene.2025.03.290
Nadiri, S., Attari Moghaddam, A., Folke, J., Ruland, H., Shu, B., Fernandes, R., et al. (2024). Ammonia synthesis rate over a wide operating range: from experiments to validated kinetic models. ChemCatChem 16, e202400890. doi:10.1002/cctc.202400890
Nicholson, B., Siirola, J. D., Watson, J.-P., Zavala, V. M., and Biegler, L. T. (2017). pyomo.dae: a modeling and automatic discretization framework for optimization with differential and algebraic equations. Math. Program. Comput. 10, 187–223. doi:10.1007/s12532-017-0127-0
Nielsen, A., Kjaer, J., and Hansen, B. (1964). Rate equation and mechanism of ammonia synthesis at industrial conditions. J. Catal. 3, 68–79. doi:10.1016/0021-9517(64)90094-6
Nolasco, E., Vassiliadis, V. S., Kähm, W., Adloor, S. D., Ismaili, R. A., Conejeros, R., et al. (2021). Optimal control in chemical engineering: Past, present and future. Comput. and Chem. Eng. 155, 107528. doi:10.1016/j.compchemeng.2021.107528
Nummedal, L., Kjelstrup, S., and Costea, M. (2003). Minimizing the entropy production rate of an exothermic reactor with a constant heat-transfer coefficient: the ammonia reaction. Ind. Eng. Chem. Res. 42, 1044–1056. doi:10.1021/ie020319n
Ojelade, O. A., Zaman, S. F., and Ni, B.-J. (2023). Green ammonia production technologies: a review of practical progress. J. Environ. Manag. 342, 118348. doi:10.1016/j.jenvman.2023.118348
Penkuhn, M., and Tsatsaronis, G. (2017). Comparison of different ammonia synthesis loop configurations with the aid of advanced exergy analysis. Energy 137, 854–864. doi:10.1016/j.energy.2017.02.175
Poling, B. E., Prausnitz, J. M., and O’Connell, J. P. (2001). The properties of gases and liquids. McGraw-Hill.
Riera, J. A., Lima, R. M., and Knio, O. M. (2023). A review of hydrogen production and supply chain modeling and optimization. Int. J. Hydrogen Energy 48, 13731–13755. doi:10.1016/j.ijhydene.2022.12.242
Saffari, P. R., Salarian, H., Lohrasbi, A., and Salehi, G. (2021). Entropy generation analysis of a thermal cracking reactor. ACS omega 6, 6335–6347. doi:10.1021/acsomega.0c05937
Santoro, B. F., Rincón, D., and Mendoza, D. F. (2024). Entropy production and filling time in hydrogen refueling stations: an economic assessment. Entropy 26, 735. doi:10.3390/e26090735
Sauar, E., Nummedal, L., and Kjelstrup, S. (1999). The principle of equipartition of forces in chemical reactor design: the ammonia synthesis. Comput. and Chem. Eng. 23, S499–S502. doi:10.1016/S0098-1354(99)80123-9
Smith, C., Hill, A. K., and Torrente-Murciano, L. (2020). Current and future role of haber–bosch ammonia in a carbon-free energy landscape. Energy and Environ. Sci. 13, 331–344. doi:10.1039/c9ee02873k
Tondeur, D., and Kvaalen, E. (1987). Equipartition of entropy production. an optimality criterion for transfer and separation processes. Industrial and Eng. Chem. Res. 26, 50–56. doi:10.1021/ie00061a010
Xie, T., Xia, S., and Wang, C. (2022). Multi-objective optimization of braun-type exothermic reactor for ammonia synthesis. Entropy 24, 52. doi:10.3390/e24010052
Keywords: entropy production, ammonia reactor, Haber-bosch process, heat transfer, geometric design
Citation: Mendoza DF, Quintero-Díaz JC and Kjelstrup S (2025) Entropy production minimization in a tubular ammonia synthesis reactor: a mathematical optimization approach with variable geometry and heat flux control. Front. Energy Res. 13:1654095. doi: 10.3389/fenrg.2025.1654095
Received: 25 June 2025; Accepted: 30 July 2025;
Published: 20 August 2025.
Edited by:
Athanasios I. Papadopoulos, Centre for Research and Technology Hellas (CERTH), GreeceReviewed by:
Solmaz Nadiri, Physical-Technical Federal Institute, GermanyVinay Kumar V., National Institute of Technology, India
Copyright © 2025 Mendoza, Quintero-Díaz and Kjelstrup. This is an open-access article distributed under the terms of the Creative Commons Attribution License (CC BY). The use, distribution or reproduction in other forums is permitted, provided the original author(s) and the copyright owner(s) are credited and that the original publication in this journal is cited, in accordance with accepted academic practice. No use, distribution or reproduction is permitted which does not comply with these terms.
*Correspondence: Signe Kjelstrup, c2lnbmUua2plbHN0cnVwQG50bnUubm8=