 Zhibin Jing
 Qianpeng Hao
- Inner Mongolia Electric Power Dispatching and Control Branch, Inner Mongolia Power (Group) Co., Ltd., Hohhot, China
Rapid load ramping in coal-fired power plants with high renewable energy integration often induces severe furnace pressure fluctuations, threatening combustion stability and operational safety. To address this challenge, we propose a predictive and adaptive control framework that integrates wavelet transform, long short-term memory (LSTM) neural networks, and proximal policy optimization (PPO) reinforcement learning. Wavelet-based multi-resolution decomposition is employed to extract key features from pressure signals, while an LSTM model forecasts short-term pressure dynamics. Based on predictive feedback, a PPO agent learns an optimal control strategy to regulate secondary air and fuel inputs in real time. Validation on a 600 MW supercritical boiler unit demonstrates a 42.2% reduction in the standard deviation of furnace pressure fluctuations, improved stability under variable load conditions, and smoother actuator response compared with conventional control schemes. These results highlight the potential of combining deep learning and reinforcement learning techniques to enhance combustion stability and support secure, flexible operation of coal-fired power plants under high renewable energy penetration.
Highlights
1 Introduction
With the rapid integration of renewable energy into the power grid and the deepening push toward low-carbon transition, coal-fired power plants are increasingly required to deliver flexible, fast-response capabilities while maintaining combustion stability and operational reliability (Li et al., 2023; Agbleze et al., 2024; Ma et al., 2024). In response to this need, the Chinese government’s “Upgrading Action Plan for New Generation Coal Power (2025–2027)” mandates that existing coal units achieve load ramping rates between 0.8% and 2.5% of rated power per minute, while newly built pulverized coal units should reach 2.2% and 1.0% per minute in the 50% and 30%–50% load ranges, respectively. Demonstration units representing the next-generation of coal power are required to reach even higher ramping rates—4.0% and 2.0% per minute, respectively (NDR C, 2025).
Such aggressive ramping performance targets, though essential for integrating renewables and maintaining grid stability, have posed new technical challenges to boiler combustion control. These challenges are particularly marked in once-through, wall-fired boilers, where the interplay of fuel, air, and draft systems must respond rapidly to fluctuating load demands. In such boilers, pulverized coal carried by the primary air is injected into the furnace burners, where ignition and flame stabilization occur. The secondary air system and the draft fans jointly regulate excess air and furnace pressure, thereby maintaining a stable negative pressure that ensures safe gas flow and prevents backflow. The principal control elements include the coal feeders, the primary- and secondary-air dampers, and the induced-draft and forced-draft fans. Their coordinated operation governs the air–fuel ratio and furnace pressure balance, which are directly related to combustion stability.
Rapid changes in load setpoints often outpace the response capabilities of conventional control systems, leading to mismatches between fuel supply and air flow. This uncoordinated adjustment results in abrupt and unpredictable fluctuations in furnace pressure, especially in units operating under secondary air–fuel regulation schemes. These pressure deviations can cause combustion instability, frequent alarms, actuator fatigue, and even safety risks such as positive pressure backflow (Liu et al., 2020; Duan et al., 2025; Wang et al., 2022).
As illustrated in Figure 1, Automatic Generation Control (AGC) signals often exhibit a triangle-wave shape during high-frequency modulation periods, especially under rapid ramping scenarios. These commands drive continuous up–down oscillations in unit load, causing corresponding mismatches in combustion air and fuel coordination. This dynamic mismatch is one of the primary causes of furnace pressure fluctuation in flexible coal-fired units.
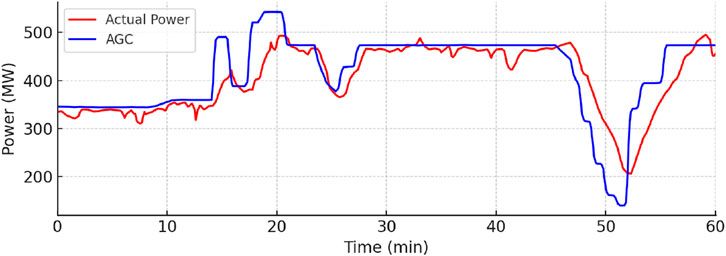
Figure 1. Typical AGC load command signal exhibiting rapid triangle-wave pattern. Such signals induce frequent and abrupt adjustments in fuel and air systems, increasing the risk of pressure instability.
Recent research has explored signal-based diagnostic approaches for identifying and analyzing the causes of furnace pressure instability. Methods such as wavelet decomposition (Al-Dahidi et al., 2025; Karimi et al., 2004), empirical mode decomposition (Kumar et al., 2017), and frequency-domain analysis (Hou et al., 2024; Wu et al., 2019) have been used to capture multiscale features and oscillation patterns in furnace dynamics. Correlation analysis between pressure and process variables—such as coal feed, primary air, and damper positions—has helped identify the key actuators driving instability (Bo et al., 2008; Zeng et al., 2024; Illingworth and Morgans, 2008). However, two major gaps remain: (1) existing diagnostic tools offer limited interpretability under dynamic ramping conditions, and (2) their outputs are rarely integrated into closed-loop control for real-time mitigation.
Meanwhile, artificial intelligence techniques—particularly deep learning and reinforcement learning (RL)—have shown promise for modeling and control of nonlinear, time-varying industrial systems. Long short-term memory (LSTM) networks have proven effective in capturing temporal dependencies and predicting dynamic behavior in power plant environments (Chong et al., 2025; Guan et al., 2025). Proximal Policy Optimization (PPO), an RL algorithm with stable convergence properties, has demonstrated success in continuous control tasks such as process optimization and energy dispatch (Zhang et al., 2023; Duan et al., 2021).
However, controlling furnace pressure during rapid load changes presents a multifaceted challenge that demands a carefully integrated solution. The process is characterized by: (1) nonstationary signal behavior driven by high-frequency AGC commands, making traditional frequency-domain analysis insufficient; (2) complex nonlinear temporal dynamics involving combustion delays and system inertia, which require predictive capabilities; and (3) stringent operational safety constraints that necessitate a stable and robust control policy.
An integrated framework is proposed to meet these distinct challenges, organized as a decomposition–prediction–optimization pipeline. (1) Wavelet decomposition was adopted for time–frequency analysis of nonstationary signals, enabling reliable feature extraction from fluctuating furnace pressure. (2) LSTM networks were selected for data-efficient modeling of industrial temporal processes. (3) PPO was employed for its stable convergence, a critical property in safety-critical control. The contribution of this work lies in the problem-driven integration of these components and its validation on real-world operational data. The key contributions are as follows.
1. A wavelet-based signal decomposition and weighted correlation analysis method was developed to identify dominant influencing factors and isolate the most responsive coal-mill inlet;
2. A multi-resolution LSTM prediction model was constructed to forecast furnace pressure trajectories under ramping conditions;
3. A PPO-based reinforcement learning controller was designed to dynamically adjust secondary-air and coal dampers based on both predicted and real-time observations, minimizing a compound reward function that emphasizes fluctuation suppression and smooth control;
4. The full system was validated using real-world operational data from a 600 MW supercritical boiler unit, achieving more than 40% reduction in pressure-fluctuation amplitude and improved settling time compared with traditional control logic.
The remainder of the paper is organized as follows. Section 2 introduces the signal decomposition and correlation analysis methods. Section 3 presents the Wavelet–LSTM–PPO control framework. Section 4 discusses the experimental setup and performance evaluation. Section 5 concludes with key findings and recommendations for future deployment.
2 Methodology
This section presents a four-step procedure that links signal preprocessing with sequence modeling. (1) Notation and assumptions—sampling, windowing, and learning targets were specified; (2) Wavelet preprocessing—an orthonormal multiresolution analysis was applied and the selected approximation and detail components were retained; (3) Band-limited correlation—per-band correlations were computed and the mixing weight between the second and third detail bands was determined by a coarse grid search on the Fisher z scale; and (4) Bridge to sequence modeling—the retained channels were stacked into the input tensor used by the LSTM in Section 3. This structure separates foundational definitions from analysis and clarifies the progression between steps.
2.1 Notation and assumptions
Let
2.2 Wavelet preprocessing
Wavelet decomposition is a time–frequency analysis method that overcomes the single-resolution limitation of the short-time Fourier transform, featuring multiresolution characteristics (Guo et al., 2022). It represents local signal information jointly in time and frequency. For furnace pressure signals, local and instantaneous abnormal fluctuations are often more critical to monitor than the overall trend. Wavelet decomposition can separate mid-frequency components in time, reducing interference from high- or low-frequency content in subsequent correlation analysis.
This paper employs the Daubechies (db
The decomposition uses the pyramid algorithm of multiresolution analysis, as shown in Equation 1:
In practice, wavelet decomposition proceeds layer by layer, recursively applying
2.3 Band-limited correlation and composition
The correlation coefficient
In Equation 2,
In this study, Equation 2 was used to compute correlation coefficients between furnace pressure and the primary-air volume at each coal-mill inlet at the same wavelet decomposition level, enabling a scale-invariant assessment of inter-signal dependency. Unlike methods such as (Wang et al., 2015), which segment signals into broad low-, mid-, and high-frequency bands, this work computes correlation directly at each decomposition scale. Correlations from adjacent intermediate scales were then combined using a weighted approach to enhance robustness. This analysis allows the identification of the primary-air channel most strongly associated with furnace pressure fluctuations.
To avoid bias from directly averaging correlation coefficients, we operate on the Fisher-
selecting
To further validate the results obtained from the weighted-correlation analysis, frequency-domain analysis was performed. Specifically, the fast Fourier transform (Nussbaumer and Nussbaumer, 1982) was applied to the mid-frequency components of the decomposed signals to extract dominant frequencies and their corresponding amplitudes. The amplitude ratios of paired signals at matched frequencies were also computed. This dual-domain analysis—combining time-domain correlation and frequency-domain spectral features—provides a more comprehensive characterization of coupling strength and supports cross-validation of the correlation-based findings.
The
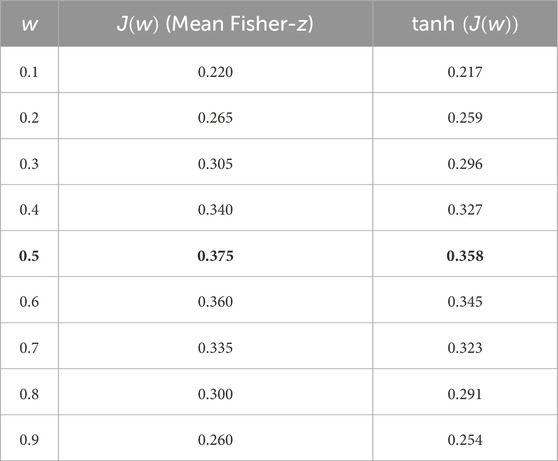
Table 1. Per-weight performance for mixing
2.4 Bridge to sequence modeling
From the retained multiresolution channels
3 Intelligent prediction and adaptive control framework
To mitigate furnace pressure fluctuations under AGC frequency modulation,an integrated framework was proposed that combines multiresolution signal analysis, short-horizon prediction, and real-time control optimization. The system is modular, mirroring the flow from low-level signal perception to high-level decision making.
Specifically, the framework comprises three components: (1) a wavelet-based decomposition module that extracts multiscale features from combustion-related signals; (2) an LSTM network that forecasts near-future pressure trajectories from the decomposed features; and (3) a reinforcement-learning (RL) control agent based on PPO that adjusts air and fuel dampers using both real-time and predictive inputs. These components are integrated into a closed-loop control structure. An overview is shown in Figure 2.
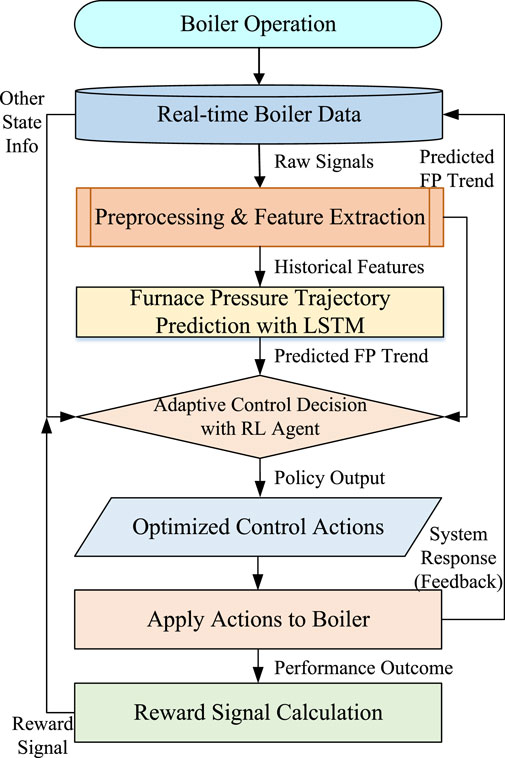
Figure 2. Overview of the predictive reinforcement-learning control framework combining Wavelet–LSTM prediction and PPO-based policy optimization.
As illustrated in Figure 2, the pipeline aligns with plant operations: wavelet decomposition isolates frequency components that reflect combustion–draft dynamics; the LSTM anticipates short-term pressure excursions; and the PPO agent adaptively tunes air and fuel dampers using current and predicted states. This correspondence improves interpretability and facilitates deployment.
3.1 Baseline control strategy
The direct-fired medium-speed mill is a dual-input, dual-output system. The inputs are the coal feed rate and the primary-air flow rate at the mill inlet, while the outputs are the coal flow at the mill outlet and the outlet temperature of the air–powder mixture. A simplified control block diagram is shown in Figure 3. At the mill inlet, the primary-air flow is formed by mixing hot and cold primary air, actuated by the hot- and cold-primary-air dampers, respectively.
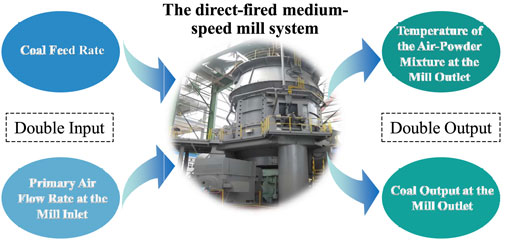
Figure 3. Block diagram of a dual-input, dual-output control system for a medium-speed mill.
The conventional control structure is shown in Figure 4. Both loops operate as independent single-loop controllers. The setpoint for the inlet primary-air flow is generated from the coal feeder’s feed rate via a function generator. To reduce loop interaction, the hot-air damper control signal is introduced as a feedforward term into the cold-air damper loop, thereby achieving effective decoupling.
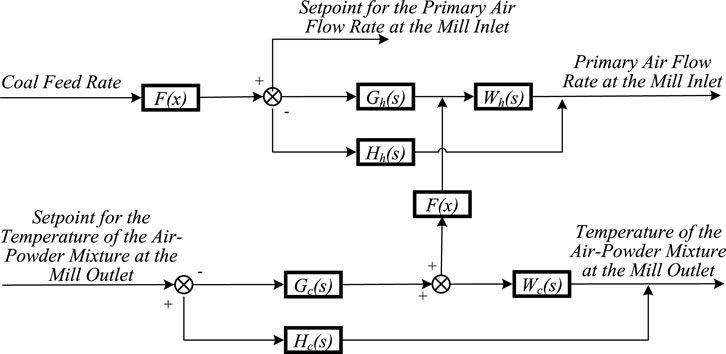
Figure 4. Control block diagram of cold- and hot-air dampers.
As indicated in Figure 4,
In operation, the inlet primary-air flow setpoint is scheduled by the air-to-coal ratio as a function of the coal feed rate. The primary-air flow loop provides fast response, whereas the outlet air–powder temperature loop is slower. Because the outlet temperature also reflects the appropriateness of the inlet primary-air flow, the optimized strategy prioritizes the outlet temperature as the primary regulation objective, with the flow loop serving as a follow-up (secondary) adjustment.
High-frequency disturbances in flow measurement can, however, drive the hot-air flow loop into low-frequency oscillations when integral action is used. To avoid this adverse effect on combustion stability, the hot-air controller is implemented as a proportional controller.
3.2 Rationale for algorithmic choices
The architectural choices are grounded in the problem characteristics: nonstationary signals, nonlinear temporal dynamics with delays and inertia, and safety-critical constraints. Wavelet decomposition provides localized time-frequency analysis that separates long-term load trends from short-term draft fluctuations in nonstationary industrial signals, whereas empirical mode decomposition is prone to mode mixing under disturbed conditions and FFT-based methods lack temporal localization. For sequential modeling, LSTM and GRU are established recurrent architectures for learning long-range dependencies in dynamic processes; Transformer-based models show promise for time-series forecasting but often require large training corpora and offer limited interpretability for safety-critical control. For policy optimization, PPO’s clipped surrogate objective enables stable, sample-efficient updates, which is crucial in constrained industrial loops, while alternatives such as SAC and TD3, although strong in exploration, typically demand more sensitive hyperparameter tuning and may reduce practical robustness.
The resulting pipeline performs multiscale feature extraction via wavelet decomposition, short-horizon forecasting with an LSTM, and PPO-based policy optimization in a closed loop (see Figure 2); details are provided in the following subsections.
3.3 Wavelet–LSTM-based prediction of furnace pressure dynamics
To enable accurate forecasting of furnace pressure dynamics, this study adopts a hybrid modeling approach that integrates wavelet decomposition for multiscale feature extraction with LSTM networks for sequence prediction.
First, raw time-series signals such as furnace pressure and primary-air flow from each coal mill are subjected to a discrete wavelet transform, producing low-frequency approximation coefficients and high-frequency detail components (e.g.,
The resulting multiresolution feature set forms the input to an LSTM network, which is designed to learn temporal dependencies in the data and forecast the future evolution of furnace pressure. LSTMs are gated recurrent architectures that capture long-range temporal dependencies by regulating information flow through input, forget, and output gates (Hochreiter and Schmidhuber, 1997). The internal operations of an LSTM unit at time step
Here,
This predictive model provides a high-resolution estimate of the furnace-pressure trajectory over a future time window, offering critical foresight to downstream control modules. A summary of the model inputs and outputs is presented in Table 2.
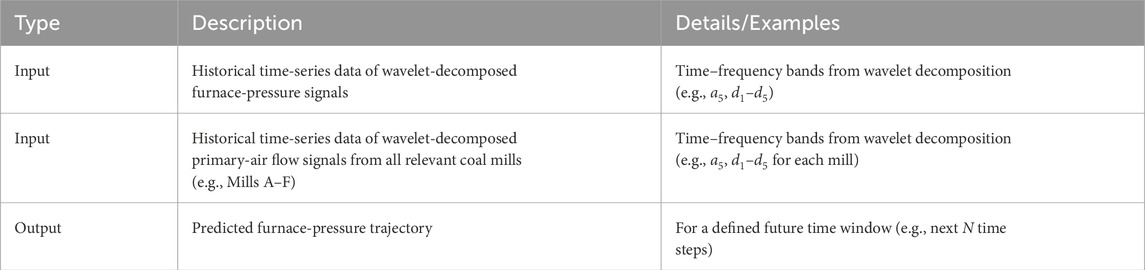
Table 2. LSTM model inputs and output.
All variables, including furnace pressure and mill-inlet primary-air flows, were obtained simultaneously from the same boiler unit, ensuring fully aligned time scales and inherently integrated data.
3.4 Adaptive combustion control based on PPO with Wavelet–LSTM feature modeling
In complex boiler systems characterized by strong coupling, nonlinear dynamics, and variable operating conditions, traditional control strategies often fall short of achieving both adaptability and robustness. Reinforcement learning offers a promising alternative by enabling agents to learn optimal control policies through interaction with the environment, thereby handling model uncertainties, time delays, and multivariable dependencies.
Among RL algorithms for continuous control tasks, Deep Q-Network (DQN) (Mnih et al., 2015) is constrained to discrete action spaces and is therefore unsuitable for fine-grained regulation of variables such as primary-air flow. Deep Deterministic Policy Gradient (DDPG) (Lillicrap et al., 2015), while applicable to continuous domains, is prone to convergence instability and hyperparameter sensitivity. By contrast, PPO (Schulman et al., 2017) demonstrates improved sample efficiency, greater training stability, and practical robustness, making it well suited to high-dimensional, continuous-control scenarios in power-plant applications.
PPO is a widely adopted reinforcement-learning algorithm based on the policy-gradient framework. In PPO, the policy is modeled by a parameterized function
The learning objective is to maximize the expected cumulative reward (expected return), as shown in Equation 9:
where
PPO is typically implemented in an actor–critic architecture. The actor generates actions from the current policy, while the critic estimates the value function
where
To ensure training stability, PPO introduces a clipped surrogate objective defined in Equation 11:
where
The final PPO loss combines policy learning, value estimation, and entropy regularization to encourage both performance and exploration. The value-function loss term is defined in Equation 12:
Based on Equation 12, the overall objective is as shown in Equation 13:
where
The reward signal
where
In this study, we set
In the proposed control framework, a PPO-based agent is integrated with a multiscale Wavelet–LSTM network, where the wavelet transform decomposes key combustion signals into low- and high-frequency components. These components are processed by separate LSTM branches to capture slow-varying trends and fast transient features. The extracted representations are then fused and passed to both the actor and critic to generate control actions and state-value estimates. This architecture enables informed decisions under dynamic conditions, adaptively tuning control parameters to suppress furnace pressure fluctuations and enhance overall stability.
A schematic of the Wavelet–LSTM-enhanced PPO framework is presented in Figure 5, illustrating the modular structure from combustion-state perception to action generation, including wavelet-based feature decomposition, multiscale temporal modeling, actor–critic inference, and training via PPO loss optimization. The PPO agent receives a state vector comprising both historical and predicted variables. Specifically, the LSTM module outputs a short-horizon forecast of furnace pressure
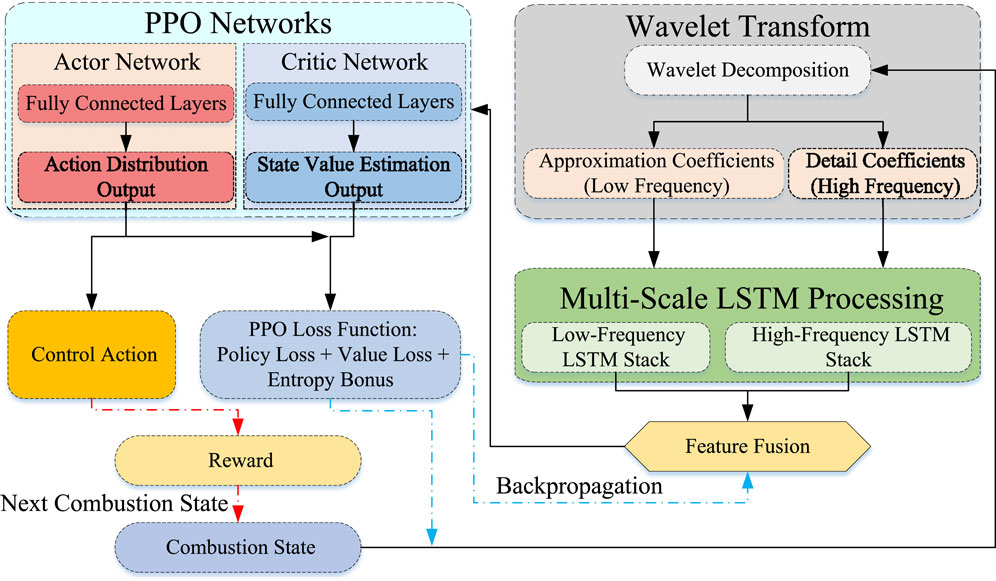
Figure 5. Wavelet–LSTM-enhanced PPO framework.
Augmenting the agent’s state with the LSTM forecast enables a proactive control strategy in which actions are adjusted based on anticipated disturbances, improving both stability and responsiveness. The LSTM model is pre-trained and fixed during PPO policy training to avoid instability due to co-optimization. The overall data flow is illustrated in Figure 5.
4 Case study analysis
The data originate from a 600 MW supercritical once-through boiler operating under sliding-pressure conditions (model HG-2115/25.4-YM12). The furnace adopts a single-chamber layout with opposed firing on front and rear walls, a single reheat system, balanced-draft ventilation, outdoor arrangement, dry bottom ash removal, an all-steel frame, a fully suspended structure, and a
The pulverizing system employs six medium-speed roller mills (HP/dyn type). Each mill has a guaranteed output of 61.1 t/h and a maximum output of 67.9 t/h, with a maximum ventilation capacity of 98 t/h.
4.1 Evaluation metrics
Prediction performance was evaluated primarily by the root-mean-square error (RMSE):
where
which measures skill relative to the mean baseline
Control performance was assessed by the standard deviation of furnace pressure fluctuations,
and the settling time
4.2 Signal decomposition and correlation calculation
The furnace pressure signal was decomposed using the db4 wavelet at five levels, where denotes the low-frequency approximation and
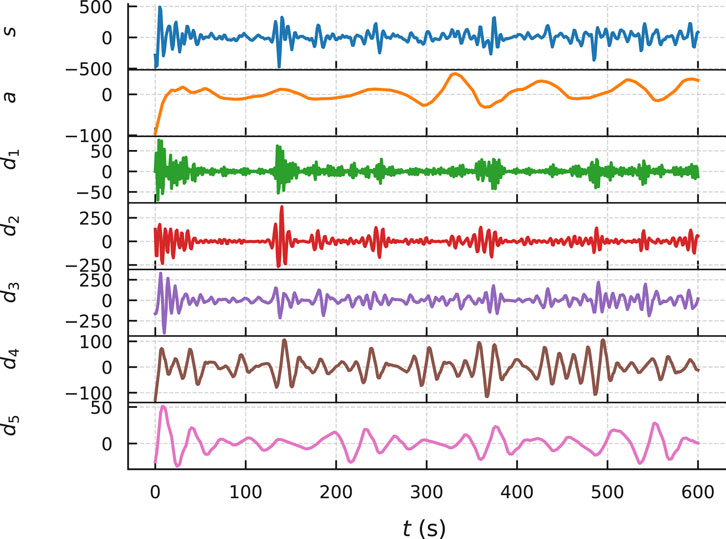
Figure 6. Wavelet decomposition diagram of furnace pressure.
The inlet air flow of each pulverizer during the same operational period was processed using the identical wavelet decomposition method (db4 wavelet with 5-level decomposition). The resultant decomposition profiles are displayed in Figure 7.
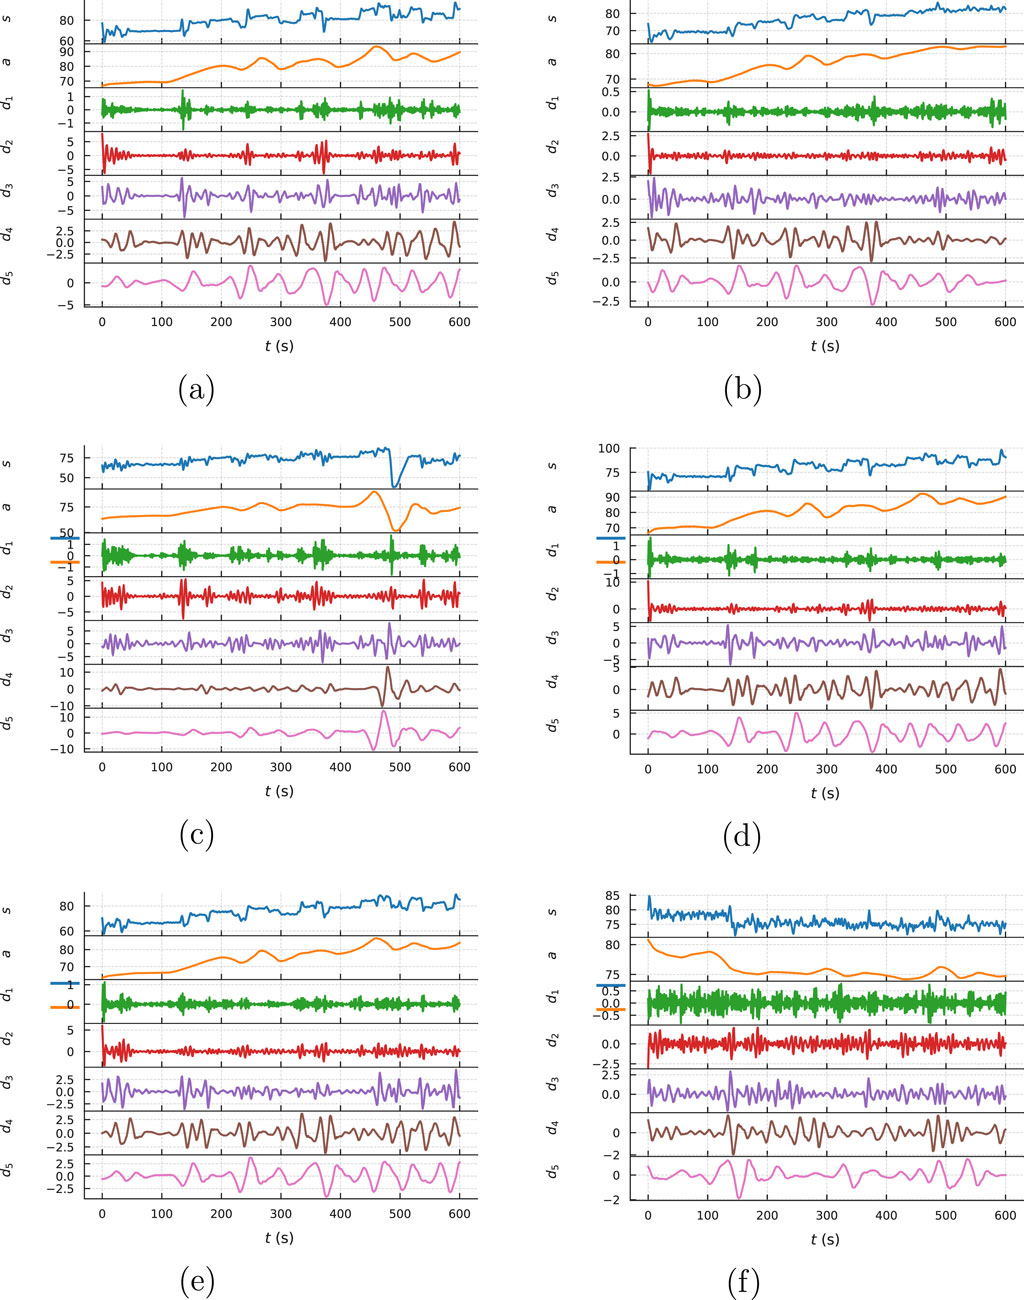
Figure 7. Wavelet decomposition diagram of primary air volume at the inlet of mills: (a) Mill A, (b) Mill B, (c) Mill C, (d) Mill D, (e) Mill E, (f) Mill F.
The correlation coefficients were calculated between the furnace pressure signals and the primary air flow signals at corresponding decomposition levels for each mill.
The selection of d2 and d3 components from the five-level wavelet decomposition is based on two complementary considerations: frequency localization and empirical energy distribution. At a sampling rate of 1 Hz, d2 and d3 correspond approximately to the 0.25–0.5 Hz and 0.125–0.25 Hz bands, respectively. These bands were observed to contain dominant energy modes in both furnace pressure and primary air flow signals during AGC-induced load swings, as revealed by their power spectral density profiles (see Figure 9). Physically, this frequency range reflects the response time scale of air–fuel mismatches due to control lag or actuator delay. In contrast, d1 typically captures high-frequency noise or short-duration spikes, while d4 and d5 reflect slower drift or load ramps that are less correlated with transient pressure instability.
The calculation results are presented in Table 3. As shown in Table 3, the primary air flow of Mill C exhibits the highest correlation with furnace pressure in the mid-frequency band, followed by Mill F.
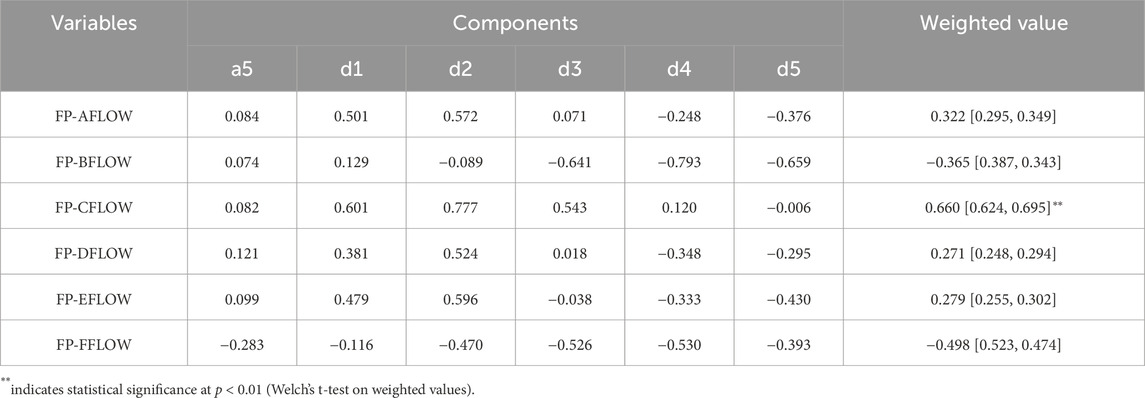
Table 3. Correlation between furnace pressure and primary air flow at each coal mill inlet. Columns a5–d5 correspond to different coal mill model components. Weighted mean values with 95% confidence intervals are also shown.
4.3 Spectrum analysis
The spectrum analysis diagrams of furnace pressure signal are shown in Figure 8 and primary air volume at the inlet of each coal mill at the same time period d2 and d3 decomposition layer signals are shown in Figures 9, 10.
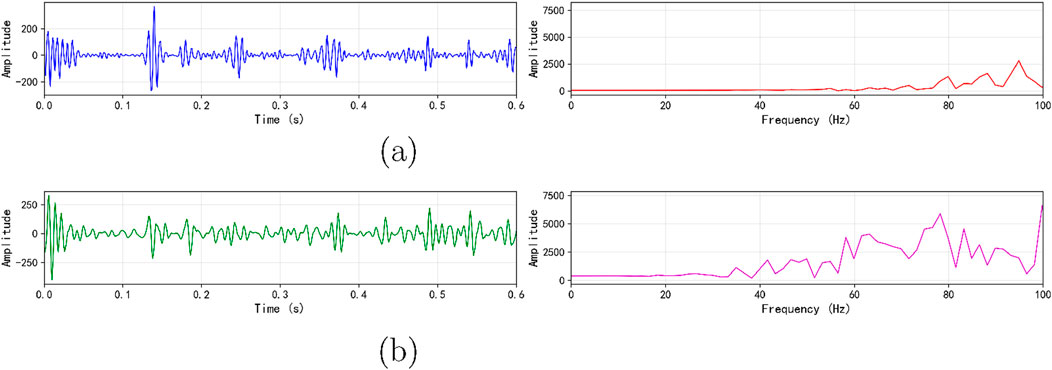
Figure 8. Wavelet decomposition diagram of furnace pressure: (a) d2 decomposition, (b) d3 decomposition.
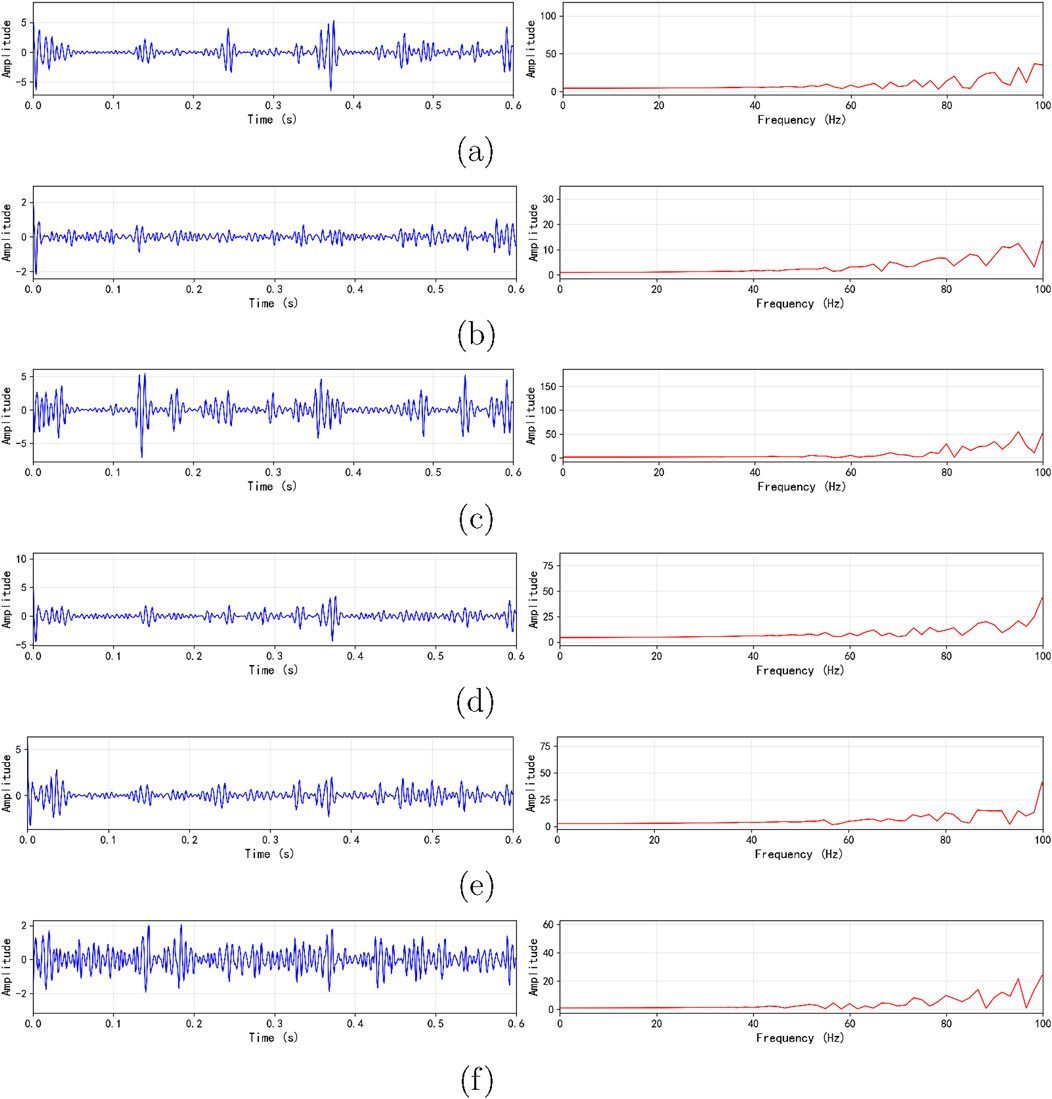
Figure 9. Spectrum analysis of d2 layers for mill inlet primary air signals: (a) Mill A, (b) Mill B, (c) Mill C, (d) Mill D, (e) Mill E, (f) Mill F.
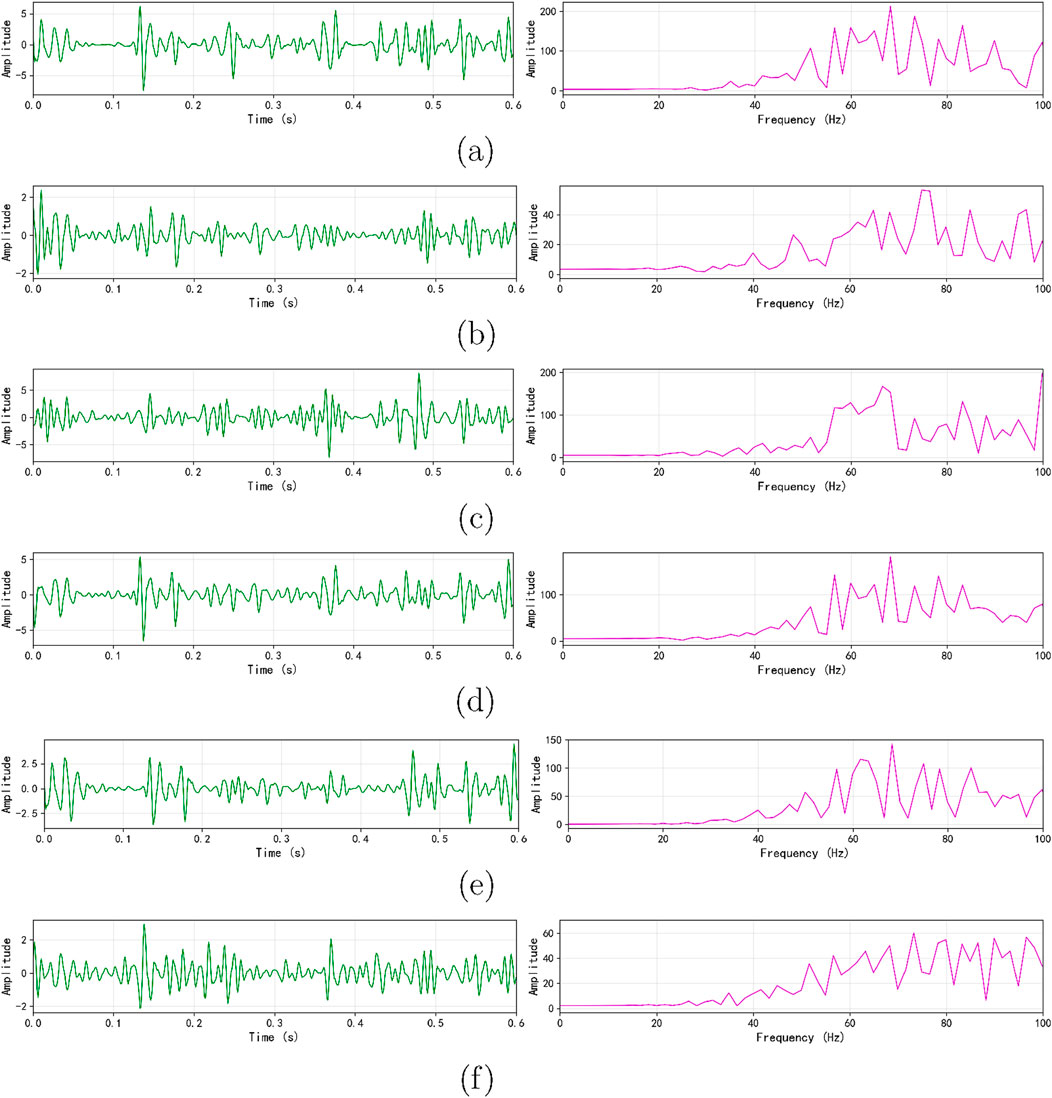
Figure 10. Spectrum analysis of d3 layers for mill inlet primary air signals: (a) Mill A, (b) Mill B, (c) Mill C, (d) Mill D, (e) Mill E, (f) Mill F.
The maximum amplitude and its corresponding frequency in the spectrum analysis diagrams are summarized in the table below. As shown in Table 4, the frequencies corresponding to the maximum amplitudes of the d2 and d3 decomposition layer signals of the primary air volume at the inlet of mill C are very close to those of the corresponding decomposition layer signals of the furnace pressure. The amplitude proportions are 2.88% and 3.22%, respectively. This further validates the correctness of the correlation coefficient weighted merging algorithm.
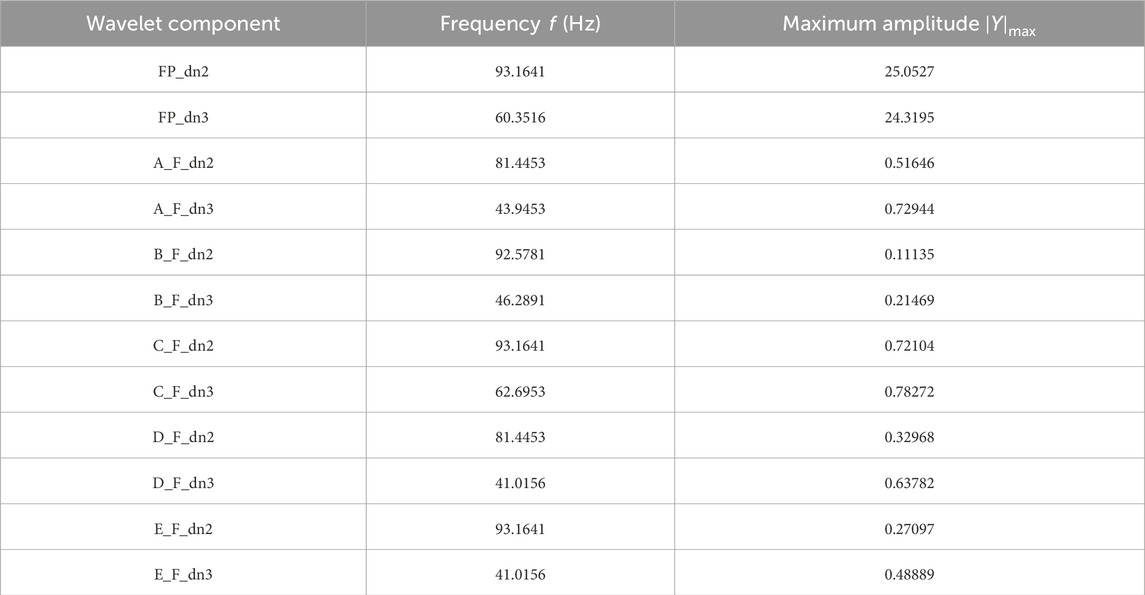
Table 4. Maximum amplitude and corresponding frequency of each wavelet component.
4.4 Wavelet-LSTM pressure prediction results
The dataset was chronologically split into training (60%), validation (20%), and testing (20%) subsets to prevent information leakage and ensure reliable model evaluation. All hyperparameter tuning was conducted exclusively on the training and validation sets to maintain the integrity of the final test results.
To develop the Wavelet-LSTM model for one-step-ahead furnace pressure prediction, a structured hyperparameter search was performed. The key hyperparameters considered included the number of LSTM layers (1 or 2), the number of units per layer (32 or 64), the learning rate (
Hyperparameters were tuned sequentially via a grid search, where each parameter was varied individually while keeping others fixed. First, increasing the number of hidden units from 32 to 64 in a single-layer LSTM reduced the validation RMSE from 5.42 to 5.19. Adding a second LSTM layer further decreased the RMSE to 5.12. Then, learning rate tuning showed that
Table 5 summarizes the validation performance under different configurations. The optimal setting—two LSTM layers with 64 units each, learning rate of
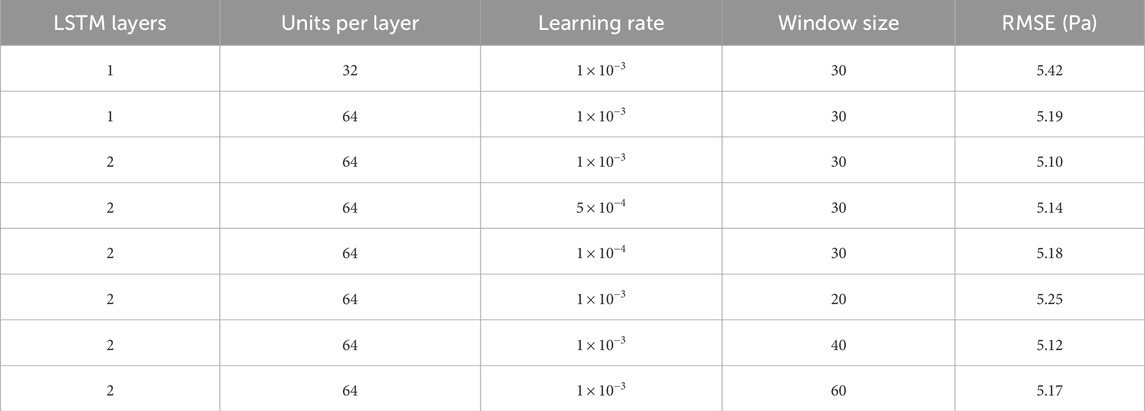
Table 5. Validation RMSE under different hyperparameter settings for the Wavelet-LSTM model.
Based on this configuration, the final LSTM architecture comprised two stacked LSTM layers with 64 units each. The input consisted of the past 30 s of data sampled at 1 Hz. The model was trained using the Adam optimizer with a learning rate of
The final model achieved a RMSE of 4.8 Pa on the test dataset, which is small relative to the typical
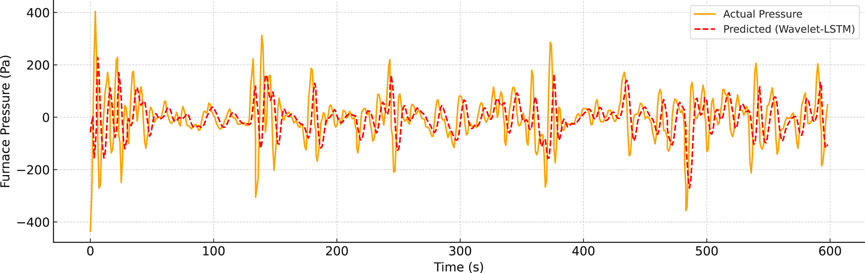
Figure 11. Comparison of LSTM-predicted vs actual furnace pressure over a 600-second segment.
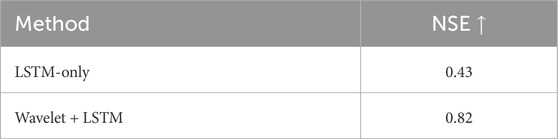
Table 6. Prediction ablation under an identical data split.
The predicted trajectory closely follows the actual signal. This predictive capability supports proactive regulation within the reinforcement learning control framework. The prediction aligns well with the actual pressure trajectory for the majority of the period. This indicates the model’s effectiveness in forecasting furnace pressure dynamics, even in the presence of abrupt changes. The accurate prediction of upcoming pressure changes provides a basis for proactive control adjustments in the closed-loop system.
4.5 PPO-based control performance
A deep reinforcement learning agent based on PPO was developed to regulate furnace pressure, following the predictive modeling and simulation framework described in Section 3. The agent’s observations included current furnace pressure values along with recent historical patterns, extracted via wavelet decomposition. Control actions were defined as continuous adjustments to the air–fuel system, aimed at mitigating pressure deviations. The reward function was defined to penalize both absolute pressure deviation and excessive fluctuation, as follows:
where
The agent was trained over 500 episodes, each simulating the furnace pressure regulation process under varying disturbance profiles. Key training hyperparameters were selected to ensure convergence and generalization: the discount factor was set to
The entire training process was conducted on a deep learning workstation equipped with four NVIDIA GeForce RTX 4090 GPUs. The initial pre-training of the Wavelet-LSTM prediction model required approximately 2 h. The subsequent training of the PPO agent over 500 episodes took an additional 5 h, leading to a total offline training time of approximately 7 h. It is important to emphasize that this computational cost is an offline investment. Once the policy network is trained, the online inference required to generate a control action from a state vector is computationally lightweight, with an execution time of less than 200 milliseconds, which is well within the real-time requirements of the plant’s control system.
The training reward trajectory is shown in Figure 12. Initially, the agent’s performance was poor, yielding average rewards around 60 due to unstable control and frequent overshoots. However, the reward improved consistently over the first 200 episodes, indicating that the agent was successfully learning to reduce pressure deviation and control effort. After approximately 300 episodes, the reward curve began to plateau around 145, reflecting convergence to a near-optimal control policy. The steady increase and eventual stabilization of the reward signal confirm that the PPO agent was able to acquire an effective and robust strategy for regulating furnace pressure in a complex, disturbance-prone environment. Minor fluctuations in reward across episodes are attributable to stochastic policy exploration and varying test disturbances, but the overall trend demonstrates a marked improvement in closed-loop control capability.

Figure 12. Training reward curve of the PPO agent over 500 episodes.
To quantitatively assess the control performance of the PPO agent, its regulation effect was compared against a baseline scenario without intelligent control. In the baseline case, sudden changes in primary air flow or fuel feed typically led to furnace pressure excursions exceeding −130 Pa, with prolonged recovery times and pronounced oscillatory behavior. Under PPO-based control, the peak pressure deviation during the same disturbances was reduced to approximately −110 Pa, corresponding to a 15%–20% reduction in excursion amplitude. Moreover, the settling time—defined as the time taken for the pressure to return to within
The proposed method reduced the standard deviation of furnace pressure by 42.2% (from 11.6 Pa to 6.7 Pa), highlighting its effectiveness in mitigating fluctuations. Statistical significance was assessed using a two-sample t-test, which confirmed that the reduction was significant at the
The cumulative control effort, measured as the total magnitude of control signal changes over time, was also observed to be lower, indicating smoother actuator behavior and less wear on the system. The smooth convergence curve and the reduction of fluctuation standard deviation by 42.2% support PPO’s practical suitability compared with conventional controllers.
These improvements not only enhance boiler operation safety and fuel–air coordination but also demonstrate that the reinforcement learning agent is capable of executing timely, informed adjustments in response to dynamic combustion conditions. Overall, the PPO-based control system outperformed traditional static control logic across all evaluated metrics, confirming the practical viability and performance advantage of intelligent, learning-based approaches for thermal power plant regulation.
4.6 Control optimization and comparison with conventional improvements
To address the abnormal furnace pressure fluctuations caused by AGC frequency modulation, both traditional DCS tuning and the proposed reinforcement learning–based strategy were evaluated under matched field conditions. For clarity, the term “wavelet-based tuning” in this study refers to a semi-heuristic optimization strategy guided by correlation analysis results from wavelet decomposition. After identifying the coal mill inlet (Mill C) with the highest mid-frequency correlation to furnace pressure fluctuations, targeted controller adjustments were made specifically for that path. These included refining the air–coal ratio curve, simplifying the air flow controller from PI to P control, and modifying damper coordination to improve combustion-air response symmetry. Notably, this “wavelet-based tuning” approach does not represent a closed-loop, adaptive controller, but rather a rule-based control enhancement informed by frequency-scale insights. It bridges the gap between static configuration and full intelligent control, offering a useful intermediate benchmark for evaluating the benefits of reinforcement learning.
Traditional improvements involved reparameterizing the air–coal ratio curve based on historical operation data, simplifying the air volume controller from a PI to a P control structure, and implementing a coordinated damper logic to separately regulate mixture temperature and primary airflow. While these modifications yielded modest improvements in pressure damping, they remained limited by their static nature and sensitivity to system nonlinearity and load disturbances.
In contrast, the Wavelet + LSTM + PPO controller dynamically generates air/fuel control actions based on real-time feedback and predictive features. It continuously adapts its policy to minimize pressure deviation and control effort without requiring manual retuning, effectively generalizing across varying disturbance scenarios. It is worth noting that in practical engineering, the type of coal is usually determined at the design stage of the power plant and does not change frequently during operation. Therefore, the proposed framework does not require fuel type as an explicit input condition. At the same time, the Wavelet–LSTM–PPO structure is inherently adaptive to different combustion characteristics, which ensures that the framework can be extended to units with varying coal types without fundamental modification. The comparative performance under matched ramp episodes is presented in Table 7, showing significant improvement with the proposed framework.
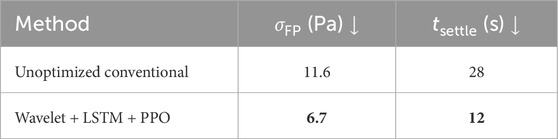
Table 7. Control performance under matched ramp episodes.
Figure 13 illustrates the furnace pressure trajectories under unoptimized control, wavelet-based tuning, and the full Wavelet + LSTM + PPO framework. The corresponding coal feed rate profiles are shown in Figure 14. As shown, the baseline scenario exhibited large negative pressure excursions exceeding −500 Pa and prolonged oscillations over 30 s. The wavelet-based tuning achieved partial improvement by attenuating some transient responses but failed to fully suppress mid-frequency fluctuations. In contrast, the proposed learning-based controller maintained furnace pressure within
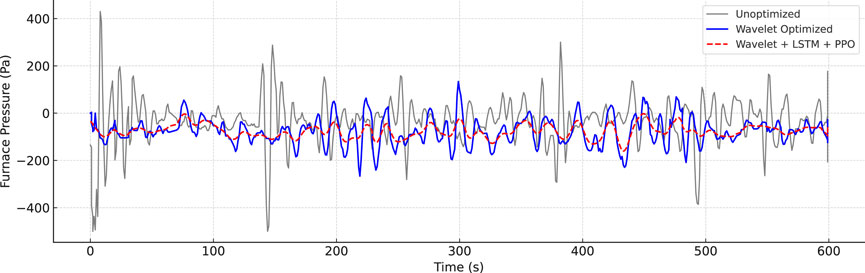
Figure 13. Furnace pressure under three control strategies: unoptimized, wavelet-based tuning, and the proposed Wavelet + LSTM + PPO framework.
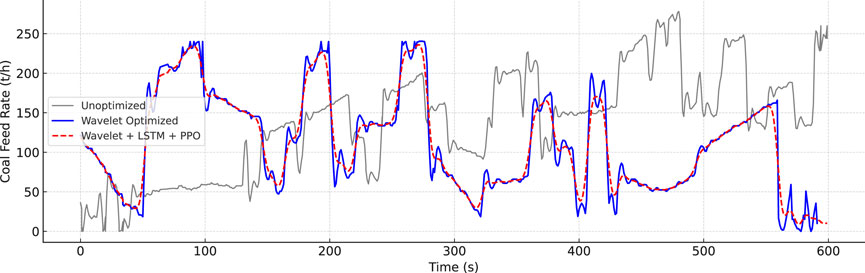
Figure 14. Coal feed rate under three control strategies: unoptimized, wavelet-based tuning, and the proposed Wavelet + LSTM + PPO framework.
Moreover, Figure 14 shows that the RL-based controller produced more stable and coordinated adjustments to the coal feed rate, avoiding the abrupt spikes commonly observed in traditional logic. This joint optimization of process dynamics and actuator smoothness underscores the controller’s ability to deliver resilient and efficient regulation in the face of frequent AGC-driven load fluctuations.
5 Conclusion
This paper proposes an integrated predictive reinforcement learning control framework to suppress furnace pressure fluctuations in coal-fired power units operating under rapid load ramping conditions. The approach combines wavelet-based signal decomposition, LSTM-based pressure prediction, and PPO-based reinforcement learning control to form a closed-loop regulation architecture.
Wavelet decomposition is first applied to extract multi-resolution features from furnace pressure and air flow signals. A weighted correlation coefficient identifies the most relevant air dampers associated with pressure instability. These features are used to train an LSTM model that predicts short-term pressure evolution with high accuracy (RMSE = 4.8 Pa; NSE = 0.82), enabling the control agent to make decisions based on both current measurements and a forecast of future pressure trajectories, allowing it to preemptively counteract anticipated disturbances.
A PPO agent is then trained to adjust damper positions using both real-time and predicted signals, optimizing a reward function that penalizes pressure deviation and oscillation. Compared to the original control logic, the proposed method reduces the standard deviation of pressure fluctuations from 11.6 Pa to 6.7 Pa, a 42.2% improvement—and shortens the settling time from 28 s to 12 s under load ramping.
The proposed framework addresses urgent operational demands in modern coal-fired power systems, where high ramp-rate requirements increasingly challenge combustion stability. The method offers a scalable, interpretable, and data-driven solution for adaptive regulation under such dynamic conditions.
Future work will extend the framework to different unit types and broader load conditions. Incorporating variables such as O2 content or NOx levels could enable multi-objective optimization. Real-time deployment challenges, including inference latency and computational cost, will also be further explored.
Data availability statement
The raw data supporting the conclusions of this article will be made available by the authors, without undue reservation.
Author contributions
ZJ: Investigation, Formal Analysis, Conceptualization, Writing – review and editing. JS: Formal Analysis, Writing – original draft, Project administration, Data curation, Methodology. QH: Writing – review and editing, Supervision, Funding acquisition, Resources. XW: Investigation, Software, Writing – original draft, Visualization. QL: Validation, Writing – review and editing, Methodology. MZ: Software, Methodology, Investigation, Writing – original draft.
Funding
The author(s) declare that financial support was received for the research and/or publication of this article. This research was funded by Inner Mongolia Power (Group) Co., Ltd. grant number Technology Innovation [2024] No. 5.
Conflict of interest
Authors ZJ, JS, QH, XW, QL, MZ were employed by the Inner Mongolia Power (Group) Co., Ltd.
The authors declare that this study received funding from Inner Mongolia Power (Group) Co., Ltd. The funder had the following involvement in the study: study design, data collection and analysis, decision to publish, and preparation of the manuscript.
Generative AI statement
The author(s) declare that no Generative AI was used in the creation of this manuscript.
Any alternative text (alt text) provided alongside figures in this article has been generated by Frontiers with the support of artificial intelligence and reasonable efforts have been made to ensure accuracy, including review by the authors wherever possible. If you identify any issues, please contact us.
Publisher’s note
All claims expressed in this article are solely those of the authors and do not necessarily represent those of their affiliated organizations, or those of the publisher, the editors and the reviewers. Any product that may be evaluated in this article, or claim that may be made by its manufacturer, is not guaranteed or endorsed by the publisher.
References
Agbleze, S., Shadle, L. J., and Lima, F. V. (2024). Dynamic modeling and simulation of a subcritical coal-fired power plant under load-following conditions. Ind. Eng. Chem. Res. 63 (25), 11044–11056. doi:10.1021/acs.iecr.4c00494
Al-Dahidi, S., Al-Dahidi, A., and Abualigah, L. (2025). A review of artificial intelligence impacting statistical process monitoring and future directions. arXiv preprint arXiv:2501.00010.
Bo, L., Liu, X., and Qin, S. (2008). Hybrid wavelet-morphology-emd analysis and its application. J. Vib. Shock 27 (5), 1–4. doi:10.13465/j.cnki.jvs.2008.05.040
Chong, X., Li, L., Zhang, C., Zhao, Y., Kraft, M., and Wang, X. (2025). AI-enhanced multi-scale smart systems for decarbonization in the chemical industry: a pathway to sustainable and efficient production. Technology Review for Carbon Neutrality. doi:10.26599/TRCN.2025.9550005
Duan, X., Lin, R., and Feng, Z. (2025). Spectral correlation demodulation analysis for fault diagnosis of planetary gearboxes. Sensors 25 (9), 2694. doi:10.3390/s25092694
Duan, C., Lv, Y., and Wang, Y. (2021). Advances in the developments of solar cooker for sustainable development: a comprehensive review. Renew. Sustain. Energy Rev. 145, 111166. doi:10.1016/j.rser.2021.111166
Guan, S., Shi, M., Wang, F., and Li, J. (2025). Power transformer fault diagnosis method based on multi source signal fusion and fast spectral correlation. Sci. Rep. 15 (1), 6984. doi:10.1038/s41598-025-91428-8
Guo, T., Zhang, T., Lim, E., Lopez-Benitez, M., Ma, F., and Yu, L. (2022). A review of wavelet analysis and its applications: challenges and opportunities. IEEE Access 10, 58869–58903. doi:10.1109/access.2022.3179517
Hochreiter, S., and Schmidhuber, J. (1997). Long short-term memory. Neural Comput. 9 (8), 1735–1780. doi:10.1162/neco.1997.9.8.1735
Hou, J., Hu, W., Wang, Z., and Xi, S. (2024). Characterizing the multiscale knock energy of the in-cylinder pressure of compound combustion engines fueled with dimethyl ether. ACS Omega 9 (43), 43406–43413. doi:10.1021/acsomega.4c04272
Illingworth, S. J., and Morgans, A. S. (2008). Adaptive control of combustion instabilities in annular combustors. Turbo Expo Power Land, Sea, Air 43130, 309–319. doi:10.1115/gt2008-50436
Karimi, A., Mišković, L., and Bonvin, D. (2004). Iterative correlation-based controller tuning. Int. J. Adapt. Control Signal Process 18 (8), 645–664. doi:10.1002/acs.825
Kumar, R., Kumar, S., and Mittal, A. P. (2017). Model predictive control system design for boiler turbine process. Int. J. Eng. Res. Appl. 7 (1), 33–38. doi:10.11591/ijece.v5i5.pp1054-1061
Li, J., Sun, Y., Han, J., Liu, H., Fan, J., Zhang, W., et al. (2023). Agc regulation capability prediction and optimization of coal-fired thermal power plants. Front. Energy Res. 11, 1275243. doi:10.3389/fenrg.2023.1275243
Lillicrap, T. P., Hunt, J. J., Pritzel, A., Heess, N., Erez, T., Tassa, Y., et al. (2015). Continuous control with deep reinforcement learning. arXiv preprint arXiv:1509.02971.
Liu, Z., Liu, S., Shi, R., Wang, J., Xie, M., and Zheng, S. (2020). A control strategy of the air flow rate of coal-fired utility boilers based on the load demand. ACS Omega 5 (48), 31199–31208. doi:10.1021/acsomega.0c04585
Ma, T., Li, M.-J., and Xu, P. (2024). Thermal energy storage capacity configuration and energy distribution scheme for a 1000MWe s–CO2 coal-fired power plant to realize high-efficiency full-load adjustability. Energy 292, 130310. doi:10.1016/j.energy.2024.130950
Mnih, V., Kavukcuoglu, K., Silver, D., Rusu, A. A., Veness, J., Bellemare, M. G., et al. (2015). Human-level control through deep reinforcement learning. Nature 518 (7540), 529–533. doi:10.1038/nature14236
NDRC (2025). Notice on issuing the implementation plan for the upgrading action of the new generation of coal power (2025–2027) (ndrc energy [2025] no. 363). Available online at: https://www.ndrc.gov.cn/xxgk/zcfb/tz/202504/t20250414_1397185.html (Accessed June 07, 2025).
Nussbaumer, H. J., and Nussbaumer, H. J. (1982). The fast fourier transform. Springer. doi:10.1007/978-3-642-81897-4_4
Schulman, J., Wolski, F., Dhariwal, P., Radford, A., and Klimov, O. (2017). Proximal policy optimization algorithms. arXiv preprint arXiv:1707.06347.
Vonesch, C., Blu, T., and Unser, M. (2007). Generalized daubechies wavelet families. IEEE Trans. Signal Process. 55 (9), 4415–4429. doi:10.1109/tsp.2007.896255
Wang, P., Meng, H., Liu, J., Liu, J., Li, J., and Liu, J. (2015). The application of switching control to boiler-turbine coordination in marine steam power plant. Open Cybernetics and Systemics Journal 9, 3036–3044. doi:10.2174/1874110X01509013036
Wang, X., Zhang, X., Yang, C., Li, H., and Liu, Y. (2022). Analysis of pressure fluctuation characteristics of central swirl combustors based on empirical mode decomposition. Sensors 22 (15), 5615. doi:10.3390/s22155615
Wu, Z., Jiang, C., Conde, M., Deng, B., and Chen, J. (2019). Hybrid improved empirical mode decomposition and BP neural network model for the prediction of sea surface temperature. Ocean Sci. 15 (2), 349–360. doi:10.5194/os-15-349-2019
Zeng, Y., Zhang, L., and Li, G. (2024). Fault diagnosis of thermal power units using wavelet packet energy and improved probabilistic neural network. Automation Application 65 (6), 102–104. doi:10.19769/j.zdhy.2024.06.035
Keywords: combustion stability, intelligent control, proximal policy optimization, reinforcement learning, wavelet transform
Citation: Jing Z, Shi J, Hao Q, Wang X, Li Q and Zhang M (2025) Mitigating furnace pressure fluctuations under rapid load ramping using a wavelet-LSTM-PPO based intelligent control framework. Front. Energy Res. 13:1658163. doi: 10.3389/fenrg.2025.1658163
Received: 02 July 2025; Accepted: 09 September 2025;
Published: 16 October 2025.
Edited by:
Xiaohu Yang, Xi’an Jiaotong University, ChinaReviewed by:
Gang Li, Mississippi State University, United StatesBingji Yan, Soochow University, China
Copyright © 2025 Jing, Shi, Hao, Wang, Li and Zhang. This is an open-access article distributed under the terms of the Creative Commons Attribution License (CC BY). The use, distribution or reproduction in other forums is permitted, provided the original author(s) and the copyright owner(s) are credited and that the original publication in this journal is cited, in accordance with accepted academic practice. No use, distribution or reproduction is permitted which does not comply with these terms.
*Correspondence: Qianpeng Hao, aGFvcWlhbnBlbmdteEAxNjMuY29t