Your new experience awaits. Try the new design now and help us make it even better

METHODS article

Front. Energy Res., 07 October 2025

Sec. Process and Energy Systems Engineering

Volume 13 - 2025 | https://doi.org/10.3389/fenrg.2025.1665986

This article is part of the Research TopicAdvanced Water Splitting Technologies Development: Best Practices and Protocols Volume IIView all 10 articles

REDOTHERM: a thermodynamic modeling framework for redox-based thermochemical processes

  • National Renewable Energy Laboratory, Golden, CO, United States

Two-step thermochemical redox cycles are being developed as a potential pathway for the production of hydrogen and syngas. While there are many possible reactor and system configurations, moving oxide systems are considered promising in terms of the redox thermodynamics, due to the potential implementation of a countercurrent system that can achieve higher performance compared to other configurations. There is a lack of a robust thermodynamic modeling framework in the field, with multiple models incorporating incorrect thermodynamic assumptions that violate the second law of thermodynamics. We present in this work REDOTHERM, an open-source system model for moving oxides that incorporates the correct thermodynamic limits, as well as various options for the system auxiliary units including product separation, heat recovery, and oxygen removal. The model is agnostic to the energy source, and could be used for solar thermal or other configurations. We highlight the uses of this model, presenting some of the tradeoffs and challenges in redox-active material selection and how they affect the entire thermochemical hydrogen production process. This model could be easily adapted and used for material exploration, system/reactor design, and technoeconomic analysis.

1 Introduction

There is a significant growing interest in chemical looping processes where a metal oxide is used as an oxygen carrier in a redox cycle. These processes include chemical looping combustion, chemical looping reforming, chemical looping gasification, and thermochemical fuel production from water and CO2 (Adanez et al., 2012; Fan, 2011; Kathe et al., 2017; Zhao et al., 2017; Romero and Steinfeld, 2012; Warren and Weimer, 2022). Two-step thermochemical redox cycles provide a route to split water and/or CO2 driven by thermal rather than electrical inputs, while inherently separating O2 from H2 and/or CO products, respectively. Numerous oxide materials have been considered for the process (Scheffe and Steinfeld, 2014; Budama et al., 2022; Warren et al., 2022; Mao et al., 2020). Early efforts focused on oxides that can operate in a two-step cycle and undergo stoichiometric reduction such as ZnO, SnO2, Fe3O4, or ferrite materials (MxFe3xO4). However, challenges with rapid quenching requirements for volatile oxide materials, sintering, and cyclic stability led to a shift toward non-stoichiometric oxides including CeO2, doped CeO2, or various perovskite (ABO3) materials (Abanades and Flamant, 2006; Chueh et al., 2010; Abanades et al., 2010; Siegel et al., 2013; McDaniel et al., 2013; Scheffe and Steinfeld, 2014). The lattice structure of non-stoichiometric oxides can accommodate anion or cation vacancies, providing fast kinetic rates along with long-term cyclic physical and chemical stability (Chueh et al., 2010).

In a typical two-step non-stoichiometric metal oxide redox cycle, the endothermic reduction of the oxide is carried out as shown in Equation 1 where Δδ=δredδox is the change in non-stoichiometry between the reduced and oxidized states.

1ΔδMxOyδox1ΔδMxOyδred+12O2(1)

This is followed by an exothermic oxidation step with either steam or CO2 in Equation 2 or Equation 3 thereby completing the cycle.

1ΔδMxOyδred+H2O1ΔδMxOyδox+H2(2)
1ΔδMxOyδred+CO21ΔδMxOyδox+CO(3)

The endothermic reduction reaction is thermodynamically favored at high temperature and low oxygen partial pressure conditions, whereas the exothermic oxidation is thermodynamically favored by comparatively lower temperatures and high steam or CO2 concentration.

The techno-economic potential of chemical looping for H2 or syngas production can only be realistically evaluated when viewed within the context of the full system including not only the thermochemical reactor(s), but also requirements for all unit operations including heat recuperation, product separations, etc. This presents numerous tradeoffs in the selection of ideal system conditions including target temperature and pressure conditions for each the reduction and oxidation reactors, and relative sweep gas or steam/CO2 flow rates (Li et al., 2018a; Ehrhart et al., 2016; Lidor and Bulfin, 2024). For example, conditions which maximize H2 or CO productivity per mass of oxide (high reduction temperature, large difference between reduction and oxidation temperatures, large excess of steam or CO2) can lead to low steam or CO2 conversion along with energy- and capital-intensive heat exchange and separation operations. These costs are not trivial, for example, the cost of separation in reverse water-gas shift processes can be more expensive than the reactor itself (Zang et al., 2021). In addition, low feedstock conversion produces low power density, which means larger reactor volumes and a larger mass of redox-active material required to produce a given quantity of product (Lidor and Bulfin, 2024).

Coupling chemical looping redox cycles with concentrated solar thermal (CST) systems was first proposed as a potential pathway for the production of hydrogen during the 1970s (Nakamura, 1977). A myriad of widely-varying reactor concepts exist in the literature, including directly- and indirectly-irradiated designs as well as batch vs. flow-through designs (Steinfeld, 2005; Gokon et al., 2011; Romero and Steinfeld, 2012; Hathaway et al., 2016; Thanda et al., 2022; Budama et al., 2022). Many analyses pair a specific oxide material with a specific reactor design, and the resulting experimental or model-predicted performance combines the underlying material thermodynamics with heat and mass transfer limitations and characteristics that arise from the reactor design and/or selected operating conditions. These studies can provide valuable comprehensive assessments for the specific combination of oxide material, reactor, and operating conditions; however, there is little opportunity for extrapolation, direct comparison between oxide materials, or rapid iteration over wide ranges of temperature, material, and flow conditions for system-level performance optimization.

Most reactor designs can be conceptually categorized as fixed-bed batch reactors, fluidized-bed batch reactors, or flow-through designs employing parallel-flow (PF), mixed flow, or counter-current flow (CF) configurations. A general sketch of both PF and CF configurations is presented in Figure 1. Counter-current flow conditions are widely accepted as providing a theoretical upper limit on performance; however, as discussed by (Li et al., 2018b; Li et al., 2018a; Bulfin, 2019; de la Calle et al., 2022; and de la Calle et al., 2024), many past thermodynamic models for counter-current systems relied on inaccurate thermodynamic assumptions and thereby underestimate sweep gas and oxidizer flow requirements. This work aims to provide a simple thermodynamically-consistent model that can predict thermodynamic limits of O2 exchange in various systems of moving redox-active materials during reduction and oxidation, coupled with performance of system auxiliary units, in order to facilitate material comparison and wide-ranging evaluation of potential operating conditions.
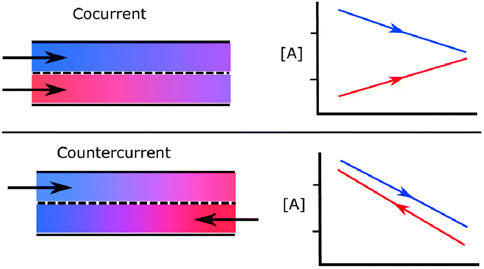
Figure 1
Graphic showing cocurrent and countercurrent flow. In cocurrent flow, two arrows in the same direction and a graph with diverging lines. In countercurrent flow, arrows in opposite directions and a graph with nearly parallel lines.

Figure 1. Comparison between parallel flow (cocurrent) and counterflow configurations with exchange of species A between the two streams (from Bulfin (2019) under CC-BY-NC license).

The paper follows to detail the modeling framework (Section 2), demonstrate the use of the modeling framework through an analysis of redox systems for thermochemical H2O and CO2 splitting (Section 3) as a sample use case, and ends with conclusions (Section 4).

2 Model

The thermodynamic model is based on the methodology developed and presented in (Bulfin, 2019), used in determining the thermodynamically-limited upper bounds of the process without considering transport limitations such as heat/mass transfer, or temperature and pressure gradients within the reactor system. We briefly present here the core methodology to allow the reader to follow our additional development of model extensions. For the full derivation the reader is referred to the original paper by (Bulfin, 2019).

2.1 Original thermodynamic model and its application to thermal reduction

The problem is formulated using an exchange coordinate κ which is independent of the reactor size, as shown in Equation 4:

κx=0xjAdxṅ1,(4)

with A the species being exchanged, jA as the molar flux of species A from flow 1 to flow 2, ṅ1 as the molar flow rate of flow 1, and x the position along the reactor. In practical terms for redox cycles, κ would denote the change in the mole fraction of any reaction species along the reactor (an example provided in the Supplementary Material). The condition for a spontaneous transfer process of species A from flow 1 to flow 2 must fulfill Equation 5:

μA,1κμA,2κκ0,κtotal,(5)

with μ being the chemical potential. Applying the conservation of mass, we note that the number of moles of A that have left flow 1 must equal to the amount of moles that have entered flow 2, at any point along the reactor. For the parallel flow (co-current) case this yields in Equation 6:

κ1=κ2κ(6)

while for counter-current flow the exchange coordinate of flow 2 is reversed, as shown in Equation 7 yielding

κ1=κ2κtotalκ.(7)

The thermodynamic upper limit for the exchange of A in a parallel flow (co-current) system is given by Equation 8:

μA,1κtotal=μA,2κtotal(8)

with κtotal equal to κ at the reactor outlet. For the counter-current case, the chemical potential can meet at each boundary, share a common tangent somewhere within the reactor, or have all of species A transferred from flow 1 to flow 2. These are given by

μA,10=μA,20 or μA,1κtotal=μA,2κtotal(9)

and

μA,1κ=μA,2κ and μA,1κ=μA,2κ(10)

In the case of a complete transfer of A from flow 1 to flow 2, neither Equation 9 nor Equation 10 are binding, but the fundamental thermodynamic condition of Equation 5 is met within the entirety of the reactor length. Two system parameters that are needed to calculate the O2 exchange during reduction are the ratio between the molar flow rates of both streams Equation 11:

ωred=ṅ2ṅ1=ṅsg,inṅMO,(11)

and the O2 mole fraction in the inert sweep gas xO2,in. ṅsg,in is the molar flow rate of the inert sweep gas at the reactor inlet and ṅMO is the redox-active material molar flow rate. Assuming an isothermal and isobaric reactor, the chemical potential becomes a function of the O2 partial pressure pO2. The O2 partial pressure at the reactor outlet is then calculated as a function of κ. This can be obtained from the relation between the O2 partial pressure and the O2 mole fraction at the reactor outlet, after the oxygen exchange occurred Equation 12:

pO2,sgredκ=xO2,inωred+κωred+κpred(12)

with xO2,in as the O2 mole fraction at the reactor inlet (function of the sweep gas purity), κ as the total O2 exchange, and pred as the total reactor pressure during reduction. Since each mole of O2 released from the oxide will create two O vacancies in the oxide material, we can calculate the O2 partial pressure of the oxide using Equation 13:

pO2,MOredκ=fT,δox+2κ,(13)

with δox as the initial non-stoichiometry extent at the end of oxidation and κ as the total O2 exchange, same as in Equation 12. This formulation allows us to numerically solve for increasing κ from 0 to κmax, while checking the criteria in Equations 810 for each κ. The maximum O2 transfer that is calculated without violating the constraints in Equations 810 is denoted as κred, being the maximum species exchange during reduction.

2.2 Model extension

During the oxidation, a flow of H2O or CO2 enters the reactor and re-oxidizes the redox-active material, splitting the gaseous reactant into H2 or CO, respectively. The conversion is usually incomplete, so the reactor outlet stream consists of a mixture of unconverted reactants and products. Following the same methodology as in the reduction reaction, we calculate the chemical potential of both gas and solid phases, to ensure the solution would adhere to requirements of a spontaneous process per Equation 5. The equilibrium constant for the thermolysis reaction (H2O or CO2) in the gas phase can be written as shown in Equation 14:

K=pprodpO2p°12preac=xprodxreacpO2p°12(14)

with the reactant and product mole fractions at the reactor effluent given by xreac=ωoxxreac,in2κ and xprod=ωoxxprod,in+2κ, respectively (and using pi=xip). K is the relevant thermolysis reaction equilibrium constant (i.e., H2O or CO2 thermolysis) and ωox is the ratio between the molar flow rates of both streams during oxidation ωox=ṅfeed/ṅMO with ṅfeed as the total feed molar flow rate which is given by ṅfeed=ṅreac,in+ṅprod,in. The equilibrium constant is calculated from K=expΔG°RT. Substituting the partial pressure equations into Equation 14, assuming that pO2preac and pO2pprod, we can calculate the O2 partial pressure in the oxidizer stream using Equation 15:

pO2,feedoxκ=p°Kωoxxreac,in2κωoxxprod,in+2κ2.(15)

The O2 partial pressure of the oxide material is calculated via Equation 16:

pO2,MOoxκ=fT,δred2κ(16)

considering that this time the oxide is absorbing O2 molecules from the oxidizer gaseous stream. By solving in the same manner as for the reduction, increasing κ from 0 to κmax, we can find the maximum O2 exchange during the oxidation step κox that satisfies the constraints in Equation 8, Equation 9, and Equation 10. Following the analysis of both steps, the maximum extent of re-oxidation (i.e., the lowest δ possible during oxidation at the reactor outlet) is calculated from Equation 17:

δox=δred2κox(17)

and the extent of reduction can be calculated as shown in Equation 18:

Δδ=δredδox=2κox.(18)

Assuming full selectivity, the conversion of H2O during water splitting oxidation can be calculated from Equation 19:

X=ṅprod,outṅreac,in=2κoxωox(19)

with ṅprod,out as the product molar flow rate at the outlet (H2 or CO) and ṅreac,in as the reactant molar flow rate into the reactor (H2O or CO2). Since conversion is limited to unity, the maximum value of κ during oxidation is κmax=0.5ωox.

2.3 Redox thermodynamic formulation

To allow for a universal analysis of different redox materials, with different defect and vacancy formation mechanisms Zinkevich et al. (2006); Warren et al. (2022); Vieten et al. (2019); Wexler et al. (2023), we define the molar oxygen content fraction in the solid in Equation 20 as

ϕ=nOnMO(20)

with nO as the moles of O atoms in the solid and nMO the moles of redox-active material solid. The amount of O atoms released during oxidation is then Δϕ=ϕoxϕred. In such a manner, we can use the same formulation for materials such as ceria and its solid solutions, perovskites, iron aluminates, and others. The relation between κ and ϕ is then given per Equation 21:

ϕf=ϕi±2κ(21)

with ϕf as the final state ϕ, ϕi as the initial state ϕ, and the sign dictated by the step, with minus for reduction (O atoms released from the solid) and plus for oxidation (O atoms absorbed by the solid). For materials with an oxygen vacancy mechanism, such as most redox-active materials studied to date (CeO2 and its solid solutions, perovskites, and most ferrites), the total amount of oxygen exchanged in a cycle is equal in each formulation Δδ=Δϕ. More details are provided in the Supplementary Material.

2.4 System performance

The connection between the thermodynamics of a specific redox-active material and its performance in the redox cycle to an actual system is based on a previously developed model Lidor and Bulfin (2024) and is aligned with other works in the field Bulfin et al. (2021). However, one generalization presented here is the clear separation of heat and work requirements. While it is customary to convert the auxiliary work to heat equivalent in the field of solar thermochemistry Bulfin et al. (2021), there is increased interest in hybrid CST-PV systems that would be able to provide both heat and power. Moreover, the emerging field of high-temperature electric thermal energy storage (ETES) Ma et al. (2023) opens up the possibility of using renewable electricity to drive the thermochemical reaction. Hence, we have excluded the energy conversion penalties associated with the energy input source, whether via solar thermal or other sources. Instead, we have calculated the overall thermochemical conversion process efficiency based on the required heat and power per

η=ṅfuelHHVfuelQ̇req+Ẇreq,(22)

with η as the efficiency, ṅfuel as the fuel production rate, HHV as the fuel higher heating value (upper limit of a fuel thermal energy, defined as the heat released during combustion assuming condensing of products that are liquid at the initial fuel temperature and pressure), Q̇req as the required thermal power, and Ẇreq as the required electric power for all necessary unit operations such as pumping and separation. Equation 22 can be divided by the flow rate of the redox-active material to be turned into a general form (not tied to a specific size/flow rate):

η=ΔϕHHVfuelqreq+wreq,(23)

with Δϕ=ϕoxϕred as the specific amount of fuel produced per mole of redox-active material, qreq as the specific required heat per mole of redox-active material, and wreq as the specific required work per mole of redox-active material. From now on, we will use Equation 23 and the specific energy terms in this paper.

The following energy terms are considered in this work:
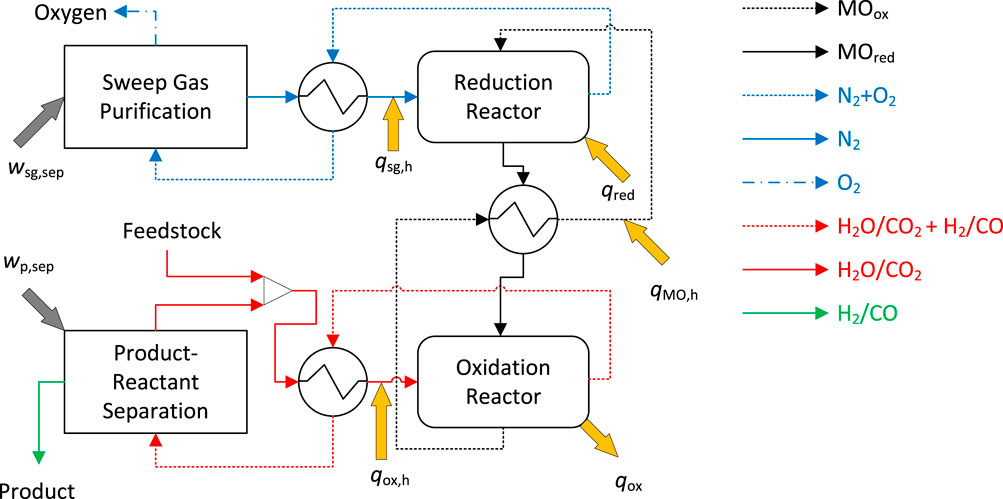
Sensible heating of the redox-active material between oxidation and reduction temperatures (qMO,h).

Heating of the inert sweep gas stream (qsg,h).

Heating of the oxidizer gas stream (qox,h), which can consist of both sensible and latent heat (in the case of water splitting). Even though the heat input in Figure 2 is presented between the sensible heat recovery and oxidation reactor, for the case of H2O splitting, the required heat of vaporization to convert water into steam is of course supplied separately from the heat required to raise the steam temperature up to Tox. For convenience we have lumped those into a single, general term, that is calculated accurately based on the oxidizer.

Reduction energy (qred).

Inert gas separation (wsg,sep).

Separation of product and unconverted reactant (wp,sep).

Exothermic heat of oxidation (qox). This term is not an energy input, but if recovered can be used to supply some of the heat demand at T<Tox, or used to provide heat for a power cycle that can cover some of the required work.

Figure 2
Flowchart illustrating a chemical process with three main components: Sweep Gas Purification, Reduction Reactor, and Oxidation Reactor. Oxygen enters the Sweep Gas Purification and flows to the Reduction Reactor. Feedstock enters the Product-Reactant Separation and then moves to the Oxidation Reactor. Arrows indicate various chemical and gas flows, including N₂, O₂, H₂O, CO₂, H₂, and CO, with products output from the Product-Reactant Separation. Heat exchange is indicated by orange arrows.

Figure 2. Process flow diagram for the generic moving oxide redox-based thermochemical system shown for H2O or CO2 splitting).

In addition, the effects of heat recovery, both in the gaseous streams (sweep gas and oxidizer gas) and in the solid stream, are evaluated by the implementation of heat recovery effectiveness values εg and εs, respectively. This topic has been of great importance due to the large sensible energy needed for temperature-swing operation (Lidor et al., 2023; Patankar et al., 2022; Lidor and Zimmermann, 2023). It is also important for sweep gas operated systems which require large flow rates (Hathaway et al., 2016; Lidor et al., 2021). The possibility of recovering the exothermic heat of oxidation qox is also implemented in the same manner, using a heat recovery effectiveness εox. This heat can be used to meet any heating requirements at temperatures below Tox, such as oxidizer preheating or inert sweep gas heating to Tox. This heat can also drive an auxiliary power cycle that can be used to supply some of the required work. Since this model has been developed as a generic tool, capable of modeling a large variety of systems, the amount of usable exothermic heat is calculated assuming general heat recovery effectiveness, as well as heat-to-work efficiency in case this heat can cover all the thermal loads at or below Tox and still has some excess. The full details of calculating each term are presented in the Supplementary Material.

The feedstock conversion extent is given by

X=1ṅreacṅreac,in(24)

with ṅreac as the unreacted feedstock molar flow rate at the effluent and ṅreac,in as the feedstock molar flow rate into the reactor. Since we perform an analysis normalized by moles of redox-active material, the conversion is calculated in our model from Equation 25:

X=Δϕωox(25)

which is in essence the moles of oxidizer that reacted per moles of redox-active material, over the moles of oxidizer fed into the reactor per moles of redox-active material.

2.5 Model structure

The model has been developed in MATLAB Version 2023b The MathWorks Inc. (2023) and is publicly available on a GitHub repository (https://github.com/NREL/REDOTHERM), including all the main scripts and required functions. The repository includes thermodynamic functions for several redox-active materials: CeO2, Ce0.8Zr0.2O2 (CeZr20), La0.6Ca0.4Mn0.6Al0.4O3 (LCMA6464), La0.6Sr0.4MnO3 (LSM40), and Fe0.33Al0.67O4 (Fe33Al67). The thermodynamic data has been collected from (Bulfin et al., 2015; Bulfin et al., 2016; Carrillo and Scheffe, 2019; Warren et al., 2022), and uses either the provided functions for the reduction enthalpy Δhredδ and reduction entropy Δsredδ (Bulfin et al., 2015; Bulfin et al., 2016) or uses a curve fitting tool to develop polynomial correlations from the given data (Carrillo and Scheffe, 2019; Warren et al., 2022). We note that when using curve fitting methods to calculate the material thermodynamic properties, a certain degree of inaccuracy is expected, especially if the original experimental data is limited in terms of temperature and δ. Extrapolating beyond the range of the material data can be unreliable, and care should be taken in interpreting results from the sensitivity analysis and optimization capabilities described below when conditions extend beyond the limits of the measured material performance.

Thermodynamic properties of the fluids in the system are calculated using the CoolProp package (Bell et al., 2014) at the relevant process temperature and pressure, and the equilibrium composition of the oxidizer feed is calculated using the Gibbs energy minimization method implemented with Goodwin et al. (2023). The oxidizer gas can be selected as either H2O or CO2, as the necessary equilibrium constant calculation is performed for the relevant thermolysis reaction, based on the oxidizer feed of each analysis. The model is developed with an interactive input acquisition (via prompts) for the main parameters which are expected to be changed frequently, such as temperatures, and other parameters which are set within the code. There are three main scripts that are to be used when running the model with their respective code logic flowcharts in Figure 3:
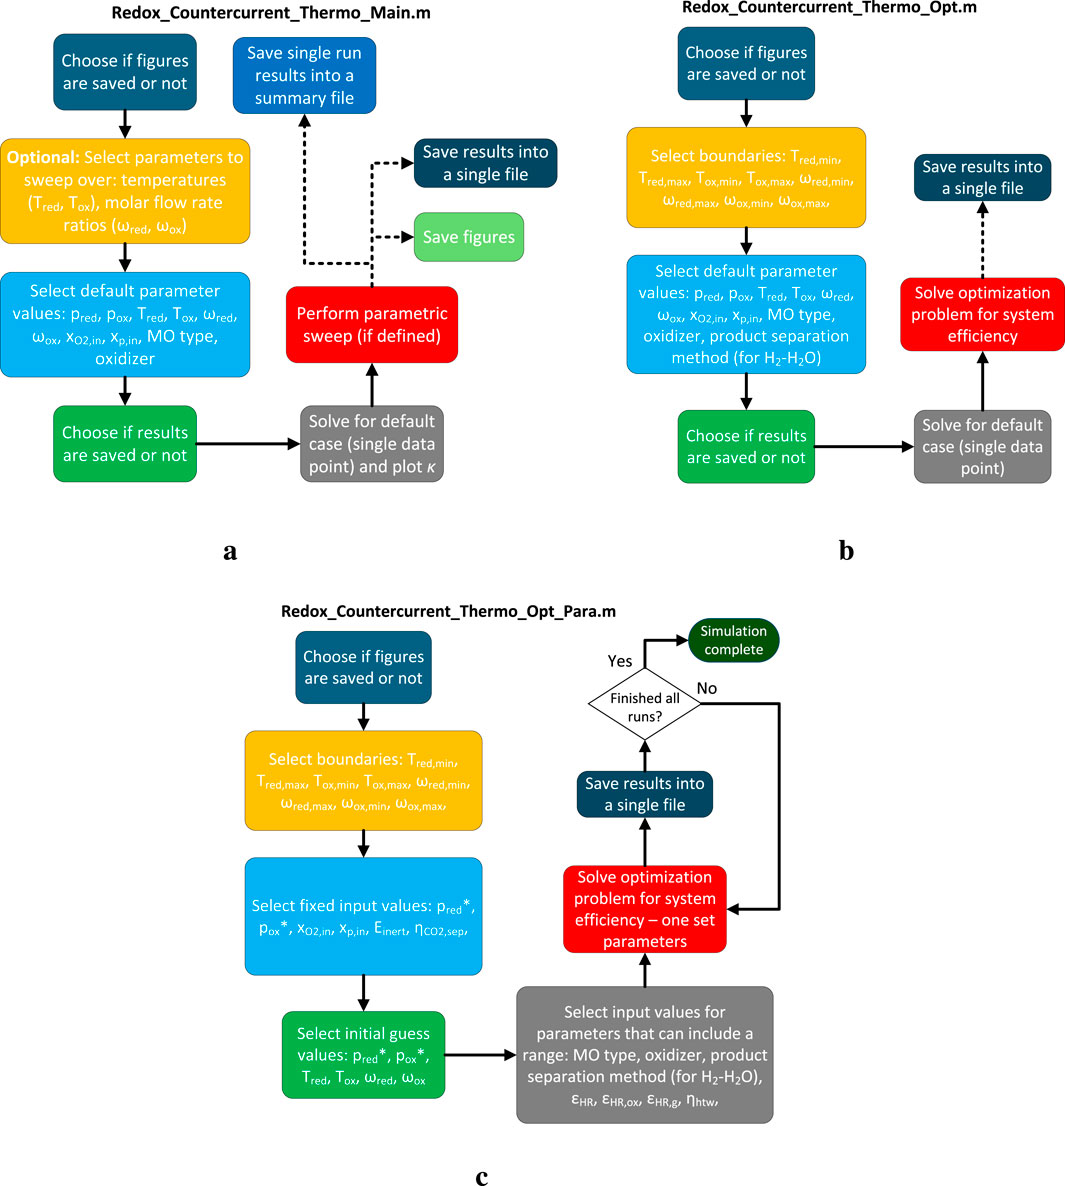
Main code: Redox_Countercurrent_Thermo_Main.m - this script is used to solve for a single data point (i.e., one combination of temperatures, pressures, molar flow rate ratios, etc.) and obtain the redox performance in terms of Δδ, Δϕ, and X. It can also be used to perform parametric sweeps over combinations of Tred and Tox and/or ωred and ωox. The results can be saved in a file that can be post-processed for cycle performance and plotting via the support script Redox_Countercurrent_Thermo_Plot_Results.m. The logic flowchart of this script is presented in Figure 3a.

Optimization code: Redox_Countercurrent_Thermo_Opt.m - this script is used to run an optimization analysis, aimed at identifying the operating conditions in terms of Tred, Tox, ωred, and ωox which will yield the highest system efficiency η. The code does not have any built-in plotting, but will display the results and include optional saving of the data to a MAT file. The logic flowchart of this script is presented in Figure 3b.

Optimization code with parametric sweeps: Redox_Countercurrent_Thermo_Opt_Para.m - this script is used to automate multiple optimization analysis runs, facilitating sweeps over different redox-active materials, heat recovery effectiveness values (εs, εox, εg), heat-to-work efficiency (ηhtw), oxidizer type, and product separation method (for H2– H2O). The script automatically saves each run with a set of parameters to a MAT file. No plotting or results display capabilities are currently included; however, a simple plotting script Plot_multiple_opt_results.m used in generating plots for this paper is provided in the repository and can easily be extended for different types of data analysis. The logic flowchart of this script is presented in Figure 3c.

Figure 3
Flowcharts for three MATLAB scripts related to countercurrent thermochemical processes. a. The first flowchart for

Figure 3. Code logic flowcharts for the three main scripts: (a) main code for single runs and parametric sweeps; (b) optimization code for a single run; and (c) optimization code for running multiple cases.

The reactor pressures during reduction (pred) and oxidation (pox) are passed to the optimization problem as decision variables, but are currently fixed via constraints/bounds (depending on the optimizer used). The motivation behind this is two-fold: (1) to allow the analysis of hybrid vacuum-sweep gas systems, which requires both inert sweep gas separation as well as vacuum pumping work terms; (2) to allow future inclusion of any downstream pumping requirements, which in turn might promote the use of high pressure oxidation due to the benefits of pumping water, and obtaining high-pressure H2 for storage or downstream processes such as Fischer-Tropsch.

Cryogenic separation was selected for inert gas separation. Pressure swing adsorption (PSA) was implemented for product separation for CO2, while H2O splitting includes options for conventional condensation and evaporation of the make-up feed and condensed water, as well as a mechanical vapor recompression (MVR) cycle separation which can recover the latent heat (based on Lidor, 2024).

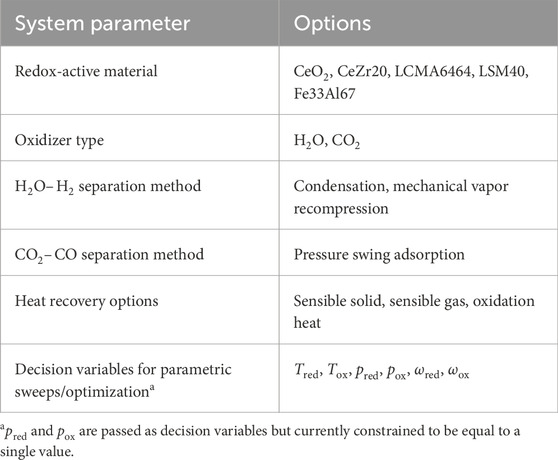
All the different options for the REDOTHERM code are provided in Table 1. The full details of the calculation methods for each term are given in the Supplementary Material.

Table 1
www.frontiersin.org

Table 1. Overview of the different options of the REDOTHERM code.

3 Results

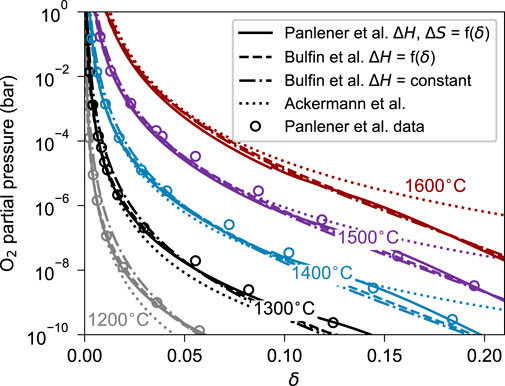
The basic capability of the model in predicting the redox performance of a water-splitting cycle is demonstrated for the case of CeO2. In Figure 4a the maximum O2 exchange is presented for reduction at Tred = 1,550 °C using an inert sweep gas with O2 mole fraction xO2,in=104 and molar flow rate ratio ωred=1 for both PF and CF configurations. As expected, the maximum O2 exchange κ is larger for CF than for PF, with the resulting δred of 0.032 and 0.0203 and Δδ (identical to Δϕ for the case of CeO2) of 0.0286 and 0.0176, respectively. While the values slightly differ from those presented in (Bulfin, 2019) for an identical case, the source of the difference has been identified as the selection of a different function for the redox thermodynamics of CeO2. We compare four different correlations for pO2T,δ of CeO2: (1) a general calculation of pO2 based on equilibrium thermodynamics (see Supplementary Material) combined with piecewise fitting of the Panlener Δhredδ and Δsredδ data (Panlener et al., 1975) which has been implemented in this work; (2) a defect model derived using statistical physics from (Bulfin et al., 2016); (3) a constant ΔH model used in (Bulfin et al., 2016); and (4) a correlation by (Ackermann et al., 2017) extracted from the data of (Panlener et al., 1975). As a reference, we also provide the raw data from (Panlener et al., 1975). The results of this comparison are presented in Figure 5. It is clear that in the region of δ0.05, which is the most relevant for our application, there are minor differences between these models and these differences significantly increase for some models when δ0.05. These differences cause the deviation in the prediction of the O2 exchange. This also emphasizes the importance of accurate thermodynamic properties modeling and data (Wilson et al., 2024) over a wide range of compositions as well as extraction from experimental results (Lany, 2024).
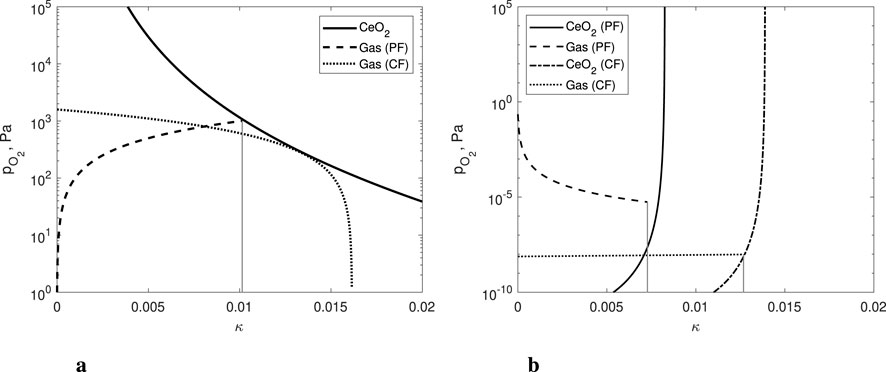
Figure 4
Two graphs labeled 'a' and 'b' compare partial oxygen pressure (\( p_{\text{O}_2} \), Pa) against variable \(\kappa\). In 'a', solid, dashed, and dotted lines represent CeO\(_2\), Gas (PF), and Gas (CF). In 'b', these lines represent different setups of CeO\(_2\) (PF, CF) and Gas (PF, CF). Both graphs use logarithmic scales and exhibit distinct curves for each line type.

Figure 4. The O2 partial pressure pO2 as a function of the exchange coordinate κ for the PF and CF cases with CeO2: (a) reduction at Tred=1550 °C, xO2,in=104, and ωred=1; and (b) oxidation with H2O at Tox=900 °C, ωox=1, and xH2,in=4.8106 (equilibrium H2 mole fraction at inlet conditions).

Figure 5
Graph showing the relationship between oxygen partial pressure (bar) and delta (δ) across various temperatures ranging from 1200 °C to 1600 °C. Different lines represent models from Panlener et al., Bulfin et al., and Ackermann et al., with Panlener et al. data depicted as circles. The y-axis is logarithmic, spanning from 10 to 10^-10.

Figure 5. Comparison of the oxygen partial pressure pO2 of CeO2 based on four different correlations: (1) general equilibrium thermodynamics using piece-wise fit of the data from Panlener et al. (1975) (2) defect model from Bulfin et al. (2016) with reduction enthalpy as a function of δ; (3) defect model from Bulfin et al. (2016) with constant reduction enthalpy; and (4) correlation of the data from Panlener et al. (1975) from Ackermann et al. (2017). The circles denote original data from Panlener et al. (1975).

3.1 Parametric sweep capability

The parametric sweeps that are implemented in the main code (Redox_Countercurrent_Thermo_Main.m) are useful in investigating the effects of different operation and design parameters on all the different energy terms of the system as well as on its performance indicators. We present as an example the results of a parametric sweep over the molar flow rate ratios ωred and ωox for CeO2 for a case of H2O splitting. The temperatures are set at Tred=1550 °C and Tox=900 °C. The inert sweep gas purity is xO2,in=105, and equilibrium H2 mole fraction at inlet conditions is assumed (xH2,in=4.8106). The H2– H2O separation method selected is MVR, and while the code analyzes the performance of both PF-PF and CF-CF configurations, we are presenting here only the CF-CF case for brevity. The trade-off between obtaining a higher Δδ at the expense of conversion using higher gas molar flow rates (i.e., higher ωred and ωox) is clearly demonstrated in Figure 6. The regions which exhibit a value of X>0.1, which has been referred to in different studies (Bayon et al., 2022; Lidor and Bulfin, 2024) as the minimum viable conversion extent, barely overlaps with the areas of high Δδ. Of course, this set of plots do not reveal the complete picture: having a Δδ that is too low would reduce the efficiency since a small amount of fuel is produced.
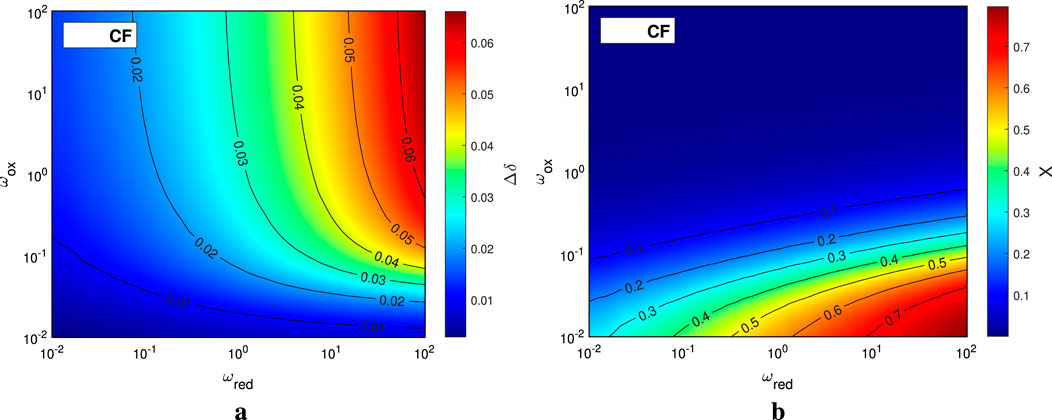
Figure 6
Two contour plots labeled

Figure 6. The reduction extent Δδ (a) and conversion extent X (b) for CF case with CeO2 for Tred=1550 °C, Tox=900 °C, xO2,in=105, and xH2,in=4.8106 (equilibrium H2 mole fraction at inlet conditions).

We also calculate the system efficiency for these parametric sweep cases. The values used for the various heat recovery unit operations are εs=0.5, εg=0.8, and εox=0.8. The rest of the terms used in the calculation of the system efficiency, including specific energy and efficiency terms for some of the auxiliary units, are provided in the Supplementary Material. The results of the cycle efficiency analysis are presented in Figure 7 for the same sample case, using two types of product separation, conventional steam condensation (Figure 7a) and MVR-based separation (Figure 7b). A maximum efficiency of 11.2% and 13.93% is identified for condensation and MVR-based system, respectively. We note the low values compared to other predicted values from the literature. This is due to the following reasons: (a) we do not attempt to optimize the system in this example, except for the two parameters swept (ωred and ωox); (b) some of our system parameter assumptions, such as heat recovery effectiveness, are more modest than other studies; (c) our analysis includes the correct thermodynamics limits, which are not implemented in most studies; and (d) we have accounted for the separation and steam generation energy terms, which are often neglected.
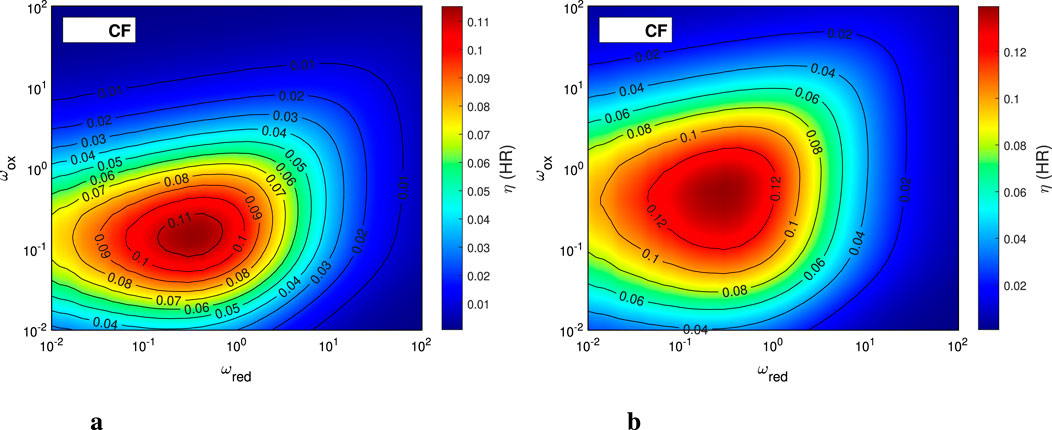
Figure 7
Contour plots labeled

Figure 7. The cycle efficiency for CF case with CeO2 for Tred=1550 °C, Tox=900 °C, xO2,in=105, and xH2,in=4.8106 (equilibrium H2 mole fraction at inlet conditions). H2– H2O separation method: (a) condensing the effluent after sensible heat recovery; (b) using MVR-based separation cycle to recover the latent heat.

By examining the rest of the performance maps for the different energy fraction terms (sensible heating, etc.), one can obtain important insights into the specific thermochemical hydrogen (TCH) process that is evaluated, both from material and system perspective. The plots for this analysis are provided in the Supplementary Material.

3.2 Optimization capability

The optimization capability of the REDOTHERM code includes a single case optimization, as well as optimization for multiple cases, in which the model sweeps over a range of values for the different system parameters, such as redox-active material type, heat recovery effectiveness, and so forth. A sample usage is given here, demonstrating how it can be used to compare different redox-active materials, under the same operating conditions and boundaries. The input parameters, as well as the ranges of the decision variables, are given in Table 2. The optimization problem is solved using a direct search method (patternsearch in MATLAB) with the Nonuniform Pattern Search (NUPS) algorithm.
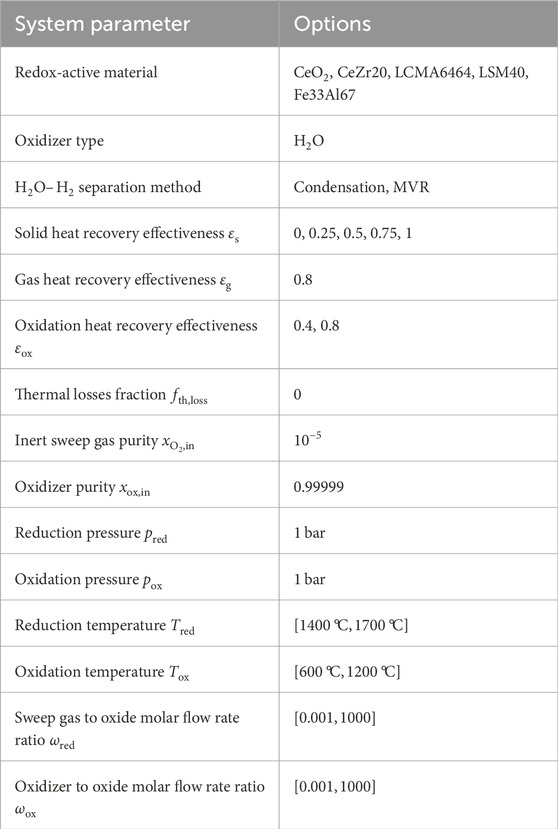
Table 2
www.frontiersin.org

Table 2. Input parameters and ranges for decision variables for the REDOTHERM optimization analysis.

Five values for εs from 0 to 1 were included, examining all cases under both extremes, with no solid heat recovery up to an ideal (and nonphysical) full solid heat recovery. The analysis is performed for water splitting cycles and includes both condensation with reboiling and MVR as the product separation options. The analysis is demonstrated for atmospheric reduction (with sweep gas) and oxidation; however, the option to perform either step at different pressures is included as well. Performing the oxidation at elevated pressures can benefit from increased pO2 in the oxidizer stream, which can increase the extent of re-oxidation (Tran et al., 2023). However, the major improvement is achieved from obtaining the produced H2 at pressure, thus saving on the costly compression that is needed for any produced hydrogen. Lastly, we assume no thermal losses from the reactor (fth,loss=0), since this analysis is performed for a generic moving oxide system without a specific reactor design.

The summary of the results from the optimization run is presented in Figure 8. We focus on a baseline case with εs=0.5, an extreme case of no solid heat recovery (εs=0) and an ideal full solid heat recovery (εs=1). In all of those cases the oxidation heat recovery was taken as εox=0.8. Note that the optimization in Figure 8 considers a wide range of reduction and oxidation temperature conditions, and extends beyond the range of available oxide material thermodynamic data in some cases. We present these results to demonstrate the capabilities of the model, but caution that results from the optimization should ideally be combined with sensitivity analyses to understand the behavior in the vicinity of the optimum and to verify that the material thermodynamic performance is reasonable within this region of the parameter space.
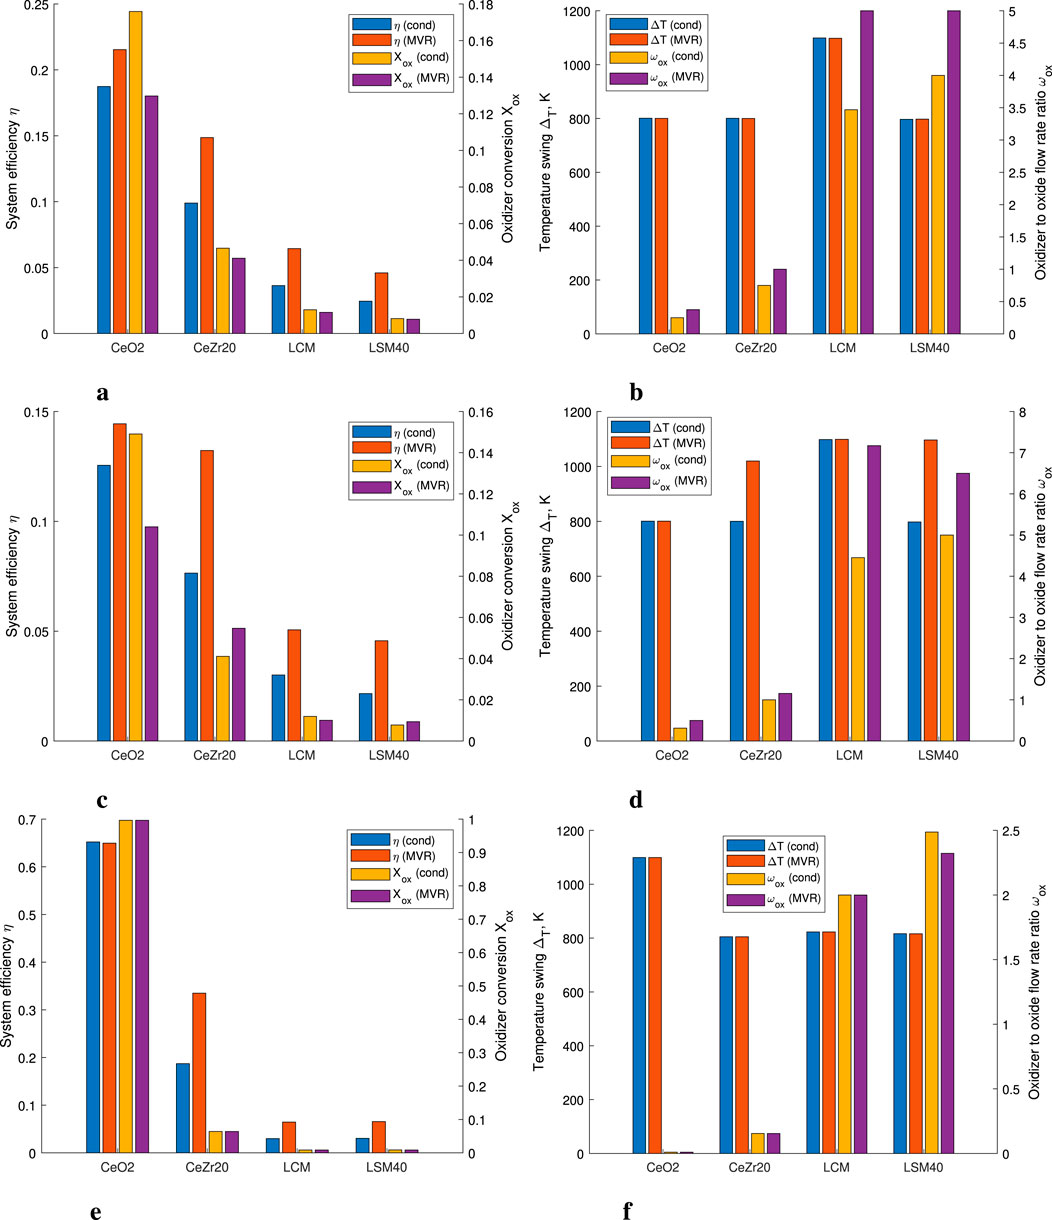
Figure 8
Six bar graphs comparing different parameters for materials CeO2, CeZr20, LCM, and LSM40. Each graph has two or more colored bars representing conditions such as thermal efficiency, oxidizer conversion, and more, as detailed in the legend. Graphs (a) and (c) focus on system efficiency and oxidizer conversion, while (b) and (d) show temperature swing and oxidizer flow ratio. Graphs (e) and (f) are similar to (a) and (b) but with altered scales or data.

Figure 8. Comparison of the system efficiency, oxidizer conversion extent, temperature swing, and oxidizer to metal oxide flow rates ratio for different redox materials, using both condensation with reboiling and MVR as the H2-H2O separation methods. All values are for the optimal solution (optimized for η). (a) Baseline case: η, X. (b) Baseline case: ΔT, ωox. (c) No solid HR case: η, X. (d) No solid HR case: ΔT, ωox. (e) Full solid HR case: η, X. (f) Full solid HR case: ΔT, ωox.

In Figure 8a we can see that the efficiency of CeO2 is higher than all other materials. When considering the reduction enthalpy of the different materials, a clear trend is observed that materials with higher values of the enthalpy of oxygen vacancy formation exhibit higher efficiency values. As expected, the reduction temperature in all the optimal solutions converged to the upper bound (1700 °C), with less than 10 °C below this limit in all 80 solutions. This trend is identical to the results reported in (Li et al., 2018a). It implies the model can be modified to provide Tred as an input, thus removing one decision variable from the optimization space, potentially lowering the required computational load. However, the temperature swing varied as can be seen from Figure 8b, with most materials converging to an optimal solution with ΔT=800 °C while LCMA6464 benefitting from a large value of ΔT. When examining Figure 8f, one would expect that all materials will converge to the maximum ΔT possible since having a temperature swing does not require any sensible heating when εs=1. However, we see that only CeO2 exhibits the largest ΔT possible. While not included here for brevity, our hypothesis why materials with lower reduction enthalpies, that would benefit from a larger temperature swing, are limited in their ΔT is due to the high requirements of sensible heating of the oxidizer stream, that still has a value of εg=0.8. This type of investigation, deeply examining all the intricate effects of the different system components and their effects on the performance for different redox materials, is what we envision REDOTHERM most suitable for. Another important finding is that CeO2 and CeZr20 are the only materials that have a value of ωox below 1; all other materials require excessive amounts of steam for re-oxidation, with up to ωox=14. While known in the literature (Bayon et al., 2022; Lidor and Bulfin, 2024), this side-by-side comparison highlights the importance of examining all operating parameters and design considerations when comparing different redox-active materials.

Examining a specific subset of results, we present in Figure 9 the specific energy terms for each of the evaluated redox-active materials for the base case optimized solution (i.e., εs=0.5 and εox=0.8). The energy terms are normalized by the amount of produced H2. When examining the case of using condensation as the H2-H2O separation method (Figure 9a), it can be seen that for CeO2 and CeZr20 the specific reduction energy and specific sensible MO required heating are the dominant factors (with CeO2 as the only case when the specific reduction energy is the largest term), while for the other materials the required heat for steam generation is dominant (the required product separation work is zero, since the load is only thermal). This supports the findings presented in Figure 8, with an inverse correlation between the ease of reduction (via the reduction enthalpy) and the performance. For the case of using MVR separation (Figure 9b) the value of the required sensible MO heat is the dominant factor across all the materials, except CeO2 in which it is the second largest term, following the specific reduction energy (identical to the condensation case for CeO2).
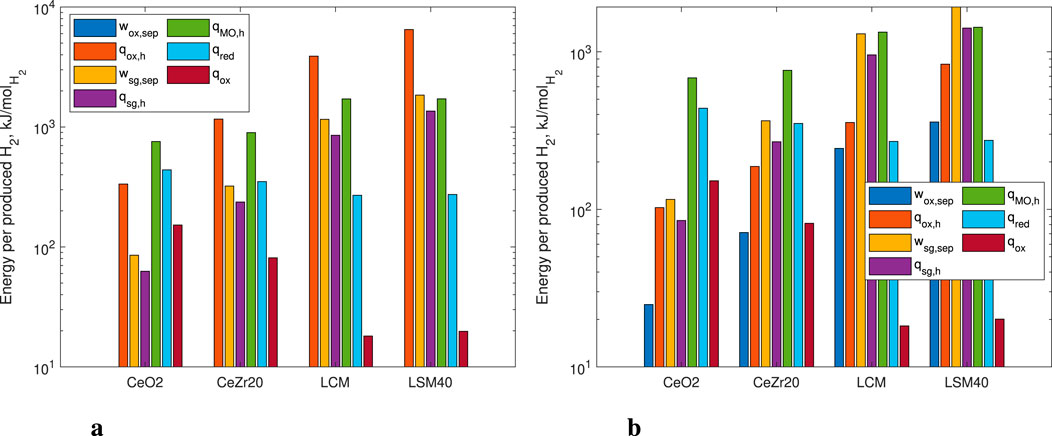
Figure 9
Bar graphs showing energy per produced hydrogen in kilojoules per mole for four materials: CeO2, CeZr2O, LCM, and LSM40. Graph (a) on the left spans an energy range from 10^1 to 10^4, while graph (b) on the right ranges from 10^1 to 10^3. Variables include \(w_{ox,sep}\), \(q_{ox,h}\), \(w_{sg,sep}\), \(q_{sg,h}\), \(q_{MQ,h}\), \(q_{red}\), and \(q_{ox}\), each represented by different colors.

Figure 9. Energy terms for different redox-active materials normalized per mole of produced H2. (a) H2-H2O separation using condensation, and (b) H2-H2O separation using MVR. All values are for the optimized solution using base case parameters: εs=0.5,εox=0.8.

The example cases shown in this section provide a brief overview of the capabilities of REDOTHERM. Extending upon them for new redox-active materials, both real and hypothetical, as well as adding more technology options for the auxiliary operations, is relatively straightforward and could support the field in the search for efficient and scalable designs.

3.3 Example of usage

In this subsection, we demonstrate the use of the REDOTHERM repository in a few types of analysis that can benefit different research activities within the TCH and chemical looping redox fields.

3.3.1 Productivity compared to efficiency and conversion

Many papers that deal with the discovery and characterization of TCH materials use the productivity (or yield) as the benchmarking performance indicator, defined as the amount of generated gaseous product (O2 for the reduction step and H2 or CO for the oxidation step) over the mass of the oxide sample, usually given in μmol g−1 (Hao et al., 2014; Yang et al., 2014; Warren et al., 2022; McCord et al., 2024). While useful for comparing different redox-active materials under identical conditions, this performance indicator is insufficient by itself to properly inform on the potential of a redox-active material and its comparison to other materials, especially under industrially-relevant process conditions. Most redox-active material characterization is performed using a thermogravimetric analyzer (TGA) or stagnation flow reactor (SFR), under conditions which supply a large excess of an inert gas during reduction and a large excess of oxidizer gas (at a controlled partial pressure) during oxidation. Hence, the obtained productivity should be treated as an ideal upper limit, since providing inert sweep gas or oxidizer in large excess can have a significant negative effect on the overall system efficiency (Equation 22) and conversion (Equation 24).

In Figure 10 we present the productivity and conversion extent for CeO2 undergoing a water splitting redox cycle as a function of the oxidizer to redox-active material molar flow rates ratio ωox. In Figure 10a the results are presented for a case in which the reduction was performed under ωred=1, simulating a case of industrially-relevant conditions, avoiding extreme excess of inert sweep gas which would require extremely large separation energy. It can be seen that under these conditions, even when supplying excess oxidizer at high purities, the productivity is lower than reported for CeO2 (Warren et al., 2022; McCord et al., 2024). More importantly is the clear trade-off that is exhibited between productivity and conversion extent; values of X0.1 are not possible for ωox>0.2. The importance of the conversion extent and the need to reach a minimal realistic value is discussed elsewhere (Bayon et al., 2022; Lidor and Bulfin, 2024). For comparison, Figure 10b presents the productivity and conversion extent as a function of ωox for a case in which the reduction was performed with a great excess of inert sweep gas (ωred). As expected, the productivity increases significantly, by about a factor of 3-4 under similar values of ωox. However, achieving X0.1 is only possible for ωox0.4, which is not a significant improvement compared to the case with lower excess sweep gas. We note the small artifacts occurring for the CF case when ωox approaches 0.001 - these are a result of numerical instabilities, which would require refining the steps of κ to resolve, significantly increasing the computational time. This analysis shows the limitations of using productivity as the sole performance indicator that guides material discovery. Since productivity is missing kinetic effects (cycle duration) and is often not evaluated under industrially-relevant conditions (gas to oxide flow rate ratios), materials that exhibit high productivity might actually underperform compared to materials which seem less promising based on this sole criteria.
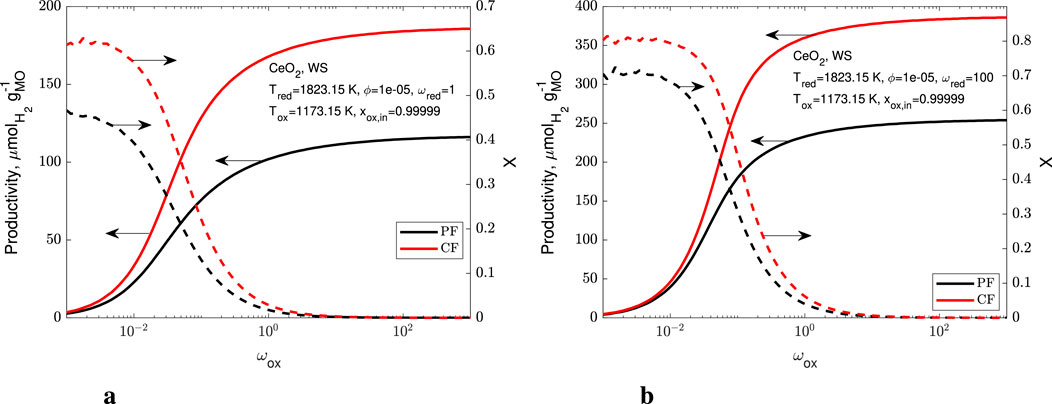
Figure 10
Two graphs labeled

Figure 10. Productivity (solid lines) and conversion extent (dashed lines) as a function of the ratio of the oxidizer molar flow rate to the redox-active material molar flow rate for CeO2 undergoing a water splitting cycle. (a) Oxidation step following reduction with ωred=1, and (b) oxidation step following reduction with ωred=100. Parameters used are Tred=1550 °C, Tox=900 °C, xO2,in=105, and xH2O,in=0.99999.

In the same manner, REDOTHERM can be used to quickly evaluate the effects of the oxidizer purity on the redox performance. While in theory a feed of pure steam (or CO2) is preferred, the relatively limited conversion of the oxidation reaction necessitates the recycling of the unreacted oxidizer gas, after separation from the product (H2 or CO). Depending on the separation technology, some trace product will be left in the oxidizer stream. The effects of this recycled product on the oxidizer conversion extent are presented in Figure 11. The analysis is performed for our base case scenario with Tred=1550 °C, Tox=900 °C, pred=1 bar, pox=1 bar, ωred=1, ωox=1, and xO2,in=105.
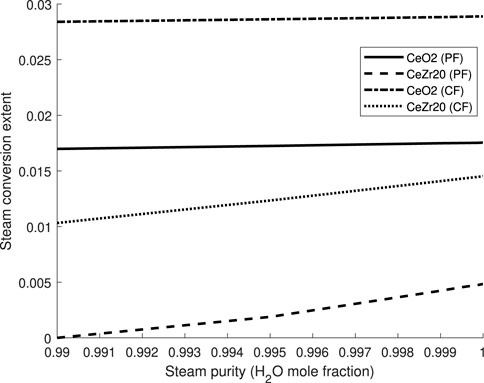
Figure 11
Graph showing steam conversion extent versus steam purity (H2O mole fraction) for different materials and conditions. Four lines represent CeO2 (PF), CeZr20 (PF), CeO2 (CF), and CeZr20 (CF), indicating varying trends in conversion extent as steam purity increases.

Figure 11. The effect of the oxidizer purity on the conversion extent for water splitting with CeO2 and CeZr20 materials for the base case with: Tred=1550 °C, Tox = 900 °C, pred=1 bar, pox=1 bar, ωred=1, ωox=1, and xO2,in=105.

From these results, we can see that CeO2 is insensitive to higher impurities, and exhibits almost constant conversion, while CeZr20 shows some decrease in the conversion as the purity drops. It is expected that other materials with lower reduction enthalpies will exhibit even larger sensitivities to oxidizer gas impurities. This type of analysis can be used to determine realistic purity requirements for different redox-active materials.

3.3.2 Implementation for system and technoeconomic analysis of a specific case study

While all the performance indicators and results calculated by REDOTHERM are either dimensionless or specific values (per mole of redox-active material), the conversion to explicit values for a specific case study is straightforward. The use of REDOTHERM to size up a process for a given H2 production capacity ṁH2 starts by converting the production capacity (usually in t d−1) to a molar production capacity ṅH2. The required steam molar flow rate is then given by Equation 26:

ṅH2O,in=ṅH2xH2,in+X,(26)

with xH2,in as the H2 mole fraction at the feed (trace H2 that remains after product separation). Assuming that xH2,in1, the difference between the total molar flow rate of the feed ṅfeed and ṅH2O,in is negligible. The required flow rate of the redox-active material is then calculated from Equation 27:

ṅMO=ṅH2O,inωox.(27)

All the specific energy terms qi and wi can then be used to calculate the required power or heat using Equation 28:

Q̇i=qiṅMO(28)

with i as the index specifying which term (i.e., inert gas separation, solid sensible heating, e.g.). From this, it is straightforward to perform sizing calculations for the auxiliary units, as well as sizing up the energy source, whether using CST or other. It can also be coupled to a hydrogen production financial model, such as ProFAST, to obtain a physics-based TEA framework (Kee and Penev, 2023).

4 Conclusion

The developed REDOTHERM model provides a comprehensive basis for analysis of different redox-based chemical looping systems for a variety of applications, with the initial focus on thermochemical hydrogen and syngas production. REDOTHERM is an open-source tool that can be used as a benchmarking tool for research and development work in this field. REDOTHERM can benefit the following activities:

1. Material discovery efforts: through quick prediction of the effects of design parameters on expected system performance, researchers could screen potential materials more efficiently, as well as couple system performance considerations to computational chemistry frameworks for designing materials with specific desired properties.

2. Reactor and system modeling: using REDOTHERM could allow reactor and system development efforts to quickly identify upper bound performance. While the model lacks detailed transport phenomena modeling, if the predicted performance for a system using REDOTHERM falls short of the target efficiency, an actual reactor/system would be unable to meet it.

3. Technoeconomic analysis (TEA): many TEA studies follow a simple ‘figure-of-merit’ approach, in which performance of different unit operations is assumed to meet a given value. While reasonable for established technologies with long operational data, when used for low technology readiness level (TRL) technologies such as redox-based chemical looping, there is not always a justification for selecting specific values. REDOTHERM could be coupled with a TEA framework to improve cost predictions and help in understanding the effects of different design and operating conditions on the cost of the product.

Natural future extensions and additions to REDOTHERM capabilities include adding models for the upstream energy generation, whether through solar thermal or other sources; including more auxiliary technology options; adding more reactor types, such as the mixed flow reactor; and adding sizing for the components, as a first step to incorporate TEA models. This open-source tool can help the research community in advancing this promising technology for various applications through a collaborative effort.

Data availability statement

The datasets presented in this study can be found in online repositories. The names of the repository/repositories and accession number(s) can be found in the article/Supplementary Material.

Author contributions

AL: Conceptualization, Data curation, Formal Analysis, Investigation, Methodology, Project administration, Validation, Visualization, Writing – original draft, Writing – review and editing. JM: Investigation, Methodology, Validation, Writing – original draft, Writing – review and editing.

Funding

The author(s) declare that financial support was received for the research and/or publication of this article. This work was authored by the National Renewable Energy Laboratory for the U.S. Department of Energy (DOE) under Contract No. DE-AC36-08GO28308. The authors gratefully acknowledge research support from the HydroGEN Advanced Water Splitting Materials Consortium, established as part of the Energy Materials Network under the U.S. Department of Energy, Office of Energy Efficiency and Renewable Energy, Fuel Cell Technologies Office, under Contract Numbers DE-EE0010732 and DE-EE0010729.

Acknowledgments

The authors would like to acknowledge the helpful comments and feedback on the model offered by Zahra Hosseinzadeh-Nik. AL would also like to thank Brendan Bulfin for the fruitful discussions on performance indicators and their relations to material properties.

Conflict of interest

The authors declare that the research was conducted in the absence of any commercial or financial relationships that could be construed as a potential conflict of interest.

Generative AI statement

The author(s) declare that no Generative AI was used in the creation of this manuscript.

Any alternative text (alt text) provided alongside figures in this article has been generated by Frontiers with the support of artificial intelligence and reasonable efforts have been made to ensure accuracy, including review by the authors wherever possible. If you identify any issues, please contact us.

Publisher’s note

All claims expressed in this article are solely those of the authors and do not necessarily represent those of their affiliated organizations, or those of the publisher, the editors and the reviewers. Any product that may be evaluated in this article, or claim that may be made by its manufacturer, is not guaranteed or endorsed by the publisher.

Supplementary material

The Supplementary Material for this article can be found online at: https://www.frontiersin.org/articles/10.3389/fenrg.2025.1665986/full#supplementary-material

References

Abanades, S., and Flamant, G. (2006). Thermochemical hydrogen production from a two-step solar-driven water-splitting cycle based on cerium oxides. Sol. Energy 80, 1611–1623. doi:10.1016/j.solener.2005.12.005

CrossRef Full Text | Google Scholar

Abanades, S., Legal, A., Cordier, A., Peraudeau, G., Flamant, G., and Julbe, A. (2010). Investigation of reactive cerium-based oxides for H2 production by thermochemical two-step water-splitting. J. Mater. Sci. 45, 4163–4173. doi:10.1007/s10853-010-4506-4

CrossRef Full Text | Google Scholar

Ackermann, S., Takacs, M., Scheffe, J., and Steinfeld, A. (2017). Reticulated porous ceria undergoing thermochemical reduction with high-flux irradiation. Int. J. Heat Mass Transf. 107, 439–449. doi:10.1016/j.ijheatmasstransfer.2016.11.032

CrossRef Full Text | Google Scholar

Adanez, J., Abad, A., Garcia-Labiano, F., Gayan, P., and De Diego, L. F. (2012). Progress in chemical-looping combustion and reforming technologies. Prog. energy Combust. Sci. 38, 215–282. doi:10.1016/j.pecs.2011.09.001

CrossRef Full Text | Google Scholar

Bayon, A., de la Calle, A., Stechel, E. B., and Muhich, C. (2022). Operational limits of redox metal oxides performing thermochemical water splitting. Energy Technol. 10, 2100222–11. doi:10.1002/ente.202100222

CrossRef Full Text | Google Scholar

Bell, I. H., Wronski, J., Quoilin, S., and Lemort, V. (2014). Pure and pseudo-pure fluid thermophysical property evaluation and the open-source thermophysical property library CoolProp. Industrial and Eng. Chem. Res. 53, 2498–2508. doi:10.1021/ie4033999

PubMed Abstract | CrossRef Full Text | Google Scholar

Budama, V. K., Brendelberger, S., Roeb, M., and Sattler, C. (2022). Performance analysis and optimization of solar thermochemical water-splitting cycle with single and multiple receivers. Energy Technol. 10, 2100220. doi:10.1002/ente.202100220

CrossRef Full Text | Google Scholar

Bulfin, B. (2019). Thermodynamic limits of countercurrent reactor systems, with examples in membrane reactors and the ceria redox cycle. Phys. Chem. Chem. Phys. 21, 2186–2195. doi:10.1039/C8CP07077F

PubMed Abstract | CrossRef Full Text | Google Scholar

Bulfin, B., Call, F., Lange, M., Lübben, O., Sattler, C., Pitz-Paal, R., et al. (2015). Thermodynamics of CeO2 thermochemical fuel production. Energy and Fuels 29, 1001–1009. doi:10.1021/ef5019912

CrossRef Full Text | Google Scholar

Bulfin, B., Hoffmann, L., de Oliveira, L., Knoblauch, N., Call, F., Roeb, M., et al. (2016). Statistical thermodynamics of non-stoichiometric ceria and ceria zirconia solid solutions. Phys. Chem. Chem. Phys. 18, 23147–23154. doi:10.1039/C6CP03158G

PubMed Abstract | CrossRef Full Text | Google Scholar

Bulfin, B., Miranda, M., and Steinfeld, A. (2021). Performance indicators for benchmarking solar thermochemical fuel processes and reactors. Front. Energy Res. 9, 677980–12. doi:10.3389/fenrg.2021.677980

CrossRef Full Text | Google Scholar

Carrillo, R. J., and Scheffe, J. R. (2019). Beyond ceria: theoretical investigation of isothermal and near-isothermal redox cycling of perovskites for solar thermochemical fuel production. Energy and Fuels 33, 12871–12884. doi:10.1021/acs.energyfuels.9b02714

CrossRef Full Text | Google Scholar

Chueh, W. C., Falter, C., Abbott, M., Scipio, D., Furler, P., Haile, S. M., et al. (2010). High-flux solar-driven thermochemical dissociation of CO2 and H2O using ceria redox reactions. Science 330, 1797–1801. doi:10.1126/science.1197834

PubMed Abstract | CrossRef Full Text | Google Scholar

de la Calle, A., Ermanoski, I., and Stechel, E. B. (2022). Towards chemical equilibrium in thermochemical water splitting. part 1: thermal reduction. Int. J. Hydrogen Energy 47, 10474–10482. doi:10.1016/j.ijhydene.2021.07.167

CrossRef Full Text | Google Scholar

de la Calle, A., Ermanoski, I., Miller, J. E., and Stechel, E. B. (2024). Towards chemical equilibrium in thermochemical water splitting. Part 2: Re-oxidation. Int. J. Hydrogen Energy 72, 1159–1168. doi:10.1016/j.ijhydene.2024.05.298

CrossRef Full Text | Google Scholar

Ehrhart, B. D., Muhich, C. L., Al-Shankiti, I., and Weimer, A. W. (2016). System efficiency for two-step metal oxide solar thermochemical hydrogen production – Part 2: impact of gas heat recuperation and separation temperatures. Int. J. Hydrogen Energy 41, 19894–19903. doi:10.1016/j.ijhydene.2016.07.110

CrossRef Full Text | Google Scholar

Fan, L.-S. (2011). Chemical looping systems for fossil energy conversions. John Wiley and Sons.

CrossRef Full Text | Google Scholar

Gokon, N., Mataga, T., Kondo, N., and Kodama, T. (2011). Thermochemical two-step water splitting by internally circulating fluidized bed of NiFe2O4 particles: successive reaction of thermal-reduction and water-decomposition steps. Int. J. Hydrogen Energy 36, 4757–4767. doi:10.1016/j.ijhydene.2011.01.076

CrossRef Full Text | Google Scholar

Goodwin, D. G., Moffat, H. K., Schoegl, I., Speth, R. L., and Weber, B. W. (2023). Cantera: an object-oriented software toolkit for chemical kinetics, thermodynamics, and transport processes. doi:10.5281/zenodo.8137090

CrossRef Full Text | Google Scholar

Hao, Y., Yang, C.-K., and Haile, S. M. (2014). Ceria–zirconia solid solutions (Ce1-xZrxO2-δ, x ≤ 0.2) for solar thermochemical water splitting: a thermodynamic study. Chem. Mater. 26, 6073–6082. doi:10.1021/cm503131p

CrossRef Full Text | Google Scholar

Hathaway, B. J., Bala Chandran, R., Gladen, A. C., Chase, T. R., and Davidson, J. H. (2016). Demonstration of a solar reactor for carbon dioxide splitting via the isothermal ceria redox cycle and practical implications. Energy and Fuels 30, 6654–6661. doi:10.1021/acs.energyfuels.6b01265

CrossRef Full Text | Google Scholar

Kathe, M., Empfield, A., Sandvik, P., Fryer, C., Zhang, Y., Blair, E., et al. (2017). Utilization of CO2 as a partial substitute for methane feedstock in chemical looping methane–steam redox processes for syngas production. Energy and Environ. Sci. 10, 1345–1349. doi:10.1039/c6ee03701a

CrossRef Full Text | Google Scholar

Kee, J., and Penev, M. M. (2023). ProFAST production financial analysis scenario tool SWR-23-88. Golden, CO: Tech. rep., National Renewable Energy Laboratory.

Google Scholar

Lany, S. (2024). Chemical potential analysis as an alternative to the van’t hoff method: hypothetical limits of solar thermochemical hydrogen. J. Am. Chem. Soc. 146, 14114–14127. doi:10.1021/jacs.4c02688

PubMed Abstract | CrossRef Full Text | Google Scholar

Li, S., Wheeler, V. M., Kreider, P. B., Bader, R., and Lipiński, W. (2018a). Thermodynamic analyses of fuel production via solar-driven non-stoichiometric metal oxide redox cycling. Part 2. Impact of solid–gas flow configurations and active material composition on system-level efficiency. Energy and Fuels 32, 10848–10863. doi:10.1021/acs.energyfuels.8b02082

CrossRef Full Text | Google Scholar

Li, S., Wheeler, V. M., Kreider, P. B., and Lipiński, W. (2018b). Thermodynamic analyses of fuel production via solar-driven non-stoichiometric metal oxide redox cycling. Part 1. Revisiting flow and equilibrium assumptions. Energy and Fuels 32, 10838–10847. doi:10.1021/acs.energyfuels.8b02081

CrossRef Full Text | Google Scholar

Lidor, A. (2024). Hydrogen–steam separation using mechanical vapor recompression cycle. Int. J. Hydrogen Energy 94, 664–668. doi:10.1016/j.ijhydene.2024.11.040

CrossRef Full Text | Google Scholar

Lidor, A., and Bulfin, B. (2024). A critical perspective and analysis of two-step thermochemical fuel production cycles. Sol. Compass 11, 100077. doi:10.1016/j.solcom.2024.100077

CrossRef Full Text | Google Scholar

Lidor, A., and Zimmermann, L. (2023). Experimental demonstration of high-temperature heat recovery in a solar reactor. Sol. Energy 262, 111915. doi:10.1016/j.solener.2023.111915

CrossRef Full Text | Google Scholar

Lidor, A., Fend, T., Roeb, M., and Sattler, C. (2021). High performance solar receiver–reactor for hydrogen generation. Renew. Energy 179, 1217–1232. doi:10.1016/j.renene.2021.07.089

CrossRef Full Text | Google Scholar

Lidor, A., Aschwanden, Y., Häseli, J., Reckinger, P., Haueter, P., and Steinfeld, A. (2023). High-temperature heat recovery from a solar reactor for the thermochemical redox splitting of H2O and CO2. Appl. Energy 329, 120211. doi:10.1016/j.apenergy.2022.120211

CrossRef Full Text | Google Scholar

Ma, Z., Gifford, J., Wang, X., and Martinek, J. (2023). Electric-thermal energy storage using solid particles as storage media. Joule 7, 843–848. doi:10.1016/j.joule.2023.03.016

CrossRef Full Text | Google Scholar

Mao, Y., Gao, Y., Dong, W., Wu, H., Song, Z., Zhao, X., et al. (2020). Hydrogen production via a two-step water splitting thermochemical cycle based on metal oxide–a review. Appl. energy 267, 114860. doi:10.1016/j.apenergy.2020.114860

CrossRef Full Text | Google Scholar

McCord, D. C., Gager, E. J., Wang, X., Johnson, T. L., Beachy, J. S., King, K. A., et al. (2024). Solar thermochemical redox cycling using ga- and al-doped lsm perovskites for renewable hydrogen production. J. Phys. Chem. C 128, 15796–15806. doi:10.1021/acs.jpcc.4c02797

CrossRef Full Text | Google Scholar

McDaniel, A. H., Miller, E. C., Arifin, D., Ambrosini, A., Coker, E. N., O’Hayre, R., et al. (2013). Sr- and Mn-doped LaAlO3-δ for solar thermochemical H 2 and CO production. Energy Environ. Sci. 6, 2424–2428. doi:10.1039/c3ee41372a

CrossRef Full Text | Google Scholar

Nakamura, T. (1977). Hydrogen production from water utilizing solar heat at high temperatures. Sol. Energy 19, 467–475. doi:10.1016/0038-092X(77)90102-5

CrossRef Full Text | Google Scholar

Panlener, R. J., Blumenthal, R. N., and Garnier, J. E. (1975). A thermodynamic study of nonstoichiometric cerium dioxide. J. Phys. Chem. Solids 36, 1213–1222. doi:10.1016/0022-3697(75)90192-4

CrossRef Full Text | Google Scholar

Patankar, A. S., Wu, X.-Y., Choi, W., Tuller, H. L., and Ghoniem, A. F. (2022). A reactor train system for efficient solar thermochemical fuel production. J. Sol. Energy Eng. 144, 061014–12. doi:10.1115/1.4055298

CrossRef Full Text | Google Scholar

Romero, M., and Steinfeld, A. (2012). Concentrating solar thermal power and thermochemical fuels. Energy Environ. Sci. 5, 9234–9245. doi:10.1039/c2ee21275g

CrossRef Full Text | Google Scholar

Scheffe, J. R., and Steinfeld, A. (2014). Oxygen exchange materials for solar thermochemical splitting of H2O and CO2: a review. Mater. Today 17, 341–348. doi:10.1016/j.mattod.2014.04.025

CrossRef Full Text | Google Scholar

Siegel, N. P., Miller, J. E., Ermanoski, I., Diver, R. B., and Stechel, E. B. (2013). Factors affecting the efficiency of solar driven metal oxide thermochemical cycles. Industrial and Eng. Chem. Res. 52, 3276–3286. doi:10.1021/ie400193q

CrossRef Full Text | Google Scholar

Steinfeld, A. (2005). Solar thermochemical production of hydrogen - a review. Sol. Energy 78, 603–615. doi:10.1016/j.solener.2003.12.012

CrossRef Full Text | Google Scholar

Thanda, V., Fend, T., Laaber, D., Lidor, A., von Storch, H., Säck, J., et al. (2022). Experimental investigation of the applicability of a 250 kW ceria receiver/reactor for solar thermochemical hydrogen generation. Renew. Energy 198, 389–398. doi:10.1016/j.renene.2022.08.010

CrossRef Full Text | Google Scholar

The MathWorks Inc. (2023). MATLAB version: 23.2.0.2428915 (R2023b) Update 4.

Google Scholar

Tran, J. T., Warren, K. J., Mejic, D., Anderson, R. L., Jones, L., Hauschulz, D. S., et al. (2023). Pressure-enhanced performance of metal oxides for thermochemical water and carbon dioxide splitting. Joule 7, 1759–1768. doi:10.1016/j.joule.2023.07.016

CrossRef Full Text | Google Scholar

Vieten, J., Bulfin, B., Huck, P., Horton, M., Guban, D., Zhu, L., et al. (2019). Materials design of perovskite solid solutions for thermochemical applications. Energy and Environ. Sci. 12, 1369–1384. doi:10.1039/c9ee00085b

CrossRef Full Text | Google Scholar

Warren, K. J., and Weimer, A. W. (2022). Solar thermochemical fuels: present status and future prospects. Sol. Compass 1, 100010. doi:10.1016/j.solcom.2022.100010

CrossRef Full Text | Google Scholar

Warren, K. J., Tran, J. T., and Weimer, A. W. (2022). A thermochemical study of iron aluminate-based materials: a preferred class for isothermal water splitting. Energy Environ. Sci. 15, 806–821. doi:10.1039/d1ee02679h

CrossRef Full Text | Google Scholar

Wexler, R. B., Gautam, G. S., Bell, R. T., Shulda, S., Strange, N. A., Trindell, J. A., et al. (2023). Multiple and nonlocal cation redox in ca–ce–ti–mn oxide perovskites for solar thermochemical applications. Energy and Environ. Sci. 16, 2550–2560. doi:10.1039/d3ee00234a

CrossRef Full Text | Google Scholar

Wilson, S. A., Sarsam, P. W., Stechel, E. B., and Muhich, C. L. (2024). Extracting metal oxide redox thermodynamics from tga measurements requires moving beyond the linearized van ’t hoff approach. Front. Energy Res. 12, 1470010–1472024. doi:10.3389/fenrg.2024.1470010

CrossRef Full Text | Google Scholar

Yang, C.-K., Yamazaki, Y., Aydin, A., and Haile, S. M. (2014). Thermodynamic and kinetic assessments of strontium-doped lanthanum manganite perovskites for two-step thermochemical water splitting. J. Mater. Chem. A 2, 13612–13623. doi:10.1039/C4TA02694B

CrossRef Full Text | Google Scholar

Zang, G., Sun, P., Elgowainy, A. A., Bafana, A., and Wang, M. (2021). Performance and cost analysis of liquid fuel production from h2 and co2 based on the fischer-tropsch process. J. CO2 Util. 46, 101459. doi:10.1016/j.jcou.2021.101459

CrossRef Full Text | Google Scholar

Zhao, X., Zhou, H., Sikarwar, V. S., Zhao, M., Park, A.-H. A., Fennell, P. S., et al. (2017). Biomass-based chemical looping technologies: the good, the bad and the future. Energy and Environ. Sci. 10, 1885–1910. doi:10.1039/c6ee03718f

CrossRef Full Text | Google Scholar

Zinkevich, M., Djurovic, D., and Aldinger, F. (2006). Thermodynamic modelling of the cerium–oxygen system. Solid State Ionics 177, 989–1001. doi:10.1016/j.ssi.2006.02.044

CrossRef Full Text | Google Scholar

Nomenclature

Roman symbols

HHV Higher heating value, J mol−1

jA Molar flux of species A from flow 1 to flow 2, mol m−1 s−1

K Equilibrium constant

ṅ Molar flow rate, mol s−1

p Reactor pressure, Pa

p° Reference pressure, Pa

pO2 Oxygen partial pressure, Pa

q Specific heat, J mol−1

Q̇ Heat transfer rate, W

R Universal gas constant, kJ mol−1 K−1

T Temperature, K

w Specific work, J mol−1

Ẇ Power, W

X Conversion extent

x Mole fraction

Greek symbols

δ Deviation from non-stoichiometry

Δδ Extent of reduction

Δϕ Change in oxygen content in the redox-active material

ΔG Gibbs free energy of reaction, kJ mol−1

ε Heat recovery effectiveness

η System efficiency

κ Species exchange coordinate

μ Chemical potential, kJ mol−1

ω Ratio between gas and solid molar flow rates

ϕ Oxygen content in the redox-active material

Subscripts

f final state

fuel Fuel

g gas phase

in Inlet

MO Metal oxide

out Outlet

ox Oxidation

prod Product

reac Reactant

red Reduction

req Required for the entire process

sg Sweep gas

s solid phase

Superscripts

ox Oxidation

red Reduction

Keywords: chemical looping, solar thermochemical hydrogen production, system modeling, advanced water splitting, thermodynamic modeling

Citation: Lidor A and Martinek J (2025) REDOTHERM: a thermodynamic modeling framework for redox-based thermochemical processes. Front. Energy Res. 13:1665986. doi: 10.3389/fenrg.2025.1665986

Received: 14 July 2025; Accepted: 15 September 2025;
Published: 07 October 2025.

Edited by:

Julie Mougin, CEA/LITEN, France

Reviewed by:

Abhishek Kumar Singh, University of Twente, Netherlands
Alberto De La Calle, Spanish National Research Council (CSIC), Spain

Copyright © 2025 Lidor and Martinek. This is an open-access article distributed under the terms of the Creative Commons Attribution License (CC BY). The use, distribution or reproduction in other forums is permitted, provided the original author(s) and the copyright owner(s) are credited and that the original publication in this journal is cited, in accordance with accepted academic practice. No use, distribution or reproduction is permitted which does not comply with these terms.

*Correspondence: Alon Lidor, YWxvbi5saWRvckBucmVsLmdvdg==

Disclaimer: All claims expressed in this article are solely those of the authors and do not necessarily represent those of their affiliated organizations, or those of the publisher, the editors and the reviewers. Any product that may be evaluated in this article or claim that may be made by its manufacturer is not guaranteed or endorsed by the publisher.