 Jie Liu1
 Wei Wang
 Yutao Kang
- 1College of Ocean Science and Engineering, Shanghai Maritime University, Shanghai, China
- 2The Fifth Laboratory, Shanghai Fire Science and Technology Research Institute of MEM, Shanghai, China
- 3Hohhot Fire and Rescue Detachment, Inner Mongolia Autonomous Region Fire and Rescue Brigade, Hohhot, Inner Mongolia, China
Lithium-ion batteries (LIBs) are extensively used worldwide in the field of electric bicycles. However, the integration of LIBs that exceed the standards in certain electric bicycles has been associated with a significant increase in the propensity for fire-related hazards. In this study, the combustion behavior of electric bicycle ternary LIBs that exceed the standards was investigated through full-scale fire tests conducted in cabinet environments. LIB packs at two states of charge (SOC), 80% and 60%, were systematically exposed to controlled thermal abuse. This enabled comprehensive characterization of their combustion behavior and thermal propagation dynamics following ignition. The experimental results demonstrated that thermal runaway (TR) was initiated at 300 °C and progressed through four distinct phases: stable temperature rise (15 °C–20 °C/s), smoke-emitting TR, jet flame overflow, and stable combustion. The smoke emission duration was extended to 480 s under the 60% SOC condition, representing a 35% increase compared with 80% SOC, while the jet flame overflow duration was reduced by 200 s. The total smoke production at 60% SOC was eight times greater than that at 80% SOC, corresponding to a 57% increase in the peak heat release rate (107 kW vs. 68 kW). The vertical flame spread intensity under closed cabinet conditions exhibited a 3.3:1 predominance over horizontal propagation, with the maximum ceiling temperature reaching 495 °C (80% SOC), compared with <150 °C in the lateral compartments. These findings establish critical benchmarks for fire suppression system design in LIBs storage applications.
1 Introduction
China is a major player in both the production and consumption of electric bicycles, with the current domestic fleet exceeding 350 million units (Ministry of Industry and Information Technology of the People’s Republic of China, 2024). The rapid proliferation of electric bicycles has created a significant demand for charging infrastructure, particularly for delivery workers to address the need for frequent power replenishment during extended operational cycles. This urgent need has unfortunately led to hazardous charging practices, including removal of batteries for indoor charging, resulting in numerous fire incidents that have caused substantial property damage and personal injuries. In response to these safety challenges, battery swap cabinet systems have emerged as effective alternative charging solutions specifically designed to mitigate fire risks through controlled charging environments (Ângelo, 2022). In this method, batteries that require charging are placed in a cabinet and exchanged for fully charged batteries, greatly enhancing the charging efficiency. This method is being actively promoted and adopted. However, the inherent high fire risk associated with lithium-ion batteries (LIBs), combined with frequent charging and swapping operations, significantly elevates the fire risk in battery swap cabinets. Moreover, because batteries at different states of charge (SOC) are often stored together in the same cabinet, localized fires can ignite other batteries, causing the fire to spread and significantly increase the scale of the disaster. (Liu et al., 2023). A representative incident occurred in September 2023 within a LIBs swap cabinet in Longyan city, Fujian Province, in which a thermal runaway (TR) event that generated dense smoke plumes occurred. Subsequent forensic analysis by the Fujian Fire Investigation Unit attributed the ignition source to a battery management system failure that occurred during deep-cycle charging operations. These incidents underscore an urgent scientific imperative: comprehensive understanding of the TR and fire characteristics of LIBs, particularly the overcapacity units prevalent in modified electric bicycles, under varied SOC conditions within the confined, compartmentalized environments of charging cabinets.
The SOC is a critical factor influencing the severity of TR and fire propagation in LIBs (Yu et al., 2025). Higher SOC levels generally lead to more severe TR events, characterized by higher peak temperatures, greater pressure rise, increased gas generation, and more intense exothermic reactions, which collectively heighten fire and explosion risks (Galushkin et al., 2018; Oh et al., 2024; Doose et al., 2023; Lai et al., 2024). Experimental studies show that fully charged cells can reach maximum temperatures exceeding 900 °C during TR, while reducing SOC significantly lowers both the peak temperature and the amount of hazardous gas released (Xie et al., 2020). Lowering SOC also delays the propagation of TR between cells in a battery module, resulting in less violent reactions and providing more time for intervention or mitigation (Theiler et al., 2024; Wu et al., 2023). The underlying mechanism is that higher SOC means more stored energy and a greater quantity of reactive lithium ions, which intensifies the exothermic reactions during failure (Galushkin et al., 2018; Oh et al., 2024; Doose et al., 2023).
Both modeling and experimental work confirm that reducing SOC—either uniformly or selectively within a LIB pack—can be an effective strategy to mitigate the severity and spread of TR (Xie et al., 2020; Theiler et al., 2024; Zhang et al., 2022). These findings underscore the importance of SOC management in battery safety design, early warning systems, and operational protocols for LIB systems (Theiler et al., 2024; Wu et al., 2023). However, the conclusions drawn from the aforementioned studies are primarily based on standardized, specification-compliant LIBs (e.g., 18,650, 21,700 cylindrical cells, or standard pouch cells (Sallard et al., 2025; Feng et al., 2018; Shahid and Agelin-Chaab, 2022). The scenario becomes considerably more complex in practical applications, particularly within the electric bicycle (E-bike) domain (Yu et al., 2024). On one hand, E-bike batteries often utilize cathode chemistries such as lithium iron phosphate (LFP) or high-nickel ternary systems (NMC), which inherently possess different energy density profiles and thermal stability (García et al., 2022; Schöberl et al., 2024; Hong et al., 2024); On the other hand, the prevalent use of “overcapacity batteries” – cells modified to exceed original manufacturer specifications for voltage and capacity–to meet the demand for longer range, demonstrates a markedly elevated risk of TR due to their altered safety margins. Research indicates that these high-capacity, high-energy-density batteries release a substantially greater amount of energy during TR, leading to a multiplicative increase in the severity of incidents such as fires and explosions. This critical trade-off between high energy density and safety constitutes a central challenge for the safety of advanced LIBs (Shahid and Agelin-Chaab, 2022; Feng et al., 2020; Wang et al., 2023). Experimental and modeling results consistently indicate that larger battery capacity is correlated with increased hazardous parameters during TR, including a lower trigger temperature, a higher maximum temperature rise, and greater flame intensity, alongside an accelerated propagation rate (Huang et al., 2024; Zhou et al., 2024; Zhang Y. et al., 2024). Furthermore, abusive conditions such as overcharging, over-discharging, and high-rate cycling can further compromise the thermal stability of overcapacity batteries, significantly increasing both the likelihood and severity of a TR event (Jindal and Bhattacharya, 2019; Bi et al., 2023). Studies have also revealed that the volume of gas emitted and the flame temperature during TR in overcapacity batteries are substantially higher than those in standard batteries, markedly increasing the risk of cascading failure and catastrophic incidents (Huang et al., 2024; Zhang Y. et al., 2024). However, the vast majority of existing research on the effects of SOC on safety has not incorporated these widely used yet high-risk overcapacity batteries into its scope. Furthermore, significant challenges remain in translating laboratory-based findings into practical fire prevention and control strategies, particularly for centralized electric bicycle charging cabinet scenarios. Current research, predominantly conducted in open spaces or standard combustion chambers and focused on measuring fundamental fire parameters of individual cells or small-scale modules, fails to capture the fire development characteristics under real-world conditions involving multiple batteries, confined spaces, and restricted ventilation typical of charging cabinets (Liming et al., 2022). Within such confined spaces, the influence of SOC on TR propagation is likely amplified, leading to heightened fire risks (Mao et al., 2024). Consequently, in a cabinet storing batteries at varying SOCs, a TR event in a high-SOC battery can readily act as an ignition source, potentially triggering a cascading failure. However, systematic experimental data quantifying these risks within this specific, practical context remain scarce, highlighting a critical need for targeted research to inform accurate risk assessment and effective mitigation strategies (Theiler et al., 2024; Ying et al., 2023; Song et al., 2022).
To address these critical knowledge gaps, this study presents a comprehensive experimental investigation into the TR and fire characteristics of overcapacity LIBs used in electric bicycles under varied SOCs (60% and 80% SOC) within a realistic charging cabinet configuration. The research employs full-scale fire tests on specially-assembled battery modules, with specifications exceeding standard limits, to quantify critical fire parameters including heat release rate (HRR), smoke production, temperature distribution, and flame propagation dynamics. The findings aim to establish essential benchmarks for the safety design of charging infrastructure and provide the first systematic dataset linking SOC to the fire behavior of overcapacity batteries in confined spaces. The remainder of this paper is organized as follows: Section 2 describes the experimental methodology, Section 3 presents and discusses the results, and Section 4 summarizes the key conclusions.
2 Experimental
2.1 Battery samples
An 8-series-2-parallel lithium nickel cobalt manganese oxide (Li(NiCoMn)O2) battery module designed for electric bicycles was investigated. The detailed parameters of the module are presented in Table 1. The module consisted of 17 prismatic compartments arranged in a 280 mm (L) × 400 mm (W) × 80 mm (H) configuration, delivering a 60 V nominal voltage and a 55 Ah rated capacity. During testing, modules at 60% and 80% SOC were subjected to controlled thermal abuse via heating plates under 5 °C/min temperature ramping until TR initiation.
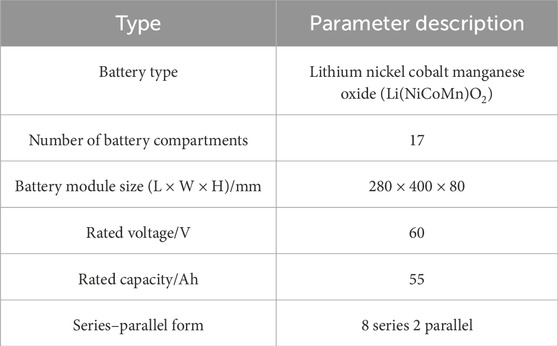
Table 1. Summary of the performance parameters for lithium battery modules.
2.2 Experimental apparatus
Based on the ISO 9705 full-scale test platform, the entire experimental system was configured as illustrated in Figure 1. TC and heating plates were strategically installed both on the battery and inside the cabinet, with all TC connected to a data acquisition system. The battery, positioned vertically with heating plates at the bottom, was equipped with ten internal TC (TC1–TC10) distributed across its body before being resealed for testing. Inside the cabinet, which was divided into eight sections, the battery was placed in Cabinet No. 5, and ten additional TC (TC11–TC20) were arranged to monitor ambient conditions. The setup was surrounded by six cameras: three primary units (Cameras 1–3) positioned in front of the cabinet to capture combustion behavior, and three auxiliary units (Cameras 4–6) providing supplementary angles from the right side, lower-left floor, and upper-right wall. During experiments, the cabinet doors remained sealed, heating was controlled remotely, and smoke produced during testing was vented through a rooftop chimney for analysis via a gas analyzer. (The configuration of the experimental apparatus is illustrated in Figure 1 on the following page).
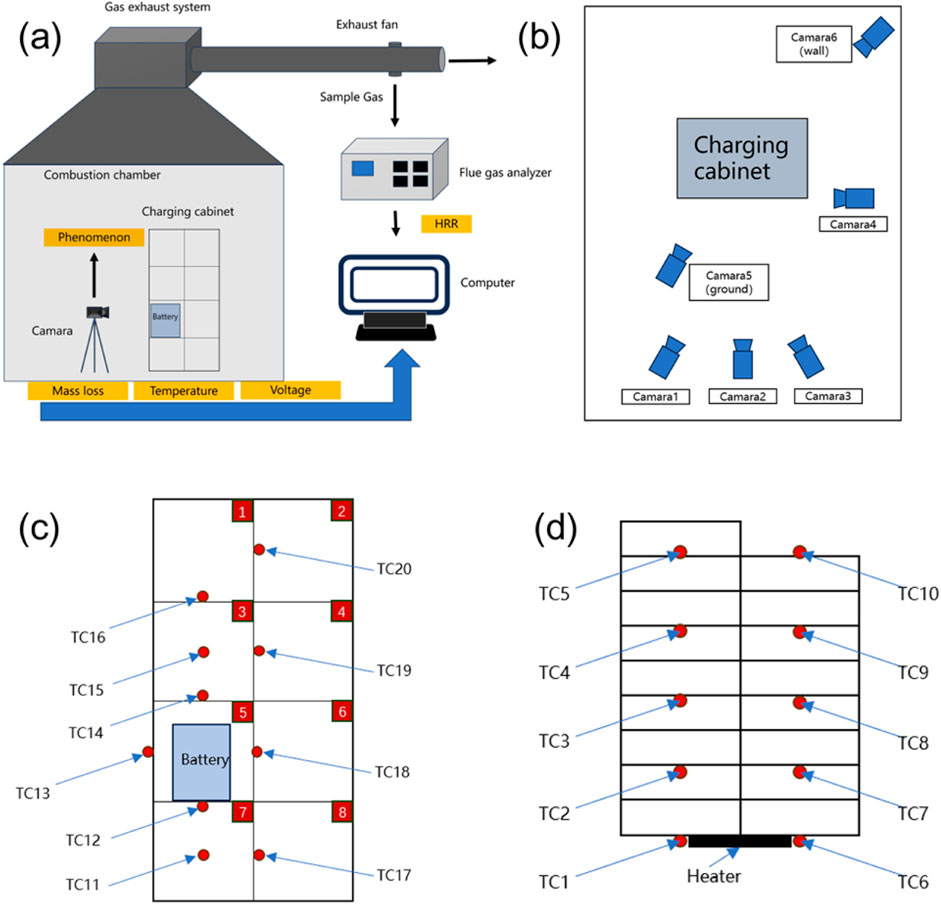
Figure 1. Schematic of the experimental setup: (a) overall system configuration based on the ISO 9705 test platform; (b) internal TC distribution (TC1-TC10) within the battery; (c) TC arrangement (TC11-TC20) inside the cabinet sections; (d) layout of the primary and auxiliary cameras surrounding the cabinet.
2.3 Experimental methods
The experiment was conducted under two distinct operating conditions, corresponding to 80% SOC and 60% SOC. Under both conditions, the same experimental layout was employed, with the only difference being the SOC level; all the other factors remained identical.
The experimental investigation examined two distinct SOCs (60% and 80%) to evaluate TR characteristics. Given the destructive nature of these tests and the high degree of control over experimental parameters, a single well-controlled experiment was conducted for each SOC condition. The SOC was precisely set by charging fresh cells at a constant current (1C) until the battery management system confirmed reaching the target capacity. HRR was quantified using oxygen consumption calorimetry (cone calorimeter, FTT) following ISO 5660–1 standard, with a fixed radiant heat flux of 50 kW/m2. To ensure methodological reproducibility despite the single-test design, we implemented rigorous controls: all equipment was calibrated following manufacturer specifications before testing; environmental conditions (temperature, humidity) were maintained constant throughout experiments; and all experimental parameters were meticulously documented. This approach ensures that the methodology itself is reproducible and that the obtained data provide a reliable representation of the phenomena under investigation.
3 Results and discussion
3.1 Typical fire parameters
3.1.1 Thermal runaway progress
Video monitoring serves as a fundamental tool in the study of LIB fire propagation, enabling real-time observation of dynamic combustion processes (Kwon et al., 2024). This technique captures critical phenomena such as flame spread, smoke formation, and temperature fluctuations, which are essential for understanding fire behavior mechanisms. High-resolution imaging further permits detailed analysis of flame characteristics—including shape, size, and height—facilitating accurate extraction of key fire parameters. Among various experimental factors, temporal resolution is especially important, making video recording an indispensable method for capturing time-dependent data. In this section, Figures 2, 3 depict the impact of time-related changes on the voltage and experimental phenomena at different SOCs.
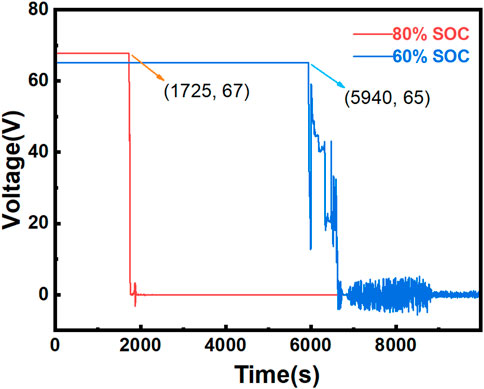
Figure 2. Comparison of voltage changes under different SOCs.

Figure 3. Comparison of thermal runaway characteristics at 80% SOC (a–d) and 60% SOC (e–k). (a) 0s, heating. (b) 1730s, venting and jet fire. (c) 2400s, stable combustion. (d) 3470s, extinguishment. (e) 0s, heating. (f) 6000s, venting (1). (g) 6200s, venting (2). (h) 6333s, venting (3). (i) 6485s, venting and jet fire. (j) 6905s, stable combustion. (k) 13360s, distinguishment.
Figure 2 clearly shows that the initial voltages of the ternary LIBs at various SOC levels differ (Zhong et al., 2019). As the SOC decreases, the initial voltage also decreases, with a reduction of approximately 2 V for every 20% drop in the SOC. This behavior can be attributed to the decrease in the lithium-ion concentration within the battery as the SOC decreases, which in turn reduces the electromotive force of the battery and leads to a decrease in the initial voltage. The voltage variation is closely linked to the onset of TR. Prior to TR, the voltage remains stable, but once TR occurs, the voltage rapidly drops. Specifically, at 80% SOC, the voltage begins to drop and reaches zero by 1725 s, whereas at 60% SOC, the voltage fluctuates several times before eventually reaching 0. To investigate the underlying causes of these patterns, further analysis of video data is required.
The development of fire inside the cabinet during the experiment is detailed in Figure 3. LIB combustion typically occurs in four stages.
1. Stable Heating Phase: During this phase, the temperature of the battery linearly increases without noticeable phenomena. This phase corresponds to 0–1730 s for the 80% SOC condition and 0–6,000 s for the 60% SOC condition.
2. TR and Smoke Emission Phase: In this phase, some of the battery compartments undergo TR, resulting in the release of smoke. This phase corresponds to 1725–1730 s for the 80% SOC condition and 6,000–6,485 s for the 60% SOC condition.
3. Jet Fire Overflow Phase: In this phase, the emitted smoke is ignited, causing flames to appear in a jet-like form. This phase corresponds to 1730–2,400 s for the 80% SOC condition and 4,685–6,905 s for the 60% SOC condition.
4. Stable Combustion to Extinction Phase: During this phase, the combustible gases have been fully released from the battery compartments, and the remaining combustible materials continue to stably burn until extinguishment. This phase corresponds to 2,400–3,470 s for the 80% SOC condition and 6,905–13360 s for the 60% SOC condition. By correlating voltage changes with video observations, the combustion stages of the battery can be precisely determined. As shown in Figure 3, at 1725 s, the LIBs at 80% SOC undergo TR, leading to a rapid voltage drop. Heating immediately stops at this point. At 1730 s, a small amount of white smoke begins to be emitted from the battery, followed by a violent combustion event. After the explosive combustion, the flames briefly contract before stabilizing and continuing to burn. For the 60% SOC condition, at 5,940 s, the voltage rapidly drops, indicating the onset of TR at 6,000 s. Smoke starts to form and spread during this period. Over the following 500 s, video footage reveals that individual compartments gradually experience TR, causing repeated smoke emissions. The voltage fluctuates multiple times during this phase. At 6,485 s, the battery explodes, and the voltage sharply drops to 0. The 60% SOC condition exhibited repeated voltage fluctuations. This is because the battery did not immediately catch fire after TR, allowing internal electrochemical reactions to persist during an extended smoke release period. Instead, there is an extended period during which significant smoke is released, and electrochemical reactions continue inside the battery. Consequently, the voltage does not abruptly drop to zero but rather exhibits wave-like fluctuations. Based on these experimental observations, high-SOC (80%) batteries clearly exhibit poorer thermal stability than low-SOC (60%) batteries. The low-SOC battery generates flames only after multiple smoke releases, whereas the high-SOC battery produces flames immediately after the first TR, making it more hazardous.
A comparison of the phenomena at different SOC levels in Figure 3 reveals that under the 60% SOC condition, smoke is released three times before open flames appear, whereas under the 80% SOC condition, smoke release is immediately followed by ignition. To investigate this phenomenon shown in the video, two typical fire parameters—the total smoke production (TSP) and the smoke production rate (SPR)—were analyzed. As shown in Figure 4, the combustion under the 80% SOC condition is intense and explosive, causing smoke to be insufficiently released before ignition. This leads to lower TSP and SPR, which correspond to the intense, low-smoke combustion observed. In contrast, under the 60% SOC condition, the fire is more stable, with a longer combustion duration and more smoke. As a result, the SPR remains high for an extended period, whereas the TSP is the highest, showing a linear increase over time.
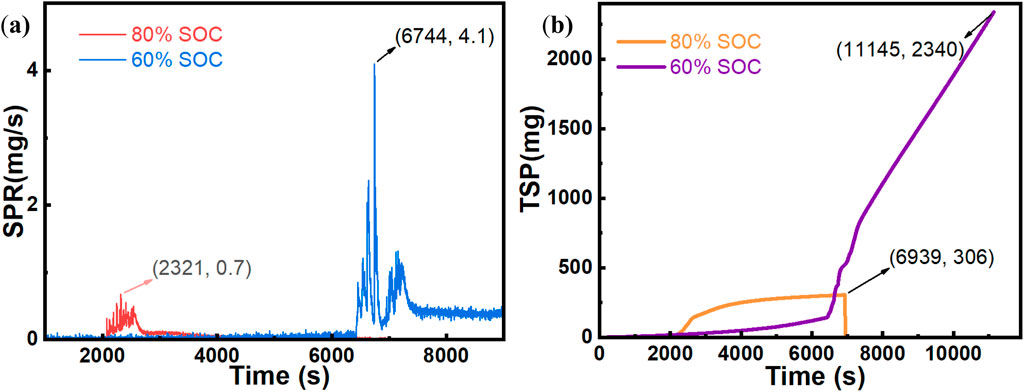
Figure 4. Comparison of flue gas parameters under different SOCs. (a) TSP comparison. (b) SPR comparison.
The comprehensive analysis of voltage evolution, visual phenomena, and gas production indicates that the SOC is a paramount factor governing the severity and progression of TR. Fundamentally, higher SOC signifies greater stored electrochemical energy and a higher concentration of active lithium in the anode. During TR, this leads to more intense chain exothermic reactions, including the severe decomposition of the cathode material and the violent oxidation of the electrolyte. Consequently, batteries at elevated SOC exhibit not only a faster temperature rise rate but also a more violent failure mode characterized by higher internal pressure generation. This often results in stronger and more directional ejection of flames and combustible gases (jetting), which can significantly alter the spatial distribution of heat and combustion products within a confined space. The understanding of this SOC-dependent energy release kinetics provides a critical theoretical foundation for interpreting the specific experimental observations that follow.
The distinct TR progression and combustion behaviors observed at 60% and 80% SOC can be fundamentally attributed to the differences in the battery’s inherent energy reservoir and the kinetics of internal failure mechanisms. The higher SOC (80%) battery, possessing a greater concentration of intercalated lithium in the anode and a higher overall electrochemical potential, reaches a critical state of instability more rapidly upon heating. This results in a more synchronous and violent failure of cell components. The abrupt, single-stage voltage drop and immediate transition from smoke emission to jet fire suggest a catastrophic breakdown of the anode-separator-cathode structure, leading to a rapid, large-scale internal short circuit and the instantaneous ignition of ejected electrolytes.
Conversely, the multi-stage TR process at 60% SOC indicates a more gradual and heterogeneous failure. The lower lithium inventory and energy state likely lead to a slower heat generation rate during the abuse. This allows for localized internal short circuits or the decomposition of specific components (e.g., the solid electrolyte interphase, SEI) to occur sequentially rather than simultaneously. The observed voltage fluctuations are characteristic of this “stuttering” failure mode, where temporary re-establishment of electrical contact or staged venting of gases causes transient voltage recoveries. The prolonged smoke emission phase prior to open flame signifies a longer period of solid and electrolyte decomposition without immediate gas-phase ignition, likely due to the lower concentration and temperature of the emitted combustible gases. The eventual ignition, after significant gas accumulation, then leads to a more stable, fuel-controlled fire, explaining the higher total smoke production and extended combustion duration.
3.1.2 Flame height
Among the four stages of fire development, a key parameter is the flame height during the stable combustion stage (Mao et al., 2020). The flame height during combustion serves as an intuitive indicator of the combustion intensity. To examine the relationship between the flame height and time, high-definition video footage of the flames was analyzed, and the flame height at key time points was measured. The analysis reveals that both conditions present several instances of jet flames. For convenience, the time at which the first jet flame occurred in the 80% and 60% SOC conditions was designated as 0 s, and the peak flame height at that time point was measured. When the next jet flame occurred, the peak height was measured again, and this process was repeated. A total of nine peak values were selected for comparison, as shown in Figure 5 the peak flame height under the 80% SOC condition is greater overall, and the flame lasts longer than that under the 60% SOC condition. From the first to the ninth flame jet, the total time is approximately 500 s for the 80% SOC condition, whereas for the 60% SOC condition, the duration from the first to the ninth flame jets is approximately 300 s. The 60% SOC condition has a lower energy and a shorter jet flame duration.

Figure 5. Comparison of peak height values of different SOC flames.
3.1.3 HRR and mass loss
Based on the analysis of the experimental phenomena in Section 3.1.1, the smoke release stage clearly precedes the stable combustion stage. The production of smoke during combustion significantly influences both the combustion process and flame height. Consequently, the smoke composition was analyzed. As shown in Figure 6a, during the intense combustion caused by TR in the LIBs, the 80% SOC battery consumes more O2 and produces more CO2 than the 60% SOC battery. This finding aligns with the experimental observations.
A comparison of the two sets of batteries after the experiment clearly reveals that the battery weight decreases following the test. The observations suggest that a higher SOC in LIBs is correlated with more severe TR and greater energy release (Kim et al., 2022). A detailed comparison of the battery weights before and after the experiment is presented in Table 2.
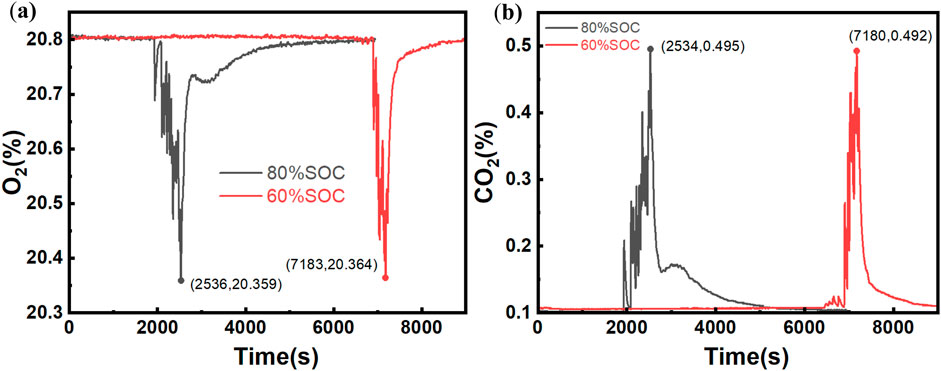
Figure 6. Comparison of gas smoke analysis results under different SOCs. (a) Comparison of O2 volume fractions. (b) Comparison of CO2 volume fractions.
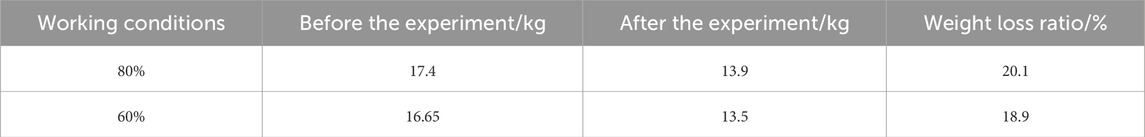
Table 2. Comparison of SOC quality before and after the experiment.
According to Figure 7, the HRR analysis for different SOC conditions reveals that the 80% SOC condition results in a faster combustion time, with a peak HRR of 68 kW, whereas the 60% SOC condition results in slower combustion but a higher peak HRR of 107 kW. At a high SOC (80%), the higher lithium-ion concentration inside the battery accelerates the chemical reaction, thereby shortening the combustion duration. Conversely, at a low SOC (60%), although the battery contains less energy, the internal chemical reactions are more stable, leading to a longer combustion duration and ultimately a higher HRR. With respect to smoke emissions, the rate and mode of gas release significantly differ under various SOC levels (Edmonds and Moinuddin, 2021). At 60% SOC, more combustible gases are released, resulting in more stable combustion and a higher peak HRR. According to an analysis of the mass loss of the batteries, both conditions result in significant mass loss after combustion, exceeding 3 kg, with the 80% SOC condition leading to greater mass loss. Overall, under the 60% SOC condition, the LIBs undergo a less intense reaction than under the 80% SOC condition. This reaction is characterized by a longer preheating time and continuous accumulation of energy. Consequently, with sufficient reaction time, the combustible gases are fully released, enabling the 60% SOC LIBs to achieve a higher peak HRR with a relatively low mass loss.
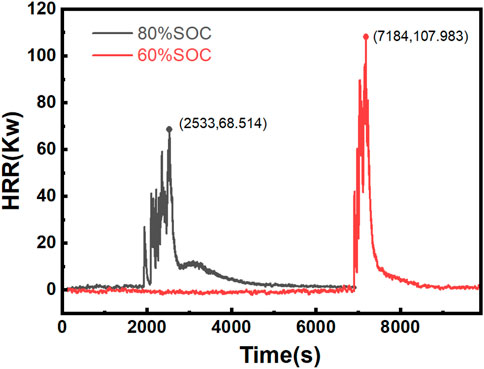
Figure 7. HRR changes under different SOCs.
The observed differences in combustion behavior between the two SOC conditions can be attributed to the complex interplay between energy density, thermal stability, and gas generation kinetics within the battery cells. At higher SOC levels, the increased availability of reactive lithium compounds promotes rapid exothermic reactions, leading to accelerated TR propagation. However, this rapid energy release may result in incomplete combustion of the ejected gases, as the combustion process is dominated by diffusion-limited flame dynamics rather than kinetically-controlled oxidation. Conversely, lower SOC conditions provide a more gradual energy release profile, allowing for enhanced mixing of fuel vapors with ambient air and facilitating more complete combustion reactions. This phenomenon underscores the critical role of gas-phase combustion chemistry in determining the overall fire hazard characteristics of LIB TR events. The findings suggest that TR severity cannot be evaluated solely based on total energy content; rather, the temporal distribution of energy release and the corresponding gas-phase reaction pathways must be considered to comprehensively assess the fire risk associated with LIBs at different charge states.
3.2 Thermal runaway propagation behavior of the battery module
To further explore the spread of fire, in this section, the typical temperature readings from various measurement points after combustion of ternary lithium batteries at different SOC levels are compared, aiming to analyze the general pattern of TR propagation. Each operating condition is then investigated in detail, focusing on the temperature changes at each measurement point and the spread pattern from an overall perspective. Since the battery measurement points are symmetrically arranged, the temperature differences between the left and right measurement points can be used to investigate the lateral propagation of heat within the battery.
3.2.1 Comparison of temperatures at typical measurement points
Given the extensive TC data, only representative data are selected for comparison and analysis. Specifically, TC1, which is attached to the heated compartment, is given particular attention. Additionally, the compartment exhibiting the highest temperature peak for each SOC condition is also selected for detailed analysis. The compartments to be analyzed are listed in Table 3. As shown in Table 3, there is no clear pattern in the peak temperatures of the batteries under different SOC combustion conditions, and the peak temperatures correspond to different compartments. In contrast, the highest peak temperatures for the cabinet are consistently located at TC14 and TC15, which are directly above Cabinet No. 5.

Table 3. Typical TC temperature comparison.
The shift in the location of the peak temperature from TC4 (seventh cell) at 60% SOC to TC5 (ninth, top-protruding cell) at 80% SOC is a direct manifestation of SOC-dependent TR violence and its interaction with the module’s geometry and thermal management environment. This phenomenon can be mechanistically explained by two well-established principles.
1. SOC Dictates TR Violence and Jet Ejection Dynamics: A higher SOC directly correlates to greater stored chemical energy. During TR, this energy is released more violently, leading to a significantly higher HRR and peak heating rates (Zhao et al., 2023). This intensified reaction accelerates the decomposition of the cathode and electrolyte, generating immense internal pressure. The resultant venting of combustible gases and particles is not isotropic; it often forms a directed, jet-like ejection (Zhang H. et al., 2024; Rong et al., 2023);
2. Geometry Dictates Heat and Flow Pathways: The protruding configuration of the top-left cell (monitored by TC5) creates a localized region with reduced physical constraint and potentially enhanced exposure to the surrounding oxidizer. In confined spaces, buoyancy-driven flows dominate fire spread, with high-temperature gases and flames preferentially moving upward (Yang et al., 2024).
At 80% SOC, the violent TR event generates a powerful, upward-directed jet of flame and high-temperature gases. This jet is channeled by the geometry of the cell stack and cabinet, impinging directly on the protruding top cell. The combined effect of direct flame impingement and the adiabatic heating from being at the apex of the buoyant flow plume causes this cell to experience the most severe thermal assault, explaining the peak temperature at TC5. Conversely, at 60% SOC, the reduced chemical energy results in a less violent TR event with a lower HRR and a weaker, less directional ejection. The thermal and flow dynamics are subsequently dominated by conductive and radiative heat transfer within the tighter inter-cell spaces. The seventh cell (TC4), being centrally located within the stack, becomes a hotspot due to heat accumulation from adjacent cells, without the dominant upward convective drive seen at higher SOC.
Figure 8a shows that during the heating phase, the temperature at TC1 for different SOC levels linearly increases. The combustion process for the 60% SOC battery is relatively stable, with a peak temperature notably lower than that for the 80% SOC battery. Figure 8b clearly shows that the highest temperature for the 80% SOC condition is 75 °C higher than that for the 60% SOC condition. As shown in (c), the peak temperature in the cabinet for the 80% SOC is 141 °C higher than that for the 60% SOC, suggesting that compared with the combustion of the battery itself, batteries with a higher SOC exhibit a stronger fire propagation capability during combustion (Zeng et al., 2024).

Figure 8. Comparison of temperatures at typical measurement points for different SOCs. (a) TC1. (b) Maximum temperature (battery). (c) Maximum temperature (cabinet).
3.2.2 Temperature changes at each point
The temperature changes were analyzed according to the operating conditions, with 20 measurement points for each condition. TC1–TC10 are battery measurement points, and TC11–TC20 are cabinet measurement points. TC1–TC5 and TC6–TC10 are symmetrically arranged, TC11–TC16 are located on the left side of the cabinet door, and TC17–TC20 are located on the right side. For easier comparison and analysis, the measurement points are grouped into sets of five points, and time‒temperature change graphs are plotted.
Figure 9 shows the temperature variation of the battery under 80% SOC over time. In (a) and (b) of Figure 9, TC1 is located on the heated compartment. Before TR occurs, only the temperature at TC1 rises with the increase in the temperature of the heating plate, whereas the temperatures of the other compartments remain relatively unchanged. At 1730 s, when TR occurs, the compartment containing TC1 undergoes TR, releasing a large amount of gas, which causes a brief drop in temperature, followed by a rapid increase as the battery explodes. Simultaneously, the compartments corresponding to TC2–TC10 sequentially experience TR. At this point, the battery stably burns, with each compartment continuously releasing combustible gases that sustain combustion, causing the temperature curves to oscillate. After approximately 2,500 s, the temperature increase phase ends, and the battery temperature starts to decrease. Among the measurement points, TC9 and TC10, positioned farthest from the heating plate, show the fastest temperature decrease, indicating that they are situated in the upper part of the flames, where the combustible materials inside are consumed first. Furthermore, while TC1–TC5 and TC6–TC10 are symmetrically distributed and TR begins at TC1, (a) and (b) show that after TR, the overall temperature change trends of the other compartments converge. The battery was placed on the left cabinet door during the combustion test. The temperature changes in the cabinet shown in (c) and (d) of Figure 9 clearly indicate that TC11–TC16 on the left side of the cabinet record higher temperatures than those on the right side (TC17–TC20). The other TC located beneath the battery on the cabinet door have the highest temperatures, with the peak temperatures exceeding 400 °C. The TC on the side (TC17–TC20) have a maximum temperature of no more than 150 °C, indicating that, under closed cabinet conditions, the combustion of the left-side battery has a minimal impact on the temperature of the right-side cabinet door.
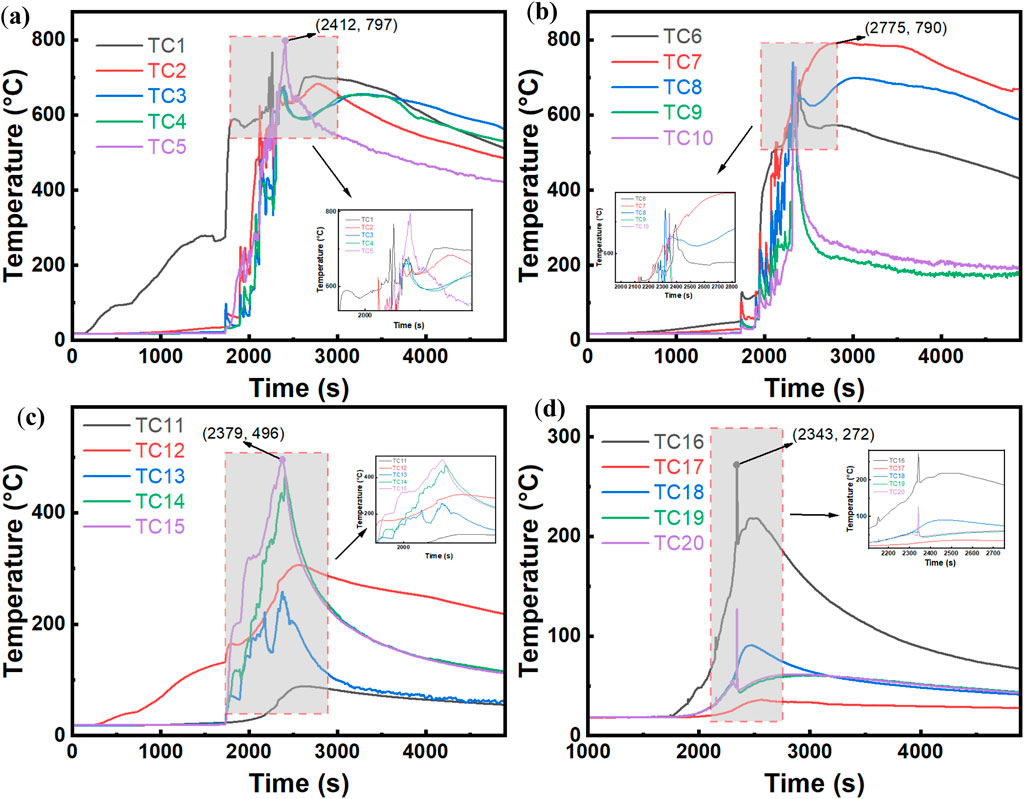
Figure 9. Temperature time variation at 80% SOC. (a) TC1-TC5. (b) TC6-TC10. (c) TC11-TC15. (d) TC16-TC20.
The observed temperature distribution patterns reflect the fundamental heat and mass transfer mechanisms governing TR propagation in confined battery enclosures. The asymmetric temperature profiles between the left and right cabinet sections demonstrate the dominant role of convective heat transfer and combustible gas flow direction in determining the spatial thermal field distribution. The sequential activation of TR across battery compartments indicates a propagation mechanism driven by thermal conduction through cell-to-cell contact and radiative heat transfer from flame zones, rather than simultaneous failure of all cells. The oscillatory nature of temperature curves during stable combustion suggests periodic venting and combustion cycles, which are characteristic of pressure-driven gas ejection followed by vapor-phase oxidation reactions. The rapid temperature decline in upper battery compartments can be attributed to preferential fuel consumption in regions with enhanced oxygen accessibility, where buoyancy-driven flow promotes efficient mixing of combustible vapors with ambient air. From a fire safety perspective, these findings highlight the importance of thermal management strategies that account for directional heat propagation and localized hot zones within battery enclosures. The minimal thermal impact on the opposite cabinet door underscores the effectiveness of spatial separation in mitigating TR propagation to adjacent battery modules, suggesting that proper compartmentalization can serve as a passive safety mechanism in large-scale battery energy storage systems.
As shown in Figure 10, when the battery SOC is reduced to 60%, compared with the 80% SOC condition, the internal energy of the battery is lower, making TR initiation more difficult. Under this condition, TR occurs at 6,000 s. However, unlike the 80% SOC condition, this condition does not result in an explosive fire. Instead, after several bursts of smoke over the course of 10 min, the battery eventually explodes, indicating that lower-SOC batteries are more resistant to TR. The temperature change in the cabinet, as shown in (c) and (d), also demonstrates that TC15, located at the center of Cabinet No. 3, reaches a maximum temperature of 354 °C, which is lower than the corresponding value under the 80% SOC condition. This result suggests that during combustion, the heat radiated by the 60% SOC battery is less than that radiated by the 80% SOC battery, with a difference of less than 100 °C.

Figure 10. Temperature time variation at 60% SOC. (a) TC1-TC5. (b) TC6-TC10. (c) TC11-TC15. (d) TC16-TC20.
The comparative analysis between the two SOC conditions reveals that the TR resistance and combustion characteristics are strongly influenced by the initial charge state of the battery. The extended preheating period and gradual smoke release observed at 60% SOC, as opposed to the rapid explosive behavior at 80% SOC, indicate that lower charge states provide a wider safety margin for early warning and intervention. The reduced cabinet temperatures under the 60% SOC condition further confirm that the overall thermal hazard is diminished when batteries operate at lower charge levels, which has practical implications for storage and operational safety protocols.
3.2.3 Horizontal temperature difference variation
As discussed in Section 3.2.2, since the battery was placed on the left side of the cabinet during the experiment, the temperatures of the four cabinet doors on the left side are generally higher than those of the four cabinet doors on the right side. With respect to the battery itself, because the left-side compartments are heated first, there is a temperature difference between the left and right compartments. We define ΔT = left-side temperature - right-side temperature (e.g., ΔT1 = T (TC1) - T (TC6)) to create a temperature difference graph. The specific temperature difference trends for different SOCs are analyzed as follows:
Figure 11 shows that the combustion of lithium batteries at 80% SOC is more intense and reaches TR more quickly than that at 60% SOC. Under the 60% SOC condition, TR begins at approximately 6000 s, with ΔT1 starting to rise, whereas the temperature difference curves for the other compartments begin to fluctuate at approximately 6,500 s. In contrast, at 80% SOC, this process occurs earlier, with TR starting at approximately 2000 s, followed by explosive combustion. The entire battery ignites, and ΔT1–ΔT5 start to oscillate simultaneously. Figure 11b shows that the combustion pattern at 60% SOC is similar to that at 80% SOC, although the rate is lower and the temperature rise is more gradual. Notably, ΔT5 reaches −600 °C, indicating that after a prolonged combustion process, the energy in the compartment corresponding to TC5 has been fully released. Since TC10 is farthest from the heat source, this compartment starts burning last. Moreover, TC10 is located at the top of the battery, and as the compartments below burn, they provide energy to the top compartment. Unlike TC5, TC10 also has an additional compartment above it, which results in significantly higher combustion temperatures at TC10 later on compared to TC5.
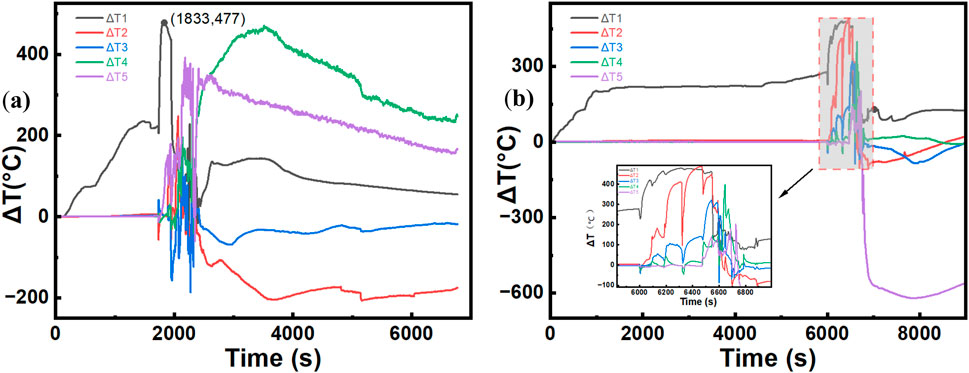
Figure 11. Comparison of the temperature differences between the left and right battery compartments under different SOCs. (a)80% SOC. (b)60% SOC.
The horizontal temperature difference evolution provides insight into the directional nature of TR propagation within the battery pack. The temporal lag in temperature difference onset between the two SOC conditions reflects the difference in TR initiation kinetics, with higher SOC levels facilitating more rapid cell-to-cell thermal propagation. The negative temperature difference observed at certain measurement points indicates localized fuel depletion in lower compartments, while upper compartments continue to receive thermal energy from below, demonstrating the vertically cascading nature of the combustion process. The simultaneous fluctuation of all temperature differences under high SOC conditions, as opposed to the sequential pattern under low SOC conditions, suggests that the propagation mechanism transitions from conduction-dominated spreading to convection-enhanced simultaneous heating when combustion intensity increases. These spatial and temporal temperature distribution patterns underscore the importance of considering directional heat flow and positional effects when designing thermal management systems and safety configurations for battery enclosures.
3.2.4 Uncertainty and error analysis
A comprehensive uncertainty analysis was conducted to quantify the reliability of the reported experimental data. Temperature measurements were acquired using K-type TC with a systematic accuracy of ±2.2 °C and a response time of <500 m, introducing minimal deviation in the recorded horizontal temperature differences (ΔT). The HRR derived from oxygen consumption calorimetry carries an estimated uncertainty of ±5%. This estimation is based on the precision specifications of the DAQ970 A data acquisition unit and the accepted uncertainty of the calorimetry method itself, encompassing the accuracy of the oxygen analyzer and flow rate measurements (Lei and Dembsey, 2008). Although destructive testing precluded true experimental replication for statistical analysis of scatter, the high level of control over initial conditions (SOC setting via CC charging), environmental factors (ambient temperature maintained at 25 °C ± 2 °C), and ignition source consistency ensures the observed trends—such as the earlier onset of oscillation in ΔT1–ΔT5 at 80% SOC—are representative. The pronounced temperature differential (e.g., ΔT5 reaching −600 °C) falls well outside the margin of measurement error, confidently confirming the significance of the observed spatial thermal phenomena.
4 Conclusion
By setting up a relevant experimental platform, the TR propagation process of ternary lithium batteries with two common SOCs (80% and 60%) under combustion conditions within a charging cabinet was investigated. The following conclusions were reached.
1. The TR process of the battery has four distinct phases: stable heating, TR with smoke emission, jet flame overflow, and stable combustion, with critical TR occurring at 300 °C. The SOC significantly affects the duration of the smoke emission and jet flame phases. Specifically, the 60% SOC condition results in a 480s smoke emission phase and a jet flame phase that is 200s shorter than that in the 80% SOC condition.
2. The smoke emission volume substantially influences the HRR characteristics. The lower-SOC battery (60%) achieves a higher peak HRR of 107 kW, surpassing that in the 80% SOC condition by 57%. This result correlates with its approximately 8-fold greater TSP compared with the 80% SOC condition.
3. Under closed cabinet conditions, vertical fire spread has a stronger propagation capability than horizontal spread. The 80% SOC condition generates higher temperatures in upper cabinet regions (peaking at 495 °C), whereas the side cabinet temperatures remain below 150 °C.
Data availability statement
The original contributions presented in the study are included in the article/supplementary material, further inquiries can be directed to the corresponding author.
Author contributions
JL: Writing – review and editing, Writing – original draft. WW: Visualization, Funding acquisition, Writing – review and editing, Resources, Writing – original draft. ZW: Writing – review and editing, Validation, Writing – original draft, Formal Analysis, Project administration. HW: Writing – review and editing, Data curation, Methodology. YK: Writing – review and editing, Supervision, Conceptualization. JY: Investigation, Software, Writing – review and editing.
Funding
The author(s) declare that financial support was received for the research and/or publication of this article. This study was supported by the National Key R&D Program of China (No. 2023YFC3009900), 515 Technology Development Program of SINOPEC (No. 323139), Natural Science Foundation of 516 Shanghai (No. 24ZR1473000), and the Science and Technology Research Project of Shanghai 517 Science and Technology Commission (No. 22DZ1201000). This work was also supported by the Natural Science Foundation of Jiangsu Province of China (Grant No. BK20211304).
Conflict of interest
The authors declare that the research was conducted in the absence of any commercial or financial relationships that could be construed as a potential conflict of interest.
Generative AI statement
The author(s) declare that no Generative AI was used in the creation of this manuscript.
Any alternative text (alt text) provided alongside figures in this article has been generated by Frontiers with the support of artificial intelligence and reasonable efforts have been made to ensure accuracy, including review by the authors wherever possible. If you identify any issues, please contact us.
Publisher’s note
All claims expressed in this article are solely those of the authors and do not necessarily represent those of their affiliated organizations, or those of the publisher, the editors and the reviewers. Any product that may be evaluated in this article, or claim that may be made by its manufacturer, is not guaranteed or endorsed by the publisher.
References
Ângelo, D. F. (2022). Mobile charging stations in electric shared micromobility. Universidade do Porto.
Bi, S., Yu, Z., Fang, S., Shen, X., Cui, Y., Yun, F., et al. (2023). Understanding the combustion characteristics and establishing a safety evaluation technique based on the overcharged thermal runaway of lithium-ion batteries. J. Energy Storage 73, 109039. doi:10.1016/j.est.2023.109039
Doose, S., Hahn, A., Fischer, S., Müller, J., Haselrieder, W., and Kwade, A. (2023). Comparison of the consequences of state of charge and state of health on the thermal runaway behavior of lithium ion batteries. J. Energy Storage 62, 106837. doi:10.1016/j.est.2023.106837
Edmonds, S., and Moinuddin, K. (2021). A review of experimental and numerical studies of lithium ion battery fires. Appl. Sci. 11, 1247. doi:10.3390/app11031247
Feng, X., Ouyang, M., Liu, X., Lu, L., Xia, Y., and He, X. (2018). Thermal runaway mechanism of lithium ion battery for electric vehicles: a review. Energy Storage Mater. 10, 246–267. doi:10.1016/J.ENSM.2017.05.013
Feng, X., Ren, D., He, X., and Ouyang, M. (2020). Mitigating thermal runaway of lithium-ion batteries. Joule 4, 743–770. doi:10.1016/j.joule.2020.02.010
Galushkin, N., Yazvinskaya, N. N., and Galushkin, D. N. (2018). Mechanism of thermal runaway in lithium-ion cells. J. Electrochem. Soc. 165, A1303–A1308. doi:10.1149/2.0611807JES
García, A., Monsalve-Serrano, J., Lago Sari, R., and Martinez-Boggio, S. (2022). Influence of environmental conditions in the battery thermal runaway process of different chemistries: thermodynamic and optical assessment. Int. J. Heat Mass Transf. 184, 122381. doi:10.1016/j.ijheatmasstransfer.2021.122381
Hong, Y., Jin, C., Chen, S., Xu, C., Wang, H., Wu, H., et al. (2024). Experimental study of the suppressing effect of the primary fire and thermal runaway propagation for electric bicycle batteries using flood cooling. J. Clean. Prod. 435, 140392. doi:10.1016/j.jclepro.2023.140392
Huang, Y., Zhao, Y., Bai, W., Cao, Y., Xu, W., Shen, X., et al. (2024). Study on the influence of high rate charge and discharge on thermal runaway behavior of lithium-ion battery. Process Saf. Environ. Prot. 191, 1483–1494. doi:10.1016/j.psep.2024.09.054
Jindal, P., and Bhattacharya, J. (2019). Review—understanding the thermal runaway behavior of Li-Ion batteries through experimental techniques. J. Electrochem. Soc. 166, A2165–A2193. doi:10.1149/2.1381910JES
Kim, S. W., Park, S. G., and Lee, E.Ju (2022). Assessment of the explosion risk during lithium-ion battery fires. J. Loss Prev. Process Industries 80, 104851. doi:10.1016/j.jlp.2022.104851
Kwon, K., Kim, S., Park, J., Lee, S., Jeon, W., Cha, H., et al. (2024). Data and videos for the comparison of thermal propagation and cycle performance of multiple lithium-ion batteries in air and insulating oil. Data Brief 54, 110304. doi:10.1016/j.dib.2024.110304
Lai, Y.-W., Chi, K. H., Chung, Y. H., Liao, S. W., and Shu, C. M. (2024). Thermal runaway characteristics of 18650 lithium-ion batteries in various states of charge. J. Therm. Analysis Calorim. 149, 10477–10486. doi:10.1007/s10973-023-12867-x
Lei, Z., and Dembsey, N. A. (2008). Measurement uncertainty analysis for calorimetry apparatuses. Fire Mater. 32, 1–26. doi:10.1002/fam.947
Liming, L., Liu, B., Zheng, W., Wu, X., Song, L., and Dong, W. (2022). Investigation and numerical reconstruction of a full-scale electric bicycle fire experiment in high-rise residential building. Case Stud. Therm. Eng. 37, 102304. doi:10.1016/j.csite.2022.102304
Liu, P., Wang, C., Sun, S., Zhao, G., Yu, X., Hu, Y., et al. (2023). Understanding the influence of the confined cabinet on thermal runaway of large format batteries with different chemistries: a comparison and safety assessment study. J. Energy Storage 74, 109337. doi:10.1016/j.est.2023.109337
Mao, B., Chen, H., Jiang, L., Zhao, C., Sun, J., and Wang, Q. (2020). Refined study on lithium ion battery combustion in open space and a combustion chamber. Process Saf. Environ. Prot. 139, 133–146. doi:10.1016/j.psep.2020.03.037
Mao, Y., Ye, Y., Zhao, L., Chen, Y., and Chen, M. (2024). Suppression of lithium-ion battery thermal runaway propagation by zirconia ceramics and aerogel felt in confined space. Process Saf. Environ. Prot. 189, 1258–1273. doi:10.1016/j.psep.2024.07.015
Ministry of Industry and Information Technology of the People's Republic of China (2024). Interpretation of the Guidelines for health assessment of lithium ion batteries for electric bicycles. Available online at: https://www.miit.gov.cn/zwgk/zcjd/art/2024/art_0e77c0da28154b79a262cb94f85f6038.html.
Oh, J., Mehrotra, A., Lee, Y., Kim, B., and Yoh, J. J. (2024). Thermal runaway aspect of ultrahigh-nickel cathode-based lithium-ion batteries at increasing charge states. J. Energy Storage 76, 109887. doi:10.1016/j.est.2023.109887
Rong, D., Zhang, G., Sun, Q., and Hu, X. (2023). Experimental study on gas production characteristics of electrolyte of lithium-ion battery under pyrolysis conditions. J. Energy Storage 74, 109367. doi:10.1016/j.est.2023.109367
Sallard, S., Nolte, O., von Roemer, L., Soltani, B., Fandakov, A., Mueller, K., et al. (2025). Exploring thermal runaway: role of battery chemistry and testing methodology. World Electr. Veh. J. 16, 153. doi:10.3390/wevj16030153
Schöberl, J., Ank, M., Schreiber, M., Wassiliadis, N., and Lienkamp, M. (2024). Thermal runaway propagation in automotive lithium-ion batteries with NMC-811 and LFP cathodes: safety requirements and impact on system integration. eTransportation. 19, 100305. doi:10.1016/j.etran.2023.100305
Shahid, S., and Agelin-Chaab, M. (2022). A review of thermal runaway prevention and mitigation strategies for lithium-ion batteries. Energy Convers. Manag. X, 100310. doi:10.1016/j.ecmx.2022.100310
Song, L., Huang, Z., Mei, W., Jia, Z., Yu, Y., Wang, Q., et al. (2022). Thermal runaway propagation behavior and energy flow distribution analysis of 280 Ah LiFePO4 battery. Process Saf. Environ. Prot. 170, 1066–1078. doi:10.1016/j.psep.2022.12.082
Theiler, M., Baumann, A., and Endisch, C. (2024). Influence of inhomogeneous state of charge distributions on thermal runaway propagation in lithium-ion batteries. J. Energy Storage 95, 112483. doi:10.1016/j.est.2024.112483
Wang, Y., Feng, X., Huang, W., He, X., Wang, L., and Ouyang, M. (2023). Challenges and opportunities to mitigate the catastrophic thermal runaway of high-energy batteries. Adv. Energy Mater. 13, 2203841. doi:10.1002/aenm.202203841
Wu, H., Chen, S., Hong, Y., Xu, C., Zheng, Y., Jin, C., et al. (2023). Thermal safety boundary of lithium-ion battery at different state of charge. J. Energy Chem. 91, 59–72. doi:10.1016/j.jechem.2023.11.030
Xie, S., Sun, J., Chen, X., and He, Y. (2020). Thermal runaway behavior of lithium-ion batteries in different charging states under low pressure. Int. J. Energy Res. 45, 5795–5805. doi:10.1002/er.6200
Yang, D., Guo, X., Jiang, L., and Du, T. (2024). Prediction model of buoyancy-driven flow rate in inclined tunnels with a localized buoyancy source: emphasis on stratification effects. Build. Environ. 250 (2024), 111165. doi:10.1016/j.buildenv.2024.111165
Ying, T., Yang, S., Jiafeng, W., Mu, C., and Liansheng, H. (2023). Thermal runaway propagation characteristics of lithium-ion batteries with a non-uniform state of charge distribution. J. Solid State Electrochem. 27, 2185–2197. doi:10.1007/s10008-023-05496-9
Yu, Z., Shen, X., Xu, R., Wang, Z., Wan, Z., Chen, M., et al. (2024). Understanding the combustion behavior of electric bicycle batteries and unveiling its relationship with fire extinguishing. J. Energy Chem. 91, 609–618. doi:10.1016/j.jechem.2024.01.005
Yu, Z., Ma, X., Wan, Z., Xu, R., Zhang, H., Gao, Z., et al. (2025). Quantitative deciphering of mechanical response mechanism in lithium-ion batteries via DIC-assisted indentation. Chem. Eng. J. 514, 163171. doi:10.1016/j.cej.2025.163171
Zeng, D., Mohaddes, D., Gagnon, L., and Wang, Y. (2024). Modeling initiation and propagation of thermal runaway in pouch Li-ion battery cells: effects of heating rate and state-of-charge. Proc. Combust. Inst. 40, 105316–4. doi:10.1016/j.proci.2024.105316
Zhang, W., Ouyang, N., Yin, X., Li, X., Wu, W., and Huang, L. (2022). Data-driven early warning strategy for thermal runaway propagation in Lithium-ion battery modules with variable state of charge. Appl. Energy 323, 119614. doi:10.1016/j.apenergy.2022.119614
Zhang, Y., Song, L., Tian, J., Mei, W., Jiang, L., Sun, J., et al. (2024). Modeling the propagation of internal thermal runaway in lithium-ion battery. Appl. Energy 362, 123004. doi:10.1016/j.apenergy.2024.123004
Zhang, H., Xue, J., Qin, Y., Chen, J., Wang, J., Yu, X., et al. (2024). Full-Dimensional analysis of gaseous products to unlocking in depth thermal runaway mechanism of Li-Ion batteries. Small 20, e2406110. doi:10.1002/smll.202406110
Zhao, R., Lai, Z., Li, W., Ye, M., and Yu, S. (2023). Development of a coupled model of heat generation and jet flow of lithium-ion batteries during thermal runaway. J. Energy Storage 63, 107048. doi:10.1016/j.est.2023.107048
Zhong, G., Mao, B., Wang, C., Jiang, L., Xu, K., Sun, J., et al. (2019). Thermal runaway and fire behavior investigation of lithium ion batteries using modified cone calorimeter. J. Therm. Analysis Calorim. 135, 2879–2889. doi:10.1007/s10973-018-7599-7
Zhou, G., Lu, H., Zhang, Q., Yang, S., Liu, Y., Niu, C., et al. (2024). Experimental study on thermal runaway and flame eruption characteristics of NCM523 lithium-ion battery induced by the coupling stimulations of overcharge-penetration. Process Saf. Environ. Prot. 191, 131–145. doi:10.1016/j.psep.2024.08.092
Nomenclature
List of symbols
L Battery length (mm).
W Battery width (mm).
H Battery height (mm).
Abbreviations
LIB(s) Lithium-ion battery (or batteries)
HRR Heat release rate
SOC State of charge
TR Thermal runaway
TC Thermocouple(s)
Keywords: ternary LIBs, TR propagation, cabinet, SOC, battery module
Citation: Liu J, Wang W, Wang Z, Wang H, Kang Y and Yang J (2025) Experimental investigation of the thermal runaway and fire characteristics of overcapacity lithium-ion batteries for electric bicycles in charging cabinets. Front. Energy Res. 13:1681969. doi: 10.3389/fenrg.2025.1681969
Received: 08 August 2025; Accepted: 21 October 2025;
Published: 13 November 2025.
Edited by:
Arul Manuel Stephan, Central Electrochemical Research Institute (CSIR), IndiaReviewed by:
Zeyu Li, South China University of Technology, ChinaZhanglong Yu, China Automotive Battery Research Institute Co Ltd., China
Copyright © 2025 Liu, Wang, Wang, Wang, Kang and Yang. This is an open-access article distributed under the terms of the Creative Commons Attribution License (CC BY). The use, distribution or reproduction in other forums is permitted, provided the original author(s) and the copyright owner(s) are credited and that the original publication in this journal is cited, in accordance with accepted academic practice. No use, distribution or reproduction is permitted which does not comply with these terms.
*Correspondence: Wei Wang, d2FuZ3c4Nzk5QDE2My5jb20=