 Ramin Jalilian
 Ehsan Kamel
- 1Department of Mechanical Engineering, College of Engineering & Computing Sciences, New York Institute of Technology, Old Westbury, NY, United States
- 2Department of Energy Management, College of Engineering & Computing Sciences, New York Institute of Technology, Old Westbury, NY, United States
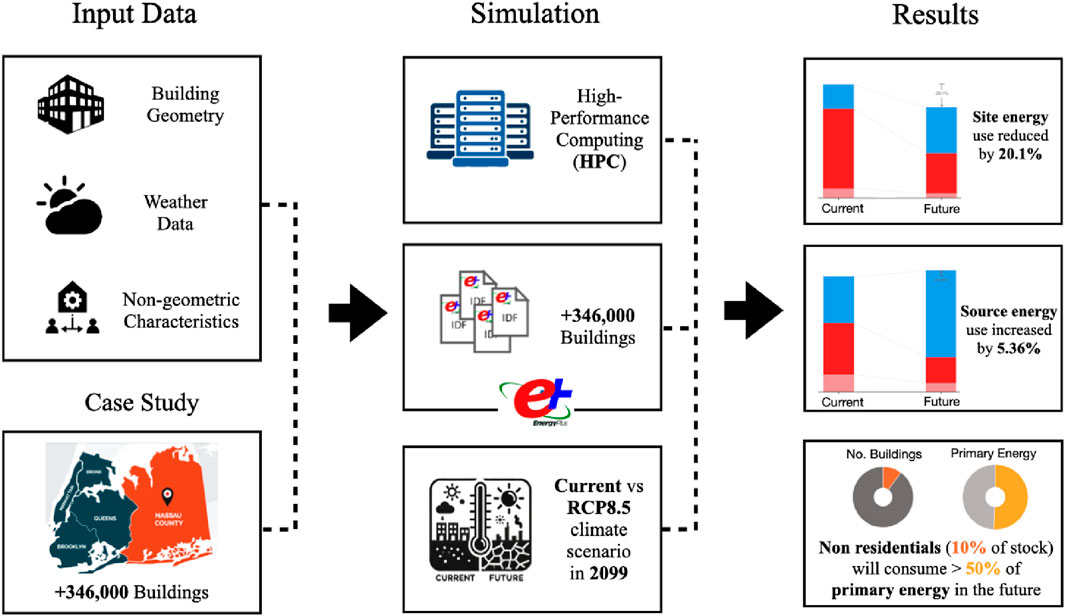
Urban- or large-scale building energy modeling is essential to understand how climate change may affect energy demand in urban or populated areas. Past research, however, is generally small-scale, of low spatial resolution, or not highly transferable to future climate conditions. In this research, an automated high-performance computing (HPC) workflow is created and implemented to simulate energy use in 346,827 buildings in Nassau County, New York, under present and future 2099 climate scenarios (RCP8.5). The simulation platform combines large-scale physics-based modeling with morphed Typical Meteorological Year data in order to compute site and source energy use, heating and cooling loads, and correlated carbon emissions. Results for Nassau County show that while mean site energy use decreases by 20.1% due to lower heating loads during milder winters, source energy use increases by 5.36% due to increased electrical demand for cooling. Non-residential buildings, although constituting only 10% of the building stock, are the source for over 50% of future total source energy consumption in the scenario considered. These outcomes underscore the importance of grid decarbonization as well as such focused efficiency measures, particularly for electricity-reliant types of buildings. The proposed workflow is applicable in other fields, scalable, and can potentially inform long-term urban energy and climate resilience planning.
Highlights
• High-definition simulations conducted on over 346,000 buildings via an HPC-enabled automated process.
• Future climate (RCP8.5, 2099) reduces site energy use but increases source energy due to rising cooling and electricity loads.
• Cooling loads nearly double as a result of rising temperatures, offsetting reductions in heating demand.
• Only 10% of the stock, non-residential buildings, consume more than 50% of future source energy.
• Results underscore the importance of grid decarbonization and concentrated energy policies for non-residential buildings.
1 Introduction
According to the U.S. Energy Information Administration (EIA), buildings are the main energy consumers in the US, responsible for 38% of the total primary energy consumption and 35% of the total emissions in the US (U.S. Energy Information Administration, 2023). Understanding and improving the energy behavior of these buildings is very important for creating a sustainable and resilient urban environment, especially in terms of current and future climate change scenarios (Chen et al., 2024).
There are mainly two approaches to assessing the energy behavior of buildings in an urban area: top-down and bottom-up. While top-down methodologies are useful for comprehensive and generalized large-scale analysis (van Vuuren et al., 2009), bottom-up approaches are necessary for finding potential efficiency improvements in the urban building sector (Ali et al., 2021) and they are more feasible options since accessibility to sufficient data on a large scale is limited. To come up with optimized and cost-efficient energy improvement strategies, especially on an urban scale, quantification of these savings, not only for the current weather conditions but also under different climate change scenarios, is necessary. This can be done by a proper bottom-up approach considering the current and future probable meteorological conditions as a result of climate change (Reyna and Chester, 2017).
Availability and accuracy of meteorological data can be a challenge for building energy models and can have a substantial impact on their calibration and estimation of the energy needs in urban buildings (Bhandari et al., 2012). Since the standard weather data files, e.g., Typical Meteorological Year (TMY) files, which are used in building performance simulations, cannot be used for future climate change scenarios, the “Morphing” technique that combines existing hourly weather data with predicted climate change information could be a suitable alternative (Jentsch et al., 2013). In this way, the potential future weather conditions, and especially their effect on the energy performance of the buildings in a specific urban area, can be assessed.
There exists a significant knowledge gap in large-scale or Urban Building Energy Modeling (UBEM), especially when dealing with the challenges and complexities of modeling numerous buildings within urban areas (Ali et al., 2021). UBEM helps in estimating energy needs, assessing design or upgrade choices, and measuring the effects of severe weather or climate change; however, it's important to correctly combine urban data (geometric and non-geometric) with proper modeling tools (Ang et al., 2020). While such integration is computationally feasible in a microscale, it can be quite challenging to conduct studies in meso- or macroscales (Oraiopoulos and Howard, 2022).
Numerous studies have assessed the effects of climate change on the future energy behavior of buildings, often focusing on archetypes such as commercial offices (Jafarpur and Berardi, 2021; Nguyen et al., 2021), (Bamdad et al., 2021) or residential buildings (Tomrukcu and Ashrafian, 2024; Xiong et al., 2023). While valuable, these analyses are generally region-specific or rely on varied methodological approaches (Tootkaboni et al., 2021), limiting their generalizability to other contexts. Moreover, a few studies have been done in meso- or macroscales with high resolution, which can consider the effectiveness of any Energy Conservation Measures (ECMs) on a large scale, as well as the potential opportunities to shift the peak loads. However, prior UBEM studies often face challenges with computational cost, archetype definition, and transferability, limiting their use in regional planning applications. The contribution of this paper is not the development of a new simulation engine but the demonstration of an automated, scalable workflow that enables county-wide analysis. By integrating existing building models from the Model America dataset with downscaled climate scenarios and executing simulations on high-performance computing, we show how UBEM can be applied to over 346,000 buildings in Nassau County. This approach provides a transferable pathway for high-resolution, climate-aware energy analysis to support urban planners and policymakers.
As a case study, this workflow is utilized to assess the energy behavior of more than 346 thousand buildings, in terms of heating and cooling energy needs, in the mixed-humid area of Nassau County in New York state, under current and future weather conditions. The goal is to assess how cooling and heating loads, in residential and non-residential buildings, will be affected as a result of climate change in 2099. Although RCP8.5 is increasingly seen as an unlikely scenario due to the global trend towards cleaner energy, it remains valuable for assessing potential high-risk futures (Hausfather and Peters, 2020). Accordingly, we use RCP8.5 as a high-end stress-test scenario to bound impacts under severe warming; results should therefore be interpreted as upper-bound estimates. This is especially relevant given the global all-time high coal use in 2022, which the International Energy Agency (IEA) projects will continue to increase until the end of the decade (IEA, 2023). Therefore, we employed RCP8.5 in this case study to explore its implications on urban building energy demand under extreme conditions. In addition, the corresponding emissions for different energy sources (e.g., electricity or gas) and source and site energies will be studied. Furthermore, the analysis helps to identify building groups with disproportionately high energy use, which can be prioritized for potential energy retrofit incentives.
This study is the first step of the proposed multi-step research roadmap. Subsequent steps include the development of new archetypes, calibration of simulation models, sensitivity analysis, exploration of different climate change scenarios, and policy and scenario analysis. These steps build on the findings of this study, aiming to refine the models, incorporate more detailed and varied building archetypes, and explore the broader implications and policy responses to the projected changes in building energy use due to climate change.
Subsequent sections include a background discussion (Section 2) on Large-scale and Urban Building Energy Modeling (UBEM) and its challenges, followed by a detailed methodology (Section 3) outlining the study’s execution using High-Performance Computing (HPC). Results and analysis (Section 3.4) are presented in detail for current and future scenarios regarding energy use, heating and cooling loads, and emissions, followed by a discussion section (Section 5) highlighting insights for policy-making and future research directions. Finally, the conclusion (Section 7) summarizes key findings, underlining the urgency of transitioning to cleaner energy sources and suggesting further exploration in addressing the challenges caused by climate change on building energy consumption on a large scale.
2 Background
2.1 Large-scale and Urban Building Energy Modeling
Building Energy Modeling (BEM) is a computational tool for optimizing a building’s energy efficiency through virtual simulations, which originated back in the 1970s (Mills, 2004). Urban-scale BEM (UBEM) extends these methods by combining BEM with regional data to analyze energy use across thousands of buildings (Reinhart and Cerezo Davila, 2016).
For the assessment of the energy behavior of buildings on an urban scale, there are two methods available: top-down and bottom-up. Top-down methodologies are used to analyze the overall energy performance of the entire urban/district area by using aggregated data and generalized parameters for large-scale usage, while bottom-up approaches are used for identifying potential efficiency improvements in the urban building sector (Ali et al., 2021). Furthermore, the modeling approaches can be also categorized as Physics-based models (white box), reduced-ordered (grey box), and Data-driven models (black box) (Hong et al., 2020), each of which has some benefits like computational simplicity and speed in data-driven approaches, and detailed assessment and interpretability in physics-based models, and can even be combined to use the benefits of both methods (Nutkiewicz et al., 2018).
Ferrando et al. (2020), did a comprehensive review of the bottom-up UBEM tools available, highlighting their abilities to be used for energy assessment in different spatial and temporal scales, their ability to implement retrofit strategies and measuring consequent energy and emission savings, and comparing them based on the inputs, outputs, workflow, applicability and potential users. As mentioned in this review, one of the major trends in UBEM could be computational optimization of these tools, coupled with parallel or high-performance computing, to be able to run the analysis over a larger number of buildings, for comparison of different policies at larger scales.
One of the main uncertainties that must be addressed is the definition of appropriate archetypes to be a decent representative of the current building stock in large-scale studies, since access to energy use data and thermal properties of the selected buildings is very limited (Reinhart and Cerezo Davila, 2016). In this regard, some research has been done and showed promising results in archetype definition at district scales, characterizing each type, and validating the model by comparing them to the measured energy data (Sokol et al., 2017; Cerezo et al., 2017). A widely used reference is the U.S. Department of Energy prototype database (Office of Energy Efficiency and Renewable Energy, 2022), which combines national consumption surveys with ASHRAE standards to define residential and commercial building types across climate zones.
Even with archetypes, simulating entire urban areas with hundreds of thousands of buildings remains computationally intensive and costly. While assessing ECM effectiveness at scale is a core goal of bottom-up UBEM, relatively few studies attempt it because of these demands (Kamel, 2022). As computational optimization becomes a deciding factor in UBEM, it necessitates the use of advanced computing technologies like Cloud or HPC. As an example, Zhang et al. developed a surrogate modeling framework for physics-based large-scale building stock modeling that employs HPC (Zhang et al., 2021). It produces high-resolution hourly energy outputs for large scales, like cities and regions, that can be useful for understanding building demand profiles and grid impacts while preparing large datasets and performing feature engineering for training the surrogate models.
2.2 Climate change and large-scale BEM
The connection between Large-Scale or UBEM and climate change is an important area of research to be focused on and is useful for different stakeholders, including policymakers, urban planners, and designers. To be able to downscale the long-term climate neutrality plans from countrywide goals to cities, districts, and even buildings, it is crucial to quantify the effects of different climate change scenarios on the existing building stock, their energy consumption, and carbon emissions, in different spatial and temporal scales. To successfully perform such analysis on that scale and level of detail, a calibrated, well-defined urban building energy model is needed, along with a realistic projection of the different climate change scenarios on the weather conditions in the future.
To address these needs, a web-based framework developed at MIT automates UBEM creation from GIS data and archetypes, supporting multiple climate pathways and retrofit comparisons (Ang et al., 2022). Similarly, de Rubeis et al. (2021). introduced a tool that models individual buildings, recommends improvements, and generates neighborhood- or city-scale energy ratings (UBER), demonstrated in Italian case studies. There are many other powerful and integrated tools, each of which has some benefits over the others, which are comprehensively reviewed in (Ferrando et al., 2020).
Large-scale and UBEM help to quantify the impact of climate change on energy consumption patterns in urban areas and their influence on heating and cooling demands. This allows researchers to assess how climate change may cause shifts in energy usage in urban buildings. One study in Baghdad applied a degree-day methodology and found that summer cooling accounted for nearly 40% of total city energy use under future warming, with associated increases in pollution (Abed Hassan and Ismail Husain, 2022). A large-scale U.S. analysis combining climate change, population growth, and power sector decarbonization showed that while efficiency and location shape local outcomes, population growth could raise energy use by over 50%, while decarbonization could reduce it by about 17%, with climate change itself contributing a modest further reduction (Wang et al., 2023). In another study, Bass and his colleagues conducted research to quantify the impact of future IPCC climate scenarios on US commercial buildings' energy use (Bass and New, 2023). Their results show a significant increase in total energy use in future scenarios, for the warmest parts of the US, as a result of an increase in cooling loads, and a substantial reduction in coldest areas, due to a decrease in gas needs and heating loads. Across these studies, including (Deng et al., 2023), the results show a significant reduction in heating loads and a considerable increase in cooling loads, as a result of climate change, but the overall energy use in the future primarily depends on the climate zone in which the study is conducted, and can be positive or negative. City-scale analyses for New York City project substantial rises in summer cooling under future warming (Ortiz et al., 2018), and validated simulations for Beijing indicate that the urban heat island increases cooling while reducing heating (Xu et al., 2018), together framing our expectation of cooling increases and heating decreases in dense urban areas. In parallel, grid-level forecasts such as the 2025 NYISO Gold Book project rising electricity demand in Zone K (Long Island) through 2055, reflecting regional electrification and load growth (New York Independent System Operator (NYISO), 2025). While broader in scope than UBEM, such studies share the goal of anticipating future energy needs under changing climate conditions.
Using UBEM, and by simulation and comparison of different building designs, materials, energy systems, etc., researchers and designers can recommend measures and strategies that reduce energy consumption and carbon emissions and enhance the resilience of urban areas to a changing climate. In a comprehensive study, Kamel reviewed physics-based modeling techniques, focusing on ECMs, and examined different case studies based on various criteria like building systems, archetypes, calibration methods, etc. (Kamel, 2022). The study shows that while existing tools and techniques can successfully simulate and assess different ECMs at larger scales, there are still some challenges, like standardization in UEBM, high-resolution energy data for calibration, and occupancy schedules that have to be addressed. In a study of a single building, researchers optimized energy-saving measures and operation parameters for a retrofitted office building in future climate conditions (Gao et al., 2023). They used a detailed simulation model, coupled with multi-objective optimization, and achieved significant energy savings while maintaining thermal comfort. Extended to an urban scale, Mayrhofer et al. assessed the energy-saving potential of passive cooling measures in Austrian buildings in 2050. They found a potential for up to 73% energy savings by measures like shading, night cooling, and sufficiency measures. The study suggests the need for further research to validate passive strategies by applying them to other regions and climate conditions (Mayrhofer et al., 2023). Similarly, city-scale studies in tropical coastal climates have applied UBEM to evaluate mitigation strategies such as reflective roofs, thermostat adjustments, and efficient cooling systems, showing that these measures can reduce cooling demand and alleviate peak loads (Pokhrel et al., 2019; Pokhrel and González-Cruz, 2021). At the national scale, ResStock and ComStock modeling identifies building typologies with the highest energy intensities and maps engineering pathways toward zero-carbon building stock by 2050 (Reyna et al., 2023).
The results gained by UBEM, considering climate change scenarios, can help policymakers and urban planners to develop regulations and incentives that help reduce carbon footprints and increase sustainable building practices to adapt to climate change. However, UBEM may still not be able to fully consider technological advancement, different policies’ implementation, and behavioral assumptions that affect energy usage. Broader modeling studies also highlight pathways: the EMF 37 study identified electrification and efficiency as primary levers for net-zero buildings in North America (Browning et al., 2023), while analyses in China stressed aligning building efficiency policies with long-term climate goals (Li and Shui, 2015).
As an important tool, Large-Scale BEM can help in designing and implementing low-carbon urban development strategies. Cities can reduce their emissions and align with climate goals by utilizing Large-Scale BEM to integrate renewable energy sources, green building technologies, and energy-efficient design principles. For example, studies of future London scenarios highlight that certain compact geometries improve efficiency, though overall demand may still rise with added cooling and EV loads (Ahmadian et al., 2022). In Dallas, UBEM-based analyses of transit-oriented development showed that densification and compactness can increase energy use intensity across building types (Trepci et al., 2020).
The choice of appropriate and adequate weather data can largely affect the buildings' energy results, especially for future scenarios (Erba et al., 2017). For creating future weather data, scientists use climate models to make projections based on different scenarios of future greenhouse gas emissions. Although there is no single perfect pathway to reach long-term climate goals, there are numerous possible approaches to reach the 1.5 C target, but clearly, all of them need rapid cuts in GHG emissions and need to be started immediately (Mitigation Pathways Compatible with Long-term Goals, 2023). The “Morphing” technique, by combining existing hourly weather data with predicted climate change information, showed promising results (Jentsch et al., 2013). To address the challenge of creating future weather files for UBEM, Manapragada et al. proposed an effective and affordable tool, the Future Weather File Generator (Manapragada et al., 2022). The tool uses geo-filtering and machine learning for accurate predictions, and it was tested in India as a case study.
The background highlights the challenges associated with Large-Scale and UBEM, like the need for accurate meteorological data, high computational cost and optimization, archetype definition, and the integration of climate change scenarios. Considering these challenges, this paper aims to implement an automated workflow using HPC to assess the energy behavior of over 340 thousand buildings in Nassau County, New York, under current and future climate conditions. The focus is to evaluate the impact of climate change on heating and cooling loads, and emissions from different energy carriers, and possibly identify the buildings that have priority for targeted energy retrofit incentives. In this paper, we execute Stage 1 of the roadmap, an automated, building-resolved UBEM under current and morphed future TMY, to quantify heating and cooling end uses and site/source energy and emissions. Subsequent stages (development of new archetypes, meter-based calibration, sensitivity analysis, exploration of additional climate scenarios, and policy/scenario analysis) are reserved for future work.
3 Methodology
This study utilizes a comprehensive simulation workflow to assess urban buildings’ energy performance under current and future climate conditions. The workflow encompasses several key stages, including the preparation of building models, the configuration and execution of simulations on an HPC cluster, and the post-processing of simulation results to analyze energy use and emissions. This can be easily customized with region-specific data and climate scenarios, making it suitable for modeling urban energy use in diverse geographic and climate contexts.
Initially, building models are prepared based on the dataset from the Model America project (New et al., 2025), including details on building geometry, materials, occupancy, and HVAC systems. These models are then configured in the EnergyPlus simulation engine, which is executed on an HPC cluster to efficiently process large datasets across thousands of buildings within a manageable timeframe. The computational resources of the HPC enable the parallelization of simulations, making large-scale urban modeling feasible.
Post-simulation, Python scripts are employed to automate the extraction and processing of results from the EnergyPlus output files. These scripts parse HTML files to retrieve the desired metrics such as total energy use, heating loads, and cooling loads. Simulations were executed separately with two climate files, the historical TMY and the morphed future TMY representing RCP8.5. Then with post-processing, building-level outputs were extracted (e.g., total energy use, heating, and cooling loads), allowing direct comparison between the current and future scenarios. Also, source energy was calculated at the building level by applying the source-to-site conversion factors to each building’s site energy use, then aggregating to county totals. The present paper reports results from Stage 1 only; later stages (new archetypes, calibration, sensitivity, additional scenarios, and policy analysis) are deferred to future work. The final scope of this study is shown in Table 1, and the overall workflow is illustrated in Figure 1.

Table 1. summarizes the scope of this case study, following the UBEM workflow categories discussed in (Kamel, 2022).
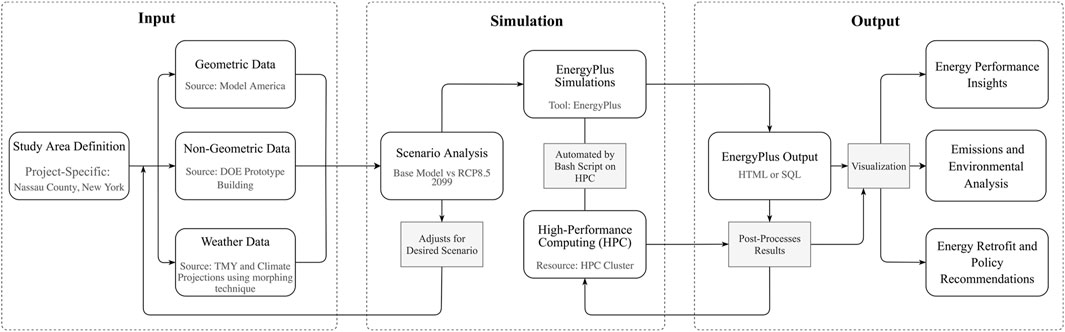
Figure 1. Overview of the simulation workflow and data processing.
3.1 Description of the study location and building dataset
This Nassau County (Figure 2) case study involves 346,827 building energy models simulated with EnergyPlus. The Google Map image (Web Mercator map projection) shows the outline of Nassau County and the buildings’ outlines are shown in a map with equal-area projection. Derived from the Model America dataset (New et al., 2025), the subset represents a mix of residential and commercial buildings in the county’s mixed-humid climate zone. The study focuses on individual buildings, providing a foundation for exploring urban-scale building energy modeling and its implications for global warming impacts in Nassau County. A preliminary version of this case study was presented at the ASHRAE Annual Conference (Jalilian and Kamel, 2025), and the present paper extends that work with a comprehensive county-wide UBEM workflow and expanded analyses, including residential vs. non-residential contributions and carbon emissions.
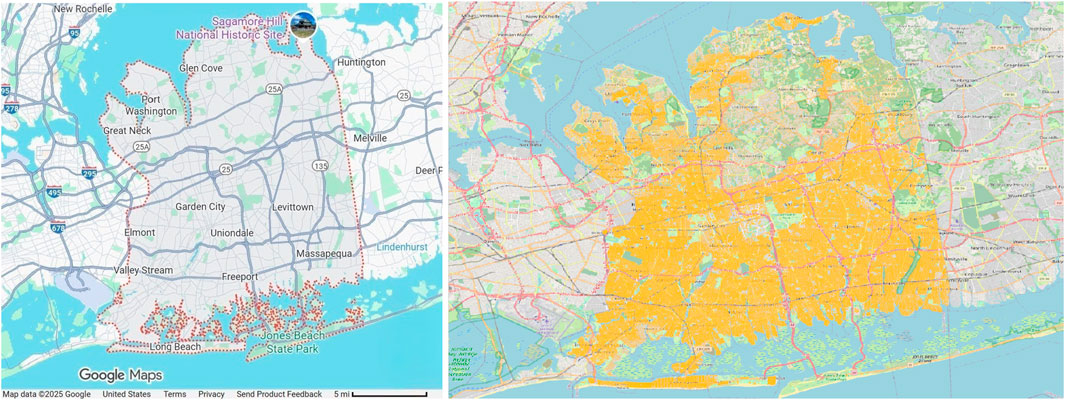
Figure 2. Nassau County, Long Island, New York. (Left) Study area shown on Google Maps (data source: Google Maps; Map data ©2025 Google). (Right) Outlines of simulated buildings generated in QGIS using building layout coordinates from Model America EnergyPlus files. North is up; the scale bar shown in the left panel applies to both panels.
The building archetypes used in this study are based on those already assigned in the Model America project (New et al., 2025), which applies DOE prototype models to individual buildings based on their building type, construction year, and size. These archetypes include characteristics, such as building envelope, HVAC systems, and occupancy schedules appropriate for ASHRAE climate zone 4A.
3.2 High-performance computing (HPC) for large-scale simulations
To process these large-scale simulations, the study leverages an HPC cluster, equipped with 24 cores, 192 GB of RAM, and four Nvidia V100 GPUs, which supports parallel CPU-based computations. Each building simulation is treated as an independent task, enabling the system to run thousands of simulations concurrently, significantly reducing processing time. This parallelization is critical for conducting high-resolution simulations across an urban area of 346,827 buildings, a task that would be infeasible using traditional serial processing methods.
Post-simulation Python scripts automate the extraction and processing of results from EnergyPlus output files. These scripts retrieve metrics such as total energy use, heating and cooling loads, and emissions, ensuring an efficient workflow from model generation to data analysis.
3.3 Current weather files vs. future climate data for 2099
In this study, TMY weather files, based on typical weather conditions rather than extreme events, were used due to their simplicity, representativeness, and acceptance as a standardized input. While in some cases TMY may lead to some inaccuracies in urban energy systems’ design (Perera et al., 2018), or building energy models (Ma and Yu, 2020), it would be aligned with the purpose of this study, which is to assess the effects of climate change on buildings’ energy behavior in a large scale, and previously showed valuable insights (Bass et al., 2022).
Despite the global trend towards cleaner energy, assessing Representative Concentration Pathway (RCP) 8.5 remains crucial for several reasons. First, it serves as a valuable benchmark for understanding potential high-risk futures (Riahi et al., 2011), providing a critical reference point for extreme climate impact scenarios. Additionally, significant feedback mechanisms, such as the release of greenhouse gases from thawing permafrost, could align with RCP8.5 outcomes (Schuur et al., 2022). Furthermore, recent trends, such as the record-high coal use in 2022 and projections from the IEA indicating continued increases until the end of the decade, underscore the possibility that RCP8.5 could still occur (IEA, 2023). Therefore, by using RCP8.5 in this study, we aim for the worst-case scenario, highlighting the importance of robust climate modeling and policy planning to mitigate severe impacts. We therefore treat RCP8.5 as an explicit stress test of building performance under severe warming. In future work, we will also run RCP4.5 as a sensitivity to cover a more moderate future.
For future weather data in this study, we used the WeatherShift tool (Dickinson and Brannon, 2016), which generates future TMY files by applying the Morphing technique (Jentsch et al., 2013) to standard historical TMY datasets. WeatherShift combines downscaled and bias-corrected outputs from multiple global climate models (GCMs) to modify key meteorological variables, such as temperature, solar irradiance, and humidity, ensuring consistency with projected climate conditions under RCP8.5. Thus, the baseline (current) TMY is based on observed historical weather data, while the future TMY represents a morphing-based projection of these data under a high-emission scenario.
One limitation is that the morphed data retains the characteristics of TMY data, meaning that extreme weather events are not fully captured. The baseline climate, derived from a Long Island weather station, may not fully represent all areas in Nassau County, but it is within the mixed-humid (4-A) climate zone. Figures 3, 4 compare current and future climate scenarios for average daily temperatures and monthly solar radiation. A standard baseline of 18.33 °C was defined for both Heating Degree Days (HDD) and Cooling Degree Days (CDD) calculation.
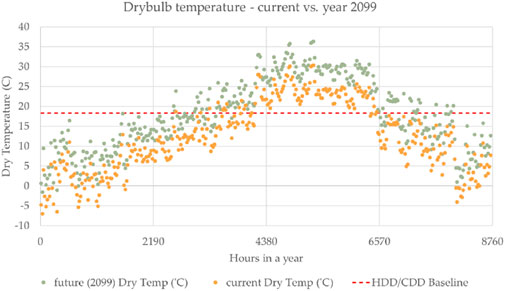
Figure 3. Hourly dry-bulb temperature for current TMY vs. fTMY for the year 2099.
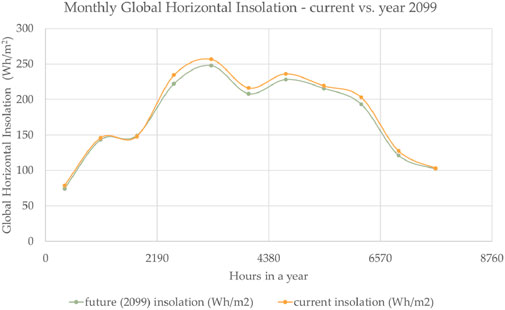
Figure 4. Monthly insolation for current TMY vs. fTMY for the year 2099.
While the TMY data offers simplified future climate conditions, it allows for scalability and broad applicability in building energy simulations. Future research could incorporate more complex weather models that capture temperature extremes and other meteorological variations to refine these projections.
4 Results and analysis
4.1 Site and source energy use intensity
The energy simulation, which is done by HPC and explained in detail in the previous section, shows that the average site Energy Use Intensity (EUI) decreases by 26% in the future scenario compared to the current situation (Figure 5). This decrease can be a result of the considerable reduction in heating energy demand in the future caused by climate change. It is important to note that the Energy Use Intensity (EUI) being used in this paper is only the energy needed for heating and cooling, which is directly under the influence of climate change and does not include other energy end-uses such as lighting, domestic hot water, and appliances. In addition, cooling loads reported here represent the technical demand simulated under the assumption that air conditioning equipment is available to meet the thermal demand, regardless of current penetration levels. To have a better understanding, and since averaging the site energy use may not be a favorable parameter because not all the energy carriers have the same conversion efficiencies, the source EUI is also plotted in Figure 6, showing a 4% reduction in average between current and future scenarios. This shows that even though a considerable reduction is seen in the site energy use, the potential shifts of the load from natural gas consumption in winter to electricity in summer, the production of which is less efficient, can cancel out the savings in heating load, in total source energy use. These shifts are further explained in Section 4.6, where we analyze the influence of weather and temperature changes on building energy use.
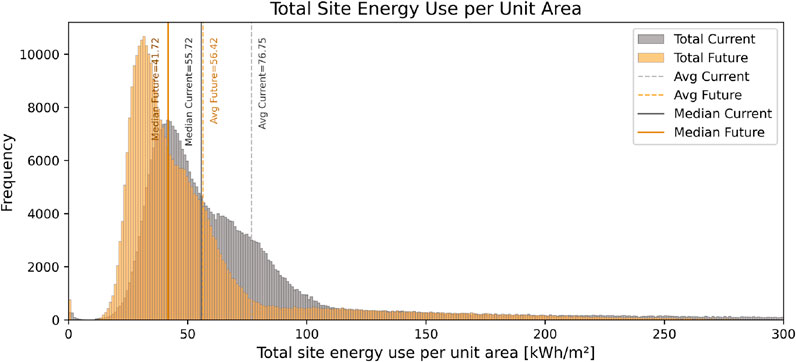
Figure 5. Comparison between current and future total site energy use per unit area.
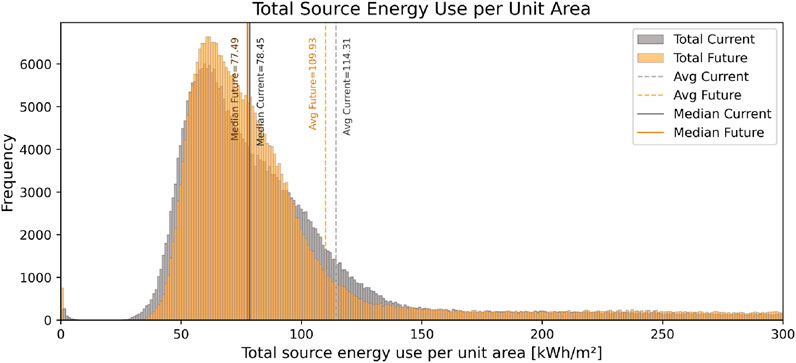
Figure 6. Comparison between current and future total source energy use per unit area.
4.2 Cooling and heating loads
Breaking down the results into cooling and heating loads, which are illustrated in Figures 7, 8, shows a considerable reduction of 51% in average source heating energy intensity, and an increase of 96% in average for the cooling side. It can be concluded that in the future scenario, in a Mixed-Humid climate zone (i.e., 4-A), milder winter loads and harsher summer loads might be seen.
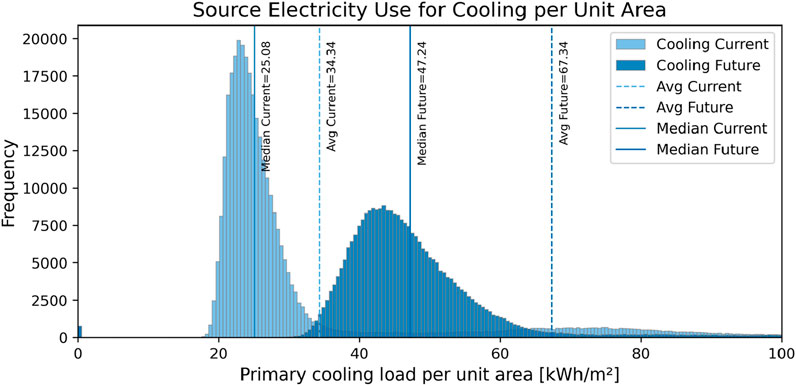
Figure 7. Comparison between current and future cooling source energy use per unit area.
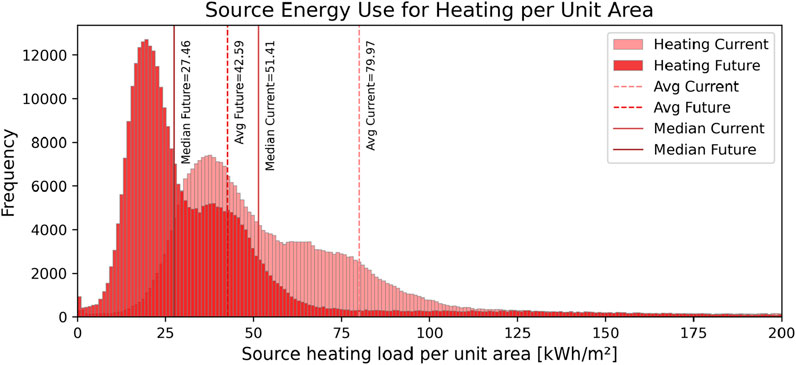
Figure 8. Comparison between current and future heating source energy use per unit area.
A notable point is that the data in all of Figures 6–8 are positively skewed, with the mean pulled towards the higher end of the graphs. This shows that there are some buildings with very high cooling, heating, or total energy use intensities compared to the majority of the buildings, which are located on the lower end. By going deeper into the details, it’s understood that only 21% of the total number of buildings have an EUI more than the average. This includes 92% of all non-residential buildings and 13% of the residential buildings. It’s clear that non-residential buildings, with much higher source energy use, are causing positive skewness of these histograms. Knowing this can be quite useful, since policies and initiatives might be designed not only to promote energy efficiency in most buildings but also to address and mitigate the impact of the high energy users (Baneshi and Hadianfard, 2016), in this case, mostly non-residential, to achieve more balanced and sustainable energy consumption across the entire set of buildings. The gap between median and average values highlights the inequality in energy consumption, where a relatively small group of buildings consumes disproportionately more energy than the majority, making them a key focus for targeted interventions to achieve more balanced and sustainable energy use across the stock.
While detailed measured data for county-level cooling energy use are not publicly available for Nassau County, an approximate verification and simple plausibility check of the simulated cooling results were conducted by comparing the modeled baseline against city-level estimates from the NYSERDA (Guidehouse, 2021) study for New York City (New York State Energy Research and Development Authority (NYSERDA), 2021). Using the NYC site cooling EUIs from Table C-1 of their report (≈11.3 kWh·m-2·yr-1 for residential and ≈23 kWh·m-2·yr-1 for non-residential), weighted by our building-count distribution shown in Figure 13 (89.9% residential and 10.1% non-residential), yields a mean of ≈12.5 kWh·m-2·yr-1, slightly above our modeled average site cooling EUI of 10.8 kWh·m-2·yr-1 for Nassau County. This close alignment suggests that the simulated magnitudes are realistic for current conditions, with the small gap potentially reflecting the stronger urban heat island (UHI) effect and higher non-residential cooling intensity in New York City. Yet, a full calibration using measured or metered data will be conducted in future work to establish definitive validation.
4.3 Energy use by different sources
Depending on the characteristics of the buildings, e.g., age, type, etc., different archetypes and consequently different combinations of the HVAC systems have been employed for each building in the study (New et al., 2025). As an example, an office building might have a VAV air-based system that uses a heat pump for the heating coil, with a gas boiler backup system in winter, and a heat pump for summer. As a result, the heating system can be a combination of both gas and electric sources, while the cooling systems are solely electric-based. Knowing this and by further breaking down the total energy use by different energy sources in Figure 9, a total reduction of 20.1% in site energy use can be seen for the future scenario, while this is not the case for source energy in Figure 10, which is increased by 5.36% in the future case. It explains that despite a significant decrease in heating loads being seen in the future, the jump in cooling load, which is being produced primarily by electricity, is dominant and caused an increase of over 5% in total source energy use. Worth mentioning that in this study, a constant source-to-site ratio (3.167 for electricity and 1.084 for natural gas, based on EnergyPlus documentation (U.S. Department of Energy, 2023)) is considered both for electricity and gas, which might not be the case in reality, as they are changing over time and in different regions. Especially the source-to-site conversion factor for electricity, which is being improved by technological advancement and the use of renewable sources of energy over time.
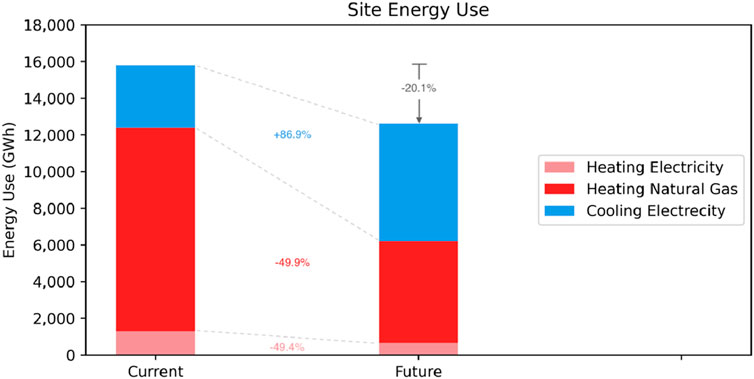
Figure 9. Comparison between current and future total site energy use by different energy sources.
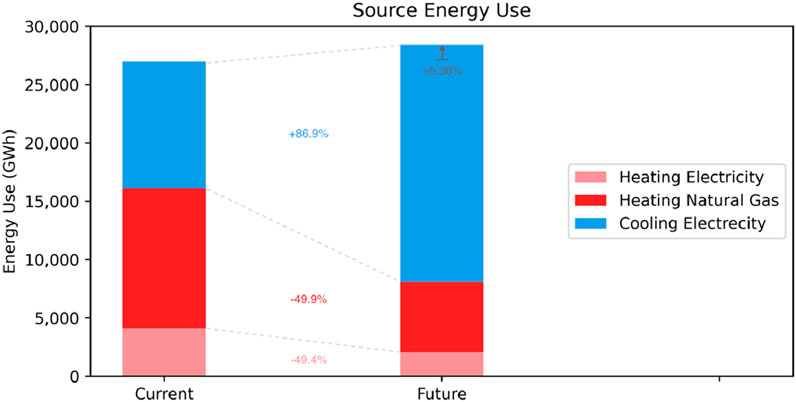
Figure 10. Comparison between current and future total source energy use by different energy sources.
4.4 Residential vs. non-residential energy use
Furthermore, the total site and source energy use for residential and non-residential buildings have been shown in Figures 11, 12, respectively. It is noticeable that the main source of heating for residential buildings is gas, while in non-residential ones, some buildings use gas, electricity, or a combination of both. While we see a considerable reduction in total end-use energy for both categories of buildings because of milder winters in the future, a slight increase in source energy use can be seen for both residential and non-residential buildings. Electricity will play a vital role for non-residential buildings in the future, corresponding to 89% of the total primary energy use, while this number will be 69% for residential buildings. These two numbers necessitate an emphasis that must be put on improving the electricity production and conversion efficiency, which can consequently help toward the long-term carbon reduction goals.
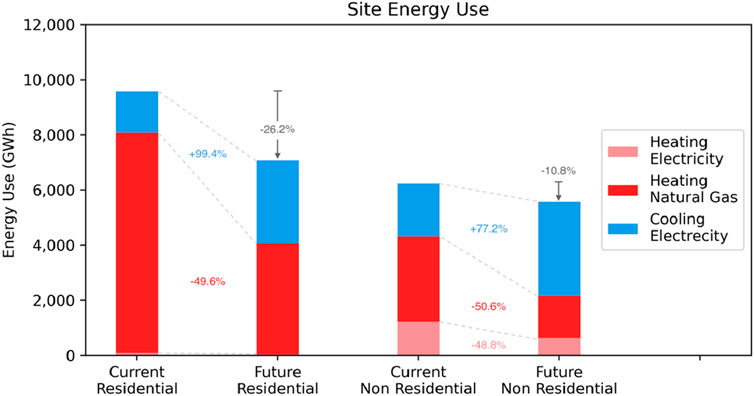
Figure 11. Comparison between current and future total site energy use by different energy sources and building types.
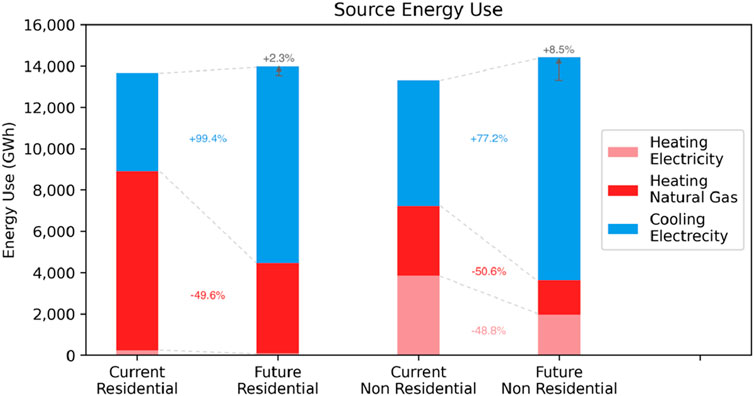
Figure 12. Comparison between current and future total source energy use by different energy sources and building types.
A notable point from Figures 11, 12 is that the amount of the source energy used is almost equal in residential and non-residential buildings within a margin of 5%. This is true for both current and future scenarios. This leads to a further breakdown in Figure 13. Despite non-residential buildings constituting a relatively small percentage of the total number of buildings (10.1%) and representing 32.9% of the total floor area, interestingly, they are responsible for 49.3% and 50.8% of the total source energy use in current and future scenarios, respectively. This emphasizes the critical role they play in the future energy use landscape that must be addressed (Mariano-Hernández et al., 2021). Despite their smaller share of the stock, non-residential buildings dominate future source energy use because they are substantially larger in floor area on average, rely more heavily on electricity for both heating and cooling, and are therefore more affected by the higher source-to-site conversion factor for electricity compared to natural gas.
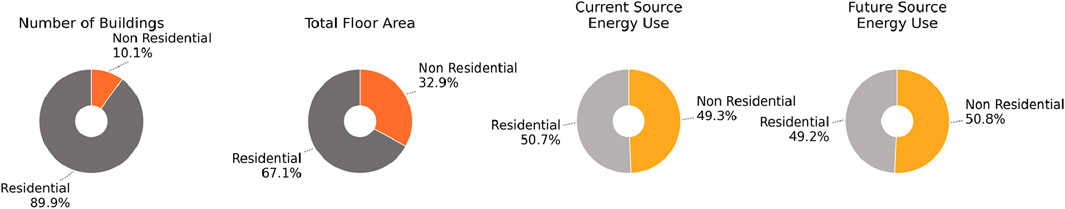
Figure 13. Comparison between the number of buildings, total floor area, and source energy use.
4.5 Carbon emissions
Moreover, Figure 14 shows carbon emissions as a result of the energy use for current and future scenarios. The emission factors are defined according to the U.S. Environmental Protection Agency (EPA) for gas and electricity at (U.S. Environmental Protection Agency (EPA), 2021) and (U.S. Environmental Protection Agency (EPA), 2024) respectively. The emission factor that is used for electricity in this study is specifically defined with respect to the electricity production sources in Long Island, NY. As it is clear from the results, like the source and site energy uses, a substantial reduction of 50% in carbon emission can be seen due to the reduction in gas consumption for heating, while the emission produced by electricity consumption for cooling increased significantly, about 99%, in both residential and non-residential buildings. The total carbon emission is estimated to decrease by about 4% in residential buildings, while it is a 5% increase in non-residential buildings, from the current to the future case. These results highlight how different types of buildings use energy and affect the environment, showing that specific plans are needed to reduce carbon emissions from various building sources (Ang et al., 2023).
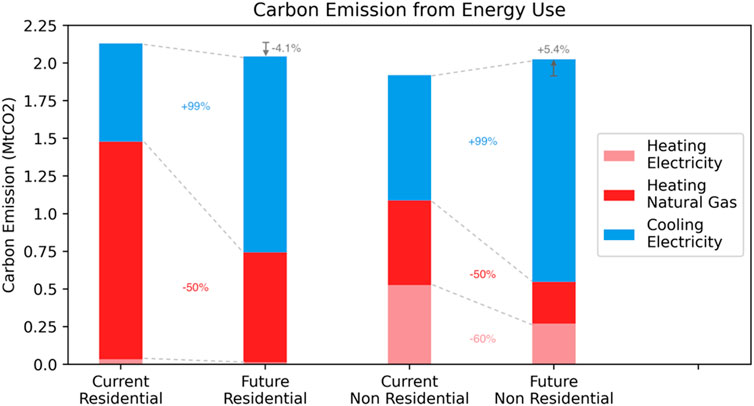
Figure 14. Total carbon emissions for current and future scenarios in Nassau County.
4.6 Impact of climate and temperature changes
Lastly, while this study shows that for a mixed-humid climate zone, like the one of Nassau County, in which the heating load is dominant, the site energy use has been decreased by almost 20% for the future scenario (Figure 9), it is completely depending on the weather condition and location of the case study and it should not be deceiving. As illustrated in Figure 15 by plotting the monthly average temperature for the current and future cases and the average thermostat set-point temperatures in winter and summer, it can be seen that, for the case of Nassau County, the difference of the external temperature and the thermostat set-point is reduced for the future case, which leads to a decrease in heating loads. On the other hand, the difference in the average external temperature and cooling set-point is increased, which simply leads to an increase in cooling loads in the future. Obviously, for warmer climate zones, in which the dominant load is cooling, a harsher increase in cooling loads will be seen.
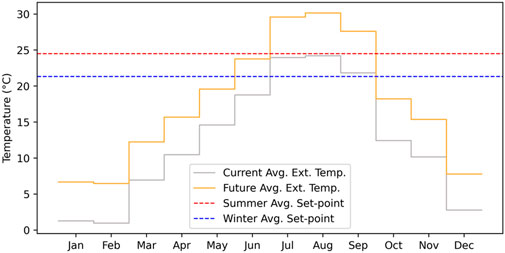
Figure 15. Average external temperature for current and future scenarios and summer and winter temperature set-points.
5 Discussion
The results provide important trends and patterns for both current and future scenarios in residential and non-residential buildings. Importantly, the breakdown of energy consumption by building type and the following analysis of source and site energy use patterns reveal important considerations for energy efficiency and sustainability actions.
It is concluded that, depending on the climate zone and the conversion approach in creating fTMY (Bass et al., 2022), the mixed-humid climate zone might experience an increase in cooling loads and a decrease in heating loads, which resulted in reduced energy use in some buildings and an increase in others. Depending on the balance between heating and cooling degree days, climate change’s overall impact varies between regions.
In general, for both source and site energy, a substantial reduction in heating and a significant increase in cooling loads are observed. Although the results indicated that the site energy use will be reduced by almost 20% in the future scenario due to the milder winters, which is the dominant load for this climate zone, this is not the case for source energy. The total source energy is increased by over 5% in the future case, since the increase in cooling loads, which is solely provided by the electricity, not only cancels out the savings in milder winters in the future but also increases the total source energy use.
Although the non-residential buildings constitute around 10% of the total number of buildings in the study area, they have a substantial overall impact and are responsible for over 50% of the total source energy use in the future scenario. Since a large portion of the load is being produced by electricity, both for heating and cooling, in non-residential buildings, their bold contribution to total source energy use seems to be logical.
The analysis showed that in the future scenario, electricity will be responsible for around 89% of the total source energy in non-residential buildings and 69% for residential ones. Comparable studies for New York City have shown that electrification substantially reshapes electricity demand profiles and urban thermal conditions, and that the electrification of heating and domestic hot water systems will push electricity demand even higher, which supports the implications of our projected high electric share (Gamarro and González-Cruz, 2023). Providing a broader regional context, the 2025 NYISO Gold Book similarly projects continued growth in overall electricity demand for Long Island, confirming that this building-level trend aligns with larger, multi-sector energy forecasts (New York Independent System Operator (NYISO), 2025). This significant shift to electricity in building stock indicates the emphasis that has to be put on increasing the efficiency of electricity production. While using more efficient power plants, less fossil fuel, more renewable production sources, and investing in distributed systems seem to be feasible technical solutions, other aspects like social, economic, business, and governance challenges have to be addressed as well (Eyre et al., 2018).
Moreover, this jump in electricity use highlights the importance of grid cleaning and power sector decarbonization, which not only helps in climate change mitigation (Leibowicz et al., 2018; Zhao and You, 2020), but also improves public health (Luderer et al., 2019), increases energy security (Rabbi et al., 2022), provides economic benefits (Jacobson et al., 2019), and accelerates the innovation and technological advancement (Di Silvestre et al., 2018). When this initiative comes along with the integration of renewable sources into the grids and a growing number of Electric Vehicles (EVs), it signifies that the study of Demand Response (DR) for Building-to-Grid (B2G) integration and management on an urban scale would be inevitable (Vázquez-Canteli and Nagy, 2019) and can be used for more precise modeling of occupant’s behavior (Osman et al., 2024) and HVAC optimization (Razmara et al., 2017). At the same time, experience from New York City shows that cooling costs weigh disproportionately on low-income households, and that simple measures such as reflective roofs or modest set-point changes can help ease this burden (Ortiz et al., 2022)
While the total emissions barely remained unchanged from the current to the future scenario, we see a decrease of 4% in residential buildings and an increase of 5% for non-residential buildings. Taking advantage of these statistics, by proper energy efficiency policies and incentives on non-residential buildings, which correspond to about 10% of the total buildings in Nassau County, NY, promising carbon emission reductions can be achieved.
The dependence of site energy use reduction on climate conditions emphasizes that local weather patterns are crucial factors. For a Mixed-Humid climate like Nassau County, where heating loads dominate, a decrease in site energy use is observed. However, the applicability of these results should be considered with caution, as they heavily rely on specific climate conditions.
While this study aggregates building-level simulations to represent county-wide energy behavior, it does not explicitly account for Urban Heat Island (UHI) effects or local microclimate variations, which can influence air temperatures and cooling loads in denser urban areas (Xu et al., 2018). Previous city-scale coupled modeling studies (Ortiz et al., 2022; Ortiz et al., 2017) have demonstrated that integrating atmospheric feedback and grid-level energy data can improve the representation of spatial temperature variability and baseline energy demand. Their methods separate weather-dependent and baseline loads, enabling more accurate benchmarking of urban energy models against observed demand. Nevertheless, the present large-scale approach retains the precision needed to inform county-wide energy and decarbonization planning. Future work will explore the integration of UBEM with mesoscale climate models or grid-level baselines to capture microclimatic effects more accurately, complementing the current focus on aggregate results that provide policymakers with actionable insights for broad-scale energy interventions.
5.1 Limitations and uncertainties
In this study, the energy models rely on TMY data, which, unlike actual weather data, represents the most common weather conditions based on historical data. In addition, the fTMY in this study only accounts for the temperature and solar radiation increase and does not consider any extremely low or high temperatures that could be a side effect of climate change. Also, the significant increases in temperatures are uncertain, and different scenarios could be evaluated in the future.
The building energy models benefit from measured geometries. Still, other important inputs, such as schedules, thermostat settings, heating and cooling system properties, and envelope system thermal properties, are all assumed from the energy codes adapted from the construction year per the Model America project. Although knowing the buildings' construction year (i.e., vintage) reduces the uncertainties to a certain degree, other assumptions could differ from the actual buildings’ characteristics. The simulation is also set to a 1-h resolution to reduce the simulation time, which could affect the accuracy of time-of-use but would not affect the accuracy of total energy consumption because the weather files are based on hourly inputs.
From the results, it is understood that electricity will play a vital role as the primary energy source for the future scenario. In this study, the source-to-site conversion factors are considered constant for the future case. Considering the dynamic source-to-site conversion factors over time, and integration of renewable energy technologies, and their potential impact on the source-to-site conversion factors, which will be the case as a result of technological advancement, as well as the electrification of heating and hot water systems, can be studied further to give us more realistic results for future cases.
This study used one future climate scenario (RCP8.5 for 2099) and the same weather file for all buildings, which means local weather differences within the county were not considered. Also, buildings were modeled independently, without including the effects of nearby buildings like shading or heat exchange. These simplifications helped make large-scale simulation possible but reduced accuracy in capturing local and urban effects. Future work will include more climate scenarios, detailed weather data, and urban form effects.
5.2 Urban planning, policy-making, and future research
As the results indicated, a significant shift to electricity is expected. Apart from the technical solutions that can be implemented to improve the efficiency of electricity production, considering the societal and economic aspects of these practices would be crucial (Nidam et al., 2023). It can include dealing with uncertainties caused by climate change and human systems (Perera et al., 2022), along with the assessment of the occupant behavior (Happle et al., 2018), acceptance and adaptation to the new technologies, and the transition of households to be energy prosumers instead of being only consumers (Parag and Sovacool, 2016).
Future research can focus on dynamic climate change scenarios, considering different climate patterns and extreme weather conditions. It can be useful to assess how different climate patterns affect energy use in spatial and temporal granularities, to reach more accurate predictions and potential improvement strategies.
Furthermore, the effectiveness of different ECMs under the influence of probable climate scenarios can be assessed to give a more accurate overview of the potential future policies and incentive allocations by governments and policymakers.
Lastly, a key limitation of this study is that the current results are not yet calibrated against measured building or district-level energy data due to limited access to private data in the understudied county. Calibration and validation will be addressed in subsequent work, in line with UBEM best practice, to ensure the accuracy and applicability of the modeled results. While the workflow is designed to be scalable, its practical deployment at larger regional or national levels remains limited by computational demands, the representativeness of archetypes across diverse building stocks, and the availability of calibration datasets.
6 Conclusion
This study developed an automated and scalable Large-Scale Building Energy Modeling workflow, and it was applied to over 346,000 buildings in Nassau County, New York, to assess the impact of climate change on energy demand by 2099 under RCP8.5 conditions using morphed Typical Meteorological Year (TMY) data. Through the assistance of High-Performance Computing (HPC) and a bottom-up simulation approach, the study demonstrates how large-scale and detailed energy assessment can inform climate mitigation planning at the urban scale and county level.
Key contributions and findings of this work could be listed as follows:
• A streamlined, large-scale BEM process that is scalable and incorporates country-level EnergyPlus physics-based models, climate morphed data, and HPC-parallelized runs to enable large-scale, climate-enlightened energy modeling in any geographic or climatic context.
• The quantitative evidence of future energy transitions showed that whereas site energy demand decreases by ∼20%, source energy consumption increases by ∼5%, due to more electricity consumption for cooling, which is a significant observation in evaluating electrification possibilities under conditions of global warming.
• The results identified the high-impact targets of non-residential buildings, accounting for over 50% of aggregate source energy consumption, though they only account for 10% of the building inventory, which is a clear case for systemic retrofits and policy attention.
• Grid decarbonization is critical, as further electrification (mostly for cooling) will not reduce emissions until electricity generation becomes radically cleaner. This highlights the co-dependency of building-sector approaches and energy infrastructure shifts.
These findings give a real-world basis for county- or city-scale planning, policymaking, and energy transition simulation. The procedure here is transportable to different emissions scenarios (e.g., RCP4.5, RCP2.6) and world regions and therefore offers a helpful tool for researchers and practitioners studying the intersection of climate change and urban energy demand.
Subsequent studies should also expand on this method by including real energy consumption data for calibration, varying climate change scenarios, and incorporating demand response and building-to-grid interactions to better represent future urban energy systems.
Data availability statement
The original contributions presented in the study are included in the article/supplementary material, further inquiries can be directed to the corresponding authors.
Author contributions
RJ: Visualization, Validation, Formal Analysis, Writing – original draft. EK: Methodology, Resources, Writing – original draft, Writing – review and editing, Project administration.
Funding
The author(s) declare that financial support was received for the research and/or publication of this article. This research was supported by New York Institute of Technology, 2022 Institutional Support of Research and Creativity Grant (ISRC) for work on climate change impacts on urban-scale building energy use in Nassau County.
Conflict of interest
The authors declare that the research was conducted in the absence of any commercial or financial relationships that could be construed as a potential conflict of interest.
Generative AI statement
The author(s) declare that Generative AI was used in the creation of this manuscript. Generative AI (ChatGPT) was used to assist with language refinement, clarity of expression, and the structuring of selected sections. All scientific content, original writing, analysis, methodology, results, and conclusions were developed by the authors, who take full responsibility for the final manuscript.
Any alternative text (alt text) provided alongside figures in this article has been generated by Frontiers with the support of artificial intelligence and reasonable efforts have been made to ensure accuracy, including review by the authors wherever possible. If you identify any issues, please contact us.
Publisher’s note
All claims expressed in this article are solely those of the authors and do not necessarily represent those of their affiliated organizations, or those of the publisher, the editors and the reviewers. Any product that may be evaluated in this article, or claim that may be made by its manufacturer, is not guaranteed or endorsed by the publisher.
References
Abed Hassan, S., and Ismail Husain, S. (2022). The effect of climate change on energy consumption and environmental pollution according to degree days indicator ‘baghdad city as an example. IOP Conf. Ser. Earth Environ. Sci. 1002 (1), 012013. doi:10.1088/1755-1315/1002/1/012013
Ahmadian, E., Bingham, C., Elnokaly, A., Sodagar, B., and Verhaert, I. (2022). Impact of climate change and technological innovation on the energy performance and built form of future cities. Energies (Basel) 15 (22), 8592. doi:10.3390/en15228592
Ali, U., Shamsi, M. H., Hoare, C., Mangina, E., and O’Donnell, J. (2021). Review of urban building energy modeling (UBEM) approaches, methods and tools using qualitative and quantitative analysis. Energy Build. 246, 111073. doi:10.1016/j.enbuild.2021.111073
Ang, Y. Q., Berzolla, Z. M., and Reinhart, C. F. (2020). From concept to application: a review of use cases in urban building energy modeling. Appl. Energy 279, 115738. doi:10.1016/j.apenergy.2020.115738
Ang, Y. Q., Berzolla, Z. M., Letellier-Duchesne, S., Jusiega, V., and Reinhart, C. (2022). UBEM.io: a web-based framework to rapidly generate urban building energy models for carbon reduction technology pathways. Sustain Cities Soc. 77, 103534. doi:10.1016/j.scs.2021.103534
Ang, Y. Q., Berzolla, Z. M., Letellier-Duchesne, S., and Reinhart, C. F. (2023). Carbon reduction technology pathways for existing buildings in eight cities. Nat. Commun. 14 (1), 1689. doi:10.1038/s41467-023-37131-6
Bamdad, K., Cholette, M. E., Omrani, S., and Bell, J. (2021). Future energy-optimised buildings — addressing the impact of climate change on buildings. Energy Build. 231, 110610. doi:10.1016/j.enbuild.2020.110610
Baneshi, M., and Hadianfard, F. (2016). Techno-economic feasibility of hybrid diesel/PV/wind/battery electricity generation systems for non-residential large electricity consumers under southern Iran climate conditions. Energy Convers. Manag. 127, 233–244. doi:10.1016/j.enconman.2016.09.008
Bass, B., and New, J. (2023). How will United States commercial building energy use be impacted by IPCC climate scenarios? Energy 263, 125945. doi:10.1016/j.energy.2022.125945
Bass, B., New, J., and Wade, Z. (2022). “Future typical meteorological year (fTMY) weather data and climate change impacts to maricopa county, Arizona,” in Proceedings of the 9th ACM international conference on systems for energy-efficient buildings, cities, and transportation (New York, NY, USA: ACM, Nov.), 504–507. doi:10.1145/3563357.3567408
Bhandari, M., Shrestha, S., and New, J. (2012). Evaluation of weather datasets for building energy simulation. Energy Build. 49, 109–118. doi:10.1016/j.enbuild.2012.01.033
Browning, M., McFarland, J., Bistline, J., Boyd, G., Muratori, M., Binsted, M., et al. (2023). Net-zero CO2 by 2050 scenarios for the United States in the energy Modeling Forum 37 study. Energy Clim. Change 4, 100104. doi:10.1016/j.egycc.2023.100104
Cerezo, C., Sokol, J., AlKhaled, S., Reinhart, C., Al-Mumin, A., and Hajiah, A. (2017). Comparison of four building archetype characterization methods in urban building energy modeling (UBEM): a residential case study in Kuwait City. Energy Build. 154, 321–334. doi:10.1016/j.enbuild.2017.08.029
Chen, R., Samuelson, H., Zou, Y., Zheng, X., and Cao, Y. (2024). Improving building resilience in the face of future climate uncertainty: a comprehensive framework for enhancing building life cycle performance. Energy Build. 302, 113761. doi:10.1016/j.enbuild.2023.113761
de Rubeis, T., Giacchetti, L., Paoletti, D., and Ambrosini, D. (2021). Building energy performance analysis at urban scale: a supporting tool for energy strategies and urban building energy rating identification. Sustain Cities Soc. 74, 103220. doi:10.1016/j.scs.2021.103220
Deng, Z., Javanroodi, K., Nik, V. M., and Chen, Y. (2023). Using urban building energy modeling to quantify the energy performance of residential buildings under climate change. Build. Simul. 16 (9), 1629–1643. doi:10.1007/s12273-023-1032-2
Di Silvestre, M. L., Favuzza, S., Riva Sanseverino, E., and Zizzo, G. (2018). How decarbonization, Digitalization and Decentralization are changing key power infrastructures. Renew. Sustain. Energy Rev. 93, 483–498. doi:10.1016/j.rser.2018.05.068
Dickinson, R., and Brannon, B. (2016). “Generating future weather files for resilience,” in Proceedings of the international conference on passive and low energy Architecture (Los Angeles, CA, USA), 11–13.
Erba, S., Causone, F., and Armani, R. (2017). The effect of weather datasets on building energy simulation outputs. Energy Procedia 134, 545–554. doi:10.1016/j.egypro.2017.09.561
Eyre, N., Darby, S. J., Grünewald, P., McKenna, E., and Ford, R. (2018). Reaching a 1.5°C target: socio-technical challenges for a rapid transition to low-carbon electricity systems. Philosophical Trans. R. Soc. A Math. Phys. Eng. Sci. 376 (2119), 20160462. doi:10.1098/rsta.2016.0462
Ferrando, M., Causone, F., Hong, T., and Chen, Y. (2020). Urban building energy modeling (UBEM) tools: a state-of-the-art review of bottom-up physics-based approaches. Sustain Cities Soc. 62, 102408. doi:10.1016/j.scs.2020.102408
Gamarro, H., and González-Cruz, J. E. (2023). On the electrification of Winter season in cold climate Megacities—The case of New York City. ASME J. Eng. Sustain. Build. Cities 4 (3), 031006. doi:10.1115/1.4063377
Gao, B., Zhu, X., Ren, J., Ran, J., Kim, M. K., and Liu, J. (2023). Multi-objective optimization of energy-saving measures and operation parameters for a newly retrofitted building in future climate conditions: a case study of an office building in Chengdu. Energy Rep. 9, 2269–2285. doi:10.1016/j.egyr.2023.01.049
Happle, G., Fonseca, J. A., and Schlueter, A. (2018). A review on occupant behavior in urban building energy models. Energy Build. 174, 276–292. doi:10.1016/j.enbuild.2018.06.030
Hausfather, Z., and Peters, G. P. (2020). Emissions – the ‘business as usual’ story is misleading. Nature 577 (7792), 618–620. doi:10.1038/d41586-020-00177-3
Hong, T., Chen, Y., Luo, X., Luo, N., and Lee, S. H. (2020). Ten questions on urban building energy modeling. Build. Environ. 168, 106508. doi:10.1016/j.buildenv.2019.106508
IEA (2023). Coal 2023. Paris: IEA. Available online at: https://www.iea.org/reports/coal-2023.
Jacobson, M. Z., Delucchi, M. A., Cameron, M. A., Coughlin, S. J., Hay, C. A., Manogaran, I. P., et al. (2019). Impacts of green new deal energy plans on grid stability, costs, jobs, health, and climate in 143 countries. One Earth 1 (4), 449–463. doi:10.1016/j.oneear.2019.12.003
Jafarpur, P., and Berardi, U. (2021). Effects of climate changes on building energy demand and thermal comfort in Canadian office buildings adopting different temperature setpoints. J. Build. Eng. 42, 102725. doi:10.1016/j.jobe.2021.102725
Jalilian, R., and Kamel, E. (2025). “Assessing climate change effects on building energy sector in a mixed-humid climate Zone using Urban-Scale Building Energy Modeling (UBEM),” in 2025 ASHRAE Winter conference (Peachtree Corners, GA: ASHRAE). doi:10.63044/w25jal22
Jentsch, M. F., James, P. A. B., Bourikas, L., and Bahaj, A. S. (2013). Transforming existing weather data for worldwide locations to enable energy and building performance simulation under future climates. Renew. Energy 55, 514–524. doi:10.1016/j.renene.2012.12.049
Kamel, E. (2022). A systematic literature review of physics-based Urban Building Energy Modeling (UBEM) tools, data sources, and challenges for energy conservation. Energies (Basel) 15 (22), 8649. doi:10.3390/en15228649
Leibowicz, B. D., Lanham, C. M., Brozynski, M. T., Vázquez-Canteli, J. R., Castejón, N. C., and Nagy, Z. (2018). Optimal decarbonization pathways for urban residential building energy services. Appl. Energy 230, 1311–1325. doi:10.1016/j.apenergy.2018.09.046
Li, J., and Shui, B. (2015). A comprehensive analysis of building energy efficiency policies in China: status quo and development perspective. J. Clean. Prod. 90, 326–344. doi:10.1016/j.jclepro.2014.11.061
Luderer, G., Pehl, M., Arvesen, A., Gibon, T., Bodirsky, B. L., de Boer, H. S., et al. (2019). Environmental co-benefits and adverse side-effects of alternative power sector decarbonization strategies. Nat. Commun. 10 (1), 5229. doi:10.1038/s41467-019-13067-8
Ma, Y. X., and Yu, C. (2020). Impact of meteorological factors on high-rise office building energy consumption in Hong Kong: from a spatiotemporal perspective. Energy Build. 228, 110468. doi:10.1016/j.enbuild.2020.110468
Manapragada, N. V. S. K., Shukla, A. K., Pignatta, G., Yenneti, K., Shetty, D., Nayak, B. K., et al. (2022). Development of the Indian future weather file generator based on representative concentration pathways. Sustainability 14 (22), 15191. doi:10.3390/su142215191
Mariano-Hernández, D., Hernández-Callejo, L., Zorita-Lamadrid, A., Duque-Pérez, O., and Santos García, F. (2021). A review of strategies for building energy management system: model predictive control, demand side management, optimization, and fault detect and diagnosis. J. Build. Eng. 33, 101692. doi:10.1016/j.jobe.2020.101692
Mayrhofer, L., Müller, A., Bügelmayer-Blaschek, M., Malla, A., and Kranzl, L. (2023). Modelling the effect of passive cooling measures on future energy needs for the Austrian building stock. Energy Build. 296, 113333. doi:10.1016/j.enbuild.2023.113333
Mills, E. (2004). Inter-comparison of North American residential energy analysis tools. Energy Build. 36 (9), 865–880. doi:10.1016/j.enbuild.2003.11.005
Mitigation Pathways Compatible with Long-term Goals (2023). in Climate Change 2022 - mitigation of climate Change (Cambridge University Press), 295–408. doi:10.1017/9781009157926.005
New, J., Adams, M., Berres, A., Bass, B., and Clinton, N. (2025). “Model America – data and models of every U.S. building,” doi:10.13139/ORNLNCCS/1774134
New York Independent System Operator (NYISO) (2025). Load and Capacity Data Report (Gold Book). Available online at: https://www.nyiso.com/documents/20142/2226333/2025-Gold-Book-Public.pdf (Accessed: September 22, 2025).
New York State Energy Research and Development Authority (NYSERDA) (2021). “Climate change: equitable access to cooling in New York City,” in NYSERDA report number 21-27. Albany, NY: Prepared by Guidehouse, Inc. nyserda.ny.gov/publications.
Nguyen, A. T., Rockwood, D., Doan, M. K., and Dung Le, T. K. (2021). Performance assessment of contemporary energy-optimized office buildings under the impact of climate change. J. Build. Eng. 35, 102089. doi:10.1016/j.jobe.2020.102089
Nidam, Y., Irani, A., Bemis, J., and Reinhart, C. (2023). Census-based urban building energy modeling to evaluate the effectiveness of retrofit programs. Environ. Plan. B Urban Anal. City Sci. 50 (9), 2394–2406. doi:10.1177/23998083231154576
Nutkiewicz, A., Yang, Z., and Jain, R. K. (2018). Data-driven Urban Energy Simulation (DUE-S): a framework for integrating engineering simulation and machine learning methods in a multi-scale urban energy modeling workflow. Appl. Energy 225, 1176–1189. doi:10.1016/j.apenergy.2018.05.023
Office of Energy Efficiency and Renewable Energy (2022). Prototype building models. Washington, DC: U.S. Department of Energy.
Oraiopoulos, A., and Howard, B. (2022). On the accuracy of urban building energy modelling. Renew. Sustain. Energy Rev. 158, 111976. doi:10.1016/j.rser.2021.111976
Ortiz, L. E., Gonzalez, J. E., Gutierrez, E., and Arend, M. (2017). Forecasting building energy demands with a coupled weather-building energy model in a dense urban environment. J. Sol. Energy Eng. 139 (1), 011002. doi:10.1115/1.4034909
Ortiz, L., González, J. E., and Lin, W. (2018). Climate change impacts on peak building cooling energy demand in a coastal megacity. Environmental Res. Lett. 13 (9), 094008. doi:10.1088/1748-9326/aad8d0
Ortiz, L., Gamarro, H., Gonzalez, J. E., and McPhearson, T. (2022). Energy burden and air conditioning adoption in New York City under a warming climate. Sustain Cities Soc. 76, 103465. doi:10.1016/j.scs.2021.103465
Osman, M., Saad, M. M., Ouf, M., and Eicker, U. (2024). From buildings to cities: how household demographics shape demand response and energy consumption. Appl. Energy 356, 122359. doi:10.1016/j.apenergy.2023.122359
Parag, Y., and Sovacool, B. K. (2016). Electricity market design for the prosumer era. Nat. Energy 1 (4), 16032. doi:10.1038/nenergy.2016.32
Perera, A. T. D., Coccolo, S., Scartezzini, J.-L., and Mauree, D. (2018). Quantifying the impact of urban climate by extending the boundaries of urban energy system modeling. Appl. Energy 222, 847–860. doi:10.1016/j.apenergy.2018.04.004
Perera, A. T. D., Khayatian, F., Eggimann, S., Orehounig, K., and Halgamuge, S. (2022). Quantifying the climate and human-system-driven uncertainties in energy planning by using GANs. Appl. Energy 328, 120169. doi:10.1016/j.apenergy.2022.120169
Pokhrel, R., and González-Cruz, J. E. (2021). Mitigation options to reduce peak air temperature and air-conditioning demand in the context of a warming climate for a tropical coastal City. ASME J. Eng. Sustain. Build. Cities 2 (2), 021004. doi:10.1115/1.4051160
Pokhrel, R., Ramírez-Beltran, N. D., and González, J. E. (2019). On the assessment of alternatives for building cooling load reductions for a tropical coastal city. Energy Build. 182, 131–143. doi:10.1016/j.enbuild.2018.10.023
Rabbi, M. F., Popp, J., Máté, D., and Kovács, S. (2022). Energy security and energy transition to achieve carbon neutrality. Energies (Basel) 15 (21), 8126. doi:10.3390/en15218126
Razmara, M., Bharati, G. R., Hanover, D., Shahbakhti, M., Paudyal, S., and Robinett, R. D. (2017). Building-to-grid predictive power flow control for demand response and demand flexibility programs. Appl. Energy 203, 128–141. doi:10.1016/j.apenergy.2017.06.040
Reinhart, C. F., and Cerezo Davila, C. (2016). Urban building energy modeling – a review of a nascent field. Build. Environ. 97, 196–202. doi:10.1016/j.buildenv.2015.12.001
Reyna, J. L., and Chester, M. V. (2017). Energy efficiency to reduce residential electricity and natural gas use under climate change. Nat. Commun. 8 (1), 14916. doi:10.1038/ncomms14916
Reyna, J., Wilson, E., Parker, A., Satre-Meloy, A., Egerter, A., and Bianchi, C. (2023). U.S. building stock characterization Study A national typology for decarbonizing U.S. buildings. Golden, CO: National Renewable Energy Laboratory NREL. Available online at: https://www.nrel.gov/docs/fy22osti/83063.pdf (Accessed: December 30, 2023).
Riahi, K., Rao, S., Krey, V., Cho, C., Chirkov, V., Fischer, G., et al. (2011). RCP 8.5—A scenario of comparatively high greenhouse gas emissions. Clim. Change 109 (1–2), 33–57. doi:10.1007/s10584-011-0149-y
Schuur, E. A. G., Abbott, B. W., Commane, R., Ernakovich, J., Euskirchen, E., Hugelius, G., et al. (2022). Permafrost and climate change: carbon cycle feedbacks from the warming Arctic. Annu. Rev. Environ. Resour. 47 (1), 343–371. doi:10.1146/annurev-environ-012220-011847
Sokol, J., Cerezo Davila, C., and Reinhart, C. F. (2017). Validation of a Bayesian-based method for defining residential archetypes in urban building energy models. Energy Build. 134, 11–24. doi:10.1016/j.enbuild.2016.10.050
Tomrukcu, G., and Ashrafian, T. (2024). Climate-resilient building energy efficiency retrofit: evaluating climate change impacts on residential buildings. Energy Build. 316, 114315. doi:10.1016/j.enbuild.2024.114315
Tootkaboni, M. P., Ballarini, I., Zinzi, M., and Corrado, V. (2021). A comparative analysis of different future weather data for building energy performance simulation. Climate 9 (2), 37. doi:10.3390/cli9020037
Trepci, E., Maghelal, P., and Azar, E. (2020). Effect of densification and compactness on urban building energy consumption: case of a Transit-Oriented Development in Dallas, TX. Sustain Cities Soc. 56, 101987. doi:10.1016/j.scs.2019.101987
U.S. Department of Energy (2023). EnergyPlus version 23.1.0 documentation: output details and examples.
U.S. Environmental Protection Agency (EPA) (2021). “Greenhouse gases equivalencies calculator - calculations and references,” in Emissions and generation resource integrated database (eGRID).
U.S. Environmental Protection Agency (EPA) (2024). “NYLI Emission Rates,” emissions and generation resource integrated database (eGRID).
van Vuuren, D. P., Hoogwijk, M., Barker, T., Riahi, K., Boeters, S., Chateau, J., et al. (2009). Comparison of top-down and bottom-up estimates of sectoral and regional greenhouse gas emission reduction potentials. Energy Policy 37 (12), 5125–5139. doi:10.1016/j.enpol.2009.07.024
Vázquez-Canteli, J. R., and Nagy, Z. (2019). Reinforcement learning for demand response: a review of algorithms and modeling techniques. Appl. Energy 235, 1072–1089. doi:10.1016/j.apenergy.2018.11.002
Wang, C., Song, J., Shi, D., Reyna, J. L., Horsey, H., Feron, S., et al. (2023). Impacts of climate change, population growth, and power sector decarbonization on urban building energy use. Nat. Commun. 14 (1), 6434. doi:10.1038/s41467-023-41458-5
Xiong, J., Guo, S., Wu, Y., Yan, D., Xiao, C., and Lu, X. (2023). Predicting the response of heating and cooling demands of residential buildings with various thermal performances in China to climate change. Energy 269, 126789. doi:10.1016/j.energy.2023.126789
Xu, X., González, J. E., Shen, S., Miao, S., and Dou, J. (2018). Impacts of urbanization and air pollution on building energy demands — beijing case study. Appl. Energy 225, 98–109. doi:10.1016/j.apenergy.2018.04.120
Zhang, L., Plathottam, S., Reyna, J., Merket, N., Sayers, K., Yang, X., et al. (2021). High-resolution hourly surrogate modeling framework for physics-based large-scale building stock modeling. Sustain Cities Soc. 75, 103292. doi:10.1016/j.scs.2021.103292
Keywords: urban building energy modeling, high-performance computing, climate change impact, building electrification, grid decarbonization, future weather scenarios, urban planning
Citation: Jalilian R and Kamel E (2025) Urban-scale building energy modeling under future climate scenarios: a scalable workflow and insights from Nassau County, New York. Front. Energy Res. 13:1683787. doi: 10.3389/fenrg.2025.1683787
Received: 11 August 2025; Accepted: 15 October 2025;
Published: 30 October 2025.
Edited by:
Usama Perwez, National University of Sciences and Technology (NUST), PakistanReviewed by:
Jorge Gonzalez-Cruz, University at Albany, United StatesTheresa Boiger, University of Graz, Austria
Copyright © 2025 Jalilian and Kamel. This is an open-access article distributed under the terms of the Creative Commons Attribution License (CC BY). The use, distribution or reproduction in other forums is permitted, provided the original author(s) and the copyright owner(s) are credited and that the original publication in this journal is cited, in accordance with accepted academic practice. No use, distribution or reproduction is permitted which does not comply with these terms.
*Correspondence: Ramin Jalilian, amFsaWxpYW5AbnlpdC5lZHU=